
Planning, Buying and Evaluating Digital Media in a Cross Media World February 7, 2012.
40
Planning, Buying and Evaluating Digital Media in a Cross Media World February 7, 2012
-
Upload
nickolas-benson -
Category
Documents
-
view
216 -
download
2
Transcript of Planning, Buying and Evaluating Digital Media in a Cross Media World February 7, 2012.
Planning, Buying and Evaluating Digital Media in a
Cross Media World
February 7, 2012

Conversation Flow
ANA, 4A’s, IAB Making Measurement Make Sense
Q&A/Discussion
Reaching the Elusive Affluents: Affluent Consumers in a Digital World
Q&A/Discussion
2

What is Making Measurement Make Sense?
Making Measurement Make Sense (3MS) is an ecosystem-wide initiative to propose standards for metrics and advertising “currency” that will enhance evaluation of digital media and facilitate cross-platform comparison for brand marketing
Key objectives of the 3MS initiative are the following:
•Determining the right metrics and solutions
•Driving industry consensus around the solutions
•Establishing a measurement governance model

Who is involved with 3MS?3MS is a joint undertaking of the IAB, the ANA and the 4A’s
These organizations engaged Bain & Company and MediaLink to facilitate and manage the initiative
The Newspaper Association of America (NAA) and the Online Publishers Association (OPA) also joined the initiative as supporters
Nearly 40 industry executives were a part of our steering committee and working teams. In addition, we engaged over 150+ other industry participants across the ecosystem

Why did we embark upon the journey?
Consumers embrace digital media in droves
Business and transactions lag behind consumers
Digital media need a consistent, transparent supply chain
Digital media need to be part of a cross media marketing ecosystem
The ecosystem needs a measurement policy voice
Business leaders and functional experts need forums and mechanisms for change management
Fa
cil
ita
te c
ros
s-p
latf
orm
co
mp
ari
so
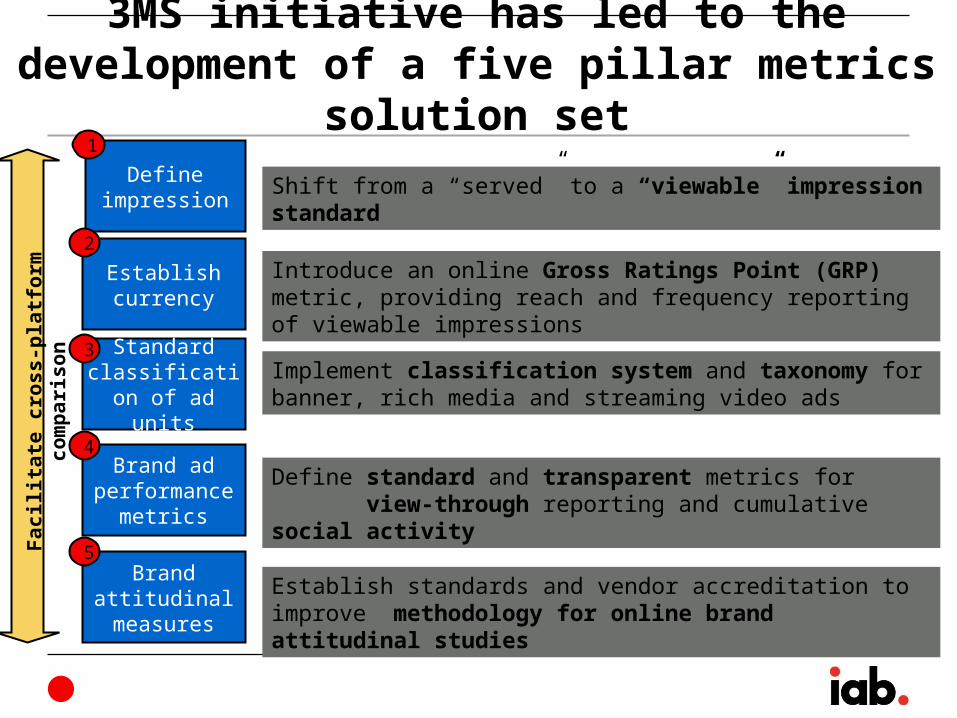
n3MS initiative has led to the
development of a five pillar metrics solution set
Brand attitudinal measures
5
Standard classification of
ad units
3
Define impression
1
Establish currency
2
Brand ad performance
metrics
4
Shift from a “served” to a “viewable” impression standard
Implement classification system and taxonomy for banner, rich media and streaming video ads
Define standard and transparent metrics for view-through reporting and cumulative social activity
Establish standards and vendor accreditation to improve methodology for online brand attitudinal studies
Introduce an online Gross Ratings Point (GRP) metric, providing reach and frequency reporting of viewable impressions

3MS prioritized view-through as the first standard brand ad
performance metric
Number of days after ad view that visit
to brand site is counted
• Data indicates that majority of view-throughs occur within 7 days
• 3 days is analogous to TV’s C3 rating system
Number of ad views attributed for a
view-through
• All ads contribute to brand building and a user’s decision to eventually go to brand or other target site
Percent of view-through attributed to
different ad views
• Attribution standards to be further tested
Last ad viewed All ads
2
3
Parameter to be defined Range of options and suggested solutions
All adsreceive full attribution
Each ad receives weighted
fractional attribution
1
1 day 90 days
Rationale
1) Standardize key parameters of this metric (see below)2) Make this metric more transparent and credible by introducing
accreditation for the reporting of this metric
Goals of 3MS for Brand ad performance metrics
3 days and 7 days
1st
2nd
3rd
Each adreceives equal
fractional attribution
4
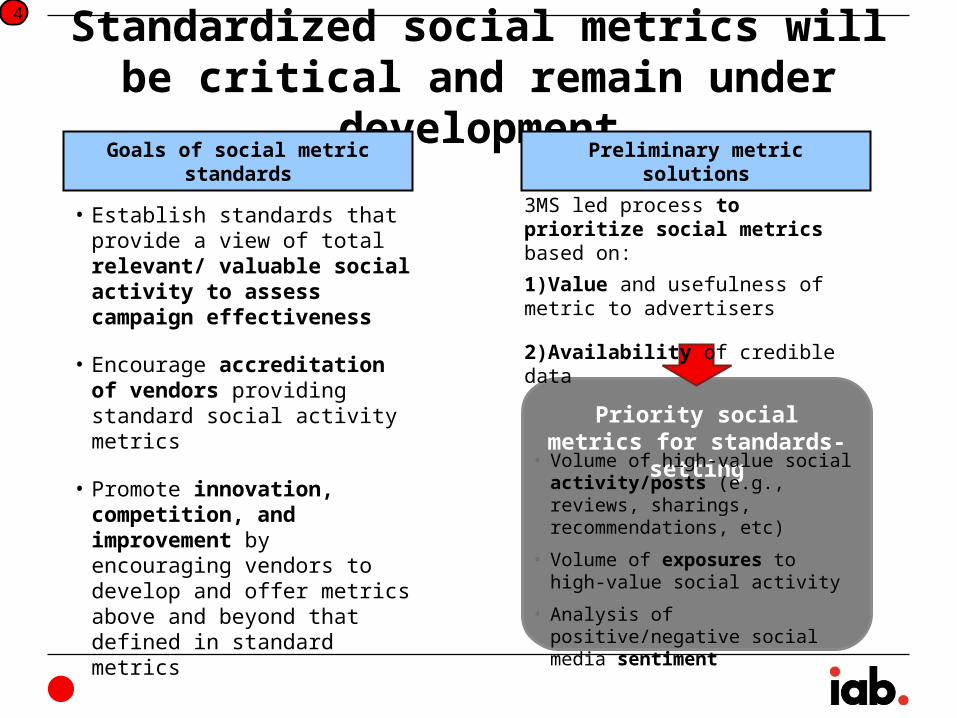
Priority social metrics for standards-setting
Standardized social metrics will be critical and remain under
developmentPreliminary metric solutionsGoals of social metric standards
• Establish standards that provide a view of total relevant/ valuable social activity to assess campaign effectiveness
• Encourage accreditation of vendors providing standard social activity metrics
• Promote innovation, competition, and improvement by encouraging vendors to develop and offer metrics above and beyond that defined in standard metrics
4
• Volume of high-value social activity/posts (e.g., reviews, sharings, recommendations, etc)
• Volume of exposures to high-value social activity
• Analysis of positive/negative social media sentiment
3MS led process to prioritize social metrics based on:
1)Value and usefulness of metric to advertisers
2)Availability of credible data

• Improve response rates
• Shift to more accurate and relevant control groups
• Reduce use of statistical weighting adjustments
• Enhance ability to compare metrics with other media
• Pursue accreditation of vendors and sources of data via independent industry body
Accreditation and improved methodologies will boost confidence in
attitudinal studiesAccredited attitudinal metrics vendors will
need to address key requirementsOptions for improvements should follow in accordance with
IAB Best Practices
Improve existing methodology
Adopt new survey formats
Incorporate demographic and
cookie data
Switch to panel based surveys
a
c
b
d
• Improved user-intercept analysis conducted by 3rd party vendors
• Variations of current user-intercept analysis
• Surveys delivered to people who have seen an ad (identified via cookies)
• Surveys delivered to panel members, with direct tracking of users
5

Ongoing development of standards body working with the Media Rating
Council (MRC)
• A central governing body will be critical for implementing the solutions developed through the 3MS initiative, while continuing standards setting activities into the future
• Governance body should have cross platform mandate and balance buy and sell side representation
• Leveraging and expanding an existing body (vs. building de novo) has highest likelihood of success, with infrastructure, processes and industry credibility already in place
• Lead measurement change management
3MS recommends building off the existing MRC structure
Key considerations for ongoing governance structure
• Right constituency, with cross-platform member base including publishers, agencies, associations (and some advertisers)
• Expertise from accrediting and auditing to transition into industry policy-making and priorities-setting role
• Trusted and objective senior leadership
• Low-cost operating model

3MS timeline and outcomes
Q2Q1 Q2 Q3 Q4 Q1 Q3 Q4
20122011
Phase 1 Phase 2 Go-forward
OU
TC
OM
ES
• 3MS solutions delivered and communicated to ecosystem at-large
• Governance structure and roles developed and detailed
• Overall implementation/ change management plan and timelines developed
• 3MS outreach for key stakeholders
• Initial viewable impression pilot design and recruitment completed
• MRC integrated into 3MS process
• Viewable impression pilot for display ads launched in marketplace
• Video GRP standards and requirements developed
• Ad unit taxonomy/classification system in testing
• Phase 2 initiatives (e.g. viewable, GRP and classification) transitioned from pilot to soft and full launch
• Standards for remaining two solutions developed (ad performance and attitudinal metrics)

Perspective
Comments?Questions?Concerns?
12

IAB Affluent Research OverviewThe Interactive Advertising Bureau partnered with
Ipsos Mendelsohn to conduct research and develop insights on Affluent consumers in today’s digital world
Rationale●Digital media continue to grow users and opportunities to connect with consumers ●The 58 million American Affluents are important to economic recovery ●Need to understand both how much and how Affluents use digital media
Key Findings●Affluents embrace technology and digital media including advertising ●The hardest to reach in TV and radio are the most reachable in digital media●Affluents tend to be at least as receptive and responsive as the less affluent
13

Practical Implications
Brands that need better reach and composition of Affluents should invest in digital media
Improve ad creative
Make ads relevant while respecting Affluents’ privacy and intelligence
Expect them to react, to share information
Learn about how interpersonal influence works for your category and brand among the Affluents
14

Methodology & Approach
15
• Conducted online February 22-28, 2011
• National sample of online adults 18+• Weighted / balanced to U.S. Census data
• 2,088 respondents interviewed in total
• 1,063 with HHI <$100K• 1,025 with HHI $100K+
(“Affluent”)• Unless otherwise noted, data in this report are from HHI $100K+ group
Methodology Overview
Survey Content
• Frequency of seeing digital ads (by type) • Actions taken based on digital ad exposure
• Perceived relevance and trustworthiness of messages from digital advertising
• Focus vs. multi-tasking during media activities
• Attitudes toward advertising, privacy, etc.

The Traditional Media Paradigm: Affluent Consumers More Challenging to
Reach
16Sources: The Mendelsohn Affluent Survey 2010; Nielsen; Radar/Arbitron.
17.6
7.5
34
16
Watching TV Listening to radio
Affluent
Generalpopulation
Average # of hours in a typical week

The Digital Media Paradigm: Affluent Consumers Are Heavier
Users
98%
79%
% with Internet access
Affluent
Generalpopulation
26.2
21.7
Average hours online weekly
Sources: The Mendelsohn Affluent Survey 2010; Pew Research Center; Ipsos OTX MediaCT17
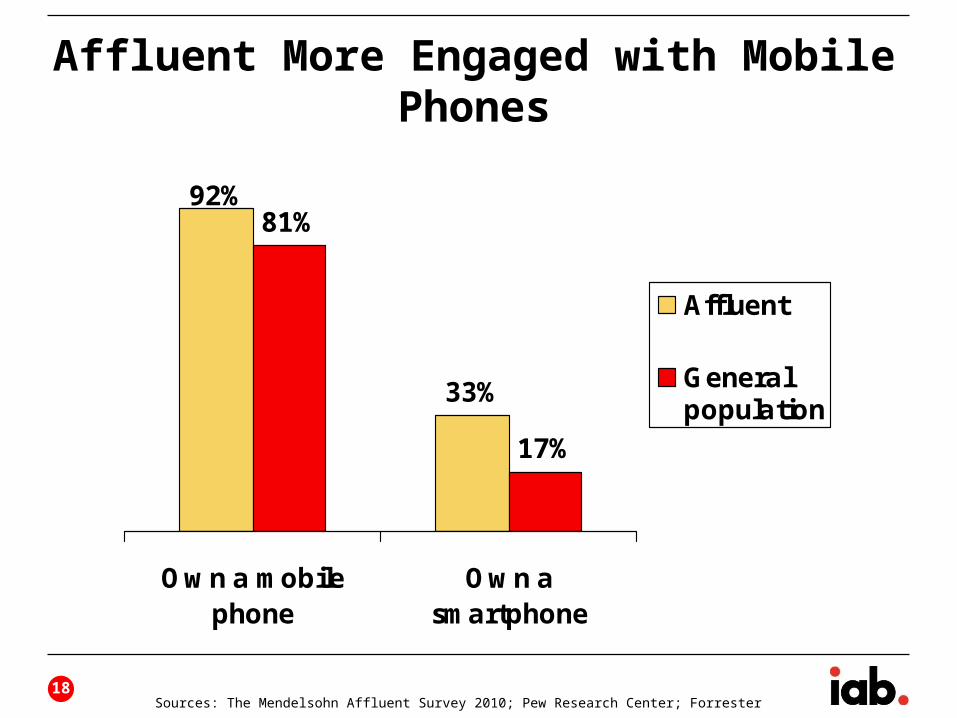
Affluent More Engaged with Mobile Phones
92%
33%
81%
17%
Own a mobilephone
Own asmartphone
Affluent
Generalpopulation
Sources: The Mendelsohn Affluent Survey 2010; Pew Research Center; Forrester18

E-Reader & Tablet Ownership Have Doubled
0
5
10
15
20
25
30
Sept'10
Oct '10 Nov'10
Dec'10
Jan '11 Feb '11 March'11
April'11
May'11
June'11
July '11
24%Own e-reader
17%Own tablet
12%
8%
Among $100K+ HHI
Source: Mendelsohn Affluent Barometer. Data shown are three month moving averages19

79%
59%
58%
54%
47%
33%
26%
intertwined with technology
more complicated
more stressful
about finding ways to do more with less
more fun
easier
more isolated
For Affluents, Life Is Increasingly Tech-Focused, Connected,
ComplexOver the past 10 years, my life has
become…Strongly/ somewhat
agree
20Source: Mendelsohn Affluent Barometer, January 2011

Digital Advertising in Affluent Lives
21

Exposure to Digital Ads Nearly Universal
88%
80%
77%
69%
65%
59%
42%
Any of the following
Web/ banner ad
Search ad/ sponsoredlisting
Email ad
Video ad
Social media ad
Mobile/ smartphone ad
% reporting exposure to each type of ad in past 7 days
5-of-6 ad types
measured seen by a majority
*
**
Average # weekly: 18.5
22* <$100K HHI: 73% ** <$100K HHI: 70%Source: IAB Custom Research Conducted by Ipsos/Mendelsohn

Most Affluents Take Action on Digital Ads
59%
45%
38%
28%
18%
17%
16%
11%
9%
8%
Done any of the following
Clicked on the ad
Visited the advertiser’s website
Searched for info about theproduct/service online
Became a “fan” or “liked” onsocial networking website
Went to retail location tosee/purchase product /service
Purchased the product orservice online
Shared ad via email, Twitter,social networking site
Sent an email or text messageto the advertiser
Called the advertiser to getmore information
Actions taken in past 6 months as a
result of any ad type (among those
recalling digital ads)
23Source: IAB Custom Research Conducted by Ipsos/Mendelsohn

draft
55%
51%
46%
… learned about newproducts
…learned about companies Iwas unaware of before
… visited web sites I wouldnot have visited otherwise
% definitely / tend to agree: “Because of advertising I have seen online, I
have…”
*
* <$100K HHI: 49%
Digital Ads Have Considerable Impact on Awareness
24Source: IAB Custom Research Conducted by Ipsos/Mendelsohn

Wide Range of Opinions about Digital Advertising
●“A great design or a topic of personal interest -- either of those qualifiers-- might get me to pay attention”
●‘”Generally positive, except for intrusive flash ads, ads with sound, overlay ads (the new popup), and ads I'm forced to look at or watch for every video or page visited. I'm ok with ads as long as I'm not bombarded with them.”
●“I believe they serve a purpose of allowing the websites to make money so they don't have to charge”
●“Am generally disappointed by online ads. They typically aren't relevant or are misleading.”
In your own words, please describe your experiences with online ads.
25Source: IAB Custom Research Conducted by Ipsos/Mendelsohn

Video, Email, Search & Banner Ads Most Likely to Inspire Action
59%
41%
41%
37%
37%
28%
17%
Any digital ad
Video ad
Search ad/ sponsored listing
Email ad
Web/banner ad
Social media ad
Mobile/ smart-phone ad
% taking action on digital ads (by ad type)
Among those seeing each type of ad 26
Source: IAB Custom Research Conducted by Ipsos/Mendelsohn
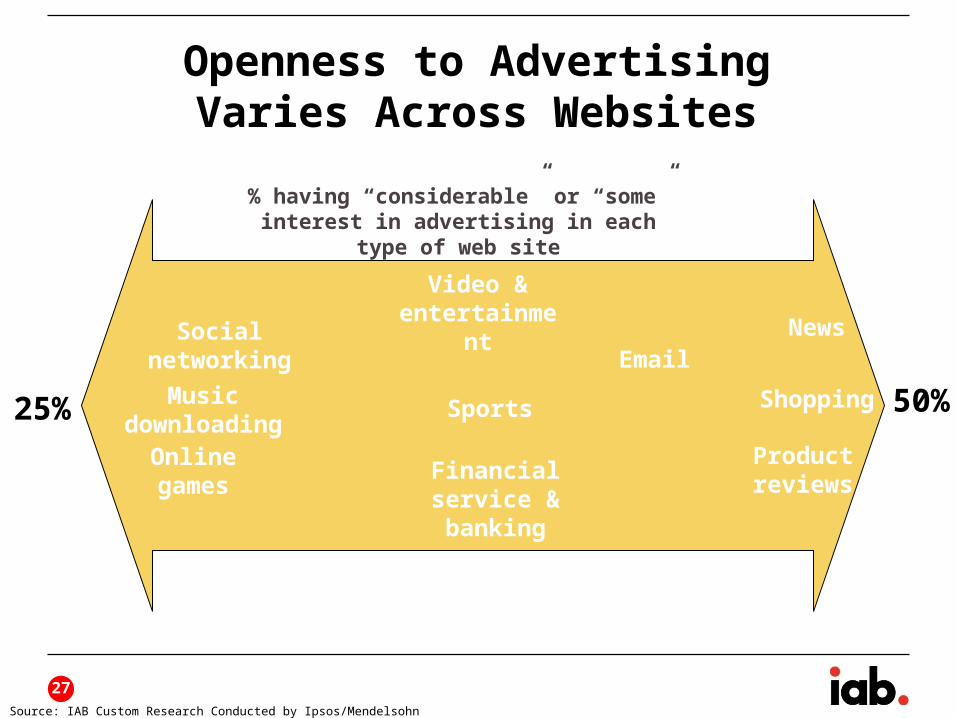
Openness to Advertising Varies Across Websites
News
Shopping
Product reviews
Video & entertainment
Sports
Financial service & banking
50%25%
Social networking
Music downloading
Online games
% having “considerable” or “some” interest in advertising in each type of web site
27Source: IAB Custom Research Conducted by Ipsos/Mendelsohn

What do Affluent consumers want from digital
advertising?
28

Ads relevant to activities I happen to be thinking about, whatever website I happen to be on (e.g., car ads if I happen to be shopping for a car; airline ads if
I am planning a trip in the near future)
37%
Ads relevant to the content of the website I am on currently 34%
Ads relevant to me based on where I live or where I am 30%
Ads relevant to me based on my age, gender, or income 27%
Ads that are funny and unexpected 27%
Ads made with video or animation 13%
Ads that are interactive in some way (e.g., with a game, store locator, or other functionality built into
them)13%
Ads that I can expand or change size 5%
Enhancing Relevance Would Enhance Interest
29
Which types of ads are you most likely to pay attention to when using the Internet?
*
* <$100K HHI: 32%Source: IAB Custom Research Conducted by Ipsos/Mendelsohn
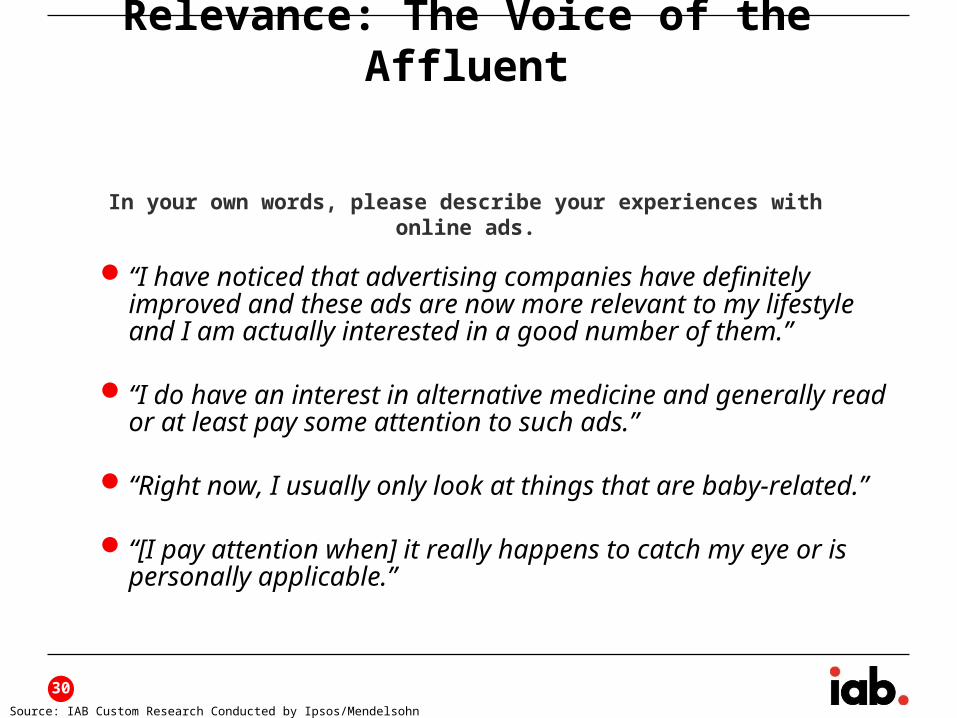
Relevance: The Voice of the Affluent
“I have noticed that advertising companies have definitely improved and these ads are now more relevant to my lifestyle and I am actually interested in a good number of them.”
“I do have an interest in alternative medicine and generally read or at least pay some attention to such ads.”
“Right now, I usually only look at things that are baby-related.”
“[I pay attention when] it really happens to catch my eye or is personally applicable.”
In your own words, please describe your experiences with online ads.
30Source: IAB Custom Research Conducted by Ipsos/Mendelsohn

Consumers Calling for Ads that Are Relevant, Reliable, &
“Seductive”
“Seduce me instead of groping me--I don't want stuff forced on me, though I often enjoy ads. Show me something funny, uplifting, beautiful, intriguing. Invite me to linger, don't interrupt me with flashing lights and hard-sell inanity.”
“Make them less intrusive to the user experience and less intensive to users devices. Mobile devices and netbooks can get bogged down by fancy flash ads or other forms of memory and/or CPU heavy ads.”
In your own words, please describe how you feel online advertising could be improved.
31Source: IAB Custom Research Conducted by Ipsos/Mendelsohn
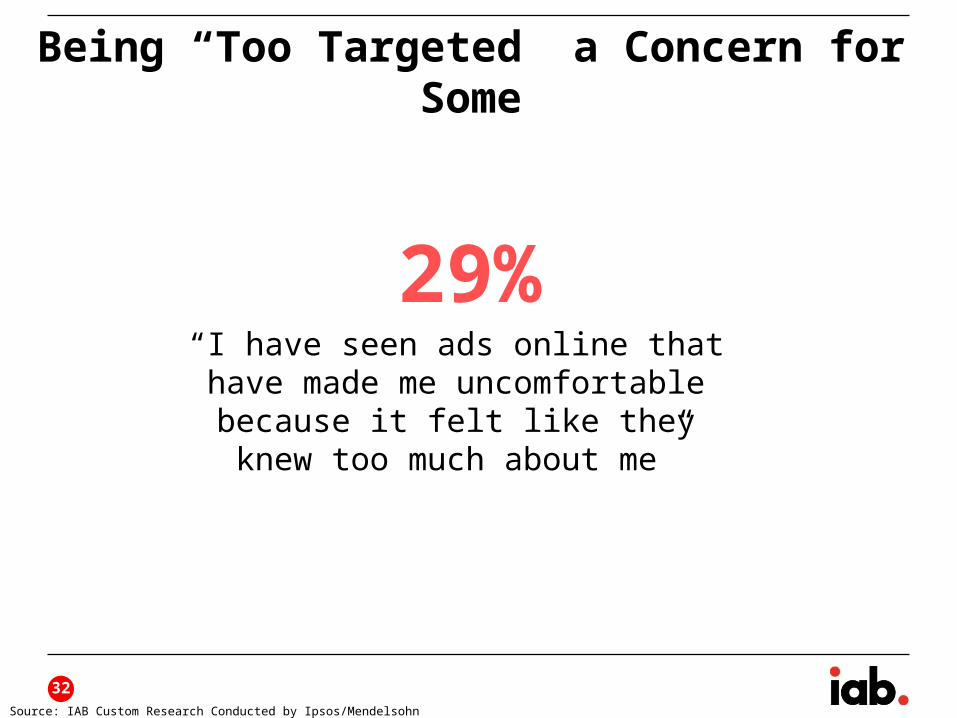
Being “Too Targeted” a Concern for Some
32
“I have seen ads online that have made me uncomfortable because it felt like
they knew too much about me”
29%
Source: IAB Custom Research Conducted by Ipsos/Mendelsohn

Ambivalence About Privacy
16%Concerns
about online privacy are overblown
23%I don’t really
know the best ways to protect
my privacy online
33
I am usually willing to share
some information about myself
online so that I can get a more
customized online experience
32%*
* <$100K HHI: 23%Source: IAB Custom Research Conducted by Ipsos/Mendelsohn

Summing Up
Affluents living tech-infused lifestyles●Essentially universal Internet access●5 more hours online weekly●Early adopters of smartphones & tablets●Under-index on TV & radio use
Digital advertising…●Has spurred most Affluents to take action●Shapes behavior beyond clicking●Significantly shapes awareness
34

35© 2012 Ipsos Mendelsohn. All rights reserved.
State of the Affluent Market
December 2011 Update

36© 2012 Ipsos Mendelsohn. All rights reserved.
Affluents’ Expectations Rising About Life in 2012
2011 was a good year for…
I believe 2012 will be a good
year for… Gap
me personally 56% 64% +8
my career/finances 38% 54% +16
my family 56% 65% +9
the U.S. economy 8% 30% +22
America as a whole 11% 31% +20
Expectations up across the board
Over half expect a good 2012 on “personal”
dimensions
Less than one-third expect a good 2012 for the economy, America
Source: Ipsos Mendelsohn Affluent Barometer, December 2011

37© 2012 Ipsos Mendelsohn. All rights reserved.
Still, Most Affluents Not Expecting Full Recovery in 2012
Impact of recession on…
The recession will end…Me & my
familyMy
company*U.S. as a
whole
Already over 29% 25% 7%
In 2012 14% 14% 11%
In 2013 13% 12% 22%
In 2014 or later 17% 19% 31%
It really won't end 7% 11% 13%
I don't know 20% 20% 16%
Over half expecting U.S. recovery in
2013 or later
Only three-in-ten feel it’s personally over
*among those employedSource: Ipsos Mendelsohn Affluent Barometer, December 2011

38© 2012 Ipsos Mendelsohn. All rights reserved.
80% of Affluents Have Specific Goals for 2012
80%
41%
40%
33%
31%
18%
16%
16%
14%
9%
2%
2%
11%
Any
Save more money
Lose weight
Spend more time with my family
Spend less money
Take a 'special' vacation
Invest more
Look for a new job
Give to charity more
Treat myself more often
Buy a luxury gift for others
Buy a luxury gift for self
Other
The start of a New Year is often a time when people make resolutions or plans for what they would like to accomplish in the coming year. Which of
the following are among your goals or resolutions for 2012?
Source: Ipsos Mendelsohn Affluent Barometer, December 2011

39© 2012 Ipsos Mendelsohn. All rights reserved.
“Hope to plan better for our long term future. Reduce our debt, make home improvements, be healthier.”
“I hope to increase our savings each month and allow us to have extra money that we can spend if we need to.”
“I hope to earn a good living, share with those in need, and adopt a more healthy lifestyle.”
Health, Money & Family Top the List of 2012 Affluent Goals
In your own words, please tell us about any resolutions or goals you hope to achieve in 2012.
Source: Ipsos Mendelsohn Affluent Barometer, December 2011

40© 2012 Ipsos Mendelsohn. All rights reserved.
Hunger for Content and Connectivity Grows
* Data shown among Affluent heads of house; figures among total adults in 2011 are comparable.
2010* 2011*
Use Internet 98% 98%
Average # of hours use Internet per week 25.3 30.3
Own a…
smartphone 33% 43%
e-reader 5% 14%
tablet 2% 9%
© 2011 Ipsos Mendelsohn. All rights reserved.
Source: Ipsos Mendelsohn Affluent Survey


