Forecasting flight traffic at Eurocontrol in unprecedented times business analytics

LPA – www.lpa.com
Planning Analytics – UpdatesCase Study – Demand Forecasting, Customer
Profitability
Brendan Austin, Director of Financial Performance Management

LPA – www.lpa.com
Planning Analytics – What’s New (Released)
• As of PA 2.0.9.2, TM1 Web is no longer included in the release, but rather still available in a separate installer “IBM Planning Analytics Spreadsheet Services Installer”
• In PA 2.0.9 – dynamic shaped and images are supported – images will change when the value of a cell changes (logos, pictures, flags, products images, etc.)
2

LPA – www.lpa.com
Planning Analytics – What’s New (Released)
• In PA 2.0.9, websheets open on the tab that was active when the websheet was saved
• TM1 Operations Console has been deprecated – IBM Planning Analytics Administration is now used to monitor databases
3

LPA – www.lpa.com
Planning Analytics – What’s Coming ***• Big changes are coming to Planning Analytics in 4th Quarter !!!!
• Release date is scheduled for October 15th
*** Content showed here is still in final stages of development
4

LPA – www.lpa.com
Planning Analytics – Coming Soon

LPA – www.lpa.com
PAW – New Layout
• A new unified experience for all reporting,
analytics, modeling and administration
• Content can now be organized
• Users can track favorites and recently
used items
• Books and content can now display
images

LPA – www.lpa.com
PAW – Navigation and Welcome• Welcome Banner (can
be turned on or off)
• Quick launch areas for
Applications and Plans
(Workflow), Reports,
Data and Models and
Admin
• Navigation toolbar on
left allows users to jump
to public and private
content

LPA – www.lpa.com
Workflow? Yes, now will be available in PAW• Old (Contributor based) workflow had
usability issues:
• Workflow was solely based and
centered on an organizational
hierarchy
• Value was solely in submission,
review and approval of data
• Using a single dimension to govern
assignments was in realistic
• Solution was very security heavy on
server side
LPA – www.lpa.com

LPA – www.lpa.com
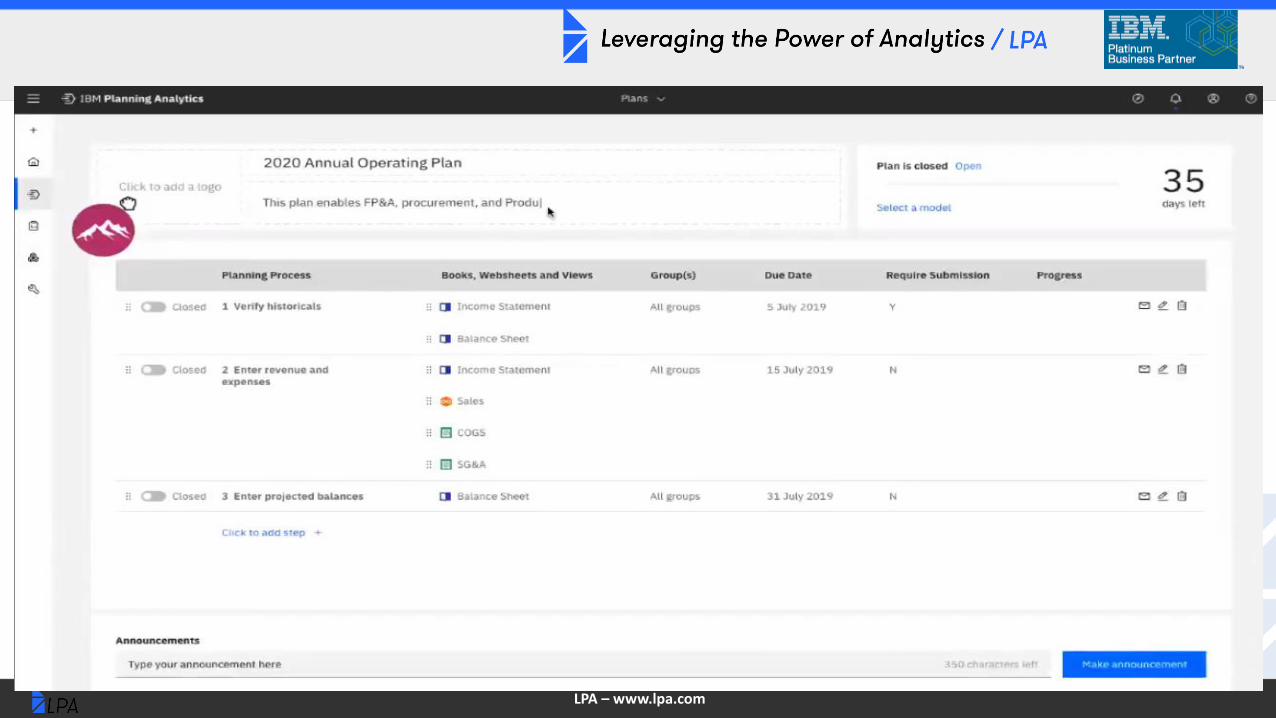
New and Improved Workflow Overview• Allows users to add Views, PAW Books, Worksheets into Planning
Sprints
• Planning Sprints can be opened and closed individually without disabling the entire plan
• Each section can have a different deadline and submission requirement
• Progress is measured for each sprint individually
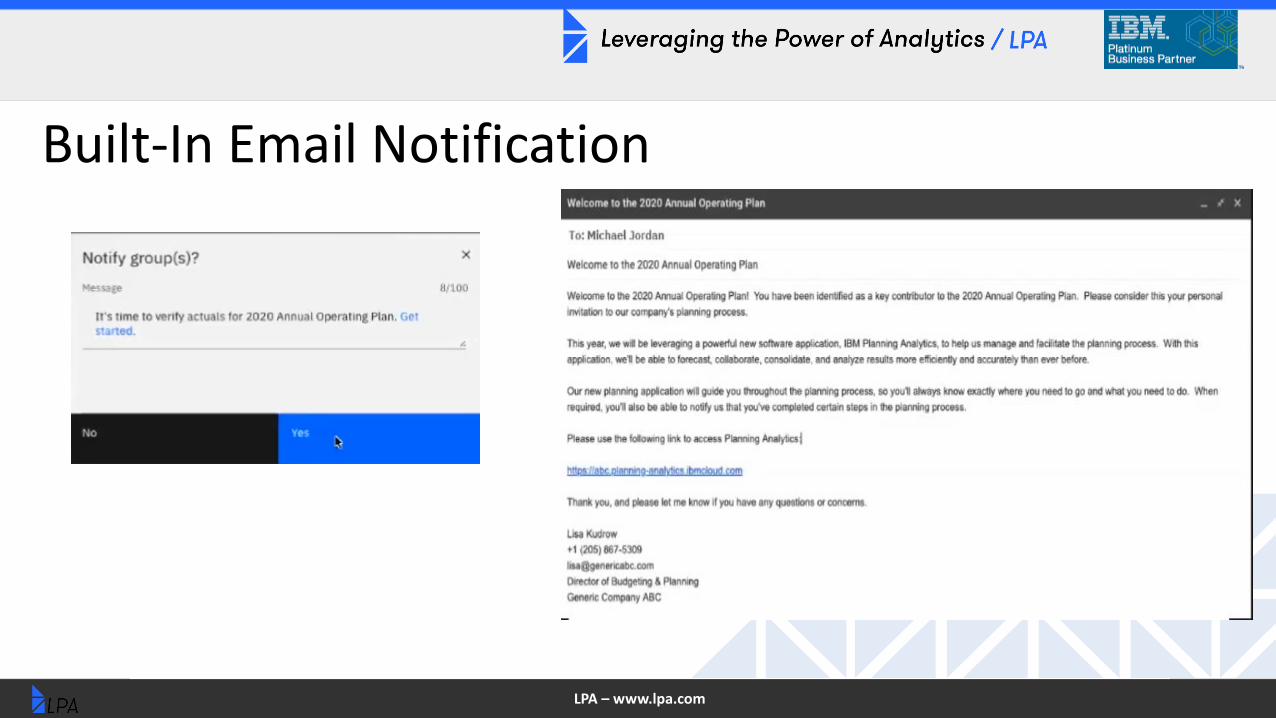
• Integration for email messaging

LPA – www.lpa.com
• “Date picker” allows user to choose dates based on an actual
calendar
• Announcement area can optionally send out email to all
users involved in the plan
LPA – www.lpa.com
Built-In Email Notification

LPA – www.lpa.com
What the Plan Participants See

LPA – www.lpa.com
New Navigation Screen - Content

LPA – www.lpa.com
• Built in filters search content as well as titles of published items
• Items can be marked as favorites and will be stored in a shortcut area

LPA – www.lpa.com
PAW – Display Options

LPA – www.lpa.com
PAW – New Formatting Options
• New alignment and positioning tools
• Can align and group multiple objects
• Sheet and tab options to mimic presentation
mode
• Optimize screen size, ratio and zoom

LPA – www.lpa.com
PAW Formatting Options
LPA – www.lpa.com
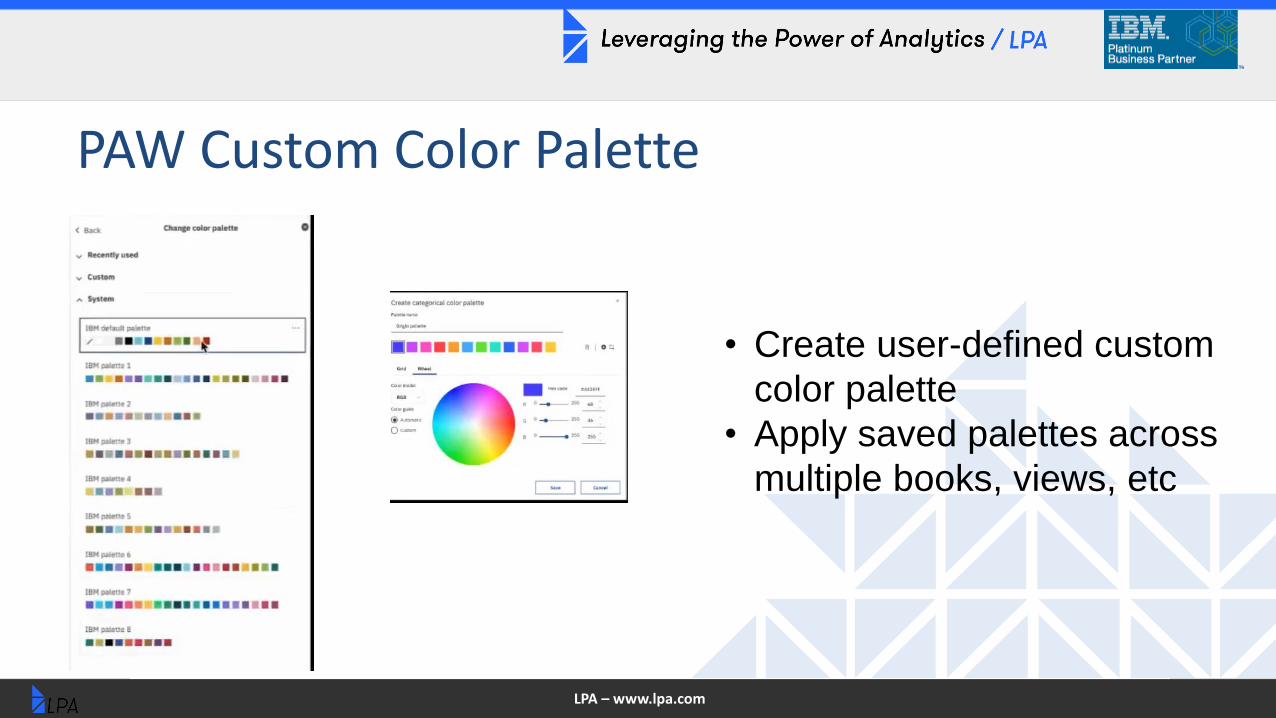
PAW Custom Color Palette
• Create user-defined custom
color palette
• Apply saved palettes across
multiple books, views, etc

LPA – www.lpa.com
Charting –Format Options
• Report developers can now customize report axis,
labels, colors and scale all through the PAW
interface
• Additional options include font, font size and the
ability to put values on the chart itself

LPA – www.lpa.com
Chart Improvements
• Waterfall,
boxplot, muti-line
column
• Data is assigned
to bars, sections
• Can show data
directly in chart

LPA – www.lpa.com
PAW New Chart Editor

LPA – www.lpa.com
Create Custom Axis Lines
• New Capabilities:
• Change axis scale
• Specify maximum and minimum axis values
• Change color palette and font specifics

LPA – www.lpa.com
Forecasting – How do you produce an accurate prediction of the future?
24

LPA – www.lpa.com
Taking PA to the Next Level – Adding AIWhy AI?
• Accuracy – Statistical models based on
historical data can improve the accuracy
of predictions ofes forecasted periods
• Consistency – Not dependent solely on
the business knowledge and history of the
forecaster
• Timeliness – Forecasts can be generated
(and re-generated as business conditions
change) quickly

LPA – www.lpa.com
AI Forecasting in Planning Analytics• Time-series based
predictions
• Minimal data movement –
can embed predictions in
existing scenarios
• Guide people through
advanced forecasting
operations (statistical
modeling)
• PA model analyzes best
outcome from multiple
time series methods

LPA – www.lpa.com
Forecast Starting With Actuals

LPA – www.lpa.com
Set Up Prediction

LPA – www.lpa.com
Statistical Prediction Results and Confidence Interval
LPA – www.lpa.com
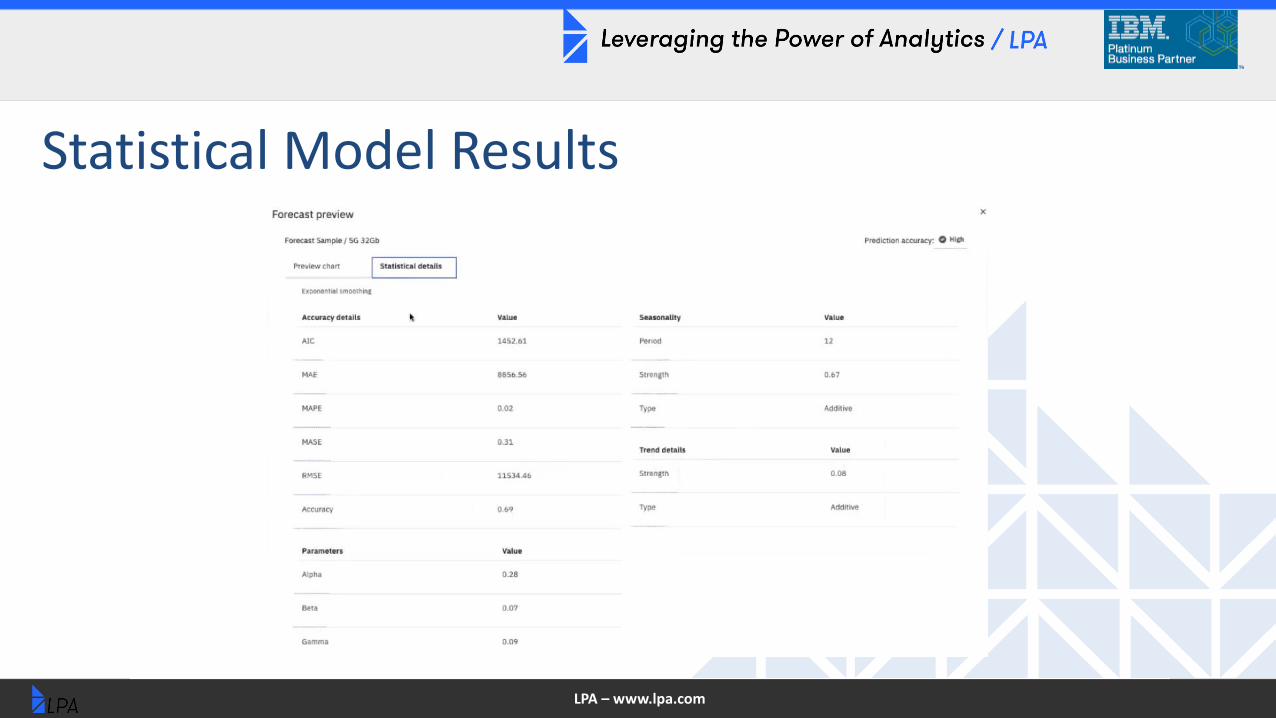
Statistical Model Results

LPA – www.lpa.com

LPA – www.lpa.com
Statistical Model - Details

LPA – www.lpa.com
LPA – www.lpa.com
How Do I Get This New Version?
Cloud Customers:
October 15th * - Administrator can select “Preview” in PAW After
testing, Administrator can upgrade PAW, but cannot revert back to
classic version once upgraded
On-premise customers:
October 15th * - Download new PAW version and install

LPA – www.lpa.com
Cloud Customer – Preview and Upgrade

LPA – www.lpa.com
Testing in Preview Mode

LPA – www.lpa.com
Case Study• Subject company is a worldwide manufacturer and distributor of consumer
and professional products. Their supply chain network services major retailers and pro distribution channels throughout the world.
LPA – www.lpa.com
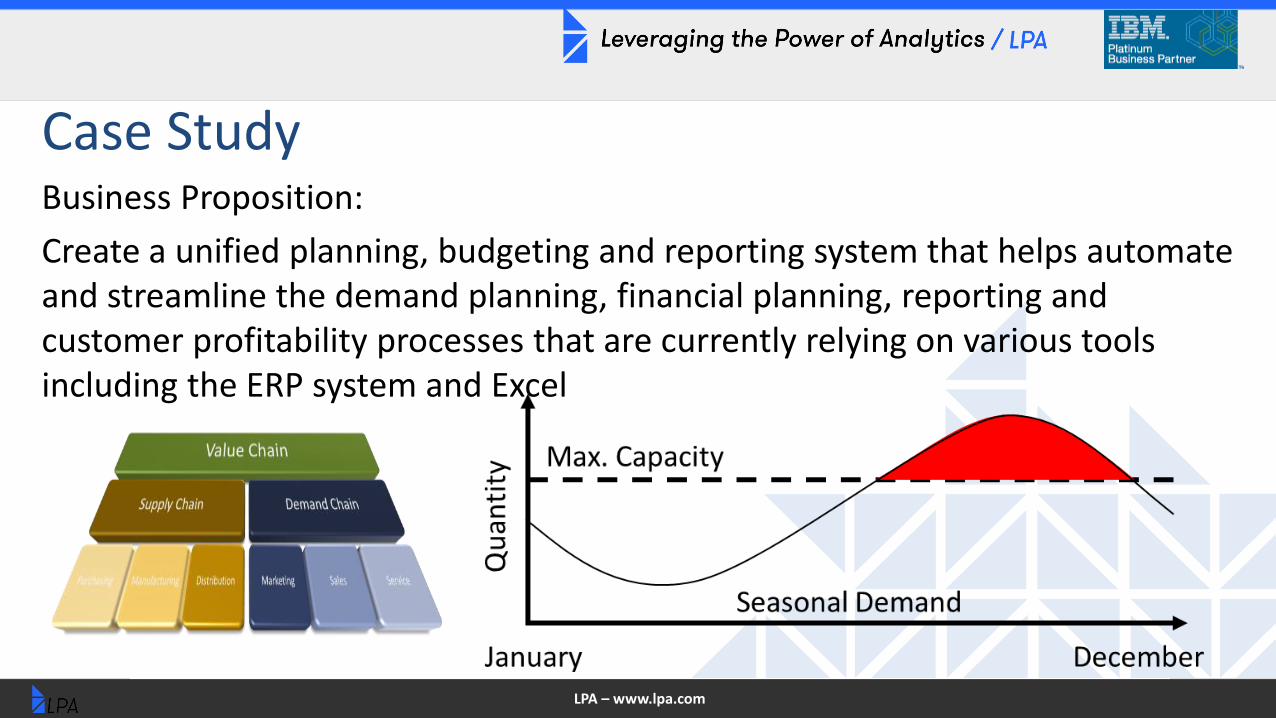
Case StudyBusiness Proposition:
Create a unified planning, budgeting and reporting system that helps automate and streamline the demand planning, financial planning, reporting and customer profitability processes that are currently relying on various tools including the ERP system and Excel

LPA – www.lpa.com
The Issues At Hand• Data Integrity
• Data volumes –
– SKUs – 33,000
– Customers – 60,000
– Cost Centers – 3,000
– Days – 3,000
• Level of Granularity
• Allocation Rules
• Existing Model was error prone (Excel/Cognos) and VERY Manual
39

LPA – www.lpa.com
The Business Process
40
Historical Sales Actuals By SKU, Ship To, Day
Demand Forecast By SKU, Forecast Customer, Day
Units, Revenue By SKU, Allocated to Ship To – Forecast and Budget
Financial Reporting
Customer Profitability By SKU, Ship ToForecast, Budget
Actuals

LPA – www.lpa.com
The Solution• Planning Analytics Cloud Instance – utilizing PAW and PAX
• Demand Forecasting – Entered at a SKU/Month/Forecast Customer level
– Spreading done to weeks/days
– Calculated forecast based on prior year actuals and seasonality
– Pricing flexibility based on month/SKU/distribution point/Customer
– Ability to drill down to fine level of detail (Actuals and Forecast
41

LPA – www.lpa.com
The Solution• Customer Profitability
– By SKU/Customer Ship To Location
– Allocations of SG&A, standard costs by SKU, freight analysis
– Scenario versioning (Actual, Forecast, Budget, Quarterly Forecasts)
• Financial Reporting
– Currency Conversion with multiple reporting currencies
– Statistics (Headcount, production stats)
– World-wide consolidation
42
LPA – www.lpa.com 43
• Split up development into
small pieces
• Change Management
• Data Integrity – agree on
best source of data
• Use of attributes to drive
templates and defaults
• Utilization Cognos
Command Center

LPA – www.lpa.com
LPA Offer• Existing cloud customers - we will spend up to 2
hours evaluating your existing cloud environment to determine what capabilities may be added to your environment and how to ensure it is successful – this session will be at no cost to you
• Existing on-premise customers – up to 2 hours spent evaluating upgrade readiness or readiness for cloud deployment
• Please contact us at [email protected] for additional information or to schedule a follow up call
44

LPA – www.lpa.com 45

LPA – www.lpa.com
How can LPA help?• Upgrade and Migration Services
– Upgrade your TM1 9.x, 10.x, Planning Analytics 11.x environments to latest Planning Analytics release
• Install and configure
• Upgrade PAX and PAW environments
• Upgrade and Test Content
• Go Live Support
– Migrate your TM1/Planning Analytics environments to Planning Analytics - cloud
• Managed Services
– Provide how-to and development support
– Manage Planning Analytics on your behalf
• Health Checks
– Evaluate your Planning Analytics environment• Provide feedback for tuning server performance
• Assistance with Rules and Feeders
• Review Model design and configuration
• Analyze server configuration (on-premise)
• Training Services – Including Remote Options
– Planning Analytics Specific materials• Administration, Developer, End User, Planning Analytics
Workspace – beginner, Planning Analytics Workspace –Developer
What’s New in IBM Cognos Analytics 11.1.7

LPA – www.lpa.com 47