Planetary Accretion Models Mineralogy of Planetary Interiors · Mineralogy of Planetary Interiors...
72
Planetary Accretion Models and the Mineralogy of Planetary Interiors Mineralogy of Planetary Interiors Dan Frost & Dave Rubie – Bayerisches Geoinstitut Dan Frost & Dave Rubie Bayerisches Geoinstitut John Hernlund – Earth‐Life Science Institute, Institute of TechnologyTokyo Alessandro Morbidelli & Seth Jacobson – Observatoire de la Cote d’Azur, Nice, France b h & d b ll f h Rebecca Fischer & Andy Campbell – University of Chicago
Transcript of Planetary Accretion Models Mineralogy of Planetary Interiors · Mineralogy of Planetary Interiors...
Planetary Accretion Models and the Mineralogy of Planetary InteriorsMineralogy of Planetary Interiors
Dan Frost & Dave Rubie – Bayerisches GeoinstitutDan Frost & Dave Rubie Bayerisches Geoinstitut
John Hernlund – Earth‐Life Science Institute, Institute of TechnologyTokyo
Alessandro Morbidelli &Seth Jacobson – Observatoire de la Cote d’Azur, Nice, France
b h & d b ll f hRebecca Fischer & Andy Campbell – University of Chicago
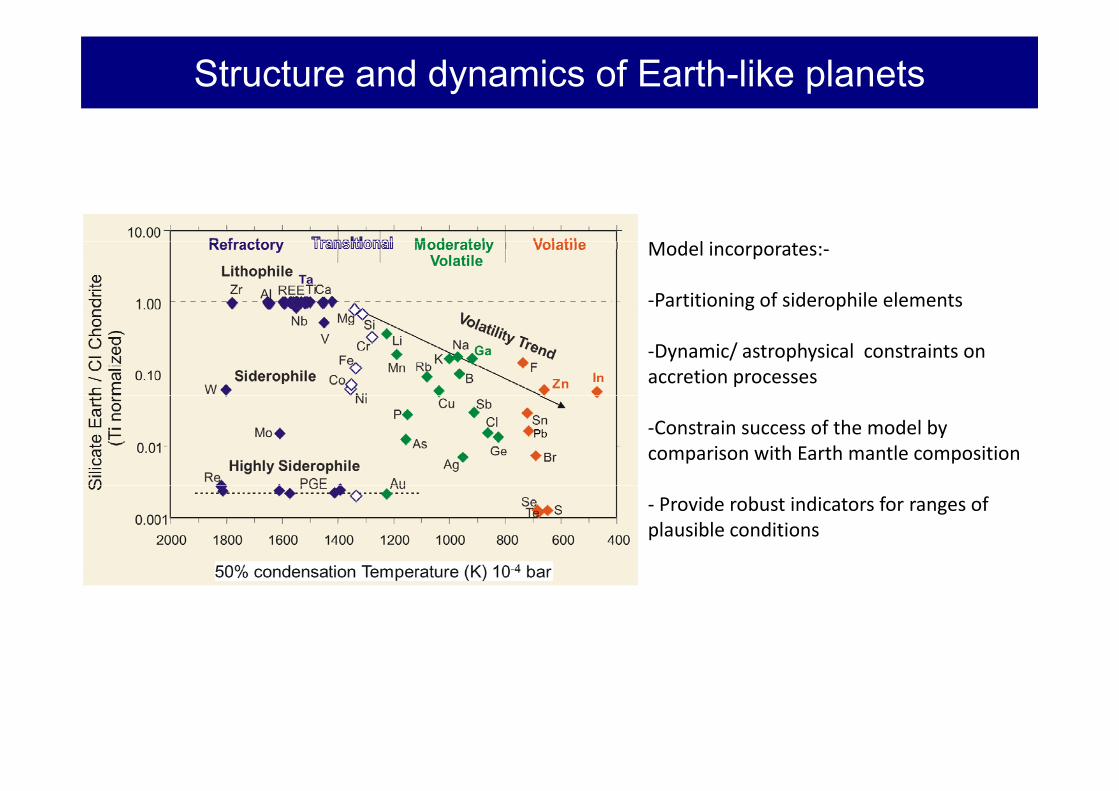
Structure and dynamics of Earth-like planets
Chemical State of Mantle/CoreModel incorporates:‐
‐Partitioning of siderophile elementsMantle/Core mass ratio
FeO content of mantle
Partitioning of siderophile elements
‐Dynamic/ astrophysical constraints on accretion processes
Mg/Si ratio of mantle‐Constrain success of the model by comparison with Earth mantle composition
Volatile content/H2O‐ Provide robust indicators for ranges of plausible conditions
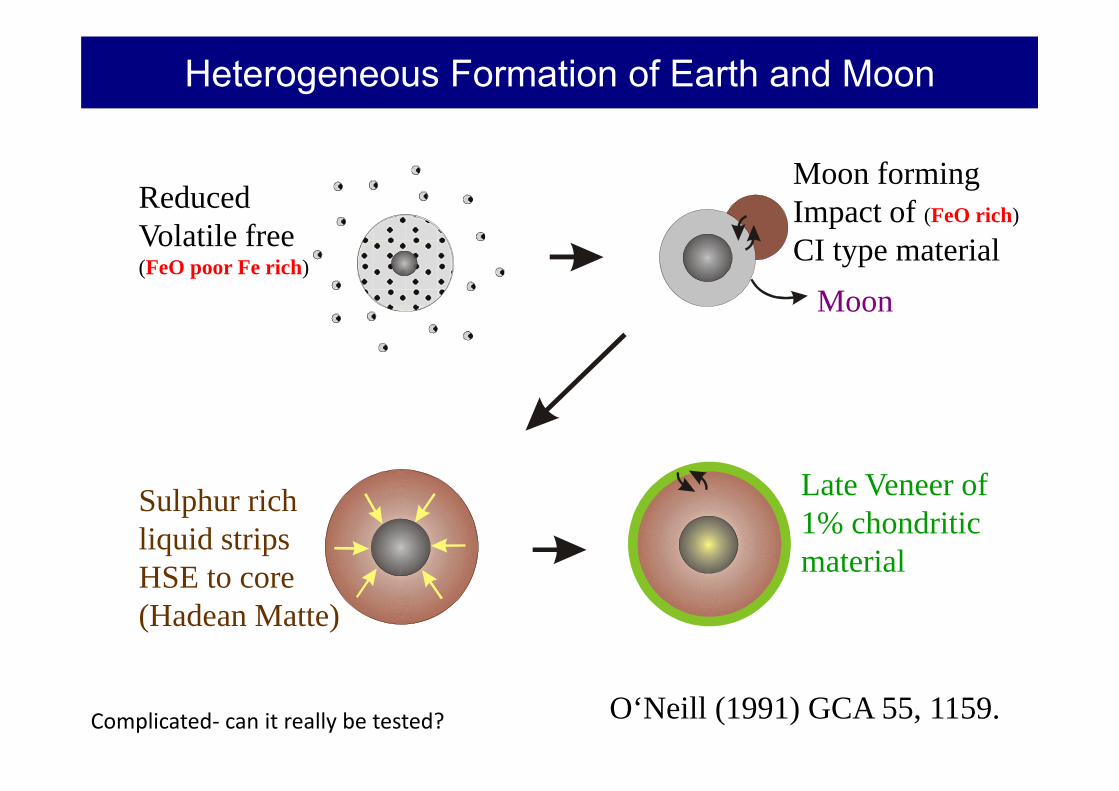
Heterogeneous Formation of Earth and Moon
Reduced Moon formingImpact of (FeO rich)
Volatile free(FeO poor Fe rich)
Impact of (FeO rich)
CI type materialMoonMoon
Late Veneer ofSulphur richliquid stripsHSE to core
Late Veneer of1% chondriticmaterialHSE to core
(Hadean Matte)
O‘Neill (1991) GCA 55, 1159.Complicated‐ can it really be tested?
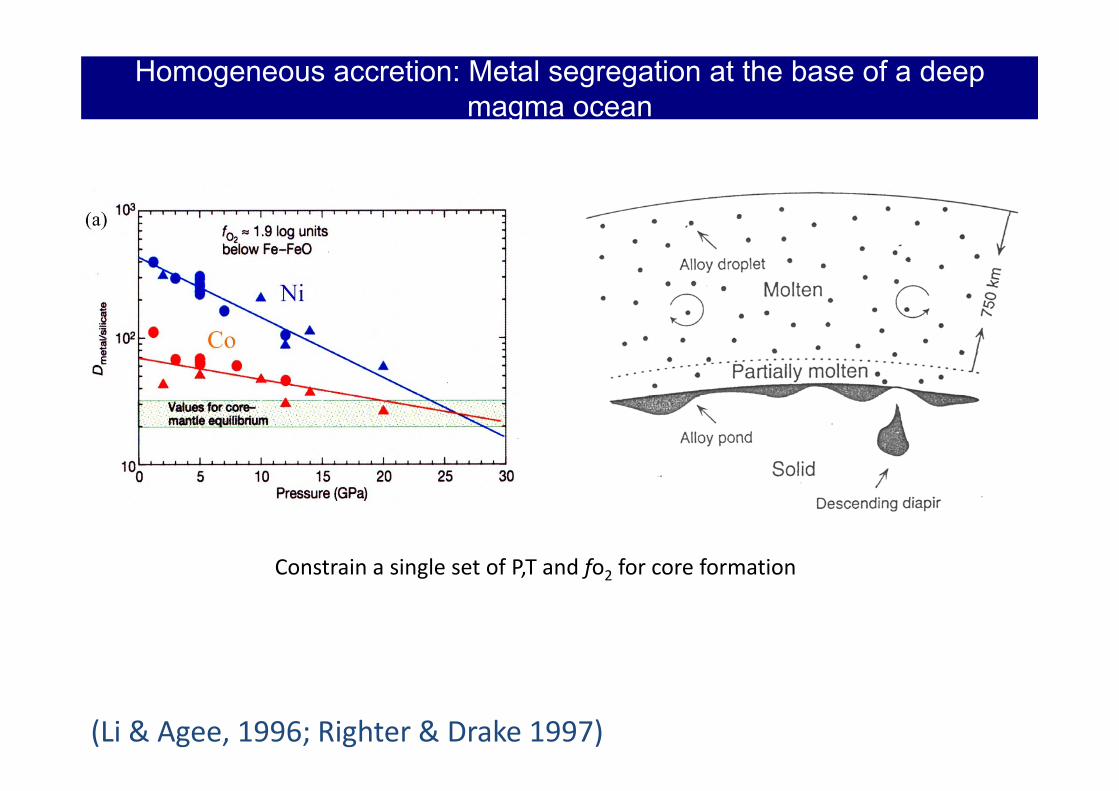
Homogeneous accretion: Metal segregation at the base of a deepmagma ocean
Constrain a single set of P,T and fo2 for core formationg , f 2
(Li & Agee, 1996; Righter & Drake 1997)
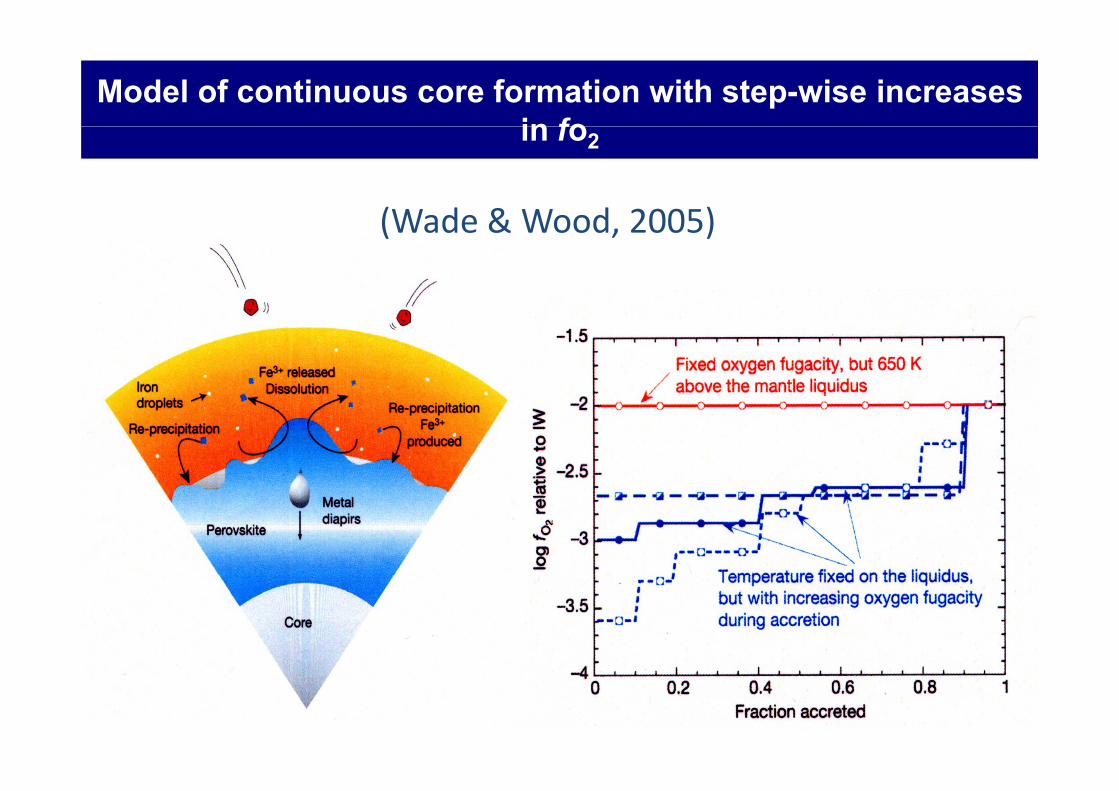
Model of continuous core formation with step-wise increases in foin fo2
(Wade & Wood 2005)(Wade & Wood, 2005)
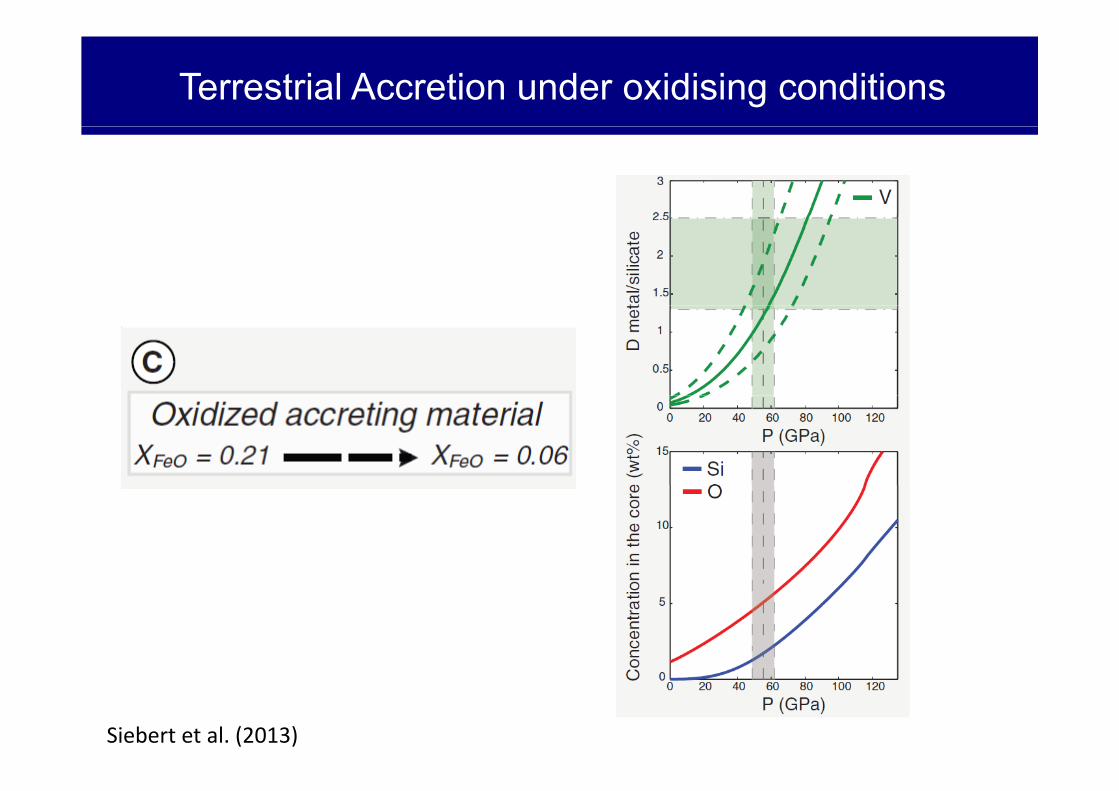
Terrestrial Accretion under oxidising conditions
Siebert et al. (2013)
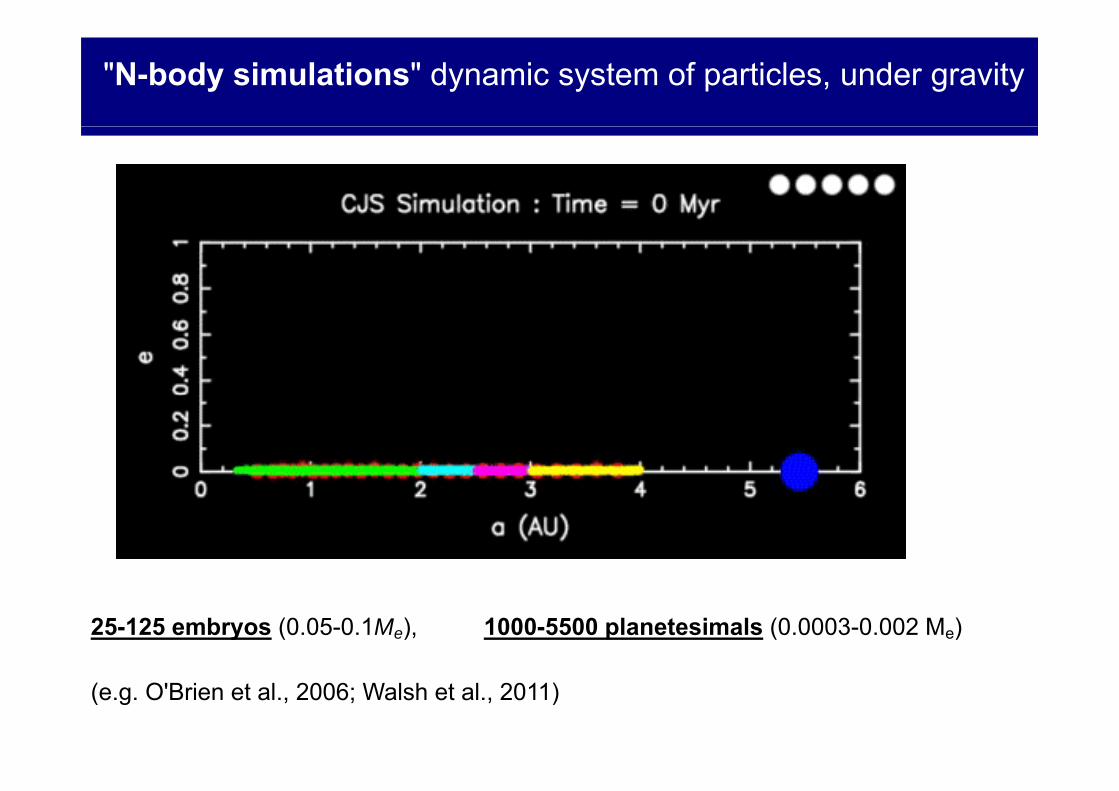
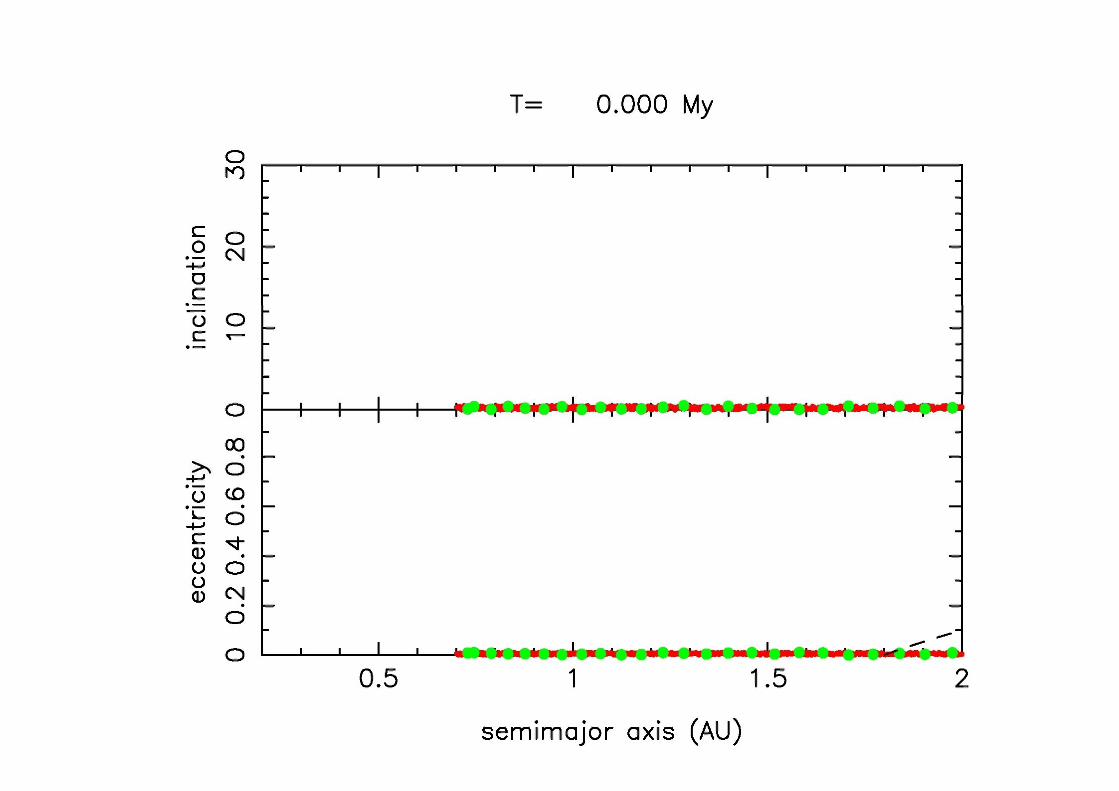
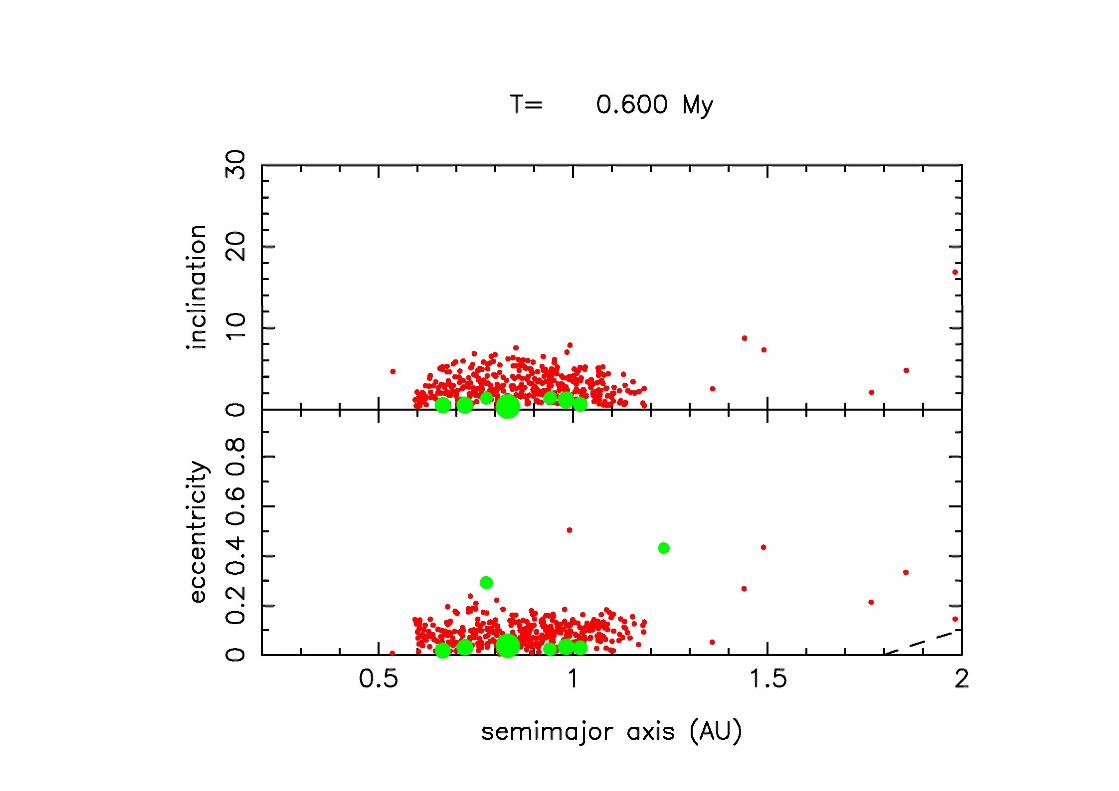
"N-body simulations" dynamic system of particles, under gravity
25-125 embryos (0.05-0.1Me), 1000-5500 planetesimals (0.0003-0.002 Me)
(e.g. O'Brien et al., 2006; Walsh et al., 2011)
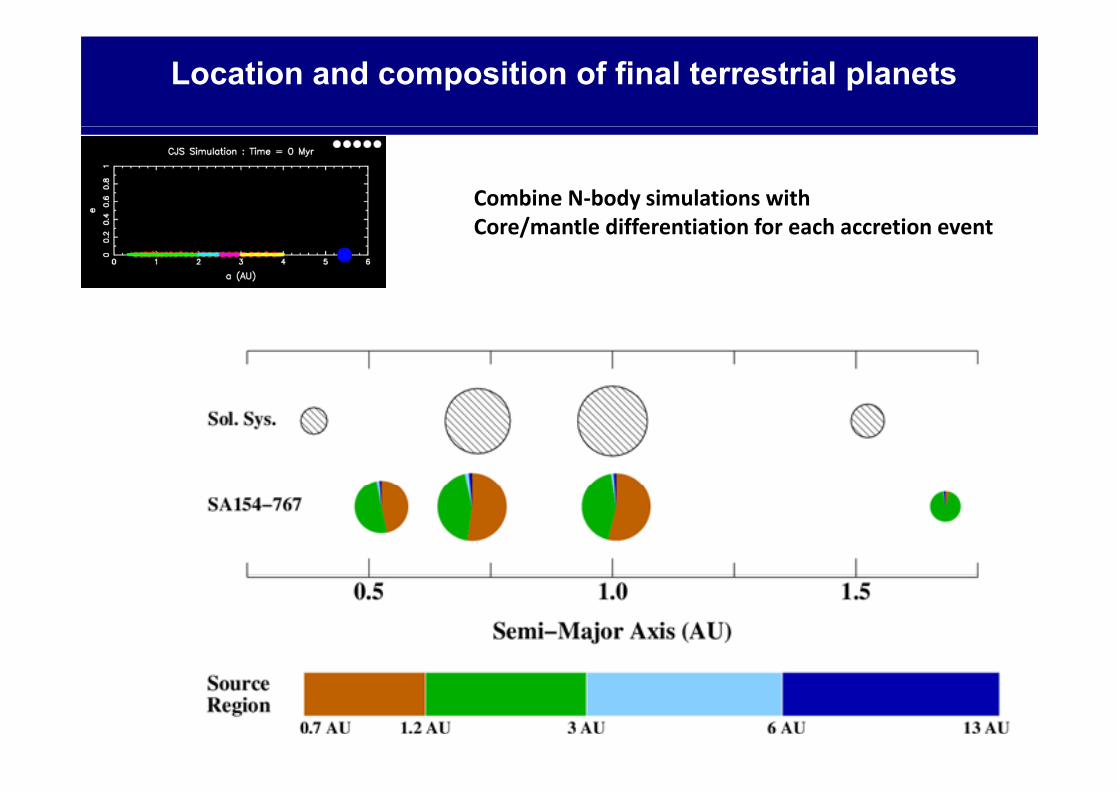
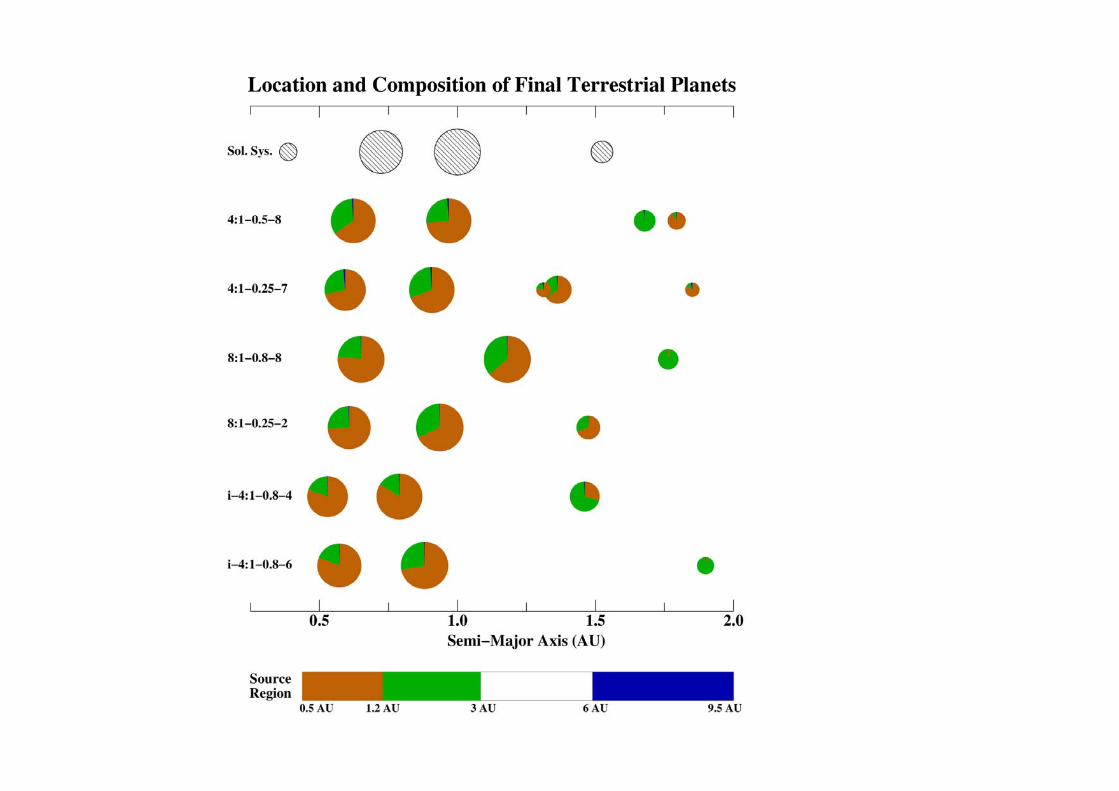
Location and composition of final terrestrial planets
Combine N‐body simulations withCore/mantle differentiation for each accretion event
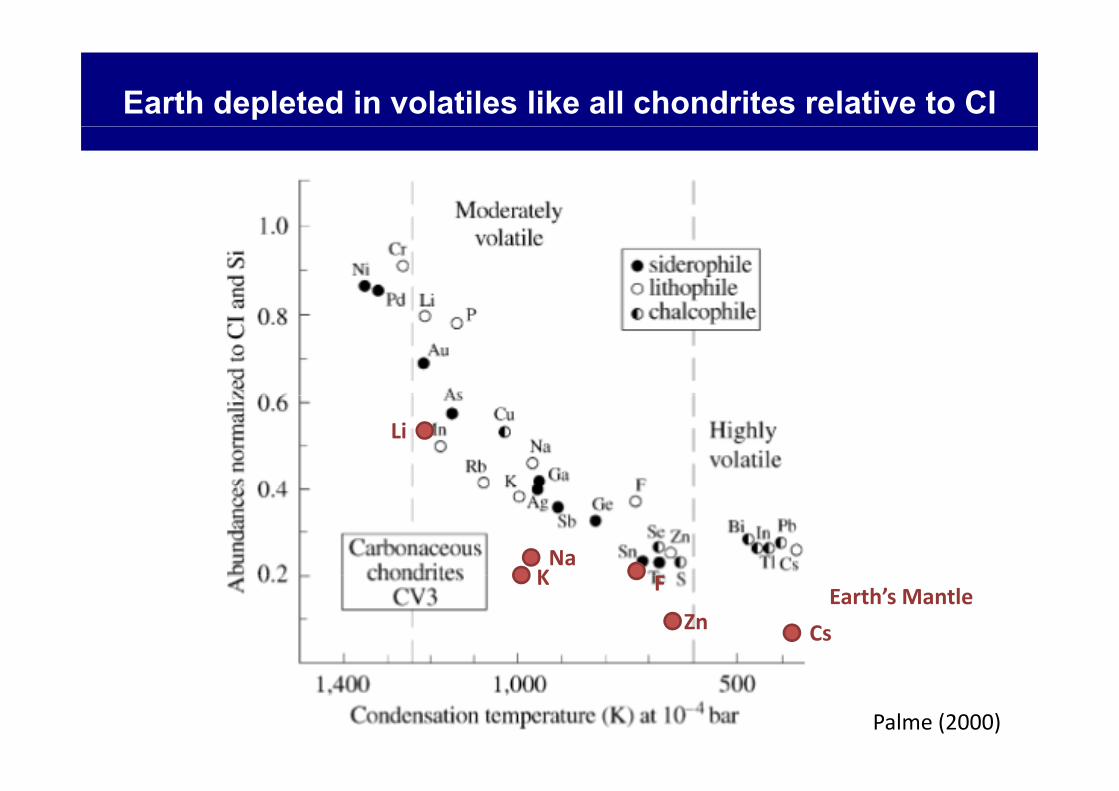
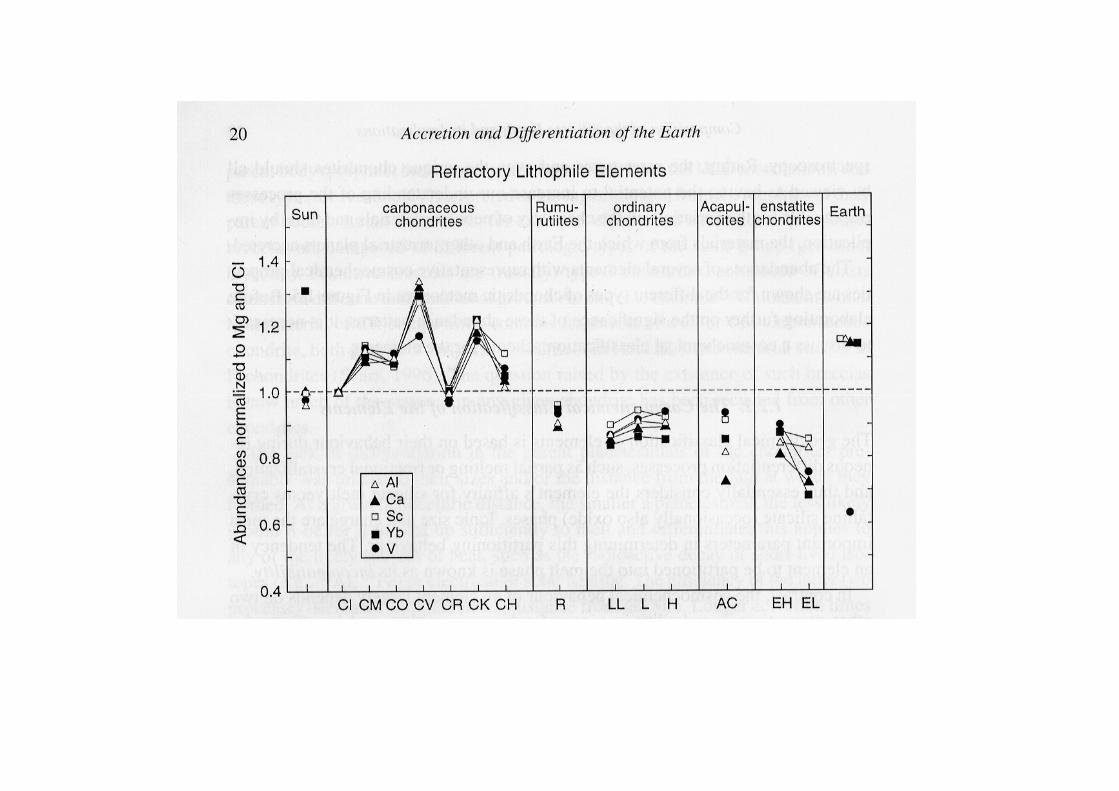
Earth depleted in volatiles like all chondrites relative to CI
Li
NaK
CsZn
FKEarth’s Mantle
Palme (2000)
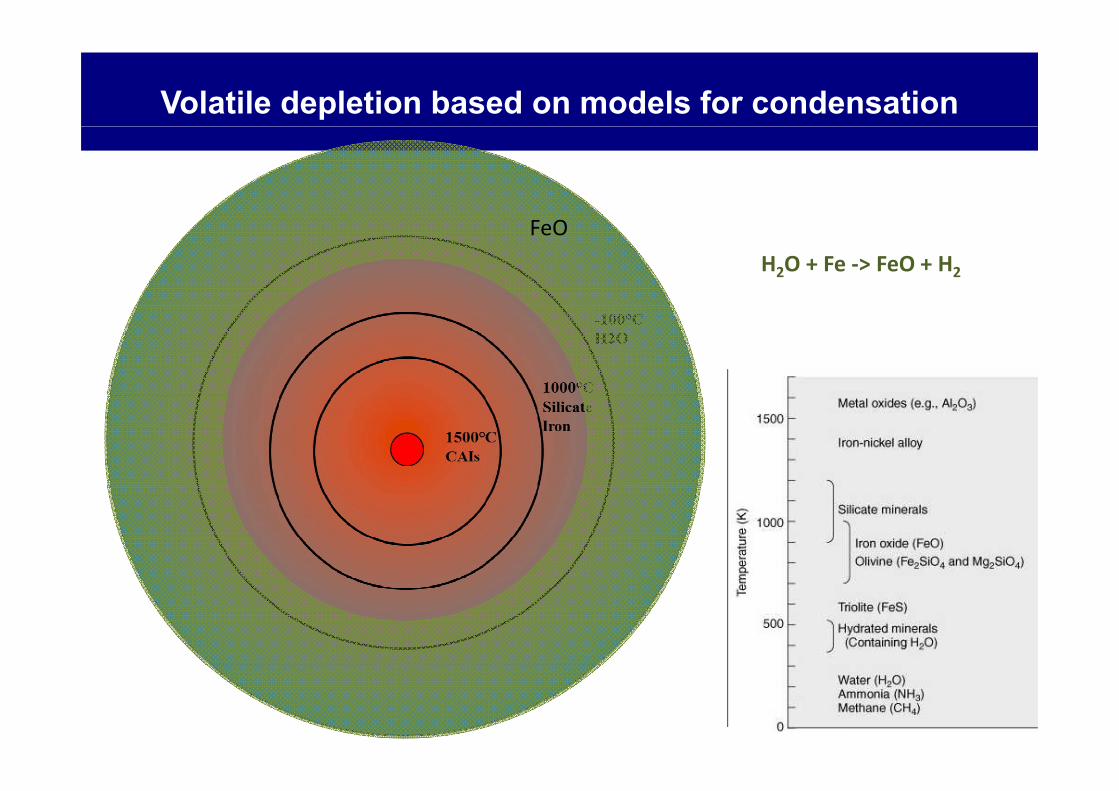
Volatile depletion based on models for condensation
H2O + Fe ‐> FeO + H2
FeO
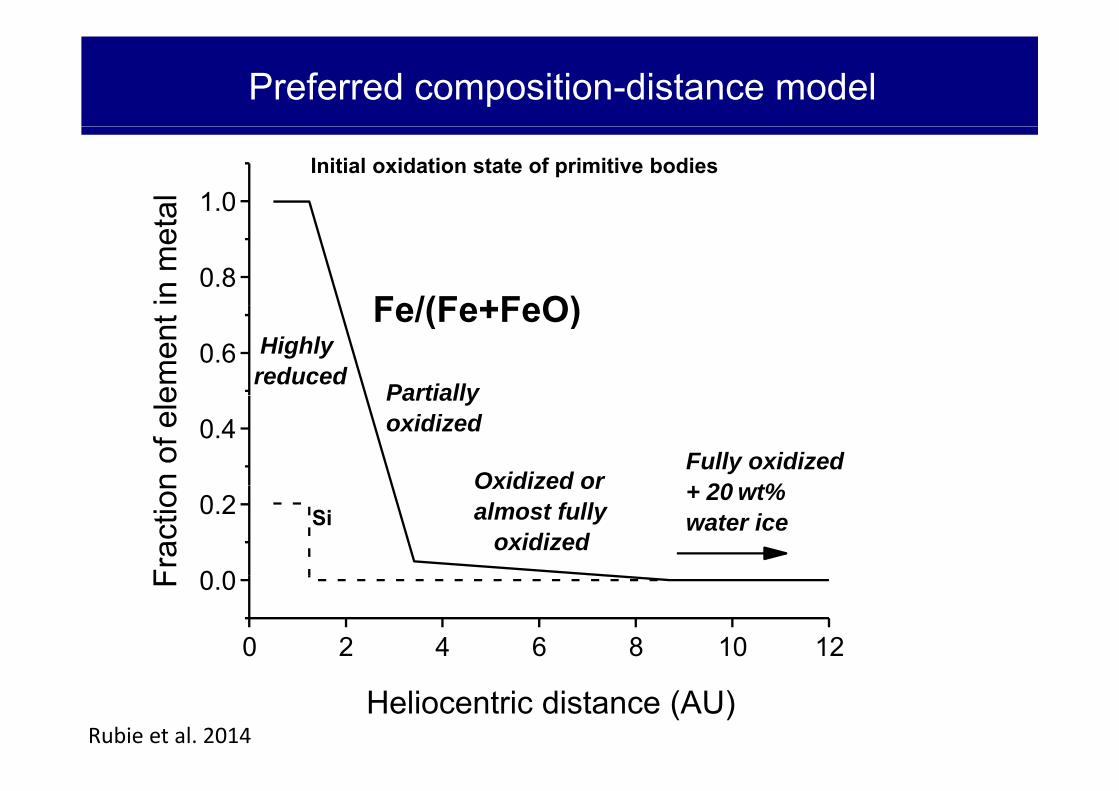
Preferred composition-distance model
1.0alInitial oxidation state of primitive bodies
0.8Fe/(Fe+FeO)in
met
a
0.6 Highly reduced Partially
Fe/(Fe+FeO)
emen
t
0.4
Oxidized orFully oxidized
20 t%
Partially oxidized
n of
ele
0 0
0.2Oxidized or almost fully
oxidized
+ 20 wt% water iceSi
Frac
tion
0 2 4 6 8 10 12
0.0F
Heliocentric distance (AU)Rubie et al. 2014
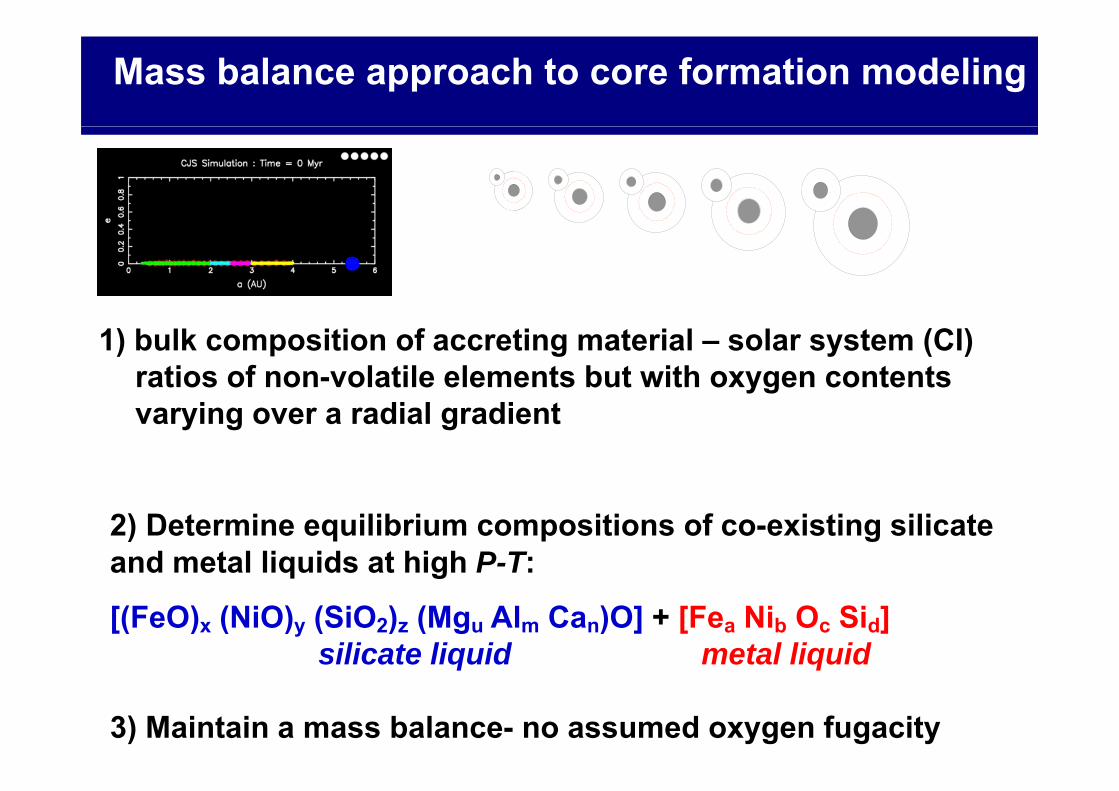
Mass balance approach to core formation modeling
1) bulk composition of accreting material – solar system (CI) ratios of non-volatile elements but with oxygen contents varying over a radial gradient
2) Determine equilibrium compositions of co-existing silicate and metal liquids at high P-T:q g
[(FeO)x (NiO)y (SiO2)z (Mgu Alm Can)O] + [Fea Nib Oc Sid]silicate liquid metal liquidq q
3) Maintain a mass balance- no assumed oxygen fugacity
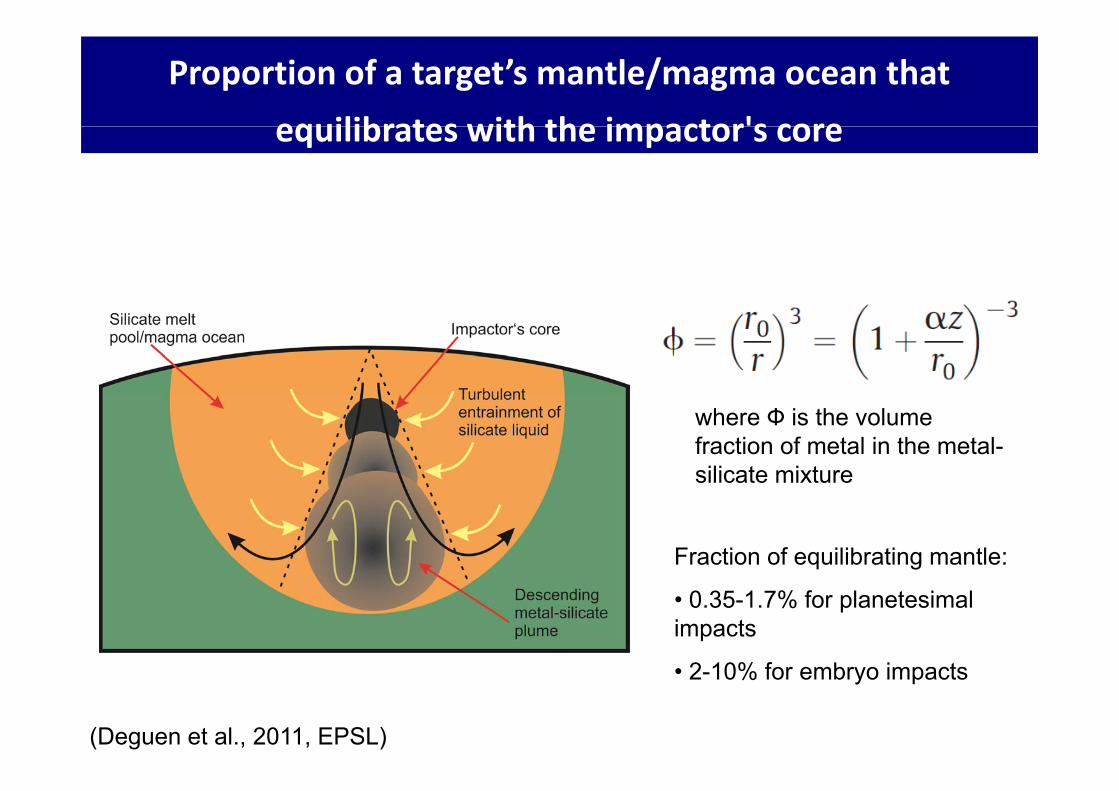
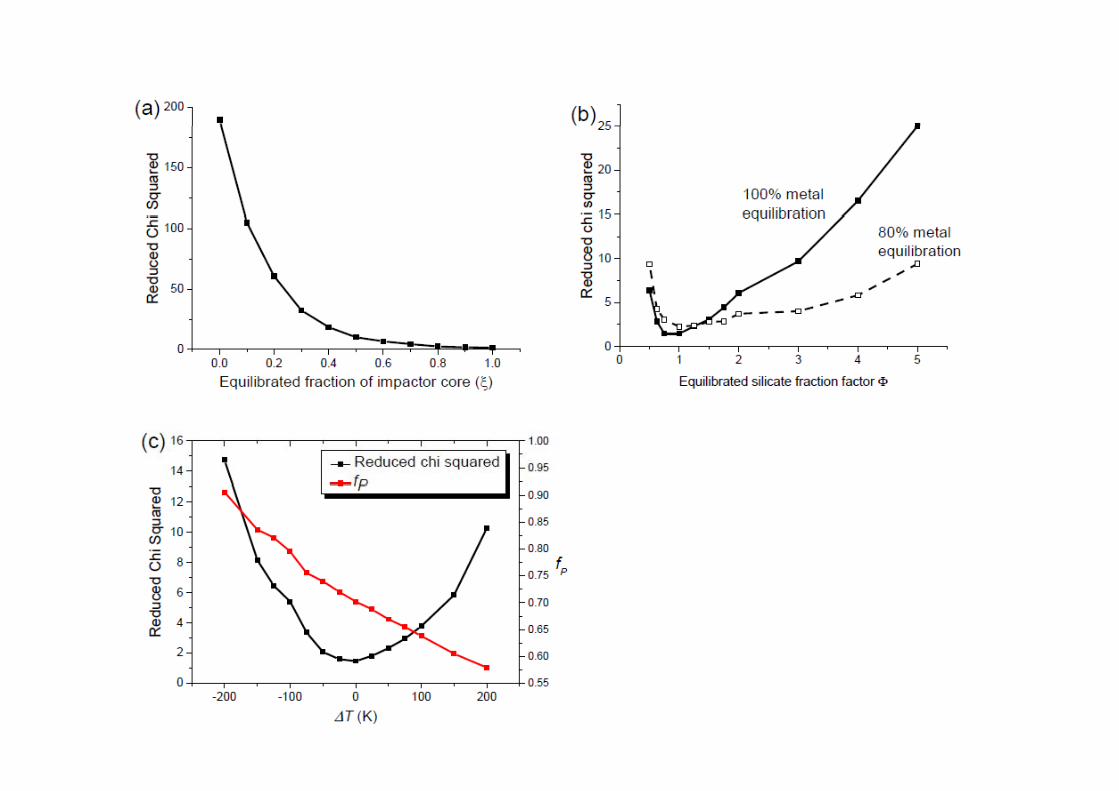
Proportion of a target’s mantle/magma ocean that equilibrates with the impactor's coreequilibrates with the impactor s core
where Ф is the volume fraction of metal in the metal-silicate mixture
Fraction of equilibrating mantle:
• 0.35-1.7% for planetesimal impacts
2 10% f b i t• 2-10% for embryo impacts
(Deguen et al., 2011, EPSL)
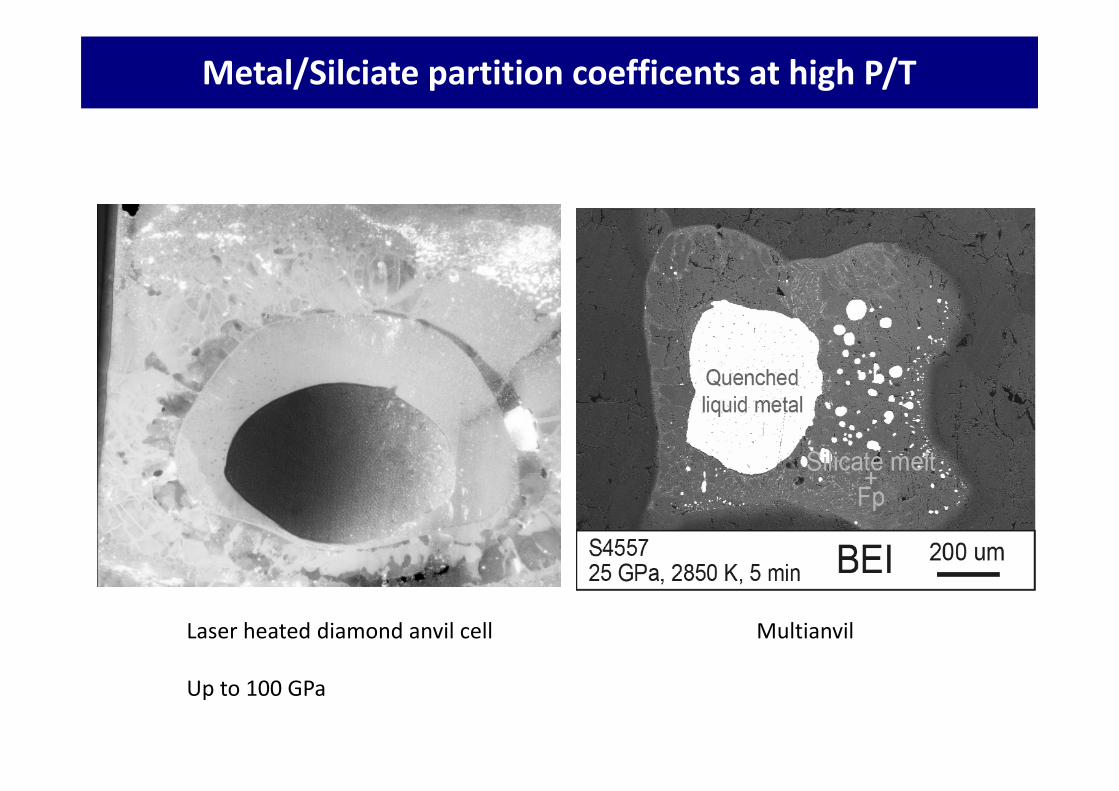
Metal/Silciate partition coefficents at high P/T
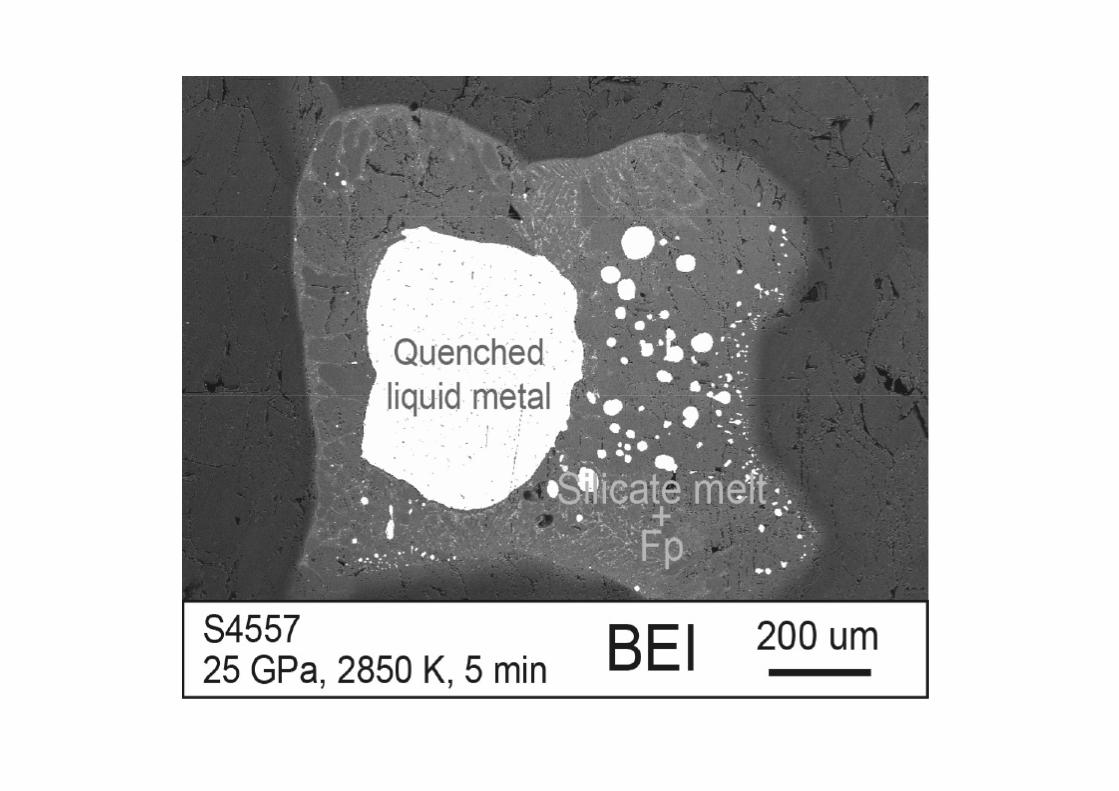
Laser heated diamond anvil cell Multianvil
Up to 100 GPa
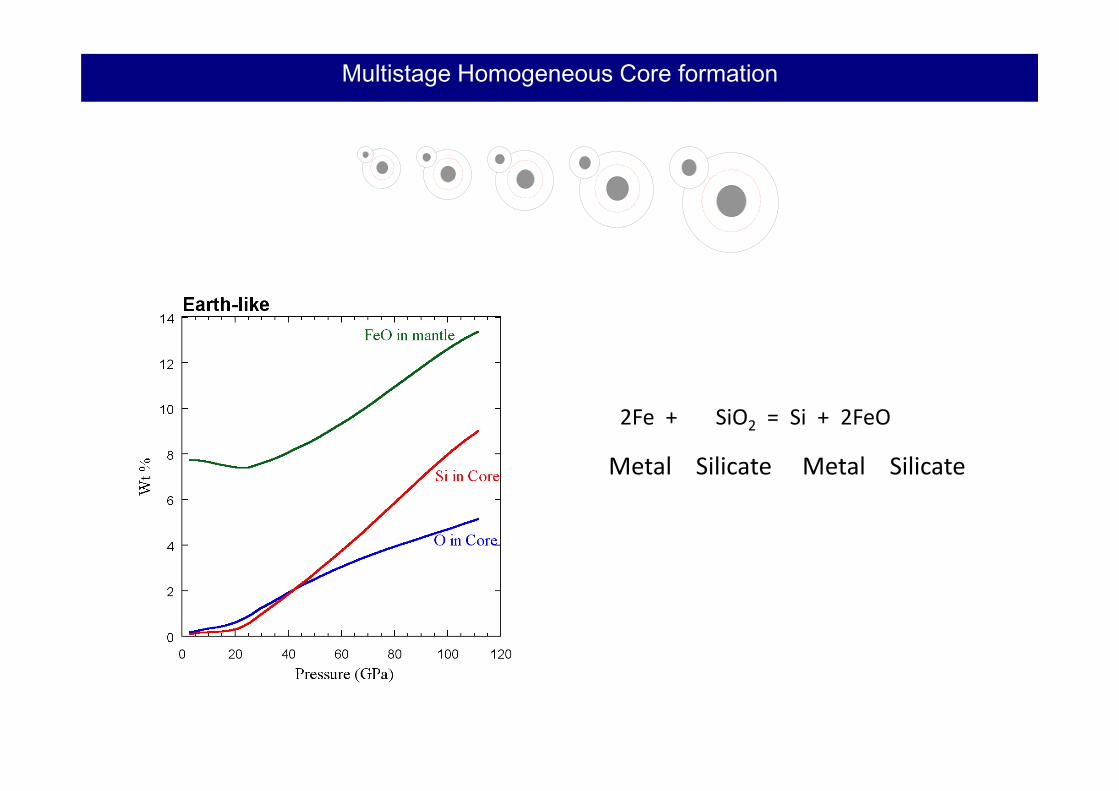
Multistage Homogeneous Core formation
2Fe + SiO2 = Si + 2FeO
Metal Silicate Metal Silicate
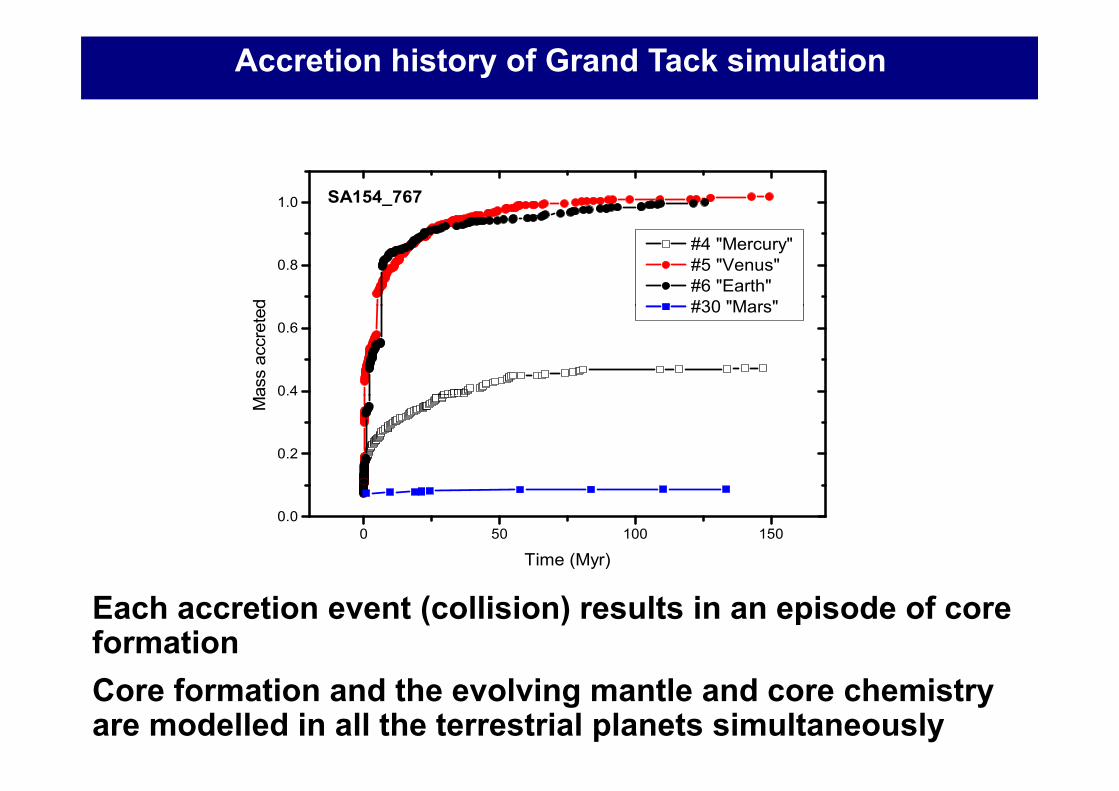
Accretion history of Grand Tack simulation
1.0 SA154_767
0.8d
#4 "Mercury" #5 "Venus" #6 "Earth"#30 "Mars"
0.4
0.6
ass
accr
eted #30 Mars
0.2
0
Ma
0 50 100 1500.0
Time (Myr)
Each accretion event (collision) results in an episode of coreformationCore formation and the evolving mantle and core chemistryare modelled in all the terrestrial planets simultaneously
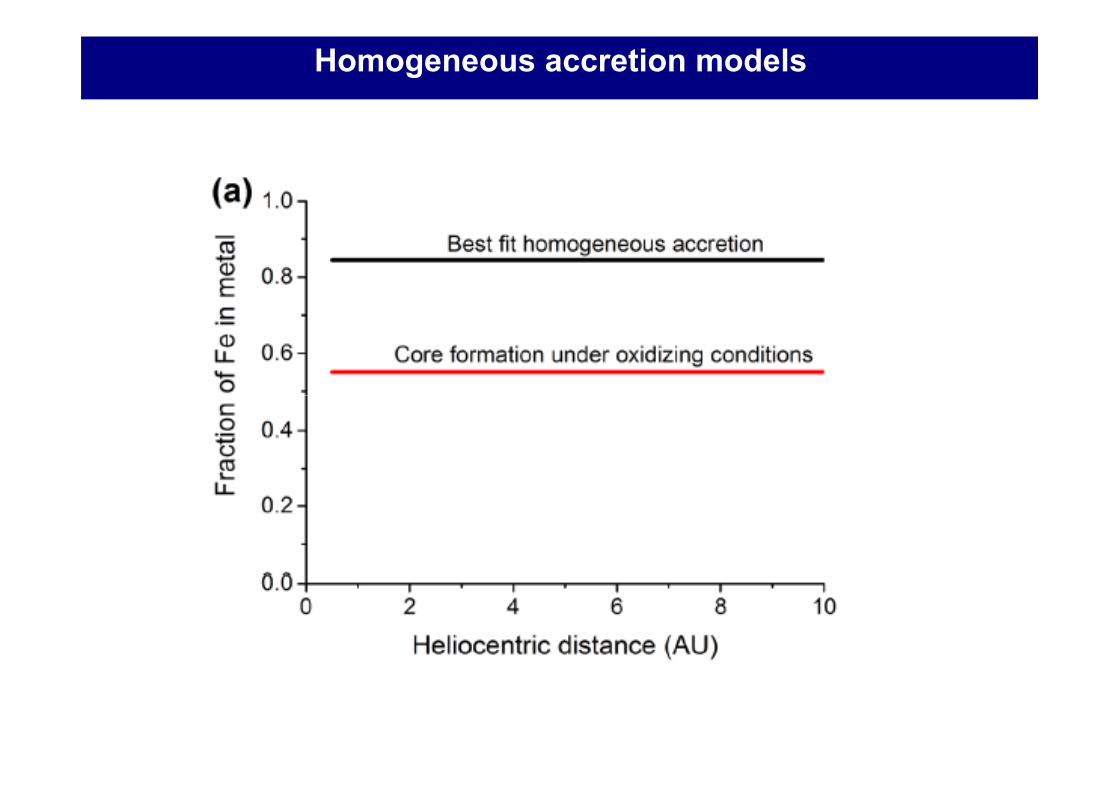
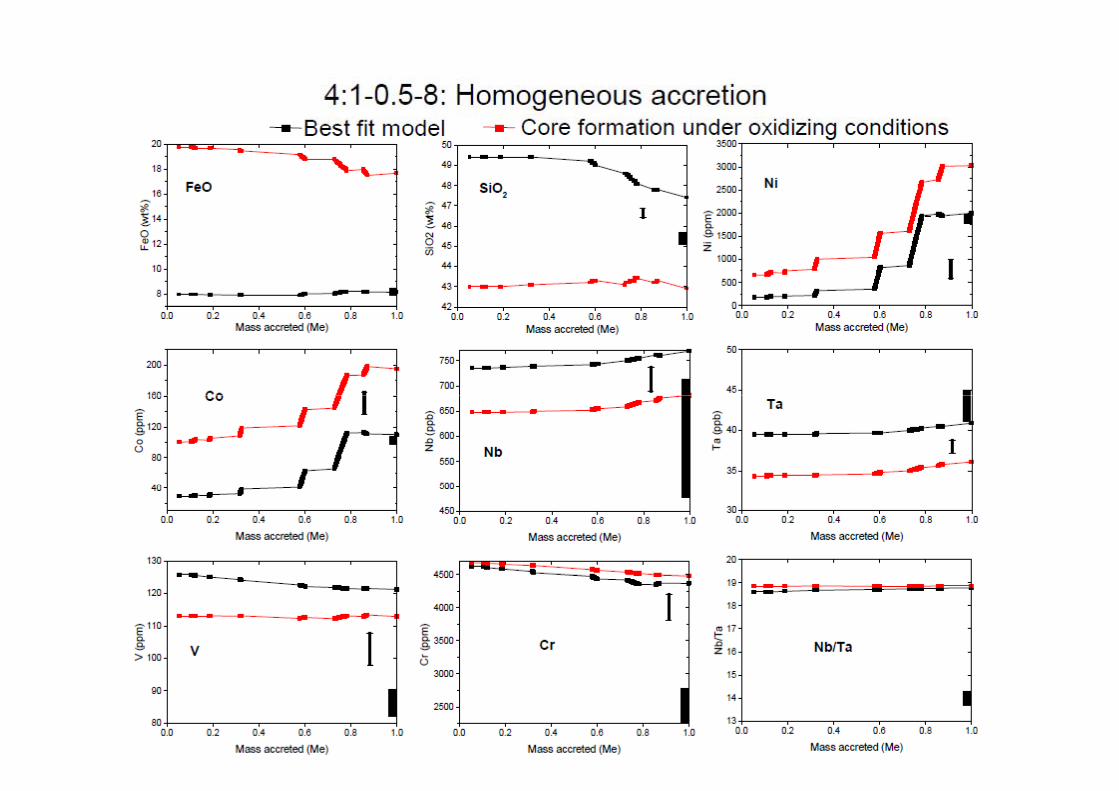
Homogeneous accretion models
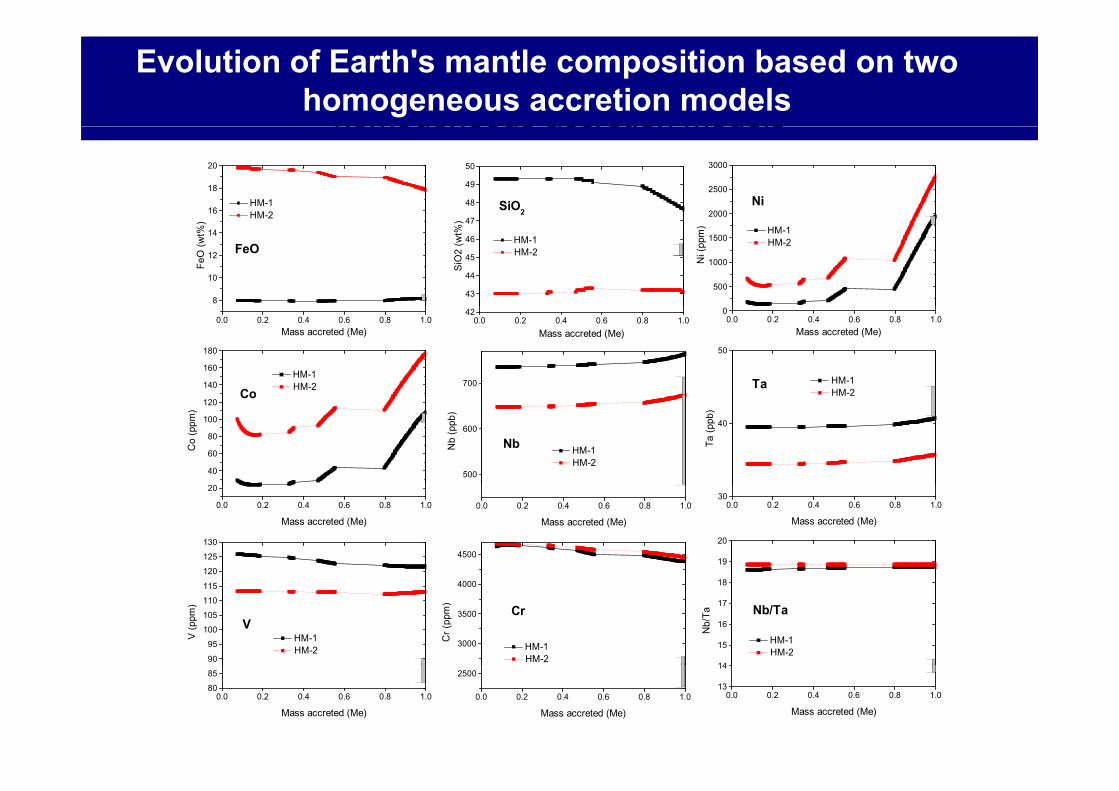
Evolution of Earth's mantle composition based on two homogeneous accretion models
Evolution of Earth's mantle composition based on two homogeneous accretion modelshomogeneous accretion models
16
18
20
HM-1HM-2
48
49
50
SiO2 2000
2500
3000
Ni
8
10
12
14
FeO
HM-2Fe
O (w
t%)
43
44
45
46
47
HM-1 HM-2
SiO
2 (w
t%)
500
1000
1500
2000
HM-1 HM-2
Ni (
ppm
)
0.0 0.2 0.4 0.6 0.8 1.0Mass accreted (Me)
0.0 0.2 0.4 0.6 0.8 1.042
Mass accreted (Me)0.0 0.2 0.4 0.6 0.8 1.0
0
Mass accreted (Me)
140
160
180
Co HM-1 HM-2 700
50
Ta HM-1HM-2
20
40
60
80
100
120Co
Co
(ppm
)
500
600
HM-1 HM-2
NbNb
(ppb
)
40
HM 2
Ta (p
pb)
0.0 0.2 0.4 0.6 0.8 1.0
20
Mass accreted (Me)0.0 0.2 0.4 0.6 0.8 1.0
Mass accreted (Me)
0.0 0.2 0.4 0.6 0.8 1.030
Mass accreted (Me)
120
125
1304500
19
20
90
95
100
105
110
115
V HM-1 HM-2
V (p
pm)
3000
3500
4000
HM-1 HM-2
Cr
Cr (
ppm
)
14
15
16
17
18
Nb/Ta
HM-1 HM-2
Nb/
Ta0.0 0.2 0.4 0.6 0.8 1.0
80
85
Mass accreted (Me)0.0 0.2 0.4 0.6 0.8 1.0
2500
Mass accreted (Me)
0.0 0.2 0.4 0.6 0.8 1.013
14
Mass accreted (Me)
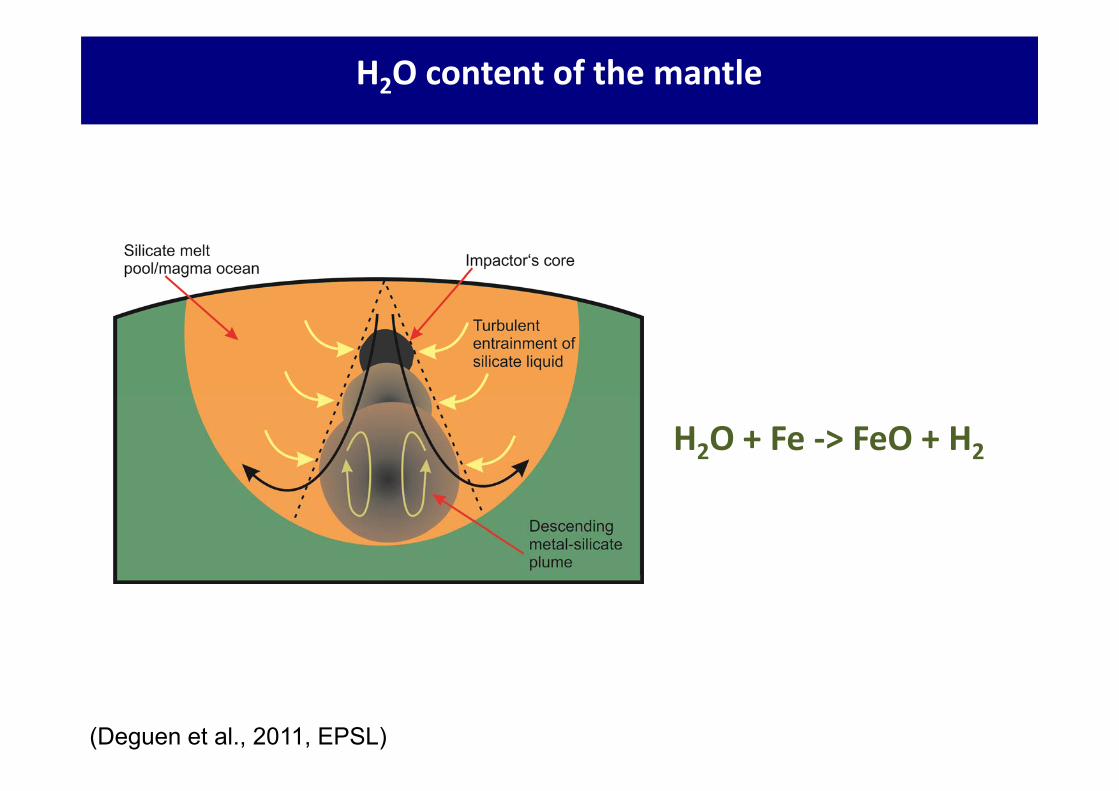
H2O content of the mantle
H2O + Fe ‐> FeO + H2
(Deguen et al., 2011, EPSL)
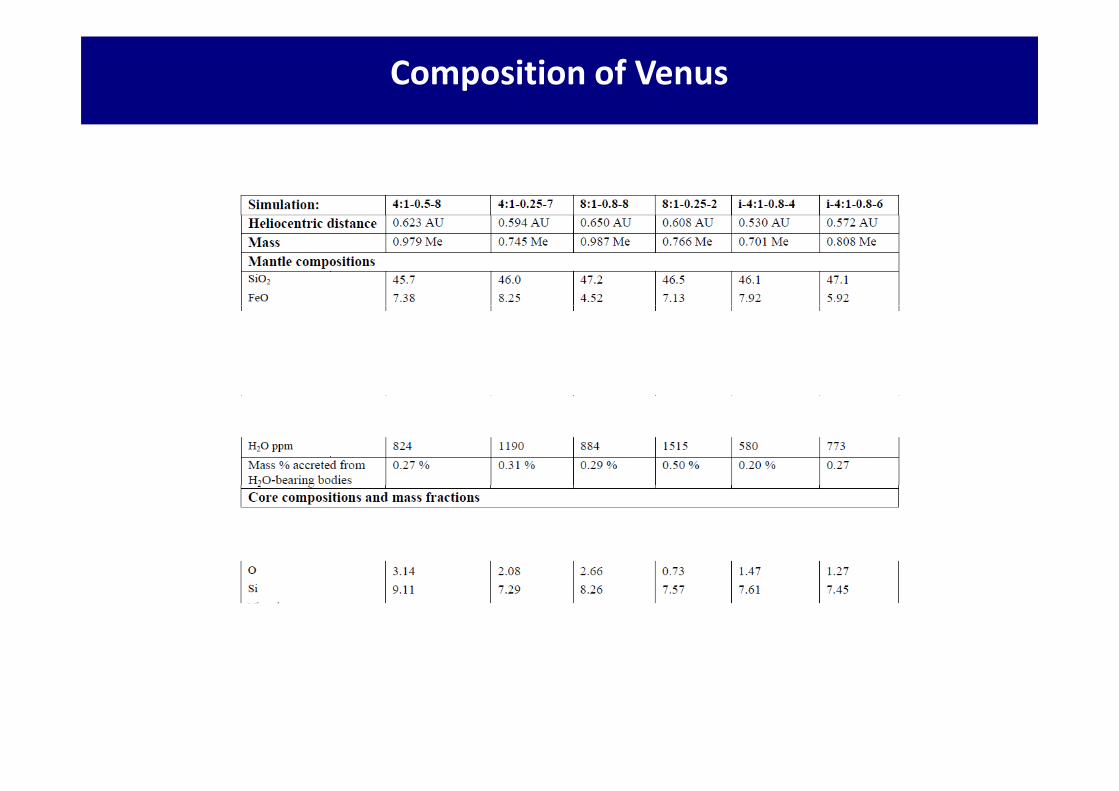
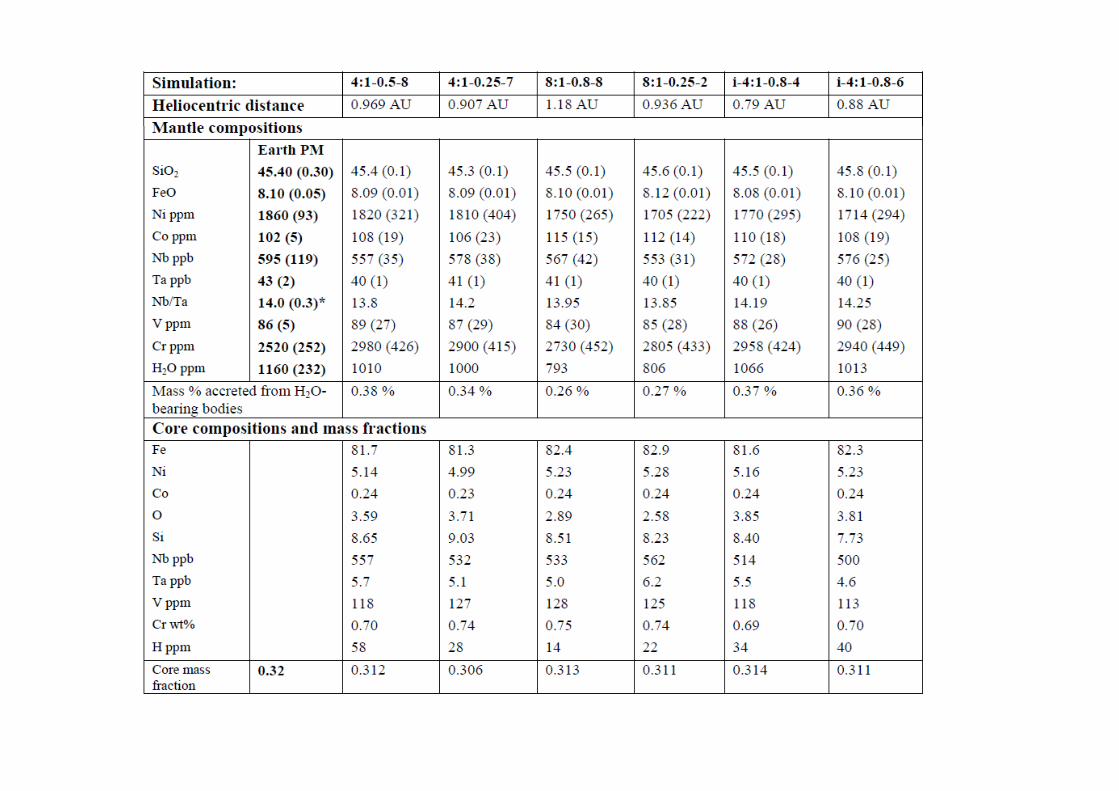
Composition of Venus
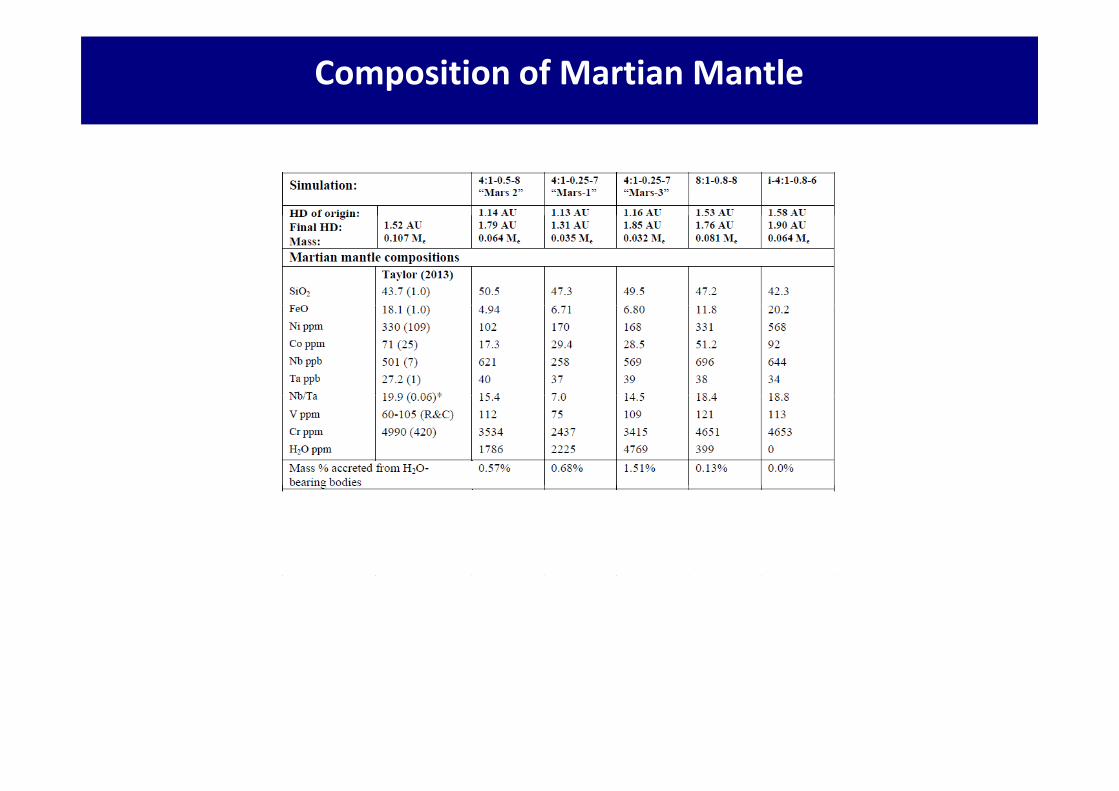
Composition of Martian Mantle
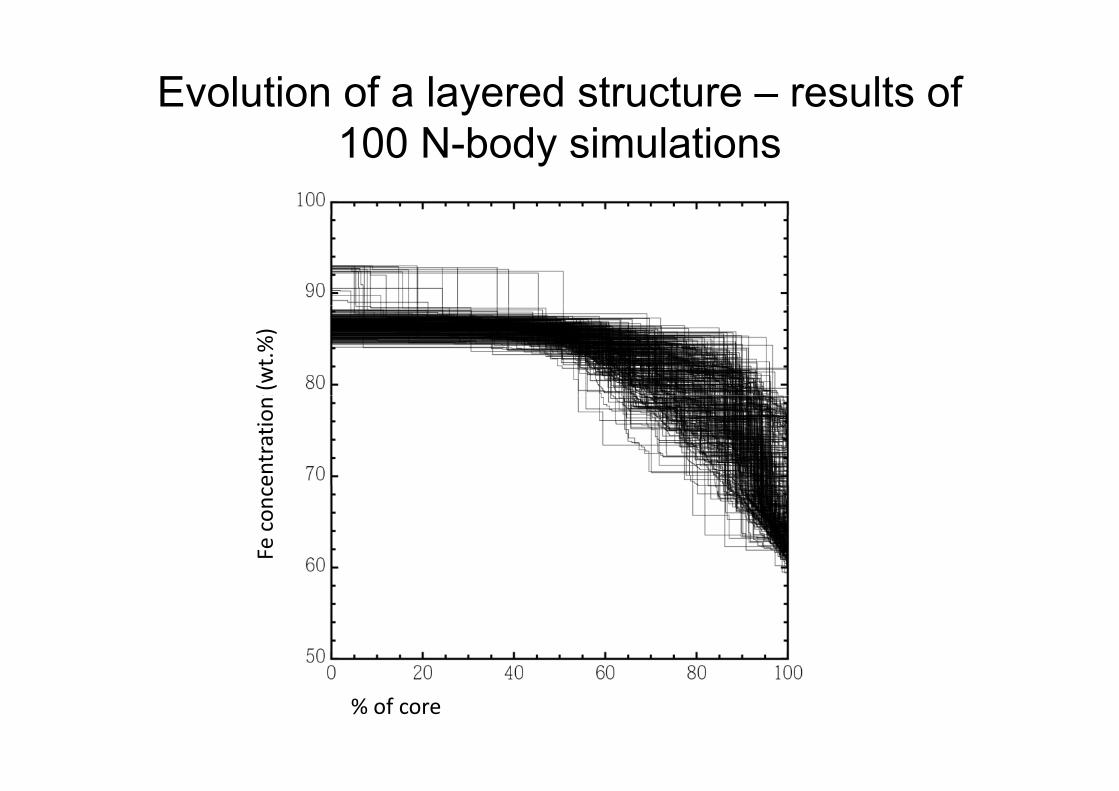
Evolution of a layered structure – results of 100 N-body simulations
(wt.%
)entration
Fe con
ce
% of core
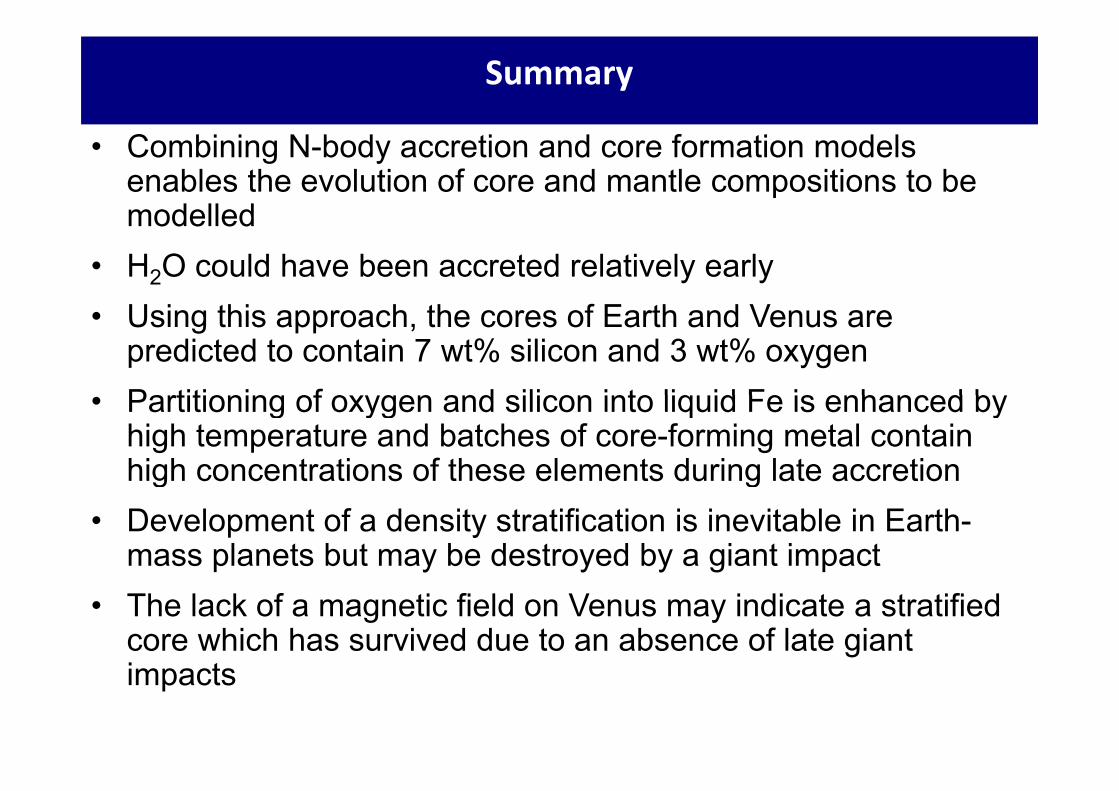
Summary
• Combining N-body accretion and core formation models enables the evolution of core and mantle compositions to be modelledmodelled
• H2O could have been accreted relatively earlyU i thi h th f E th d V• Using this approach, the cores of Earth and Venus are predicted to contain 7 wt% silicon and 3 wt% oxygenPartitioning of oxygen and silicon into liquid Fe is enhanced by• Partitioning of oxygen and silicon into liquid Fe is enhanced by high temperature and batches of core-forming metal contain high concentrations of these elements during late accretiong g
• Development of a density stratification is inevitable in Earth-mass planets but may be destroyed by a giant impact
• The lack of a magnetic field on Venus may indicate a stratified core which has survived due to an absence of late giant i timpacts


Evolution of the concentration of light elements in Earth’s core
15
14
15nt
s (w
t%)
13
ht e
lem
en
11
12
on o
f lig
h
10
11
ncen
tratio
9
Tota
l co
0.0 0.2 0.4 0.6 0.8 1.0
Mass accreted (Me)


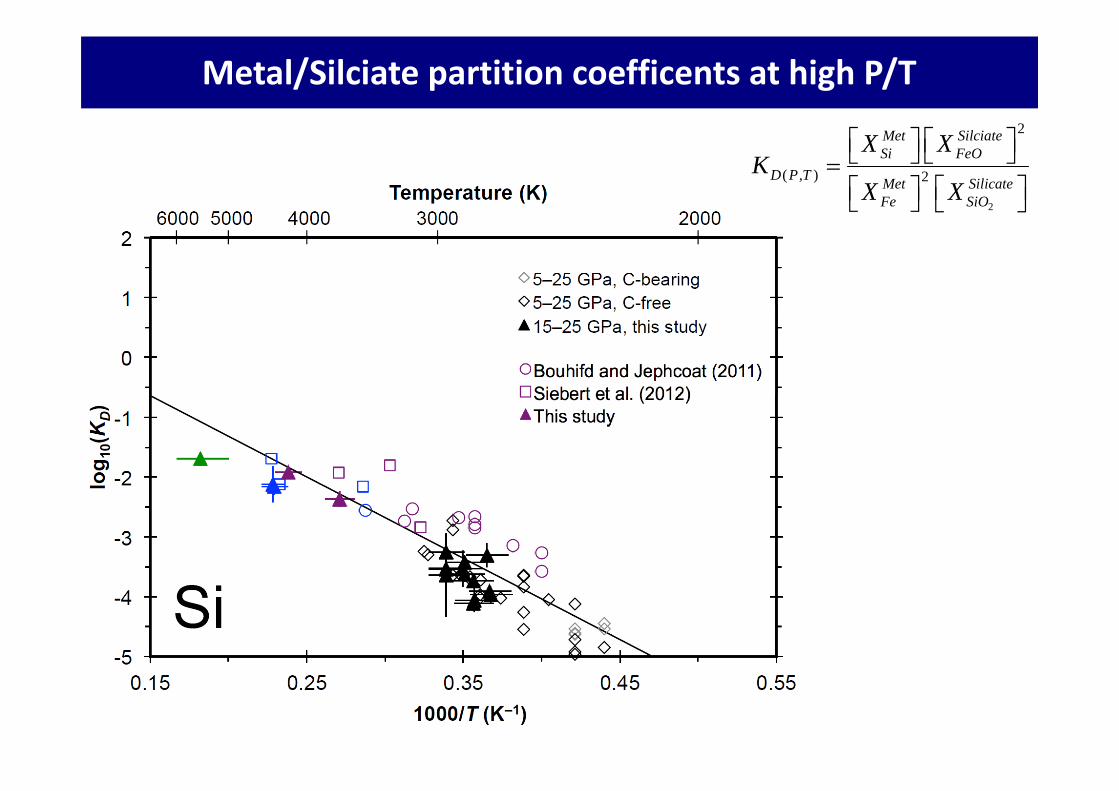
Metal/Silciate partition coefficents at high P/T2
2
2
( , ) 2
Met SilciateSi FeO
D P T Met SilicateFe SiO
X XK
X X


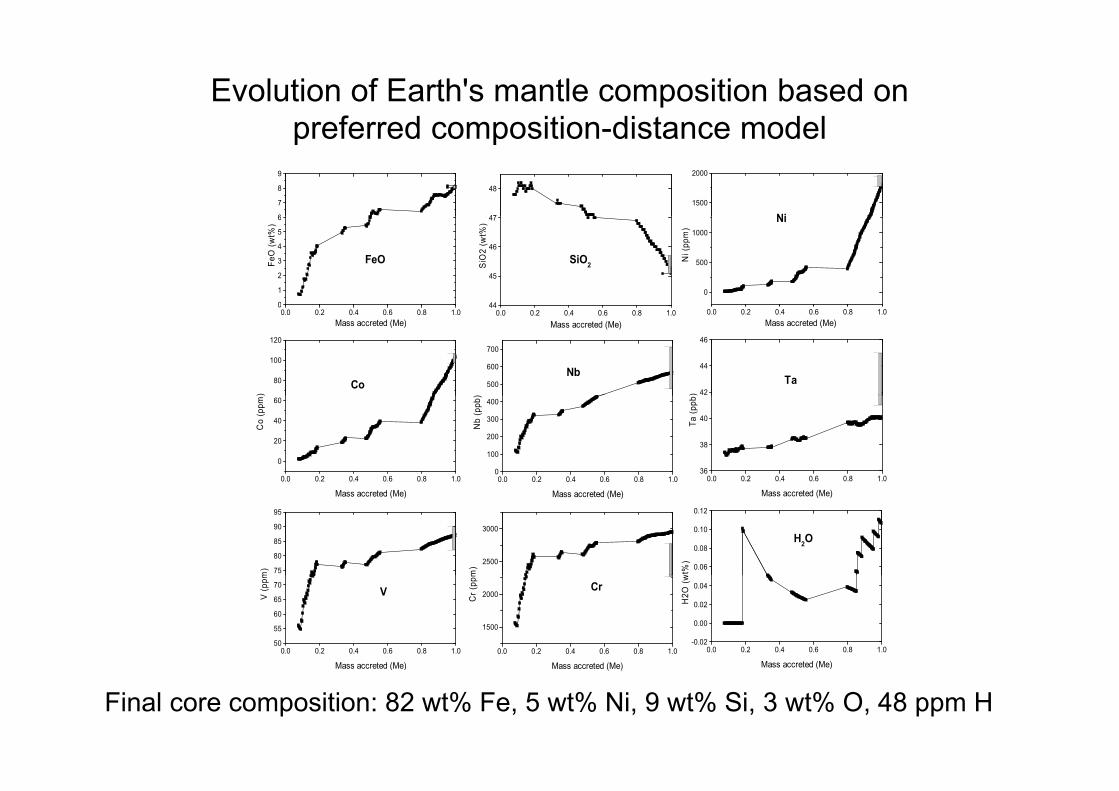
Evolution of Earth's mantle composition based on preferred composition distance modelpreferred composition-distance model
6
7
8
9
47
48
1500
2000
Ni
0
1
2
3
4
5
6
FeO
FeO
(wt%
)
44
45
46
47
SiO2SiO
2 (w
t%)
0
500
1000
Ni
Ni (
ppm
)
0.0 0.2 0.4 0.6 0.8 1.00
Mass accreted (Me)0.0 0.2 0.4 0.6 0.8 1.0
44
Mass accreted (Me)0.0 0.2 0.4 0.6 0.8 1.0
Mass accreted (Me)
80
100
120
Co
)
500
600
700
Nb
) 42
44
46
Ta
)
0.0 0.2 0.4 0.6 0.8 1.0
0
20
40
60
Co
(ppm
)
0.0 0.2 0.4 0.6 0.8 1.00
100
200
300
400
Nb
(ppb
)0.0 0.2 0.4 0.6 0.8 1.0
36
38
40Ta (p
pb
Mass accreted (Me) Mass accreted (Me) Mass accreted (Me)
75
80
85
90
95
m)
2500
3000
m) 0.06
0.08
0.10
0.12
wt%
)
H2O
0.0 0.2 0.4 0.6 0.8 1.050
55
60
65
70VV
(ppm
Mass accreted (Me)0.0 0.2 0.4 0.6 0.8 1.0
1500
2000Cr
Cr (
ppm
Mass accreted (Me)
0.0 0.2 0.4 0.6 0.8 1.0-0.02
0.00
0.02
0.04
H2O
(w
Mass accreted (Me)Mass accreted (Me) Mass accreted (Me) Mass accreted (Me)
Final core composition: 82 wt% Fe, 5 wt% Ni, 9 wt% Si, 3 wt% O, 48 ppm H
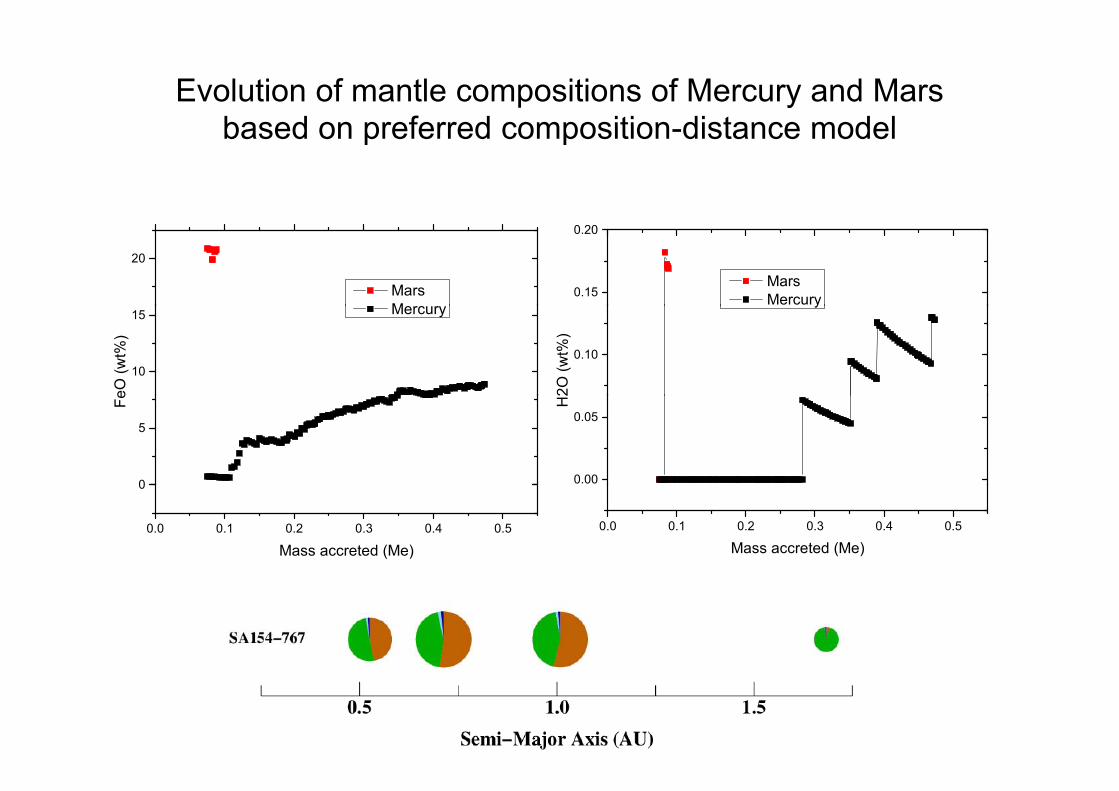
Evolution of mantle compositions of Mercury and Mars based on preferred composition distance modelbased on preferred composition-distance model
0.15
0.20
MarsMercury
20
MarsM
0.10
2O (w
t%)
y
10
15
eO (w
t%)
Mercury
0.00
0.05
H2
0
5
Fe
0.0 0.1 0.2 0.3 0.4 0.5
Mass accreted (Me)0.0 0.1 0.2 0.3 0.4 0.5
0
Mass accreted (Me)
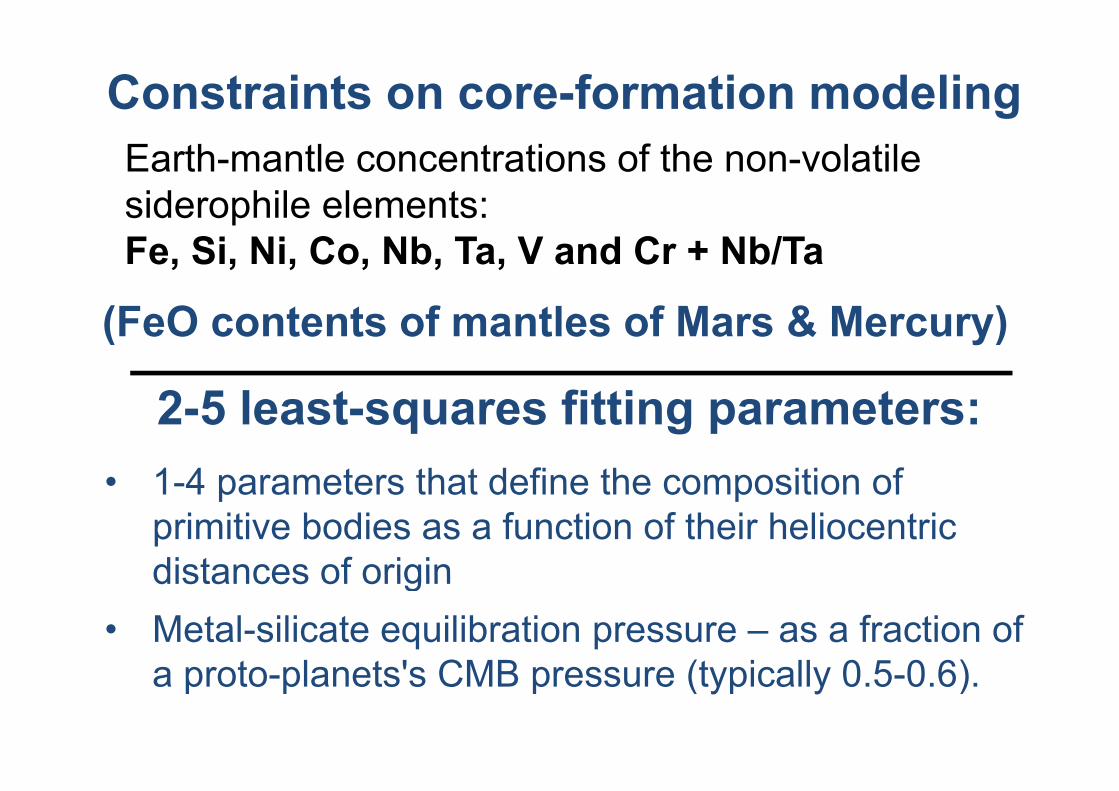
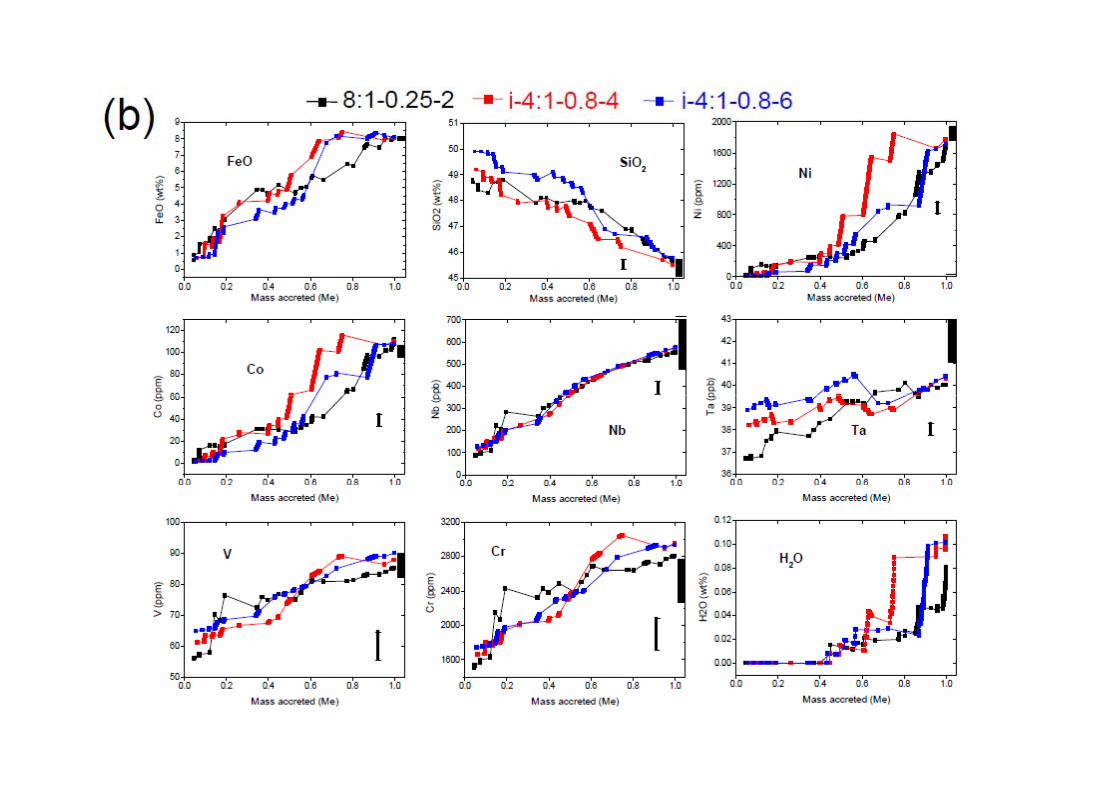
Constraints on core-formation modelingEarth-mantle concentrations of the non-volatile siderophile elements:siderophile elements: Fe, Si, Ni, Co, Nb, Ta, V and Cr + Nb/Ta
(F O f l f M & M )(FeO contents of mantles of Mars & Mercury)
2 5 l t fitti t2-5 least-squares fitting parameters:• 1-4 parameters that define the composition of• 1-4 parameters that define the composition of
primitive bodies as a function of their heliocentric distances of origindistances of origin
• Metal-silicate equilibration pressure – as a fraction oft l t ' CMB (t i ll 0 5 0 6)a proto-planets's CMB pressure (typically 0.5-0.6).
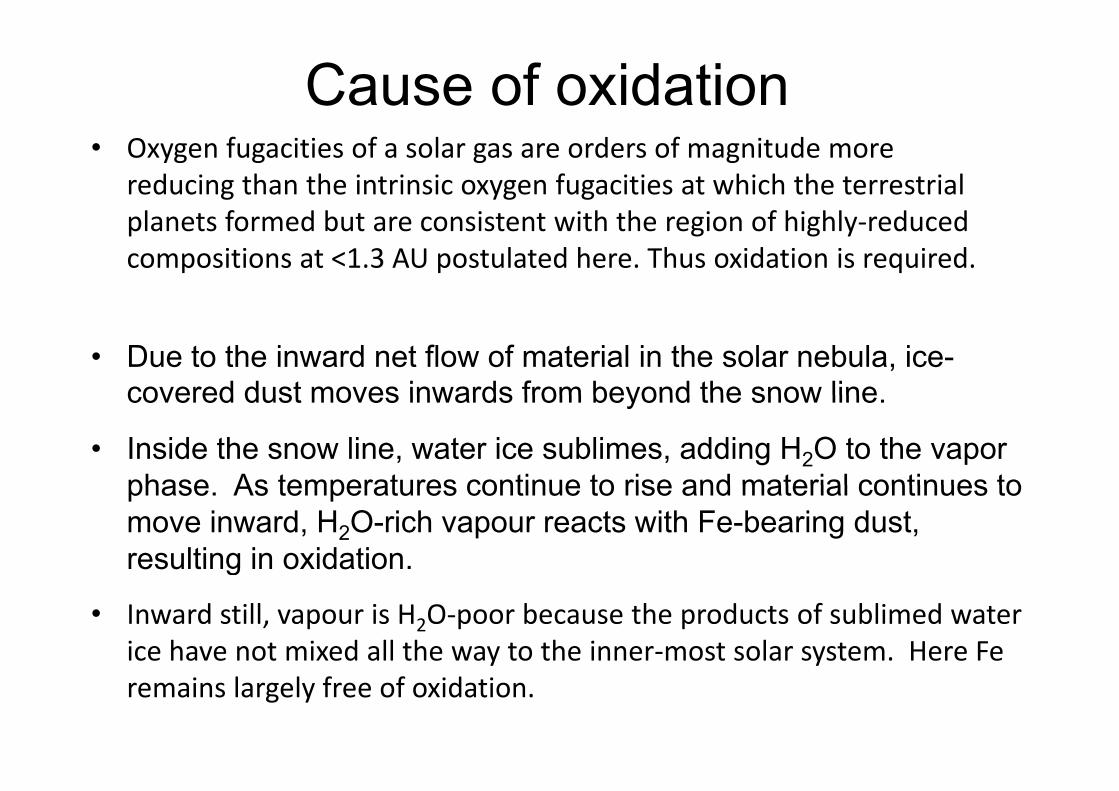
Cause of oxidation• Oxygen fugacities of a solar gas are orders of magnitude more
reducing than the intrinsic oxygen fugacities at which the terrestrial l t f d b t i t t ith th i f hi hl d dplanets formed but are consistent with the region of highly‐reduced
compositions at <1.3 AU postulated here. Thus oxidation is required.
• Due to the inward net flow of material in the solar nebula, ice-covered dust moves inwards from beyond the snow linecovered dust moves inwards from beyond the snow line.
• Inside the snow line, water ice sublimes, adding H2O to the vaporphase As temperatures continue to rise and material continues tophase. As temperatures continue to rise and material continues to move inward, H2O-rich vapour reacts with Fe-bearing dust, resulting in oxidation. g
• Inward still, vapour is H2O‐poor because the products of sublimed water ice have not mixed all the way to the inner‐most solar system. Here Fe y yremains largely free of oxidation.
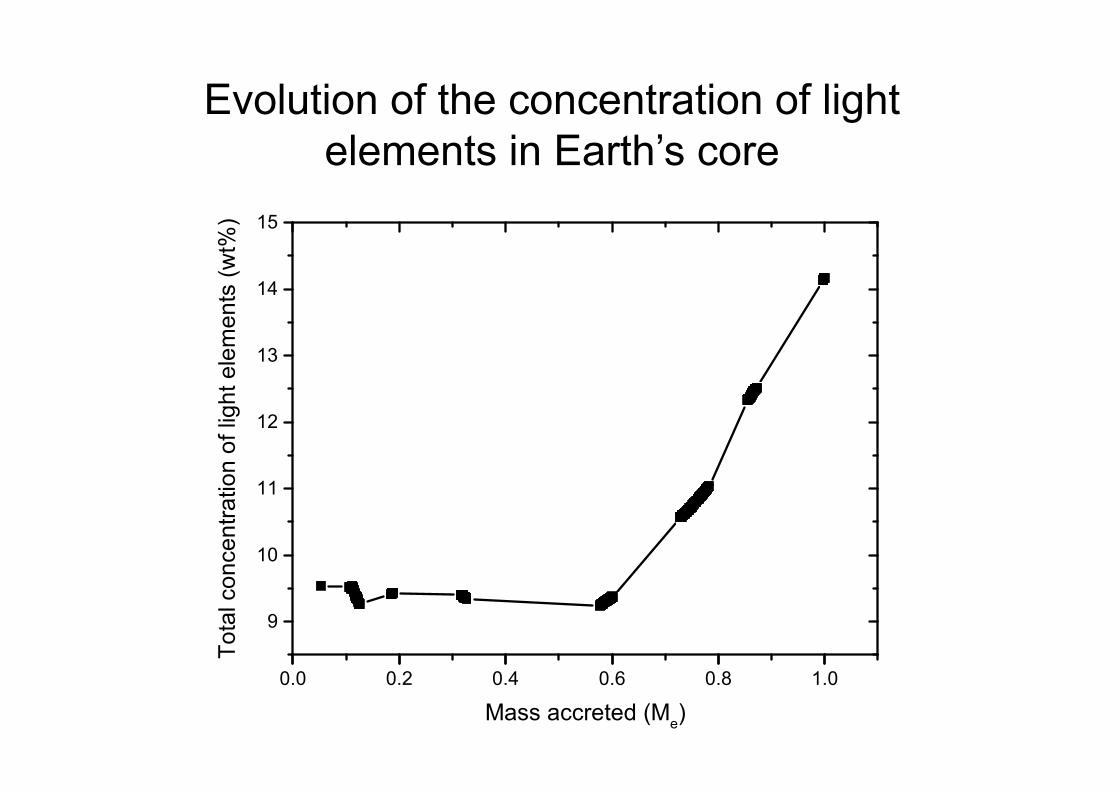
Evolution of the concentration of light elements in Earth’s core
15
14
15nt
s (w
t%)
13
ht e
lem
en
11
12
on o
f lig
h
10
11
ncen
tratio
9
Tota
l co
0.0 0.2 0.4 0.6 0.8 1.0
Mass accreted (Me)
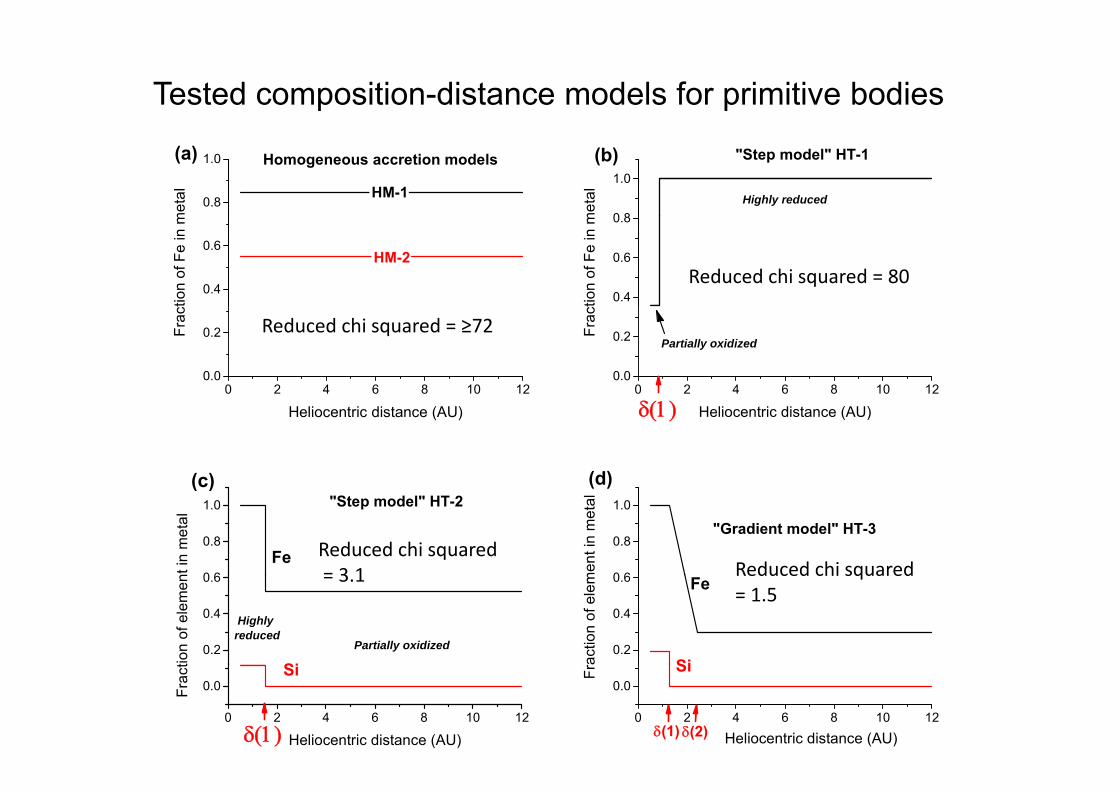
Tested composition-distance models for primitive bodies
0.8
1.0 Homogeneous accretion modelsm
etal
(a)
HM-10 8
1.0 Highly reduced
(b) "Step model" HT-1
met
al
0.4
0.6
tion
of F
e in
m
HM-2
0.4
0.6
0.8
tion
of F
e in
m
Reduced chi squared = 80
0 2 4 6 8 10 120.0
0.2Frac
t
0 2 4 6 8 10 120.0
0.2 Partially oxidized
Frac
t
Reduced chi squared = ≥72
(d)
Heliocentric distance (AU) Heliocentric distance (AU)
(c)
0 6
0.8
1.0
( )
"Gradient model" HT-3
men
t in
met
al0 6
0.8
1.0
(c)"Step model" HT-2
Fe
nt in
met
al
Reduced chi squared= 3 1 Reduced chi squared
0.2
0.4
0.6
Si
Fera
ctio
n of
ele
m
0.2
0.4
0.6
Partially oxidized
Highly reduced
Sition
of e
lem
en = 3.1 Reduced chi squared = 1.5
0 2 4 6 8 10 12
0.0SiFr
Heliocentric distance (AU)(1) (2)0 2 4 6 8 10 12
0.0Si
Frac
t
Heliocentric distance (AU)
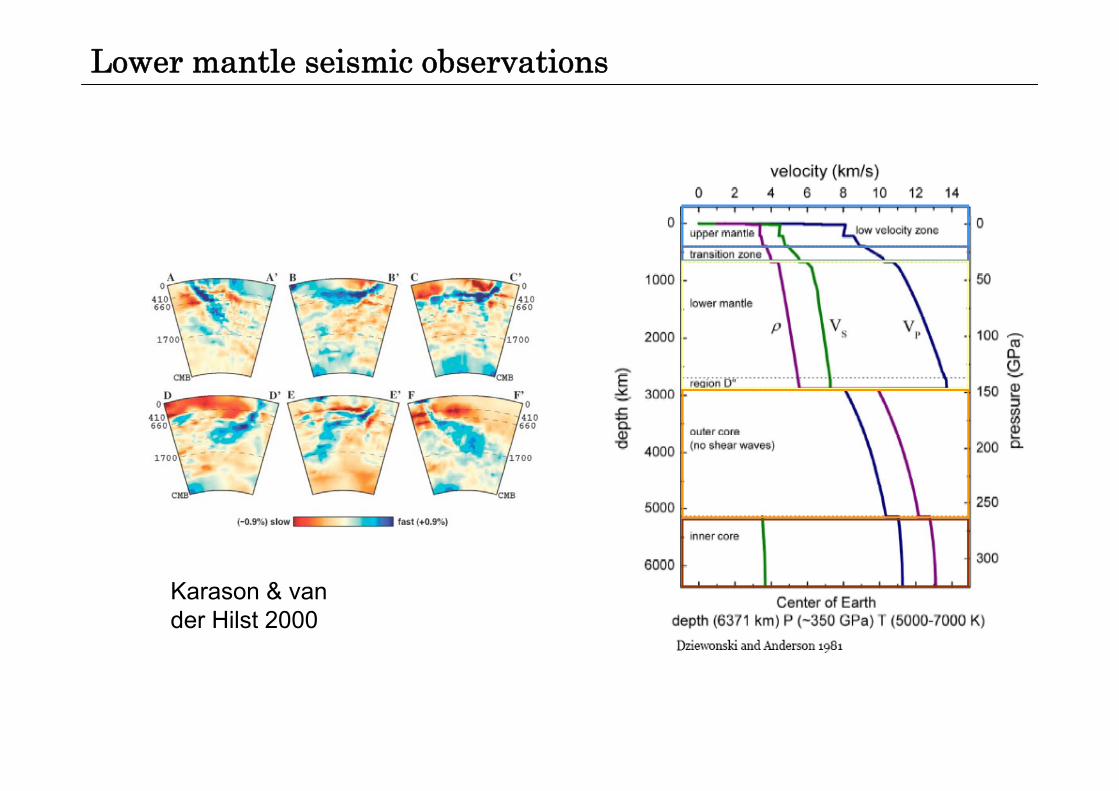
Lower mantle seismic observations
Karason & van der Hilst 2000
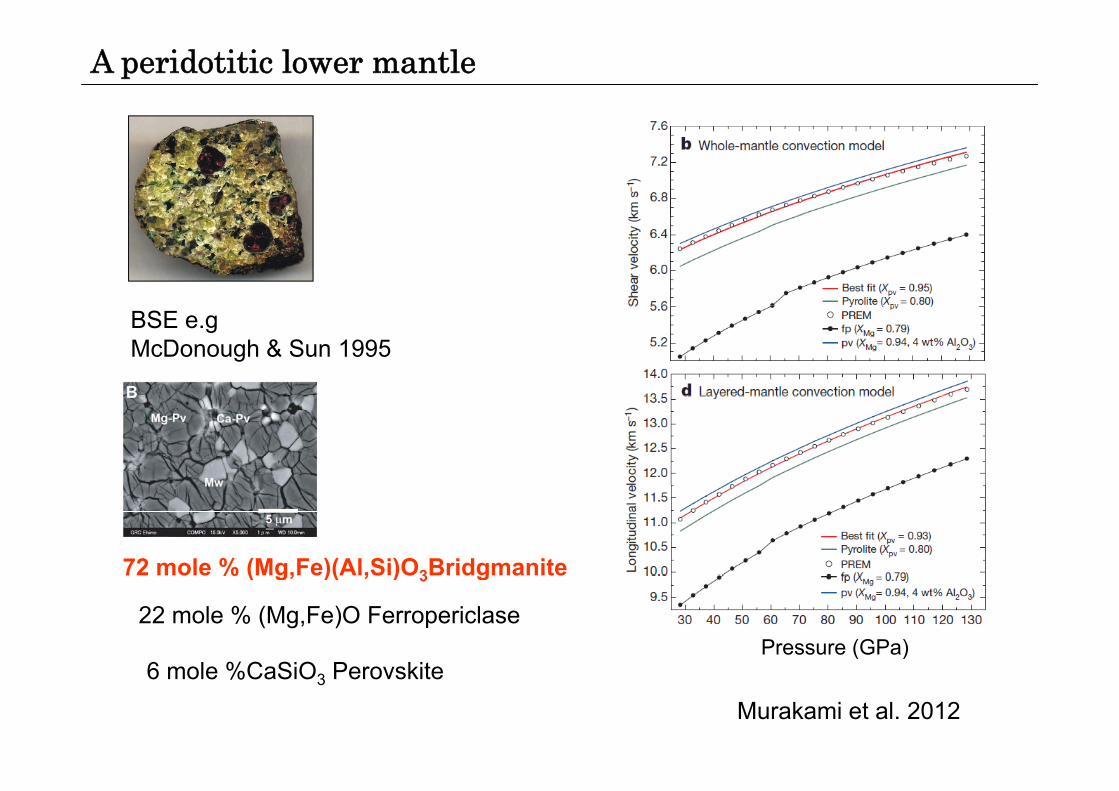
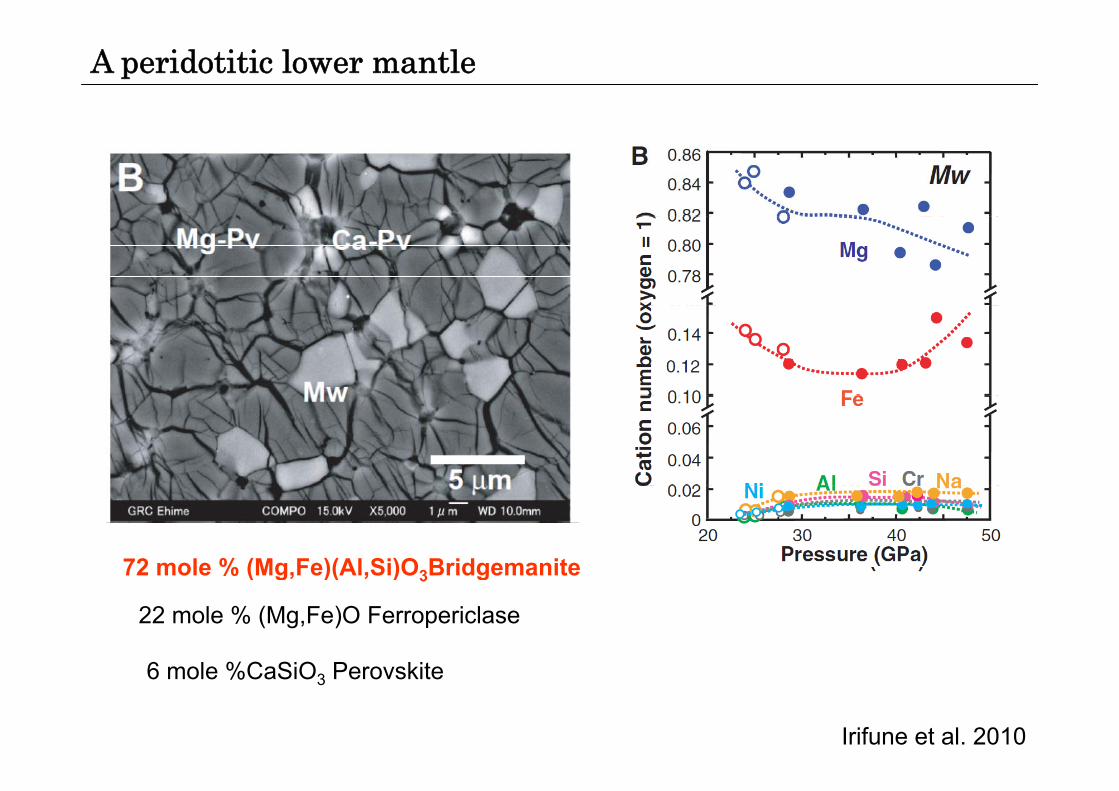
A peridotitic lower mantle
BSE e.gMcDonough & Sun 1995
72 mole % (Mg,Fe)(Al,Si)O3Bridgmanite
Pressure (GPa)6 l %C SiO P kit
22 mole % (Mg,Fe)O Ferropericlase
72 mole % (Mg,Fe)(Al,Si)O3Bridgmanite
Murakami et al. 2012
6 mole %CaSiO3 Perovskite
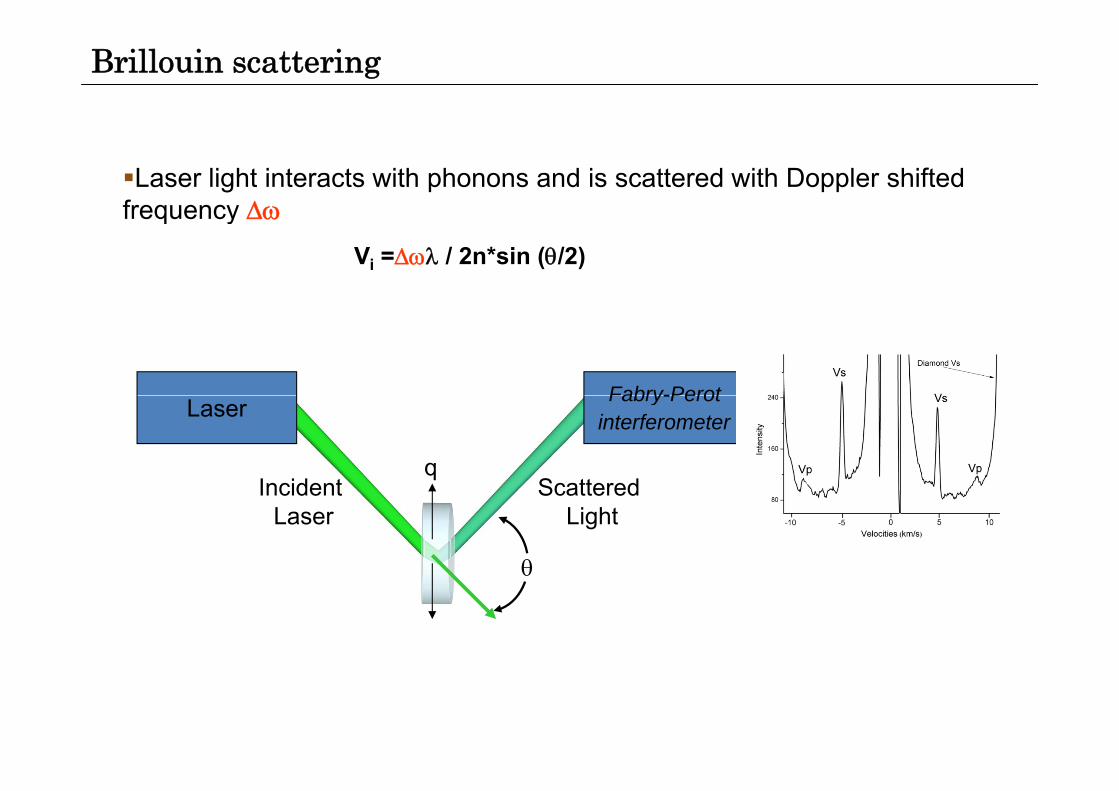
Brillouin scattering
Laser light interacts with phonons and is scattered with Doppler shifted frequency frequency
Vi = / 2n*sin (/2)
Fabry-Perot
qIncident Scattered
Laser Fabry-Perot interferometer
Incident Laser
Scattered Light
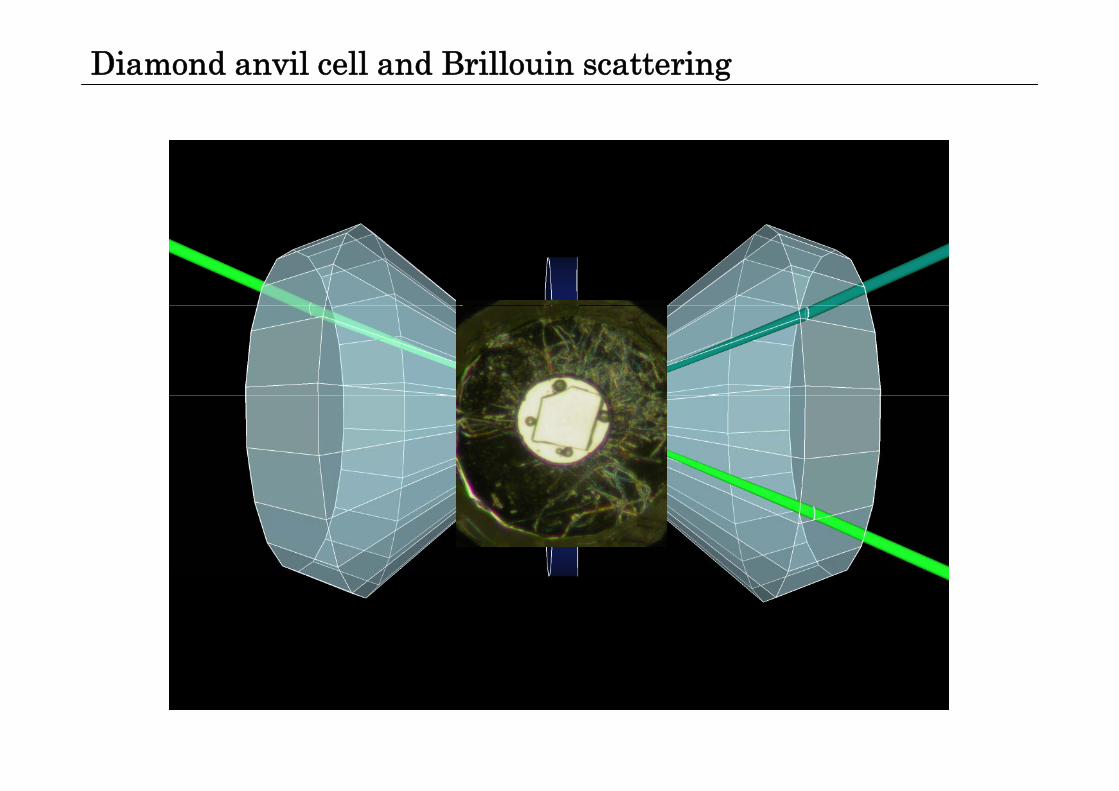
Diamond anvil cell and Brillouin scattering
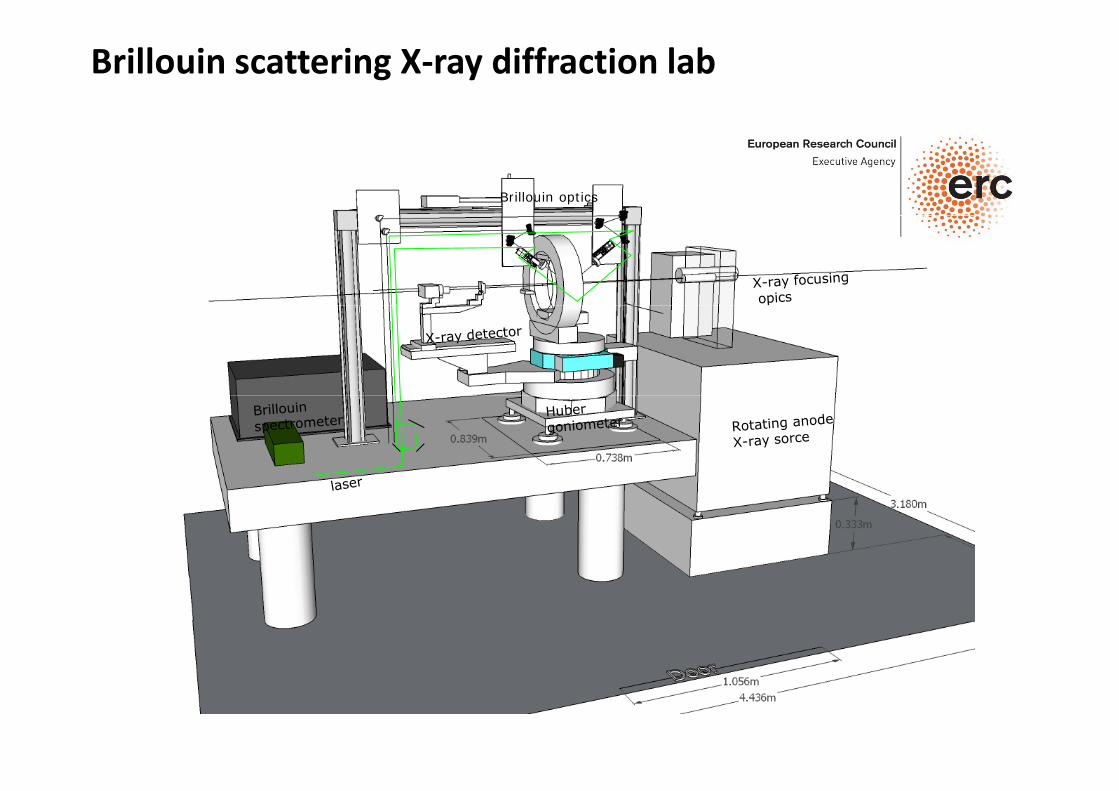
Brillouin scattering X‐ray diffraction lab
Brillouin optics
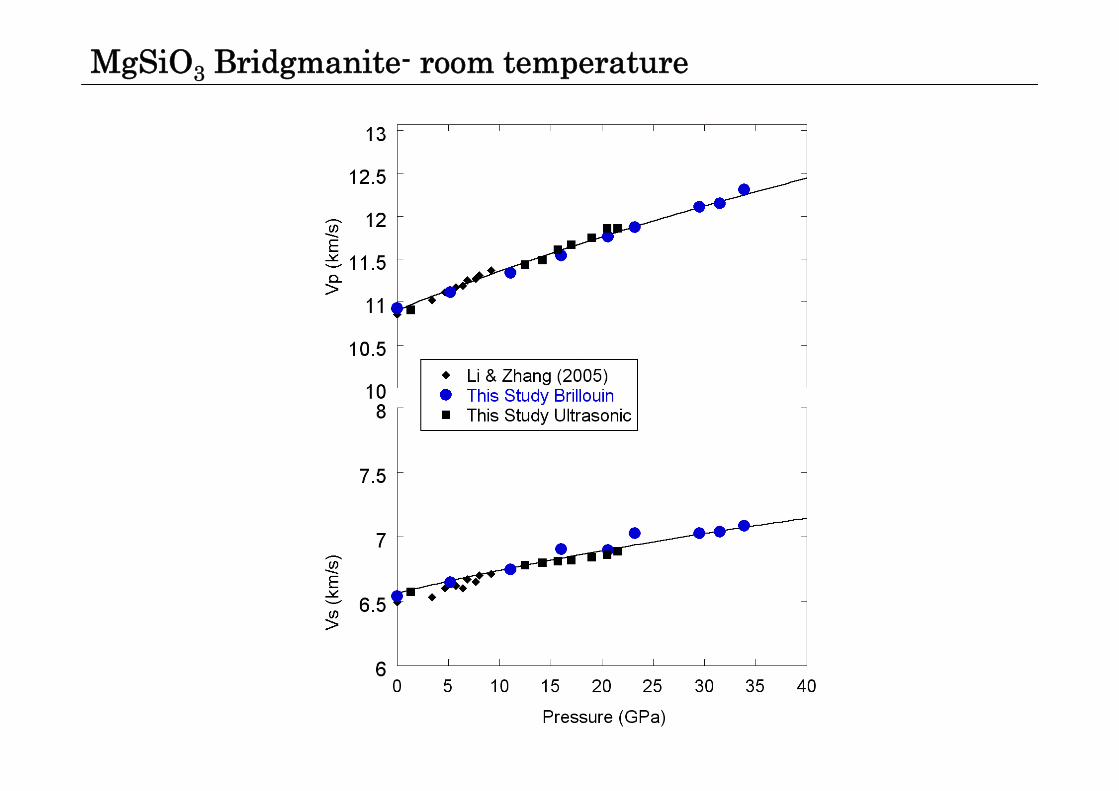
MgSiO3 Bridgmanite- room temperature
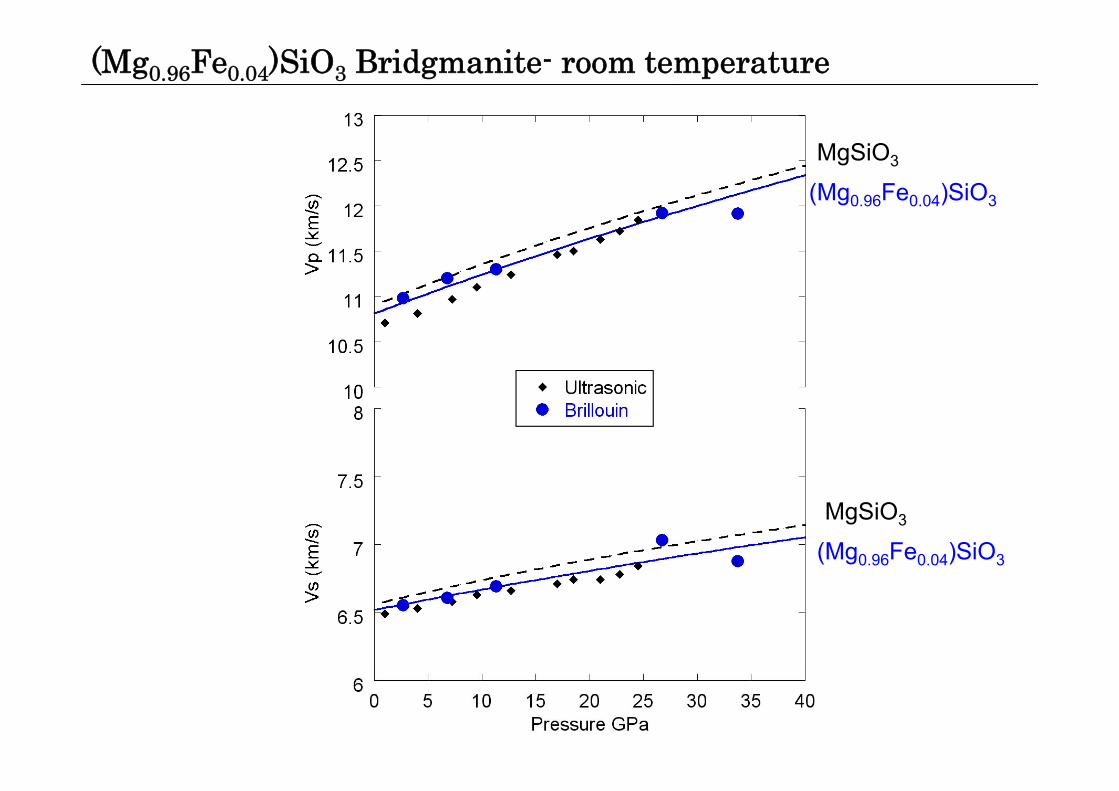
(Mg0.96Fe0.04)SiO3 Bridgmanite- room temperature
MgSiO3
(Mg0.96Fe0.04)SiO3
MgSiO3
(Mg0.96Fe0.04)SiO3
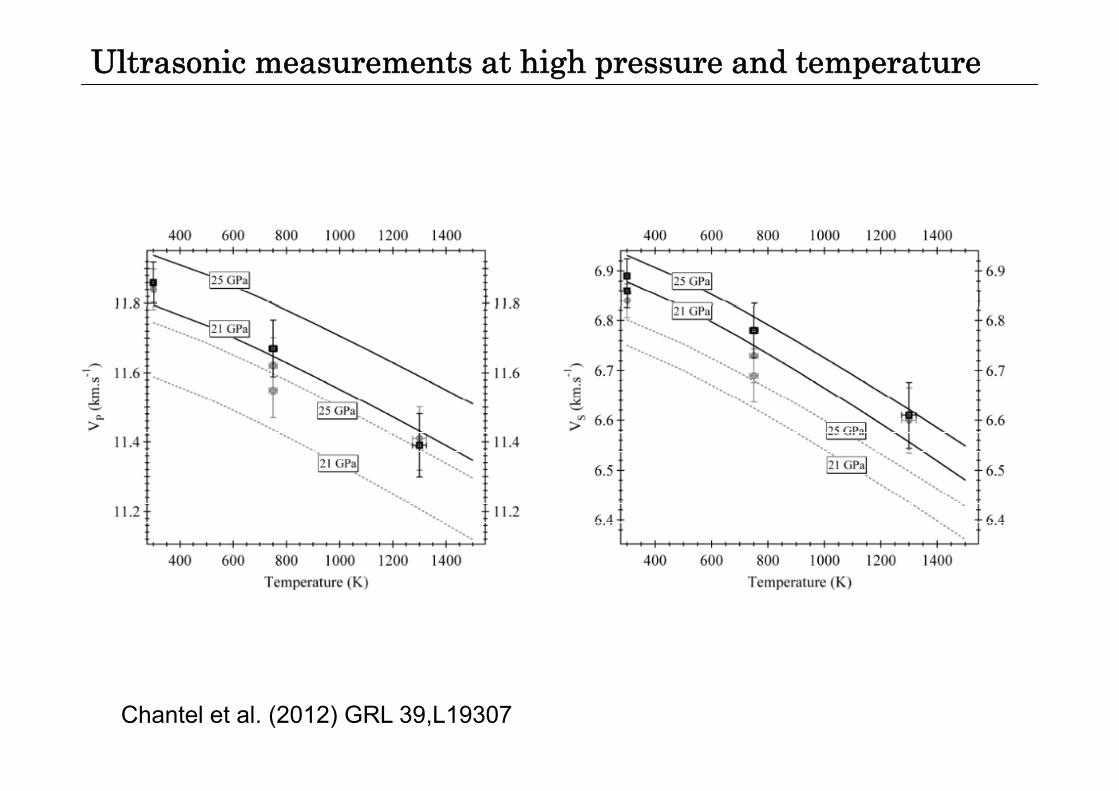
Ultrasonic measurements at high pressure and temperature
Chantel et al. (2012) GRL 39,L19307
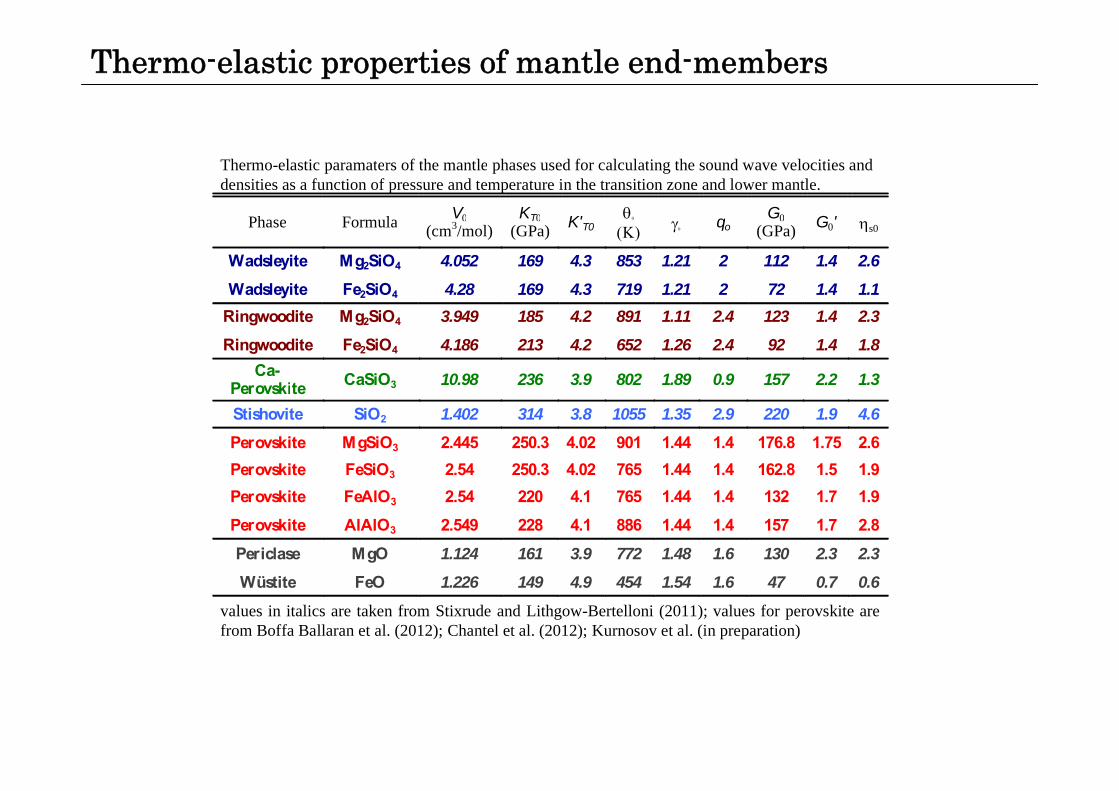
Thermo-elastic properties of mantle end-members
Thermo-elastic paramaters of the mantle phases used for calculating the sound wave velocities and densities as a function of pressure and temperature in the transition zone and lower mantle.
h l V0 KT0 K' G0 G 'Phase Formula V0(cm3/mol)
KT0(GPa) K'T0
qoG0
(GPa) G0' s0
Wadsleyite Mg2SiO4 4.052 169 4.3 853 1.21 2 112 1.4 2.6 Wadsleyite Fe2SiO4 4.28 169 4.3 719 1.21 2 72 1.4 1.1
Ringwoodite Mg2SiO4 3.949 185 4.2 891 1.11 2.4 123 1.4 2.3 Ringwoodite Fe2SiO4 4.186 213 4.2 652 1.26 2.4 92 1.4 1.8
Ca-Perovskite CaSiO3 10.98 236 3.9 802 1.89 0.9 157 2.2 1.3
Stishovite SiO2 1.402 314 3.8 1055 1.35 2.9 220 1.9 4.6 Perovskite MgSiO3 2.445 250.3 4.02 901 1.44 1.4 176.8 1.75 2.6 Perovskite FeSiO3 2.54 250.3 4.02 765 1.44 1.4 162.8 1.5 1.9 Perovskite FeAlO3 2.54 220 4.1 765 1.44 1.4 132 1.7 1.9 Perovskite AlAlO3 2.549 228 4.1 886 1.44 1.4 157 1.7 2.8 Periclase MgO 1.124 161 3.9 772 1.48 1.6 130 2.3 2.3 Wüstite FeO 1.226 149 4.9 454 1.54 1.6 47 0.7 0.6
values in italics are taken from Stixrude and Lithgow-Bertelloni (2011); values for perovskite are from Boffa Ballaran et al. (2012); Chantel et al. (2012); Kurnosov et al. (in preparation)
A peridotitic lower mantle
72 mole % (Mg,Fe)(Al,Si)O3Bridgemanite
6 l %C SiO P kit
22 mole % (Mg,Fe)O Ferropericlase
72 mole % (Mg,Fe)(Al,Si)O3Bridgemanite
6 mole %CaSiO3 Perovskite
Irifune et al. 2010
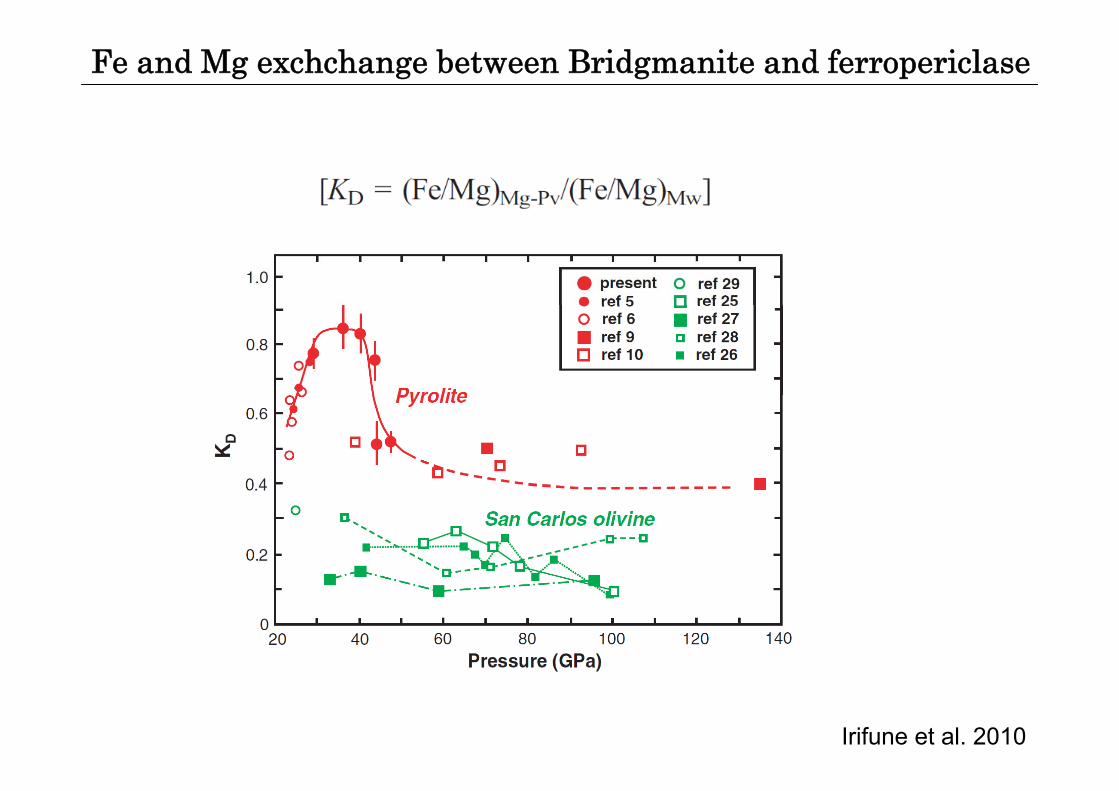
Fe and Mg exchchange between Bridgmanite and ferropericlase
Irifune et al. 2010
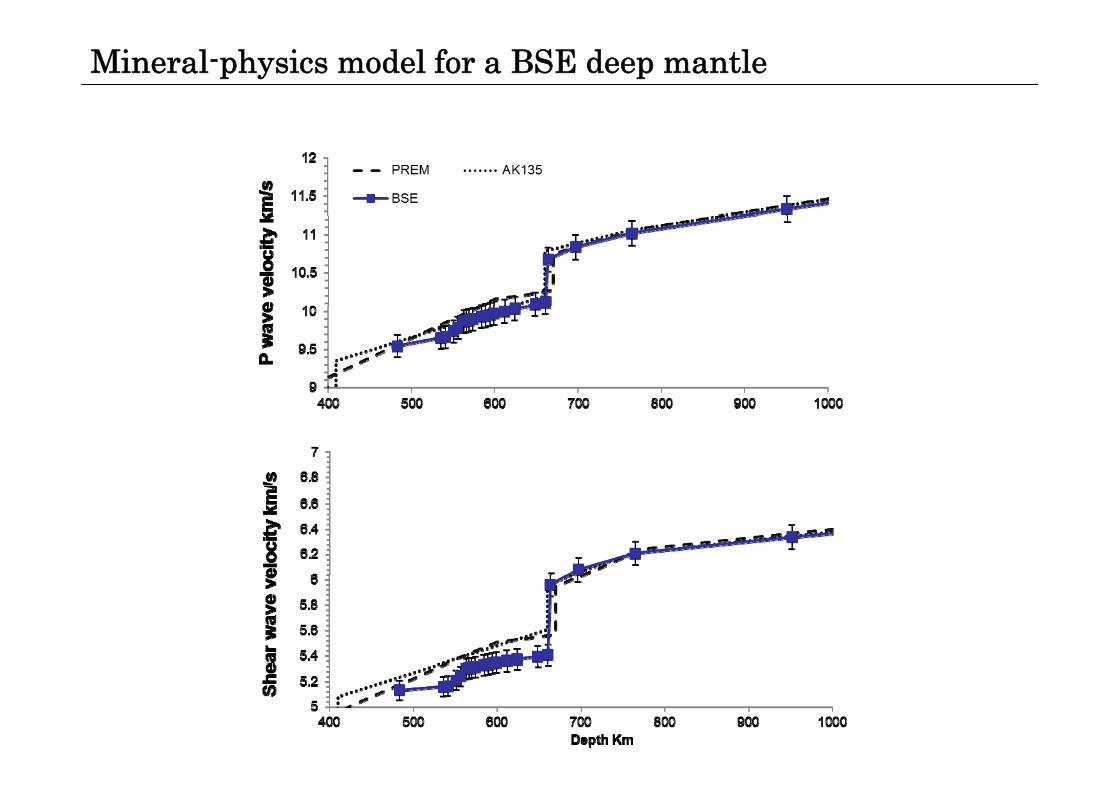
Mineral-physics model for a BSE deep mantle
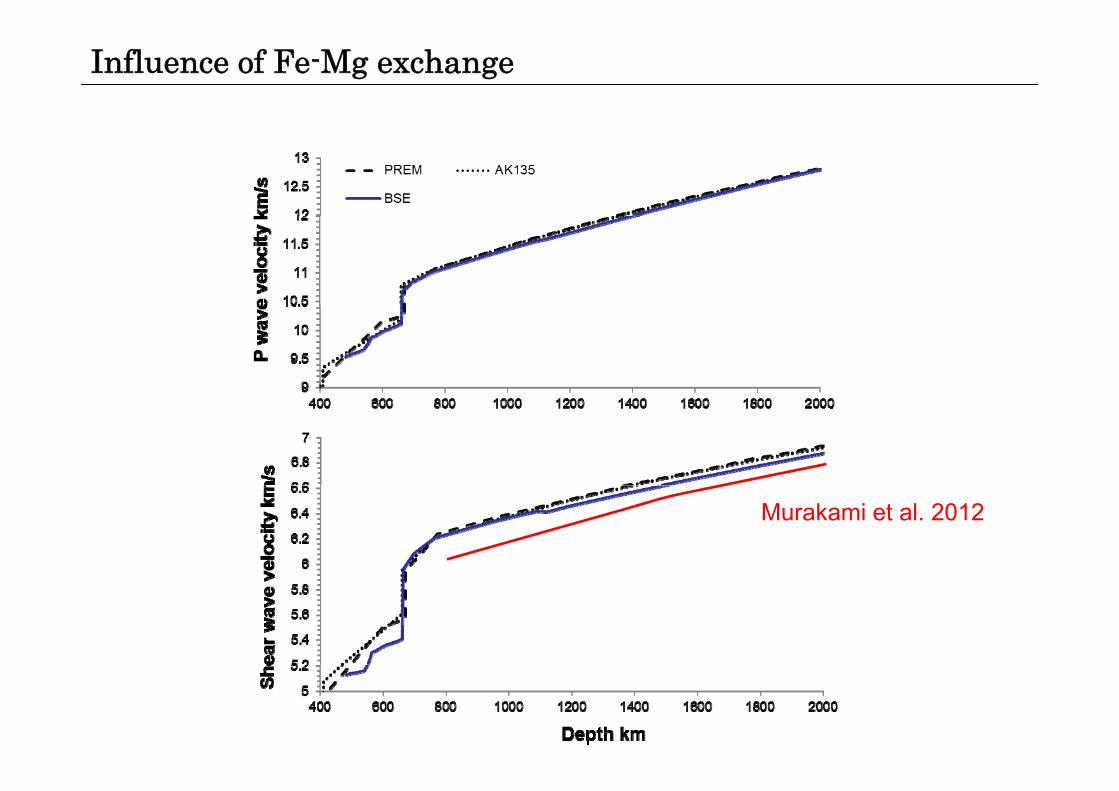
Influence of Fe-Mg exchange
Murakami et al. 2012
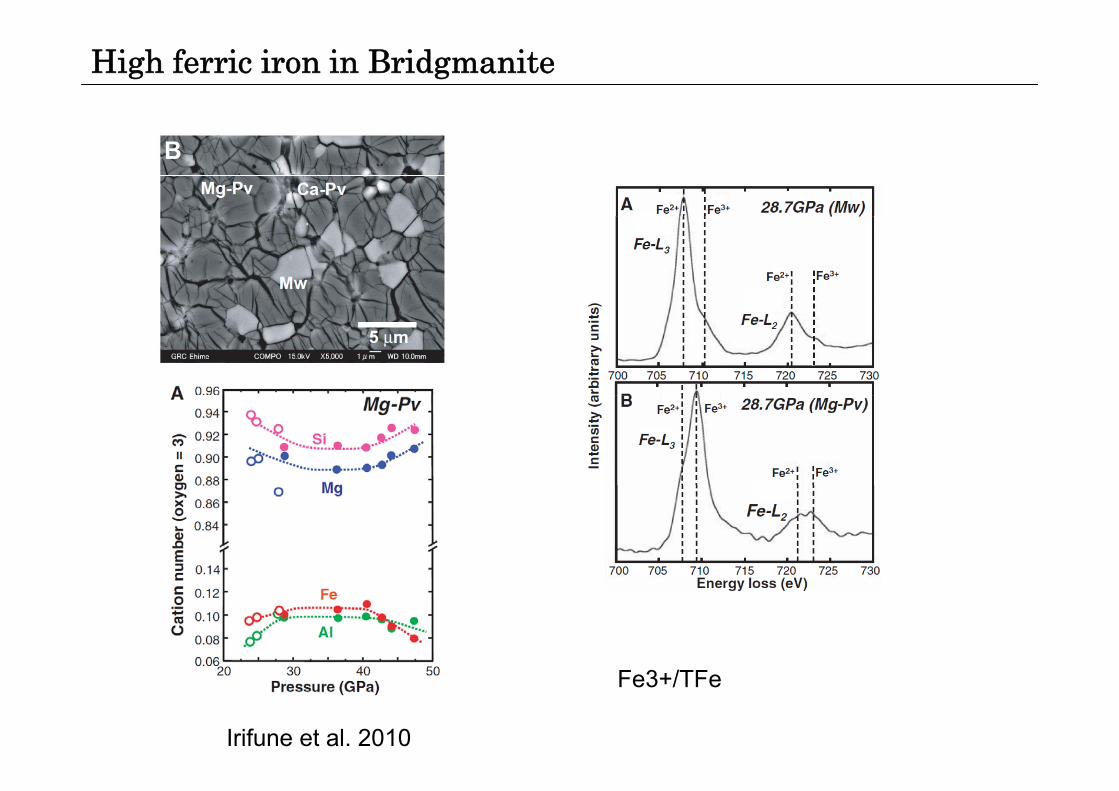
High ferric iron in Bridgmanite
Irifune et al. 2010
Fe3+/TFe
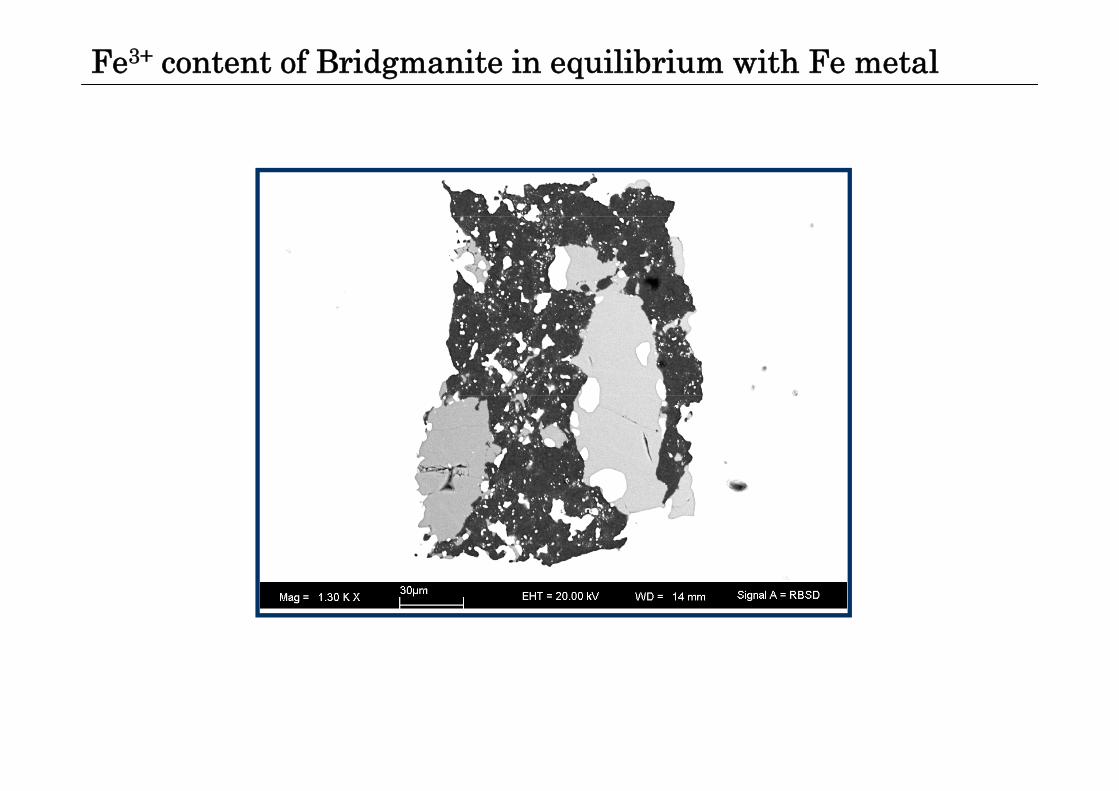
Fe3+ content of Bridgmanite in equilibrium with Fe metal
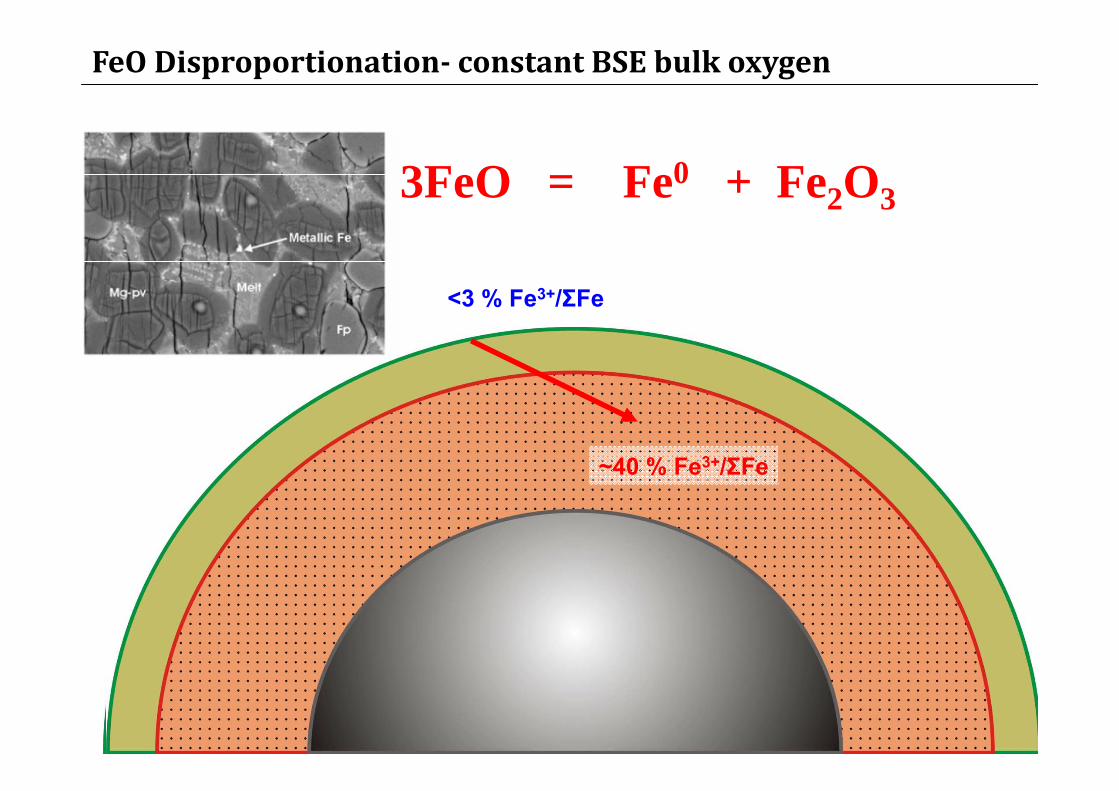
FeODisproportionation‐ constantBSEbulkoxygen
3FeO = Fe0 + Fe2O3
<3 % Fe3+/ΣFe3 % Fe /ΣFe
~40 % Fe3+/ΣFe
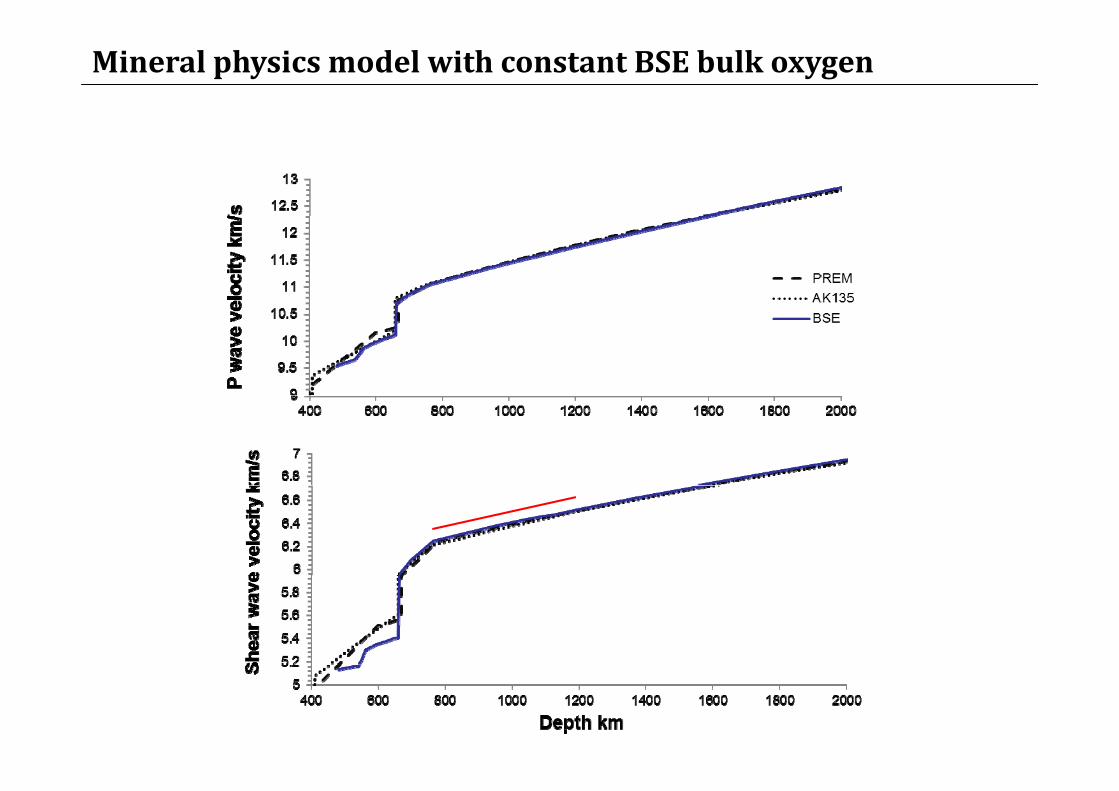
MineralphysicsmodelwithconstantBSEbulkoxygen
Summary
- This model does not include Al in perovskite- however previous ultrasonic measurments indicate a limited influence which is currently being tested with Brillouin measurments.
V d V ti t d f BSE iti i l bl i th t 1000 k f- Vs and Vp estimated for a BSE composition mineral assemblage in the top 1000 km of the lower mantle match seimsic observations.
- Seismic properties of LLSVPs do not match Fe enrichment in a perovskite dominated i l blmineral assemblage.
Conclusions• Combining N-body accretion and core formation modeling
provides new constraints on both processes.
• Accretion of Earth and Venus was heterogeneous• For Earth, Mars and Venus, excellent results are obtained when embryos and planetesimals
that form close to the Sun, at <1‐1.5 AU, are highly reduced and bodies that form further from the Sun are partially‐ to fully‐oxidized. Other composition‐distance models fail badly.
• H2O‐bearing bodies in the SA154_767 model originate at >8.5 AU and result in ~1000 ppm H2O in the mantle
• Results are based on impactor cores equilibrating completely, but with a very limited fraction of a proto‐planet′s mantle at average pressures of 50‐60% of CMB pressuresfraction of a proto‐planet s mantle, at average pressures of 50‐60% of CMB pressures.

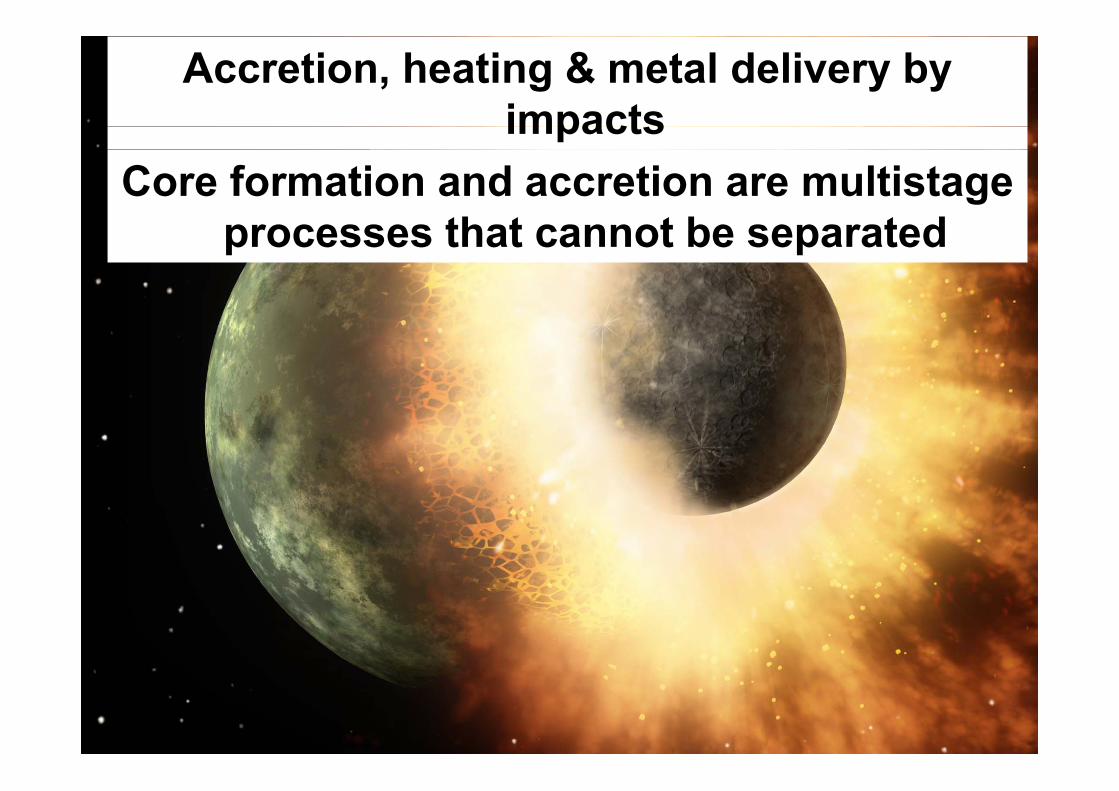
Accretion, heating & metal delivery byimpactsimpacts
Core formation and accretion are multistageprocesses that cannot be separated
Grand Tack accretion model
• Classical models (e g O'Brien et al 2006)• Classical models (e.g. O Brien et al 2006) consistently result in a model Mars that ist itoo massive
• The Grand Tack model (Walsh et al., 2011) ( , )is based on the inward and then outwardmigration of Jupiter and Saturn thatmigration of Jupiter and Saturn thattruncates the planetesimal disk at ~1 AU and
lt i li ti ll ll f Mresults in a realistically small mass for Mars.
Modeling planetary accretiong p y• Late stage accretion of terrestrial planets is
modeled using "N body simulations" Themodeled using N-body simulations . The "Grand Tack" model (Walsh et al., 2011) has been especially successful in reproducing thebeen especially successful in reproducing the small size of Mars.
• Start with ~40 embryos (0.07 Me) and ~1500 l l ( ) llplanetesimals (0.0003‐0.0035 Me), initially
dispersed between 0.7 AU and 13 AU, and collide/accrete to form larger bodies.
• Combine core mantle differentiation with N body• Combine core‐mantle differentiation with N‐body accretion models
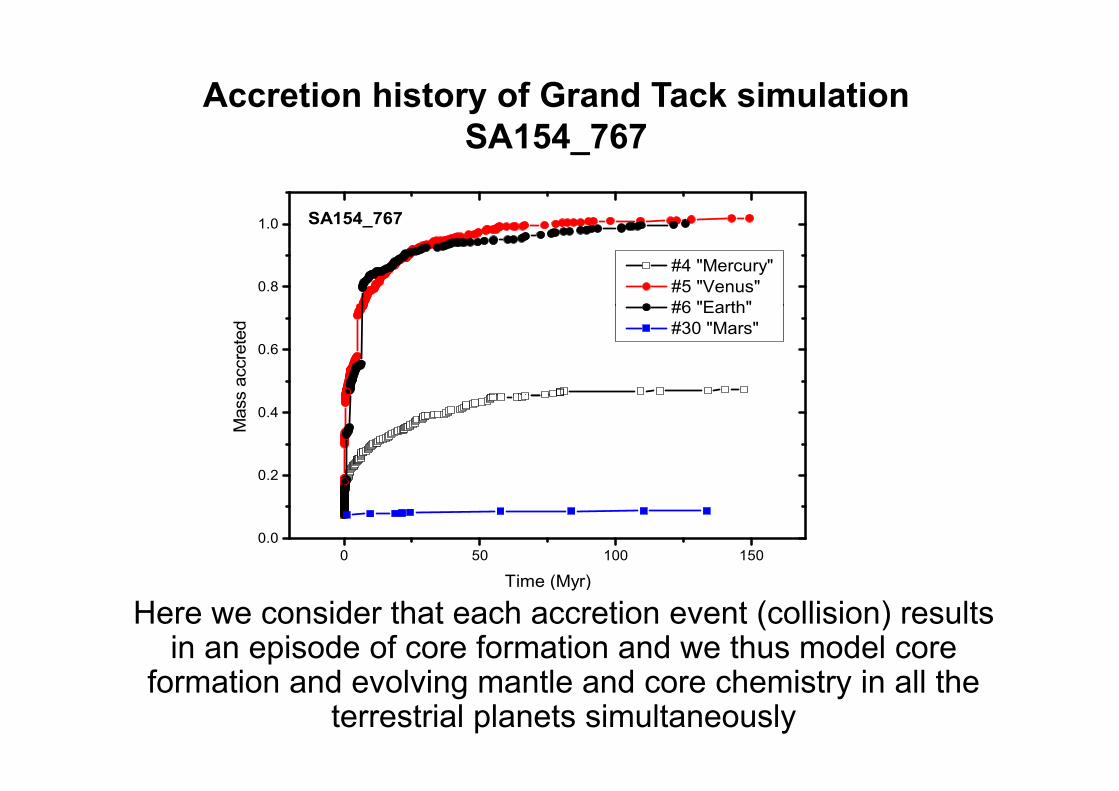
Accretion history of Grand Tack simulation SA154 767SA154_767
SA154 767
0.8
1.0 SA154_767
#4 "Mercury" #5 "Venus"#6 "Earth"
0.6
s ac
cret
ed
#6 Earth #30 "Mars"
0.2
0.4
Mas
s
0 50 100 1500.0
Ti (M )Time (Myr)
Here we consider that each accretion event (collision) results in an episode of core formation and we thus model core
formation and evolving mantle and core chemistry in all the terrestrial planets simultaneously
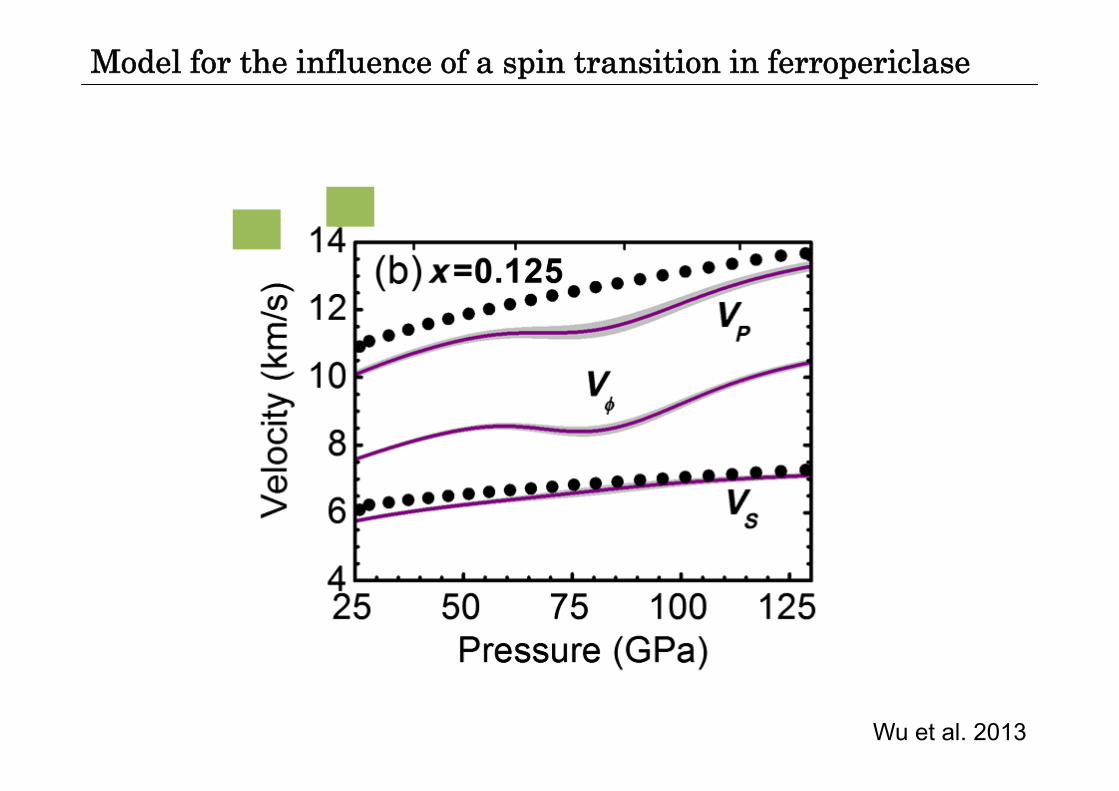
Model for the influence of a spin transition in ferropericlase
Wu et al. 2013