PLAN to play 2016 Metro Parks and Greenways Master · PDF file · 2016-10-182016...
73
2016 Metro Parks and Greenways Master Plan October 2016 Public Meeting No. 2 PLAN to play
Transcript of PLAN to play 2016 Metro Parks and Greenways Master · PDF file · 2016-10-182016...
2016 Metro Parks and Greenways
Master Plan
October 2016 Public Meeting No. 2
PLAN toplay
SUPPORTING PROJECT PARTNERS
METRO PARKS AND GREENWAYS MASTER PLAN 2016
Agenda
Hawkins Partners
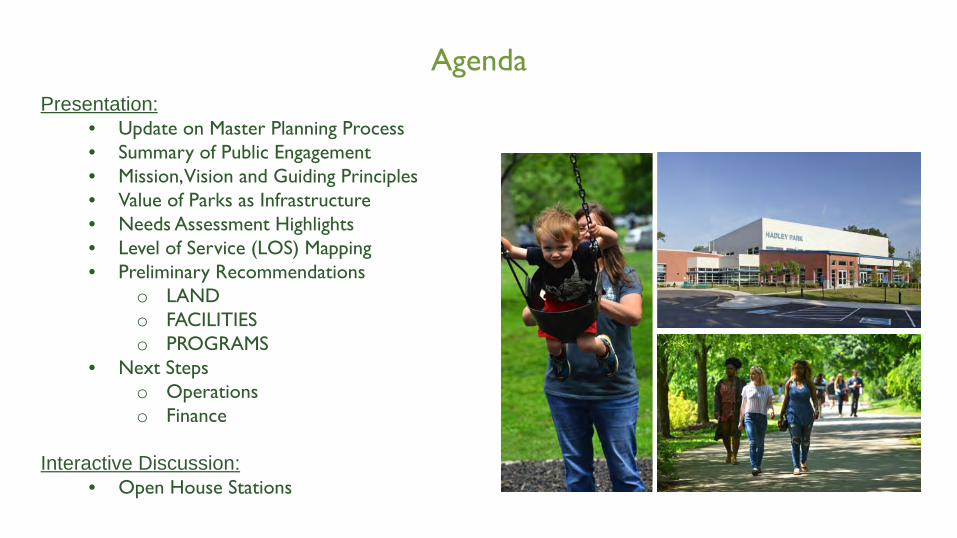
of the residents Presentation: • Update on Master Planning Process • Summary of Public Engagement • Mission, Vision and Guiding Principles • Value of Parks as Infrastructure • Needs Assessment Highlights • Level of Service (LOS) Mapping • Preliminary Recommendations
o LAND o FACILITIES o PROGRAMS
• Next Steps o Operations o Finance
Interactive Discussion:
• Open House Stations

MISSION, VISION, GUIDING PRINCIPLES
Mission and Vision Metro Parks
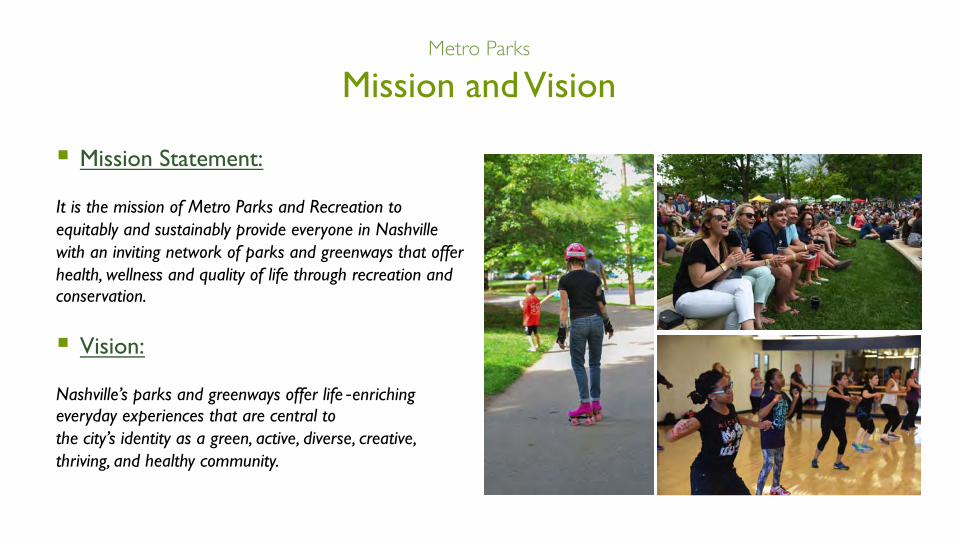
§ Mission Statement:
It is the mission of Metro Parks and Recreation to equitably and sustainably provide everyone in Nashville with an inviting network of parks and greenways that offer health, wellness and quality of life through recreation and conservation.
§ Vision: Nashville’s parks and greenways offer life‐enriching everyday experiences that are central to the city’s identity as a green, active, diverse, creative, thriving, and healthy community.
Guiding Principles Metro Parks
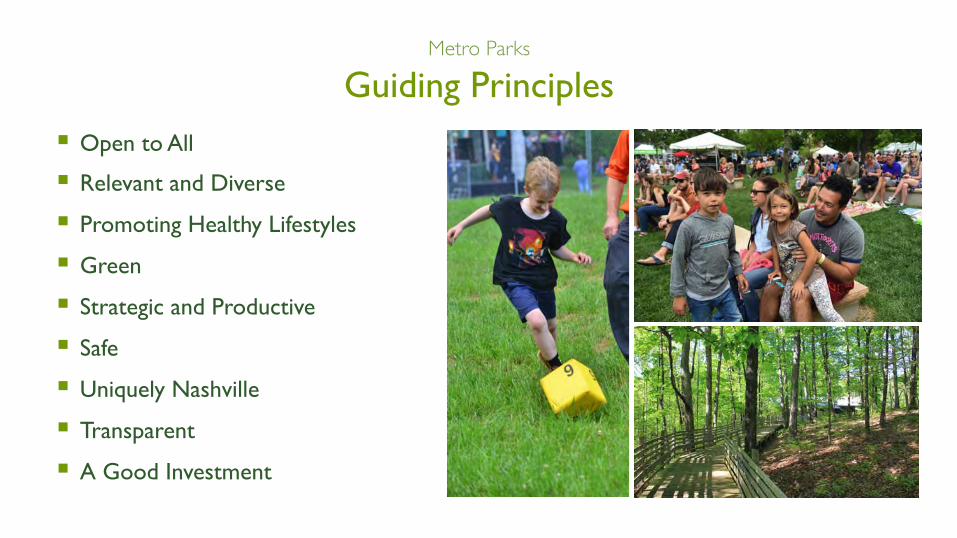
§ Open to All
§ Relevant and Diverse
§ Promoting Healthy Lifestyles
§ Green
§ Strategic and Productive
§ Safe
§ Uniquely Nashville
§ Transparent
§ A Good Investment
VALUE OF PARKS and GREENWAYS
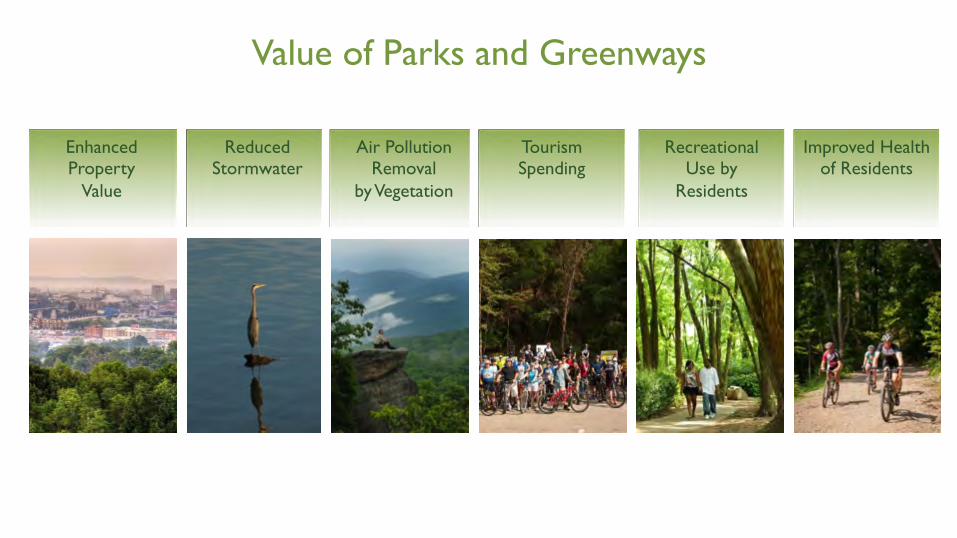
Enhanced Property
Value
Reduced Stormwater
Air Pollution Removal
by Vegetation
Tourism Spending
Improved Health of Residents
Value of Parks and Greenways
Recreational Use by
Residents
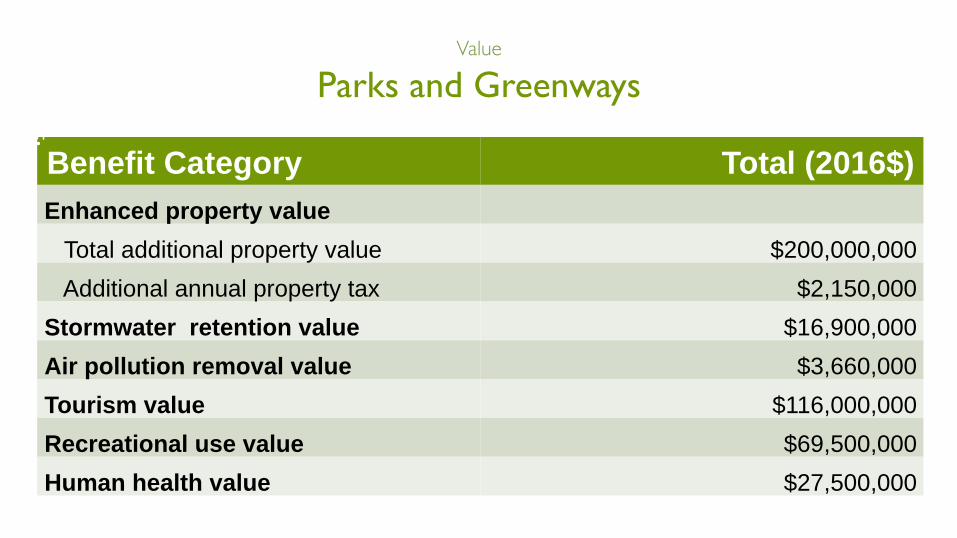
Parks and Greenways Value
Benefit Category Total (2016$) Enhanced property value Total additional property value $200,000,000 Additional annual property tax $2,150,000 Stormwater retention value $16,900,000 Air pollution removal value $3,660,000 Tourism value $116,000,000 Recreational use value $69,500,000 Human health value $27,500,000

NEEDS ASSESSMENT HIGHLIGHTS
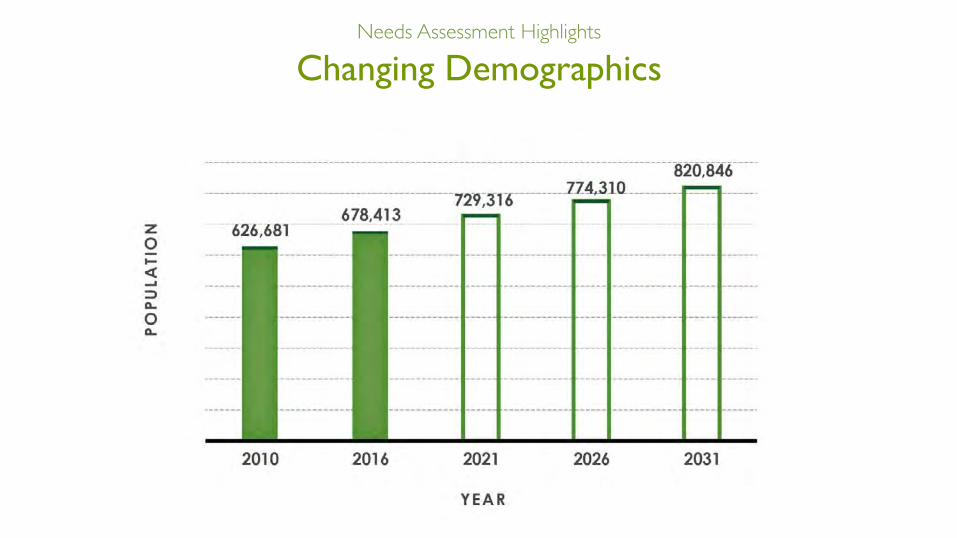
Changing Demographics Needs Assessment Highlights
§ Issues Identification q Public Meetings q Telephone and Web-based Surveys
§ Identify Current and Projected Underserved Areas of Davidson County
§ Recreation Trends Analysis
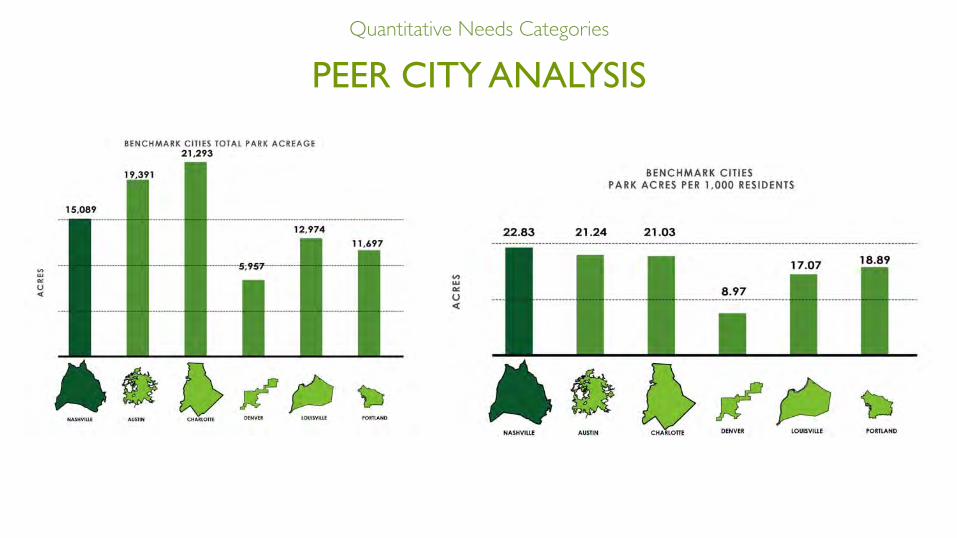
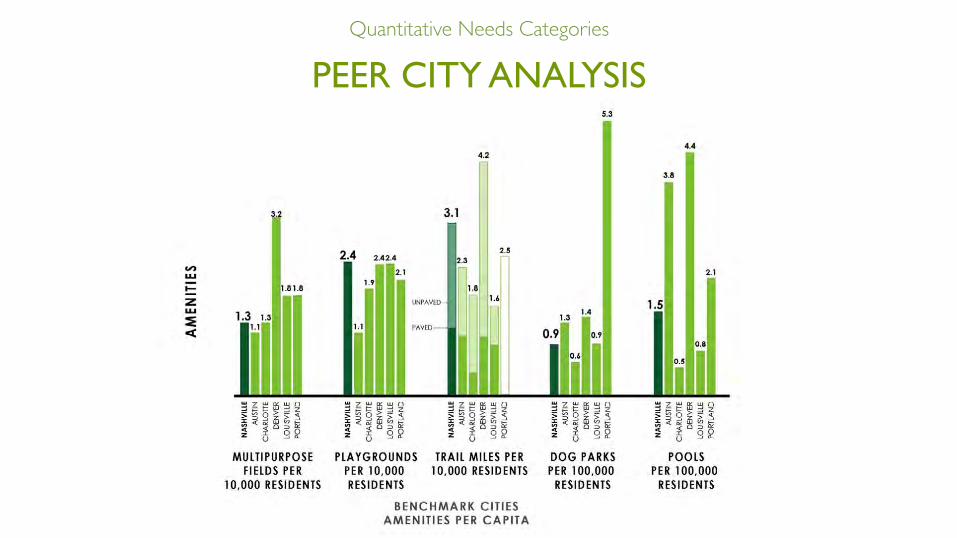
§ Peer City Benchmarking – Comparing Nashville to Other Similar U.S. cities
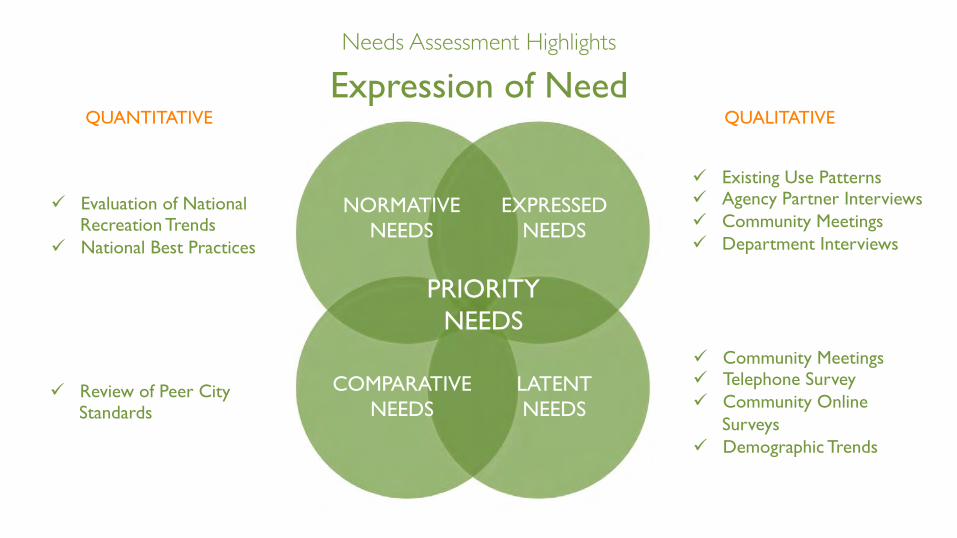
Expression of Need Needs Assessment Highlights
EXPRESSED NEEDS
COMPARATIVE NEEDS
NORMATIVE NEEDS
LATENT NEEDS
PRIORITY NEEDS
ü Review of Peer City Standards
ü Evaluation of National Recreation Trends
ü National Best Practices
ü Existing Use Patterns ü Agency Partner Interviews ü Community Meetings ü Department Interviews
ü Community Meetings ü Telephone Survey ü Community Online
Surveys ü Demographic Trends
QUANTITATIVE QUALITATIVE

NEEDS ASSESSMENT PUBLIC INPUT EXAMPLES
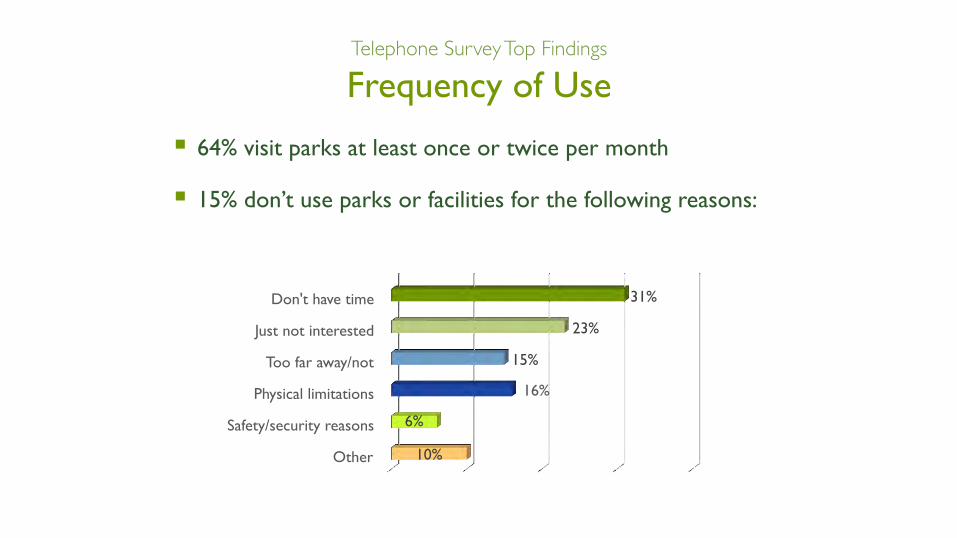
§ 64% visit parks at least once or twice per month
§ 15% don’t use parks or facilities for the following reasons:
Frequency of Use Telephone Survey Top Findings
Don't have time
Just not interested
Too far away/not
Physical limitations
Safety/security reasons
Other
31%
23%
15%
16%
6%
10%
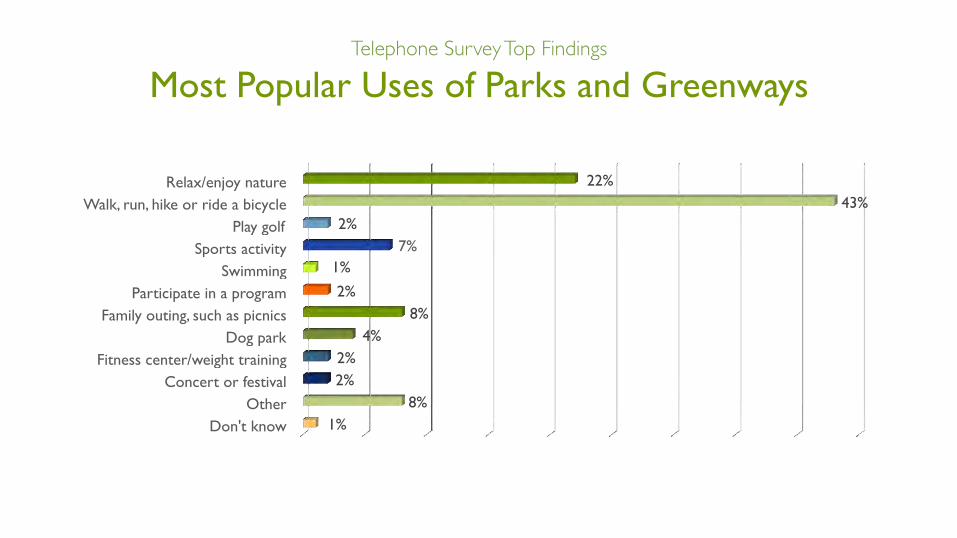
Relax/enjoy nature Walk, run, hike or ride a bicycle
Play golf Sports activity
Swimming Participate in a program
Family outing, such as picnics Dog park
Fitness center/weight training Concert or festival
Other Don't know
22% 43%
2% 7%
1%
2% 8%
4% 2% 2%
8% 1%
Most Popular Uses of Parks and Greenways Telephone Survey Top Findings
§ 21% have participated in a Parks program
§ 88% rate the quality as excellent or good.
Programs Telephone Survey Top Findings
§ 49% agree that Metro Parks should increase program fees so that specific users are paying a bigger share of costs.
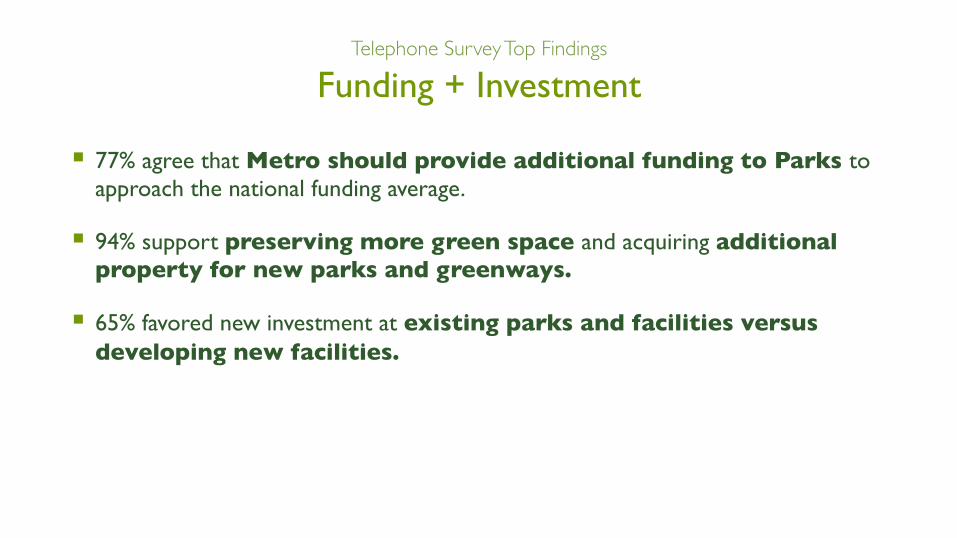
§ 77% agree that Metro should provide additional funding to Parks to approach the national funding average.
§ 94% support preserving more green space and acquiring additional property for new parks and greenways.
§ 65% favored new investment at existing parks and facilities versus developing new facilities.
Funding + Investment Telephone Survey Top Findings
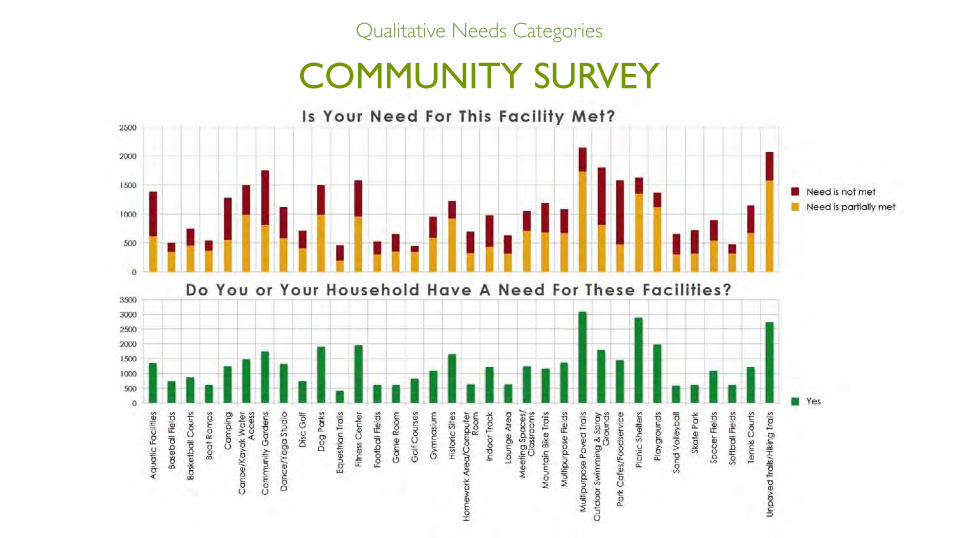
COMMUNITY SURVEY Qualitative Needs Categories
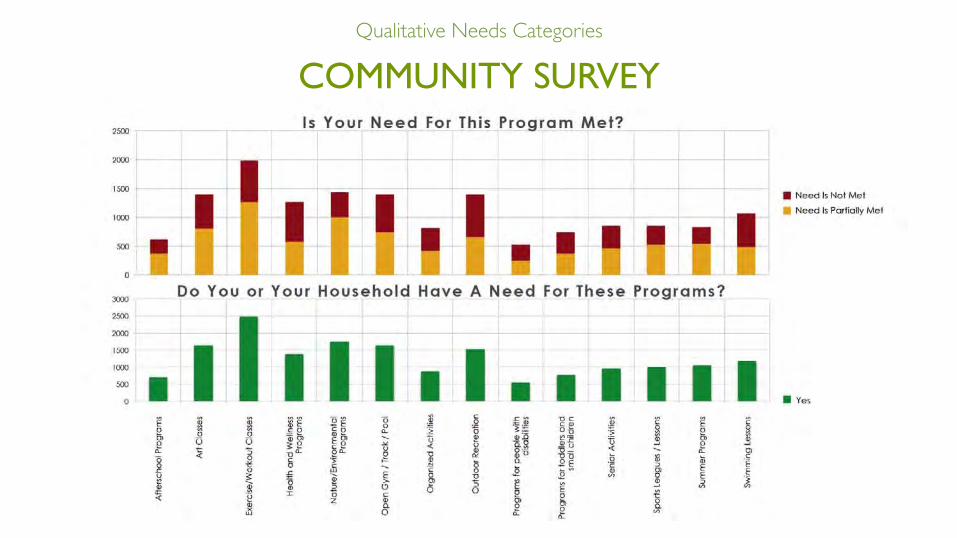
COMMUNITY SURVEY Qualitative Needs Categories
FACILITY USER SURVEYS Qualitative Needs Categories
§ 71% of respondents visit the facility weekly or daily
§ People participate most frequently:
• Walk, bike, bike, or run on trails or greenways (44%)
• Programs or classes (39%)
• Exercise / work out (29%)
§ 72% rate the quality of programs above as excellent.
§ What would they change? The top theme was to have more programs/classes offered at more times.
FACILITY USER SURVEYS Qualitative Needs Categories
§ 94% said user fees have not prohibited participating in a program.
§ 92% usually drive to the facility they visit. They said they live too far to walk or bike.
§ The 4 most important public services provided:
• Fitness, health, and wellness opportunities • Recreation opportunities
• A safe place for kids and teens
• Public education (nature classes, homework help, etc)
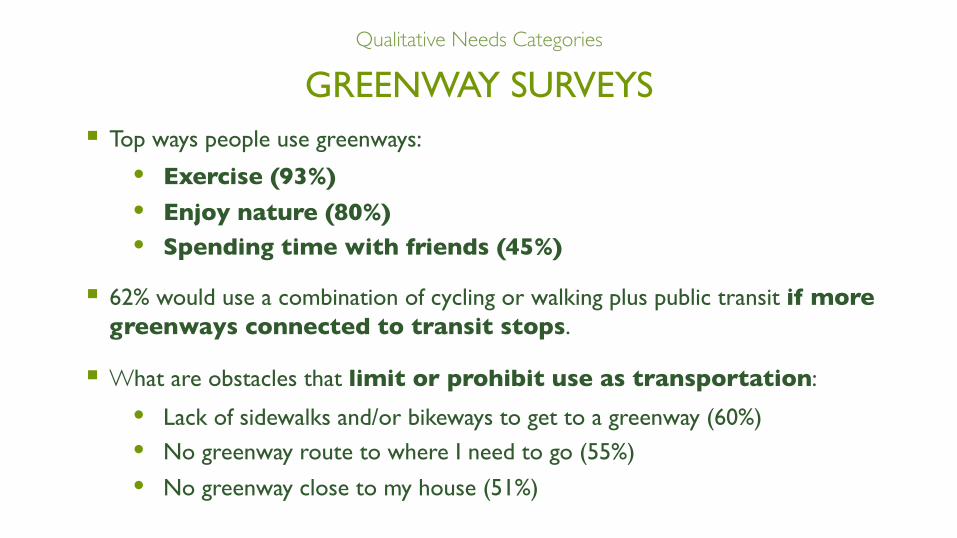
GREENWAY SURVEYS Qualitative Needs Categories
§ Top ways people use greenways:
• Exercise (93%)
• Enjoy nature (80%) • Spending time with friends (45%)
§ 62% would use a combination of cycling or walking plus public transit if more greenways connected to transit stops.
§ What are obstacles that limit or prohibit use as transportation:
• Lack of sidewalks and/or bikeways to get to a greenway (60%) • No greenway route to where I need to go (55%) • No greenway close to my house (51%)
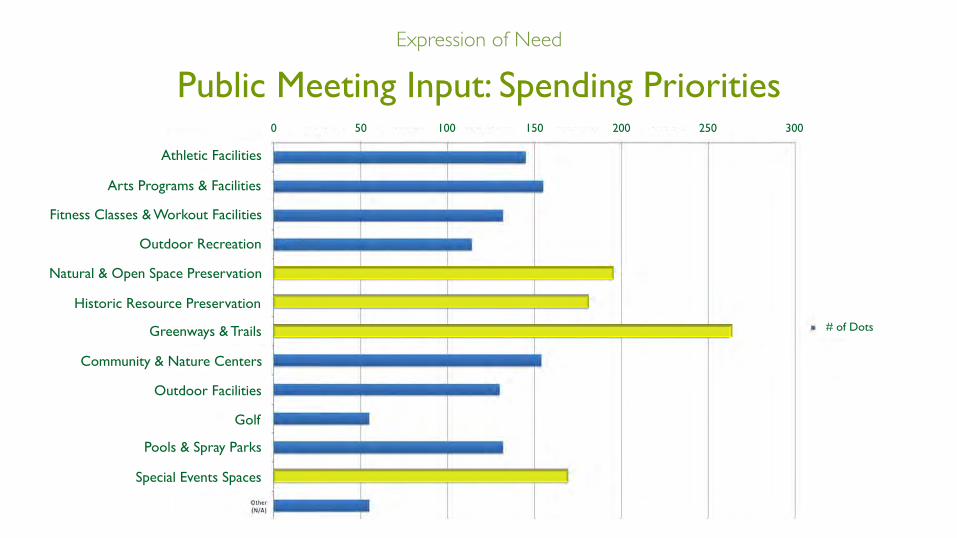
Public Meeting Input: Spending Priorities Expression of Need
Athletic Facilities
Arts Programs & Facilities
Outdoor Recreation
Fitness Classes & Workout Facilities
Natural & Open Space Preservation
Historic Resource Preservation
Greenways & Trails
Community & Nature Centers
Outdoor Facilities
Golf
Pools & Spray Parks
Special Events Spaces
50 100 150 250 200 300 0
# of Dots
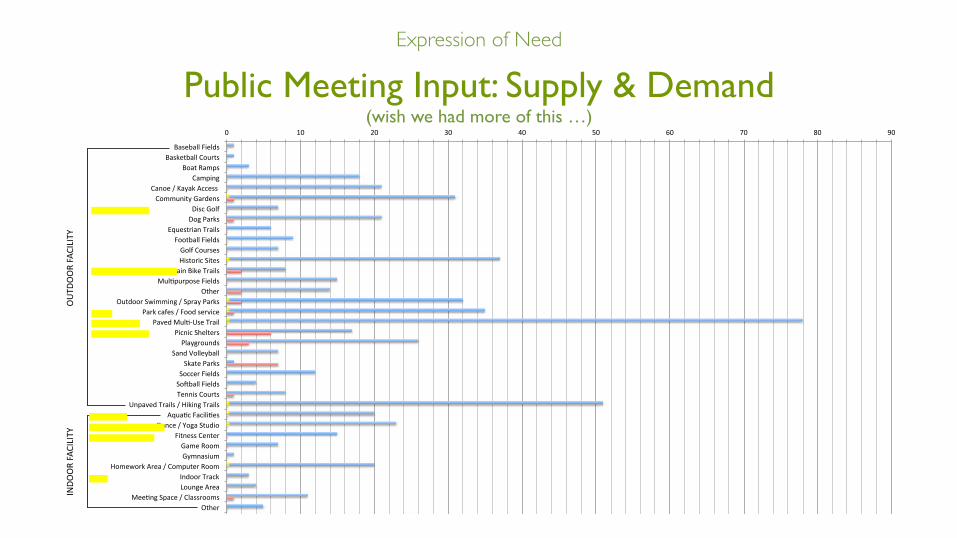
Public Meeting Input: Supply & Demand (wish we had more of this …)
PUBLIC MEETING #1 RESULTSPLAN toplay
:� ;:� <:� =:� >:� ?:� @:� A:� B:� C:�
��*���##��!�#�*���*"�+��##��&.)+*�
�&�+���$'*���$'!%��
��%&��5���2�"�����**���&$$.%!+2���)��%*�
�!*���&#���&����)"*�
�(.�*+)!�%��)�!#*��&&+��##��!�#�*��&#���&.)*�*�!*+&)!���!+�*�
&.%+�!%��!"���)�!#*� .#,'.)'&*���!�#�*�
�+ �)��.+�&&)��0!$$!%��5��')�2���)"*�
��)"�����*�5��&&��*�)/!�����/��� .#,6�*���)�!#�
�!�%!��� �#+�)*��#�2�)&.%�*�
��%���&##�2��##��"�+����)"*�
�&���)��!�#�*��&���##��!�#�*���%%!*��&.)+*�
�%'�/����)�!#*�5�!"!%���)�!#*��(.�,�����!#!,�*�
��%���5��&����+.�!&��!+%�**���%+�)���$���&&$��2$%�*!.$�
&$�0&)"��)���5��&$'.+�)��&&$�%�&&)��)��"��&.%����)���
��,%���'����5��#�**)&&$*��+ �)�
���)*� &&#��)&�)�$*��)+*��#�**�*�
�1�)�!*�5�&)"&.+��#�**�*���#+ �7���##%�**�
��+.)��5��%/!)&%$�%+�#��)&�)�$*��'�%��2$�5��)��"�5��&&#�
�)��%!3�����,/!,�*��+ �)�
�.+�&&)����)��,&%��)&�)�$*��&)��!*��#�����&'#��
�)&�)�$*��&)��&��#�)*�7��$�##�� !#�)�%���%!&)���,/!,�*�
�'&)+*�����.�*�5���**&%*��.$$�)��)&�)�$*���0!$$!%����**&%*�
������������������������������������������ �������������������
%6�������*'&%*�*�
�/�)6�.''#2���*'&%*�*�
OU
TDO
OR
FACI
LITY
INDO
OR
FACI
LITY
PRO
GRAM
PUBLIC MEETING #1 OVERALL SUMMARY: SUPPLY AND DEMAND
Expression of Need
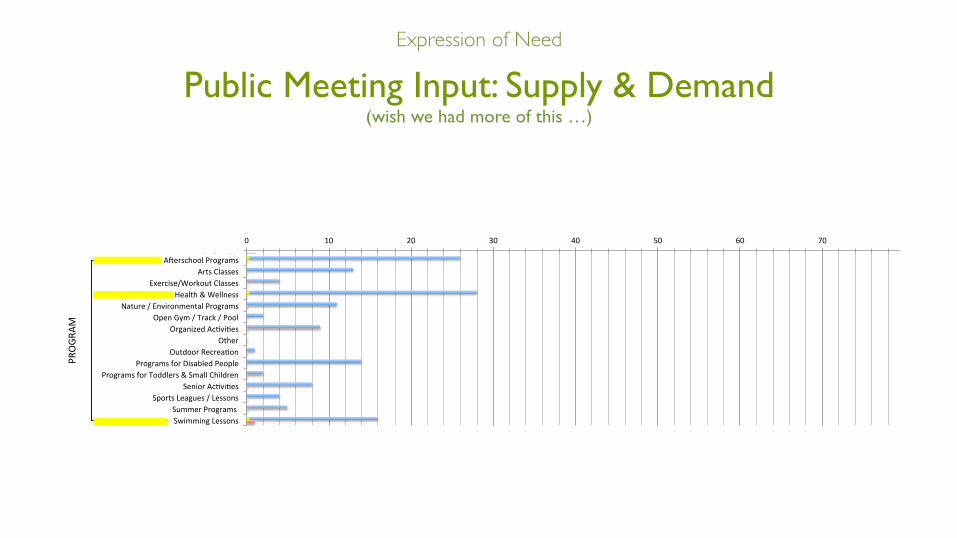
Public Meeting Input: Supply & Demand (wish we had more of this …)
PUBLIC MEETING #1 RESULTSPLAN toplay
:� ;:� <:� =:� >:� ?:� @:� A:� B:� C:�
��*���##��!�#�*���*"�+��##��&.)+*�
�&�+���$'*���$'!%��
��%&��5���2�"�����**���&$$.%!+2���)��%*�
�!*���&#���&����)"*�
�(.�*+)!�%��)�!#*��&&+��##��!�#�*��&#���&.)*�*�!*+&)!���!+�*�
&.%+�!%��!"���)�!#*� .#,'.)'&*���!�#�*�
�+ �)��.+�&&)��0!$$!%��5��')�2���)"*�
��)"�����*�5��&&��*�)/!�����/��� .#,6�*���)�!#�
�!�%!��� �#+�)*��#�2�)&.%�*�
��%���&##�2��##��"�+����)"*�
�&���)��!�#�*��&���##��!�#�*���%%!*��&.)+*�
�%'�/����)�!#*�5�!"!%���)�!#*��(.�,�����!#!,�*�
��%���5��&����+.�!&��!+%�**���%+�)���$���&&$��2$%�*!.$�
&$�0&)"��)���5��&$'.+�)��&&$�%�&&)��)��"��&.%����)���
��,%���'����5��#�**)&&$*��+ �)�
���)*� &&#��)&�)�$*��)+*��#�**�*�
�1�)�!*�5�&)"&.+��#�**�*���#+ �7���##%�**�
��+.)��5��%/!)&%$�%+�#��)&�)�$*��'�%��2$�5��)��"�5��&&#�
�)��%!3�����,/!,�*��+ �)�
�.+�&&)����)��,&%��)&�)�$*��&)��!*��#�����&'#��
�)&�)�$*��&)��&��#�)*�7��$�##�� !#�)�%���%!&)���,/!,�*�
�'&)+*�����.�*�5���**&%*��.$$�)��)&�)�$*���0!$$!%����**&%*�
������������������������������������������ �������������������
%6�������*'&%*�*�
�/�)6�.''#2���*'&%*�*�
:� ;:� <:� =:� >:� ?:� @:� A:� B:� C:�
��*���##��!�#�*���*"�+��##��&.)+*�
�&�+���$'*���$'!%��
��%&��5���2�"�����**���&$$.%!+2���)��%*�
�!*���&#���&����)"*�
�(.�*+)!�%��)�!#*��&&+��##��!�#�*��&#���&.)*�*�!*+&)!���!+�*�
&.%+�!%��!"���)�!#*� .#,'.)'&*���!�#�*�
�+ �)��.+�&&)��0!$$!%��5��')�2���)"*�
��)"�����*�5��&&��*�)/!�����/��� .#,6�*���)�!#�
�!�%!��� �#+�)*��#�2�)&.%�*�
��%���&##�2��##��"�+����)"*�
�&���)��!�#�*��&���##��!�#�*���%%!*��&.)+*�
�%'�/����)�!#*�5�!"!%���)�!#*��(.�,�����!#!,�*�
��%���5��&����+.�!&��!+%�**���%+�)���$���&&$��2$%�*!.$�
&$�0&)"��)���5��&$'.+�)��&&$�%�&&)��)��"��&.%����)���
��,%���'����5��#�**)&&$*��+ �)�
���)*� &&#��)&�)�$*��)+*��#�**�*�
�1�)�!*�5�&)"&.+��#�**�*���#+ �7���##%�**�
��+.)��5��%/!)&%$�%+�#��)&�)�$*��'�%��2$�5��)��"�5��&&#�
�)��%!3�����,/!,�*��+ �)�
�.+�&&)����)��,&%��)&�)�$*��&)��!*��#�����&'#��
�)&�)�$*��&)��&��#�)*�7��$�##�� !#�)�%���%!&)���,/!,�*�
�'&)+*�����.�*�5���**&%*��.$$�)��)&�)�$*���0!$$!%����**&%*�
������������������������������������������ �������������������
%6�������*'&%*�*�
�/�)6�.''#2���*'&%*�*�
OU
TDO
OR
FACI
LITY
INDO
OR
FACI
LITY
PRO
GRAM
PUBLIC MEETING #1 OVERALL SUMMARY: SUPPLY AND DEMAND
Expression of Need
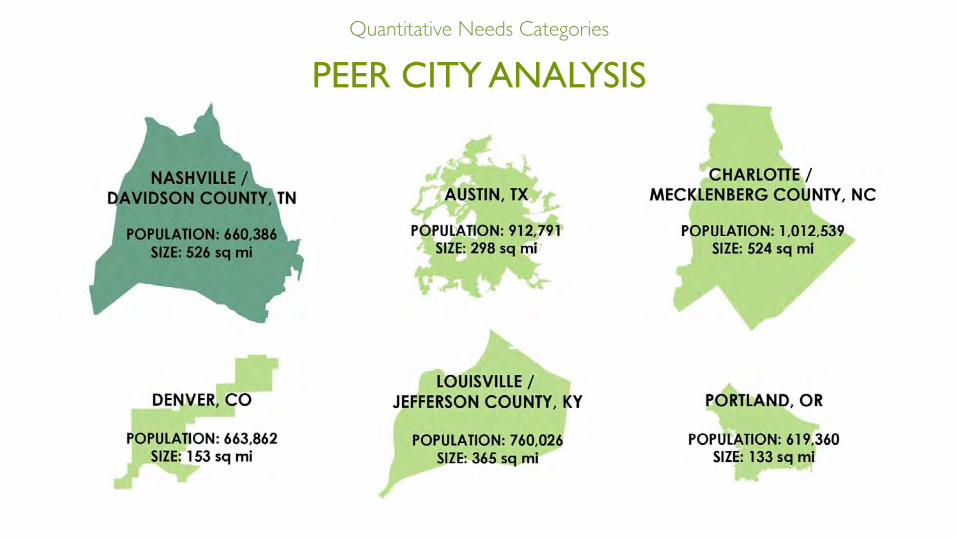
PEER CITY ANALYSIS Quantitative Needs Categories
PEER CITY ANALYSIS Quantitative Needs Categories
PEER CITY ANALYSIS Quantitative Needs Categories
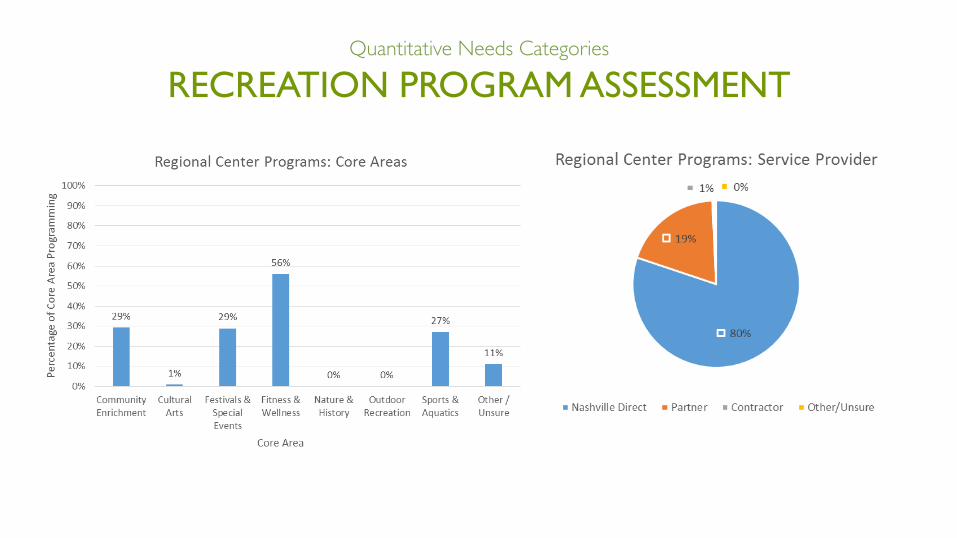
RECREATION PROGRAM ASSESSMENT Quantitative Needs Categories
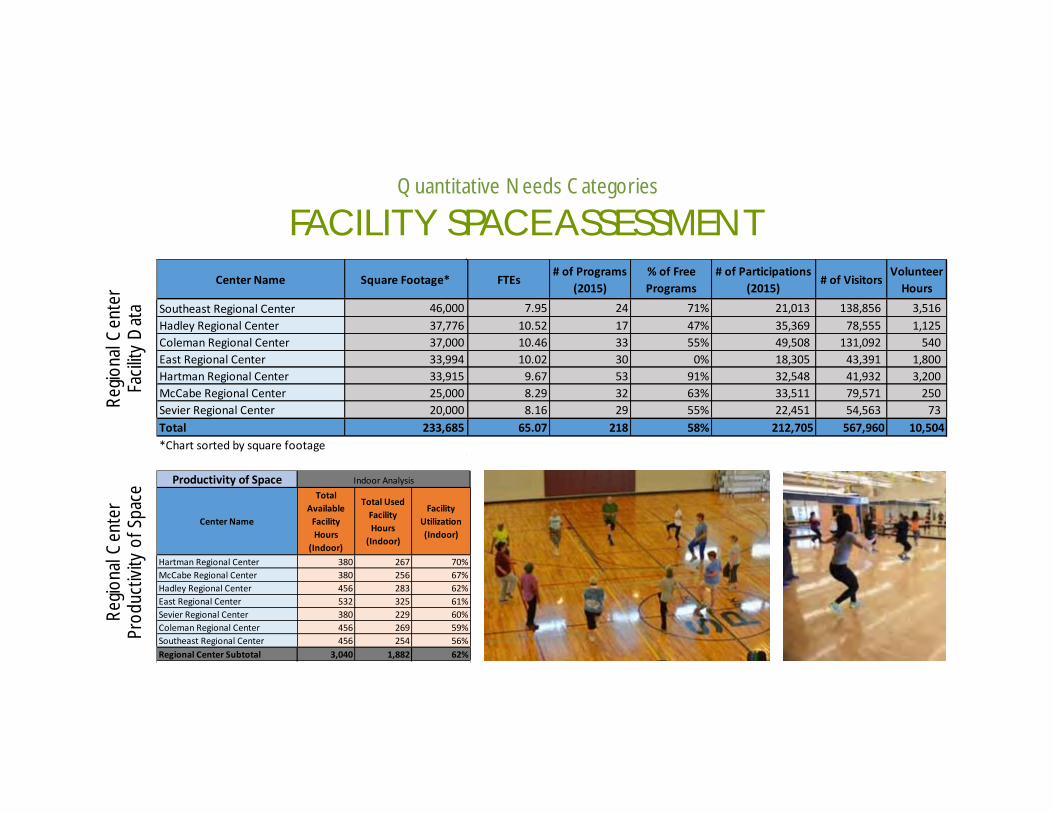
FACILITY SPACE ASSESSMENTQuantitative Needs Categories�
Regi
onal
Cen
ter
Faci
lity
Dat
aRe
gion
al C
ente
r Pr
oduc
tivity
of S
pace

LEVEL OF SERVICE (LOS) MAPPING
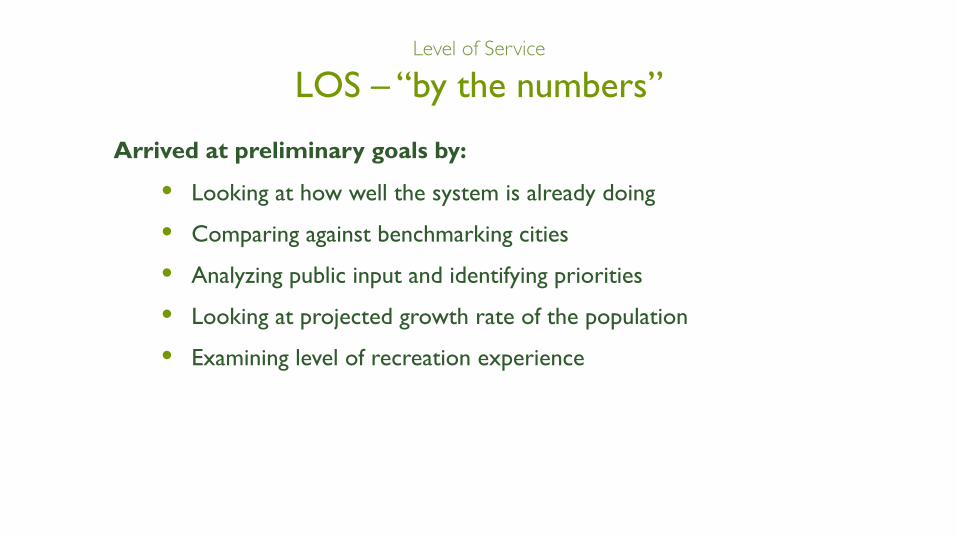
LOS – “by the numbers” Level of Service
Arrived at preliminary goals by:
• Looking at how well the system is already doing
• Comparing against benchmarking cities
• Analyzing public input and identifying priorities
• Looking at projected growth rate of the population
• Examining level of recreation experience
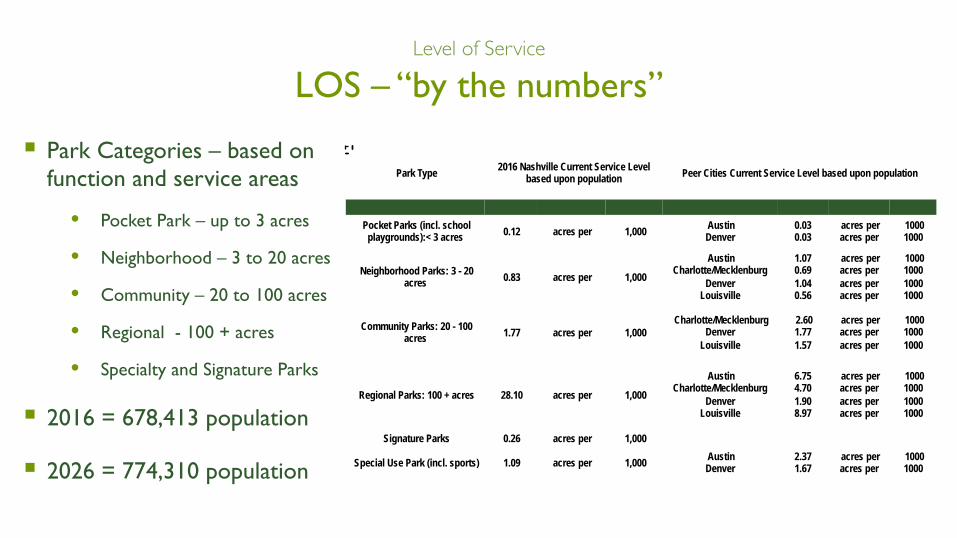
LOS – “by the numbers” Level of Service
§ Park Categories – based on function and service areas
• Pocket Park – up to 3 acres
• Neighborhood – 3 to 20 acres
• Community – 20 to 100 acres
• Regional - 100 + acres
• Specialty and Signature Parks
§ 2016 = 678,413 population
§ 2026 = 774,310 population
Park Type 2016 Nashville Current Service Level based upon population Peer Cities Current Service Level based upon population
Pocket Parks (incl. school
playgrounds):< 3 acres 0.12 acres per 1,000 Austin Denver
0.03 0.03
acres per acres per
1000 1000
Neighborhood Parks: 3 - 20 acres 0.83 acres per 1,000
Austin Charlotte/Mecklenburg
Denver Louisville
1.07 0.69 1.04 0.56
acres per acres per acres per acres per
1000 1000 1000 1000
Community Parks: 20 - 100 acres 1.77 acres per 1,000
Charlotte/Mecklenburg Denver
Louisville
2.60 1.77 1.57
acres per acres per acres per
1000 1000 1000
Regional Parks: 100 + acres 28.10 acres per 1,000
Austin Charlotte/Mecklenburg
Denver Louisville
6.75 4.70 1.90 8.97
acres per acres per acres per acres per
1000 1000 1000 1000
Signature Parks 0.26 acres per 1,000
Special Use Park (incl. sports) 1.09 acres per 1,000 Austin Denver
2.37 1.67
acres per acres per
1000 1000

LOS Mapping: Pocket Parks Level of Service
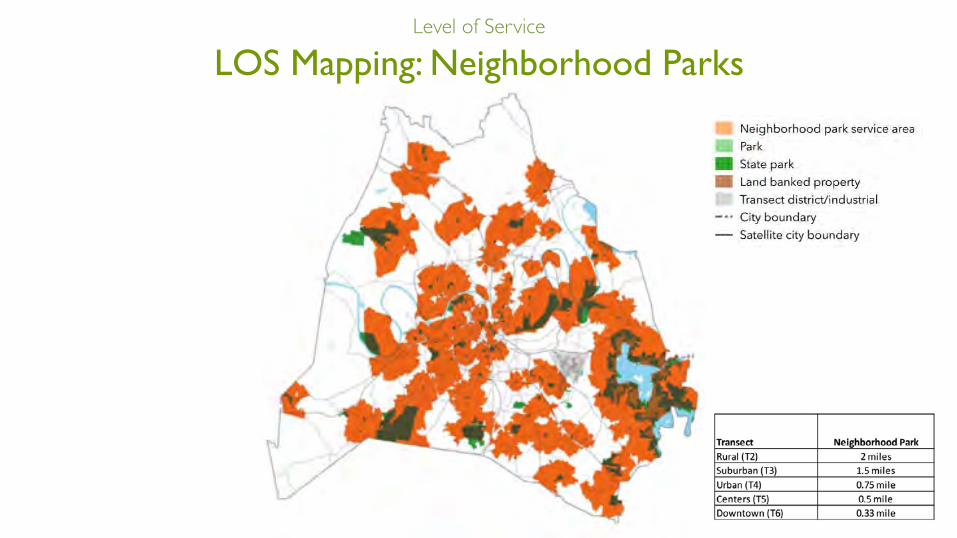
LOS Mapping: Neighborhood Parks Level of Service
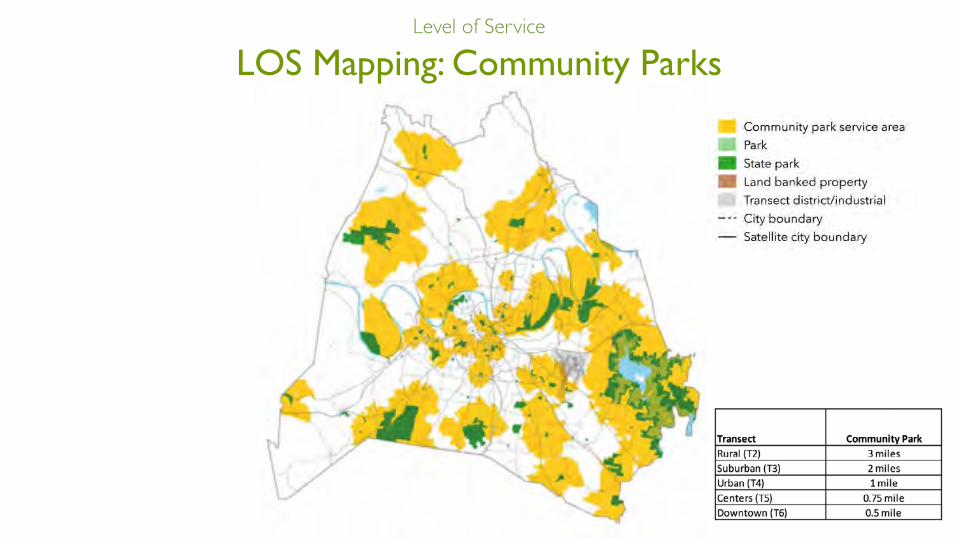
LOS Mapping: Community Parks Level of Service
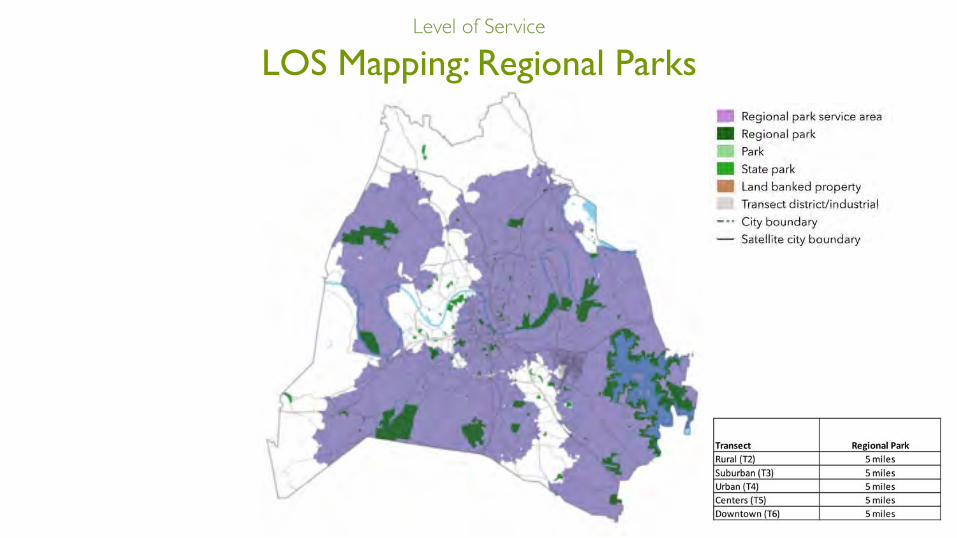
LOS Mapping: Regional Parks Level of Service
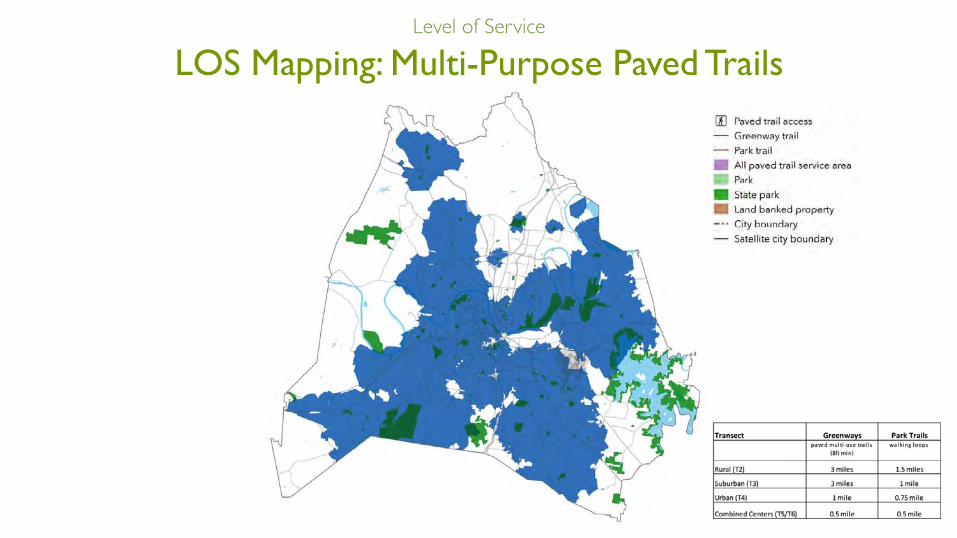
LOS Mapping: Multi-Purpose Paved Trails Level of Service
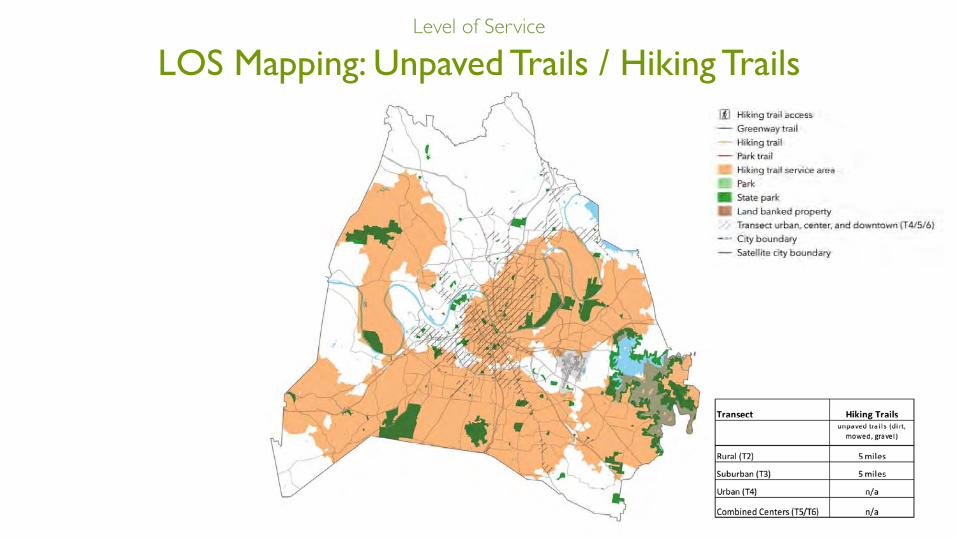
LOS Mapping: Unpaved Trails / Hiking Trails Level of Service
LOS Mapping: Downtown Park Pressure Level of Service
Cu
mb
er
la
nd
Ri
ve
r
S1
0Th
St
Fogg St
Jo Johnston Ave
Shelby Ave
Mclem
ore St
Church St
3Rd A
ve N
S 9Th St
Woodland St
CharlotteAve
Delta Ave
Lea Ave
Hume St
S 8Th St
4Th Ave S
Monroe St
Russell St
S 6Th St
Finn St
6Th Ave N
Ch
arle
s E
Dav
is B
lvd7Th
Ave
S
7Th Ave N
Taylor St
Boscobel St
5Th Ave N
Union St
N 7Th St
Cla
ibo
rne
St
Clinton St
Ash St
InterstateD
r
Summer Pl
Locklayer St
5Th Ave S
Alm
ond St
23Rd Ave N
4Th Ave N
Commerce St
Ellist
on Pl
Myrtle St
Dri
ftw
oo
d S
t
14
ThA
ve
8Th Ave N
1St Ave S
Davidson St
Ew
ing
Ave
3R
dA
veS
11ThAve
N
6Th Ave S
9Th Ave S
Gay St
N 2N
d St
Main St
Lindsley Ave
N 3
Rd
St
Dr D
b To
dd
Jr Blvd
2Nd A
ve S
Rutledge St
Nelson Merry St
Spring St
9Th Ave N
S5Th
St
Herman St
2Nd A
ve N
Peabody St
Co
wan
St
Lenore St
Ramsey St
15Th Ave N
Academ
y Pl
Hynes St
Lew
is S
t
Mcm
illan St
State St
Hermosa St
Middleton St
Harrison St
S 1St St
Victory Ave
Foster St
Ke
ith
St
Mccann St
Clark Pl
S 7Th St
19ThA
veN
Gleaves St
Shirley St
N 8Th St
Felicia St Demonbreun StMolloy St
Arcade Bank Aly
Jefferson Street Brg
H owertonSt
S 1
1Th
St
Alameda St
20ThA
veN
10Th Ave N12Th A
ve N
Albion St
25Th Ave N
Britt Pl
Oak St
Brandau Pl
Van Buren St
Meharry Blvd
Pearl St
18Th A
ve N17Th A
ve N
10Th Ave S
Jackson St
Elm St
22
Nd
Ave
N
1St Ave
Mulberry StCannon St
Laurel StMurphy Ave
Madison St
Deaderick St
Franklin St
Mcgavock St
16Th Ave N
Milson Ave
N 9Th St
Frith Dr
Polk Ave
Sylvan St
Adelicia St
Formosa St
Dew St
Prison Ave
Phillips St
Ireland St
Willow St
Warner St
Knowles St
Blank St
Treutland St
Morena St
Nestor St
Lesl
ie
Ave
Neill A
ve Mcf
err
in A
ve
Lyle Ave
S 4Th St
TitansW
ay
1St Ave N
Carroll St
Mau
ry S
t
24
Th A
ve N
S 3Rd St
UV1
£¤31e
£¤31W
£¤31
£¤70
£¤41
§̈¦65
§̈¦24
§̈¦40
BicentennialCapitol MallState Park
ChurchStreet Park
PublicSquare Park
Walk ofFame Park
CommerceCenter
Park
RiverfrontPark
CumberlandPark
Downtown Park Pressure AnalysisN A S H V I L L E PA R K M A S T E R P L A N
Park PressureVery highHighModerateDowntown park service areaOther parkLand banked propertyDowntown (T6) transect boundary
0 0.3 0.6Miles ±
DRAFT9/05/2016
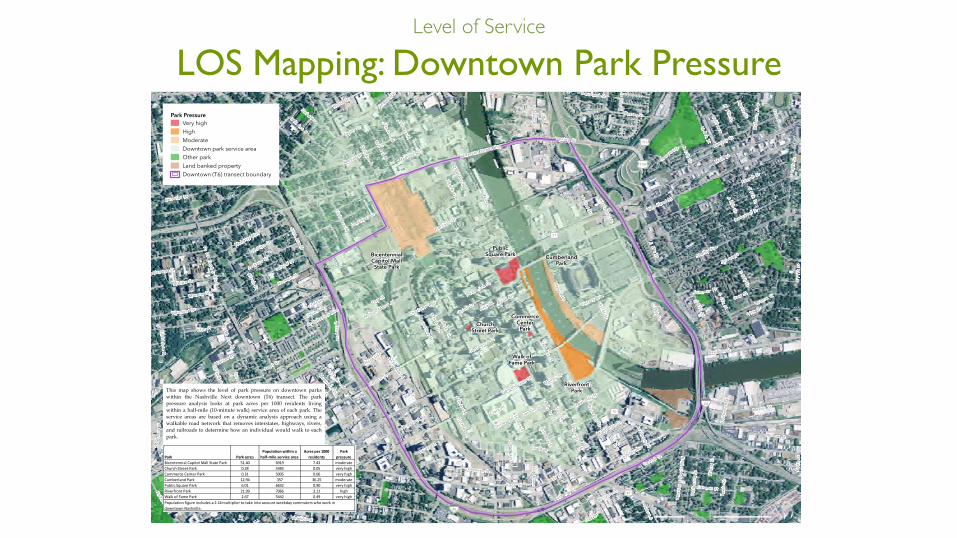
This map shows the level of park pressure on downtown parkswithin the Nashville Next downtown (T6) transect. The parkpressure analysis looks at park acres per 1000 residents livingwithin a half-mile (10-minute walk) service area of each park. Theservice areas are based on a dynamic analysis approach using awalkable road network that removes interstates, highways, rivers,and railroads to determine how an individual would walk to eachpark.
September 6, 2016. Copyright © The Trust for Public Land. The Trust for Public Land and The Trust for Public Land logo are federally registered marks of The Trust for Public Land. Information on this map is provided for purposes of discussion and visualization only. www.tpl.org
Park Park acresPopulation within a
half-mile service areaAcres per 1000
residentsPark
pressureBicentennial Capitol Mall State Park 51.40 6919 7.43 moderateChurch Street Park 0.28 5483 0.05 very highCommerce Center Park 0.31 5005 0.06 very highCumberland Park 12.94 357 36.25 moderatePublic Square Park 6.01 6632 0.90 very highRiverfront Park 21.99 7066 3.11 highWalk of Fame Park 2.67 5442 0.49 very highPopulation figure includes a 2.14 multiplier to take into account weekday commuters who work in downtown Nashville.
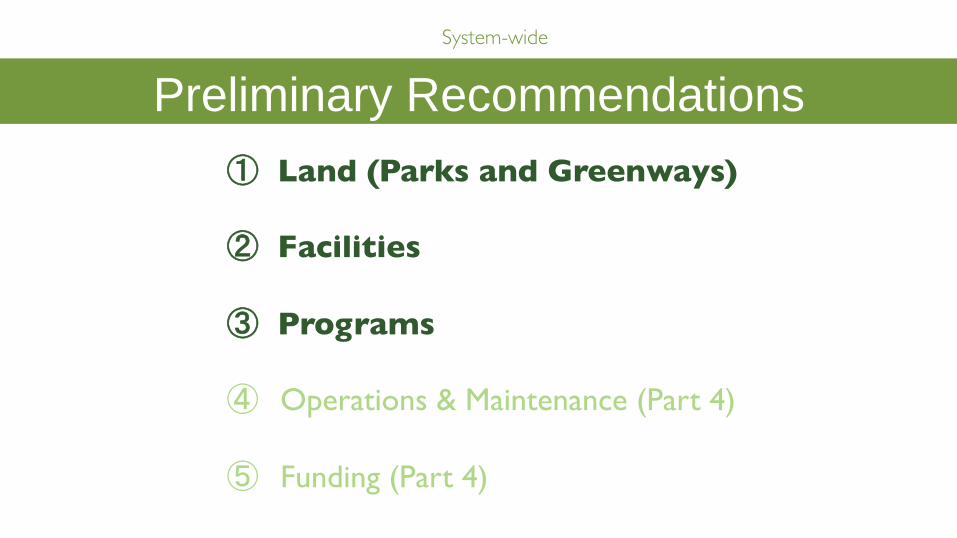
① Land (Parks and Greenways)
② Facilities
③ Programs ④ Operations & Maintenance (Part 4) ⑤ Funding (Part 4)
Preliminary Recommendations System-wide

PRELIMINARY RECOMMENDATIONS:
LAND
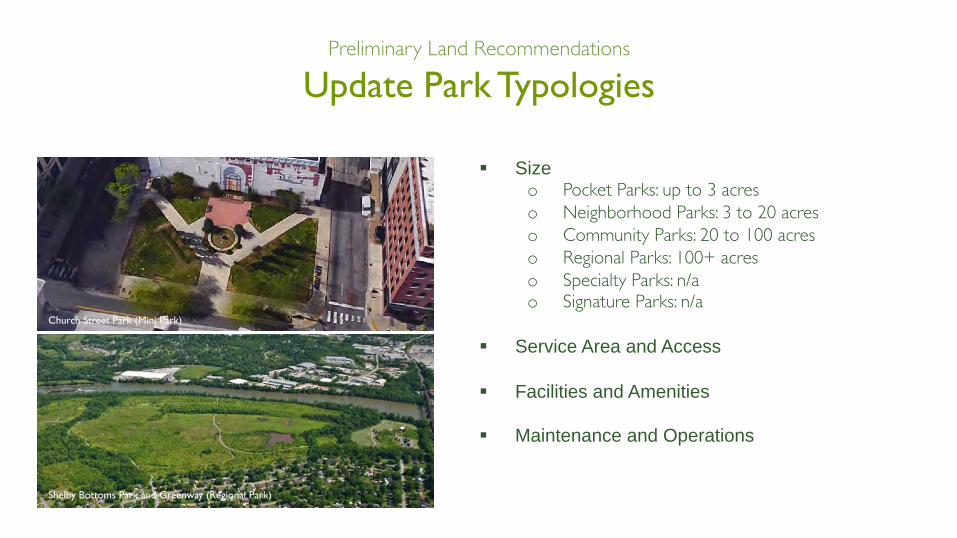
Update Park Typologies Preliminary Land Recommendations
§ Size o Pocket Parks: up to 3 acres o Neighborhood Parks: 3 to 20 acres o Community Parks: 20 to 100 acres o Regional Parks: 100+ acres o Specialty Parks: n/a o Signature Parks: n/a
§ Service Area and Access § Facilities and Amenities § Maintenance and Operations
Church Street Park (Mini Park)
Shelby Bottoms Park and Greenway (Regional Park)
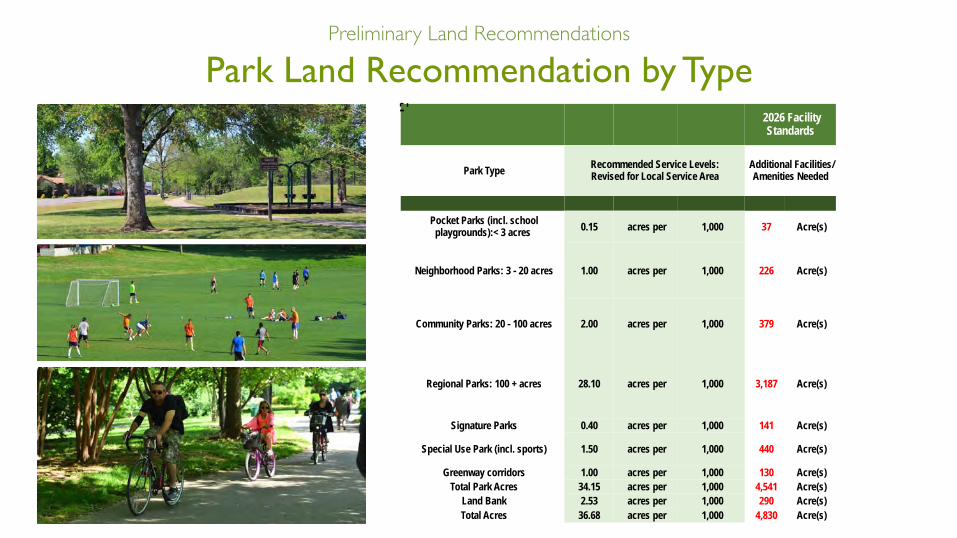
Park Land Recommendation by Type Preliminary Land Recommendations
2026 Facility Standards
Park Type Recommended Service Levels: Revised for Local Service Area
Additional Facilities/ Amenities Needed
Pocket Parks (incl. school
playgrounds):< 3 acres 0.15 acres per 1,000 37 Acre(s)
Neighborhood Parks: 3 - 20 acres 1.00 acres per 1,000 226 Acre(s)
Community Parks: 20 - 100 acres 2.00 acres per 1,000 379 Acre(s)
Regional Parks: 100 + acres 28.10 acres per 1,000 3,187 Acre(s)
Signature Parks 0.40 acres per 1,000 141 Acre(s)
Special Use Park (incl. sports) 1.50 acres per 1,000 440 Acre(s)
Greenway corridors 1.00 acres per 1,000 130 Acre(s) Total Park Acres 34.15 acres per 1,000 4,541 Acre(s)
Land Bank 2.53 acres per 1,000 290 Acre(s) Total Acres 36.68 acres per 1,000 4,830 Acre(s)
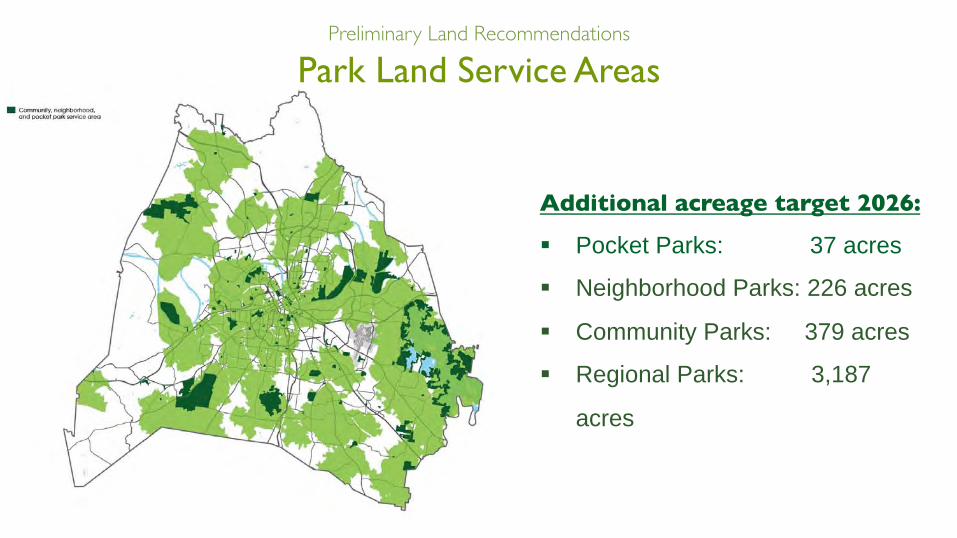
Additional acreage target 2026:
§ Pocket Parks: 37 acres
§ Neighborhood Parks: 226 acres
§ Community Parks: 379 acres
§ Regional Parks: 3,187
acres
MAP BEING UPDATED
Park Land Service Areas Preliminary Land Recommendations
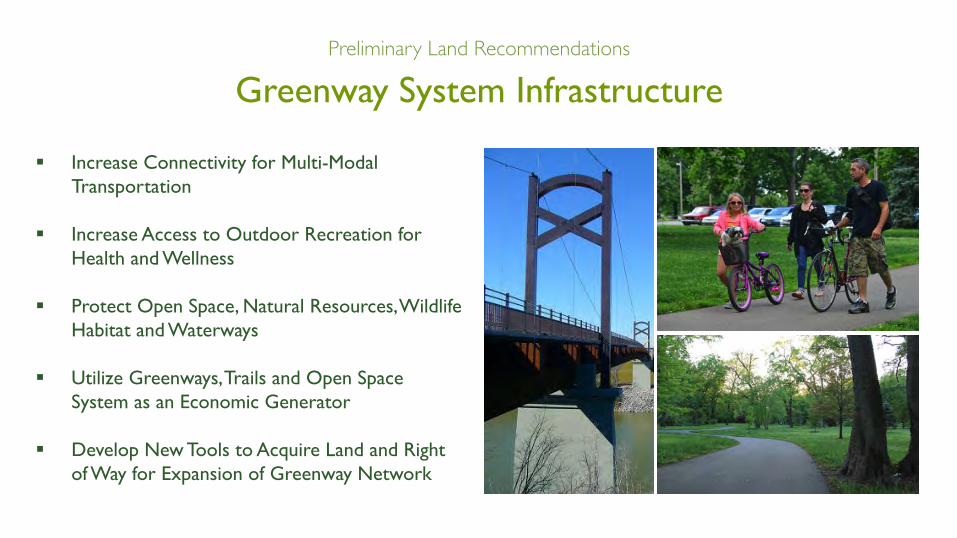
Greenway System Infrastructure Preliminary Land Recommendations
§ Increase Connectivity for Multi-Modal Transportation
§ Increase Access to Outdoor Recreation for
Health and Wellness § Protect Open Space, Natural Resources, Wildlife
Habitat and Waterways § Utilize Greenways, Trails and Open Space
System as an Economic Generator § Develop New Tools to Acquire Land and Right
of Way for Expansion of Greenway Network
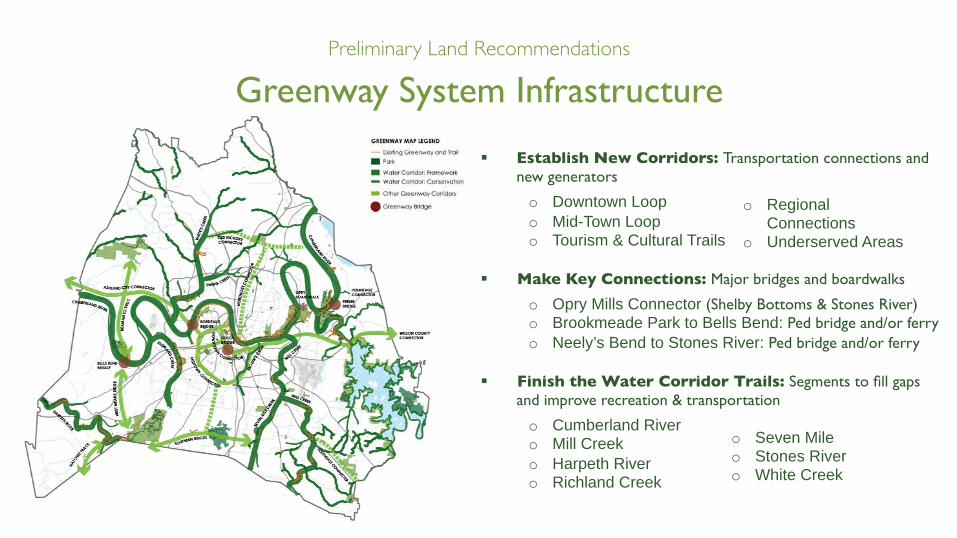
Greenway System Infrastructure Preliminary Land Recommendations
§ Establish New Corridors: Transportation connections and new generators
o Downtown Loop o Mid-Town Loop o Tourism & Cultural Trails
§ Make Key Connections: Major bridges and boardwalks
o Opry Mills Connector (Shelby Bottoms & Stones River) o Brookmeade Park to Bells Bend: Ped bridge and/or ferry o Neely’s Bend to Stones River: Ped bridge and/or ferry
§ Finish the Water Corridor Trails: Segments to fill gaps and improve recreation & transportation
o Cumberland River o Mill Creek o Harpeth River o Richland Creek
o Seven Mile o Stones River o White Creek
o Regional Connections
o Underserved Areas

PRELIMINARY RECOMMENDATIONS: FACILITIES
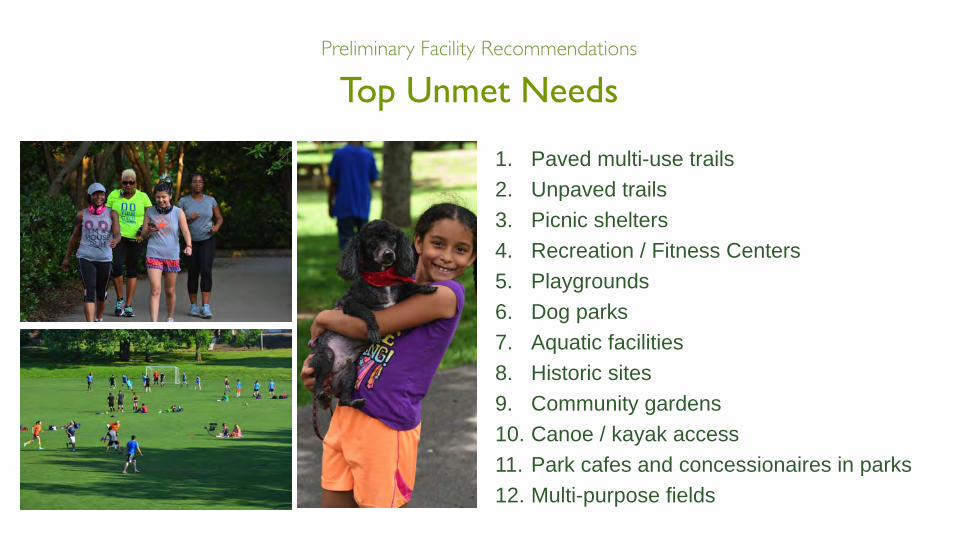
Top Unmet Needs Preliminary Facility Recommendations
1. Paved multi-use trails 2. Unpaved trails 3. Picnic shelters 4. Recreation / Fitness Centers 5. Playgrounds 6. Dog parks 7. Aquatic facilities 8. Historic sites 9. Community gardens 10. Canoe / kayak access 11. Park cafes and concessionaires in parks 12. Multi-purpose fields
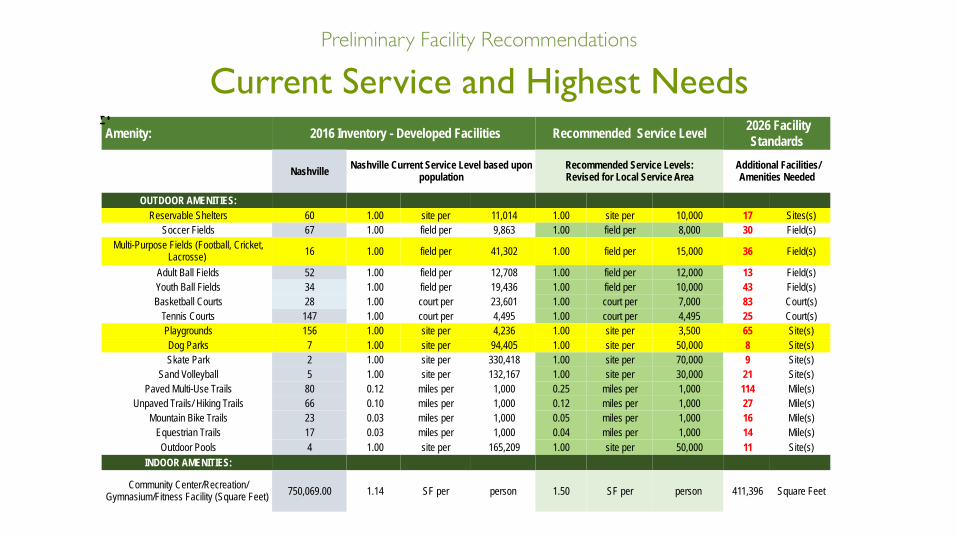
Current Service and Highest Needs Preliminary Facility Recommendations
Amenity: 2016 Inventory - Developed Facilities Recommended Service Level 2026 Facility Standards
Nashville Nashville Current Service Level based upon population
Recommended Service Levels: Revised for Local Service Area
Additional Facilities/ Amenities Needed
OUTDOOR AMENITIES: Reservable Shelters 60 1.00 site per 11,014 1.00 site per 10,000 17 Sites(s)
Soccer Fields 67 1.00 field per 9,863 1.00 field per 8,000 30 Field(s) Multi-Purpose Fields (Football, Cricket,
Lacrosse) 16 1.00 field per 41,302 1.00 field per 15,000 36 Field(s)
Adult Ball Fields 52 1.00 field per 12,708 1.00 field per 12,000 13 Field(s) Youth Ball Fields 34 1.00 field per 19,436 1.00 field per 10,000 43 Field(s) Basketball Courts 28 1.00 court per 23,601 1.00 court per 7,000 83 Court(s)
Tennis Courts 147 1.00 court per 4,495 1.00 court per 4,495 25 Court(s) Playgrounds 156 1.00 site per 4,236 1.00 site per 3,500 65 Site(s) Dog Parks 7 1.00 site per 94,405 1.00 site per 50,000 8 Site(s) Skate Park 2 1.00 site per 330,418 1.00 site per 70,000 9 Site(s)
Sand Volleyball 5 1.00 site per 132,167 1.00 site per 30,000 21 Site(s) Paved Multi-Use Trails 80 0.12 miles per 1,000 0.25 miles per 1,000 114 Mile(s)
Unpaved Trails/ Hiking Trails 66 0.10 miles per 1,000 0.12 miles per 1,000 27 Mile(s) Mountain Bike Trails 23 0.03 miles per 1,000 0.05 miles per 1,000 16 Mile(s)
Equestrian Trails 17 0.03 miles per 1,000 0.04 miles per 1,000 14 Mile(s) Outdoor Pools 4 1.00 site per 165,209 1.00 site per 50,000 11 Site(s)
INDOOR AMENITIES:
Community Center/Recreation/Gymnasium/Fitness Facility (Square Feet) 750,069.00 1.14 SF per person 1.50 SF per person 411,396 Square Feet
A l v in G .B e a m a n Par k
B e l l sB e n dPa r k
Pe rc yWa r n e r
Pa r k
Ra d n o r L a keS t a t e N at u ra lA re a
M c Ca b ePa r k
R i v e r f ro n tPa r k
S h e l b yB o t t o m s
Pa r k
E . N .Pe e l e r
Pa r k
Ca n eR i d g e
Pa r k
Lo n g H u n t e rS t a t ePa r k
Ce d a rH i l l
Tw oR i v e r s
Pa r k
Pa ra d i s eR i d g ePa r k
Ly t l eFa r m
Te dR h o d e s
Pa r k
C umber landRi ve r
Mill Creek
Richlan
dC
reek
L ong Creek
MC
Cro
ryCr
eek
Bro
wn
sC
reek
Hurr
icane C re
ek
Harpet h River
Poplar Creek
Indian Creek
Little Cree k
EatonC
reek
Otter C reek
Ewing Creek
Sulp hurC
reek
Sto n es
Cree k
Seven
M
ile
Cre
ek
Bull R un Creek
J PercyPriest
Reservoir
CHURCH ST
EST
ES
RD
3RD A
VE N
KINGS LN
TUSCULUM RD
HARDING PL
BELL
RDFO
STE
R A
VE
ANDERSON
RD
UV255
UV265
UV174
UV96
UV254
UV45
UV100
UV155
UV386
UV251
UV12
UV171
£¤41
£¤31e
£¤431
£¤70S
£¤31W
£¤31
£¤70
§̈¦24
§̈¦440
§̈¦65
§̈¦40
CITY OFGOODLETTSVILLE
CITY OFBERRY
HILLCITY OFBELLE
MEADE
CITY OFFOREST
HILLS CITY OFOAK HILL
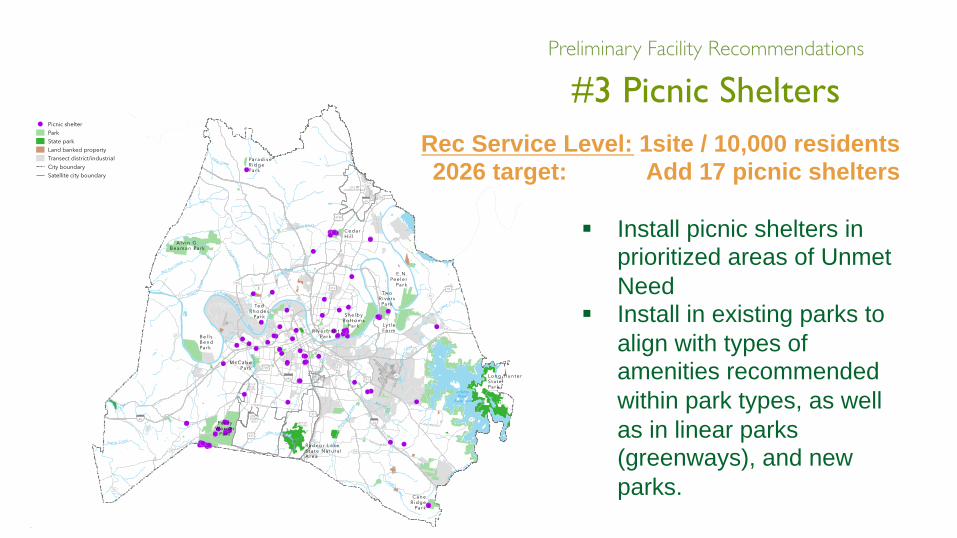
Picnic SheltersN A S H V I L L E PA R K M A S T E R P L A N
Picnic shelterParkState parkLand banked propertyTransect district/industrialCity boundarySatellite city boundary
0 2.5 5Miles ±
DRAFT09/14/2016
September 14, 2016. Copyright © The Trust for Public Land. The Trust for Public Land and The Trust for Public Land logo are federally registered marks of The Trust for Public Land. Information on this map is provided for purposes of discussion and visualization only. www.tpl.org
§ Install picnic shelters in prioritized areas of Unmet Need
§ Install in existing parks to align with types of amenities recommended within park types, as well as in linear parks (greenways), and new parks.
Rec Service Level: 1site / 10,000 residents 2026 target: Add 17 picnic shelters
#3 Picnic Shelters Preliminary Facility Recommendations
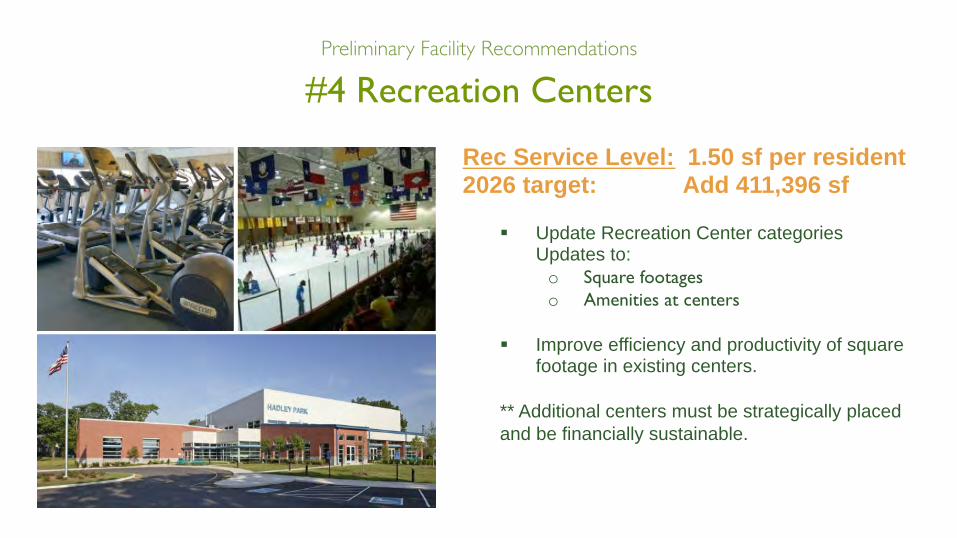
Preliminary Facility Recommendations
§ Update Recreation Center categories Updates to:
o Square footages o Amenities at centers
§ Improve efficiency and productivity of square footage in existing centers.
** Additional centers must be strategically placed and be financially sustainable.
#4 Recreation Centers
Rec Service Level: 1.50 sf per resident 2026 target: Add 411,396 sf
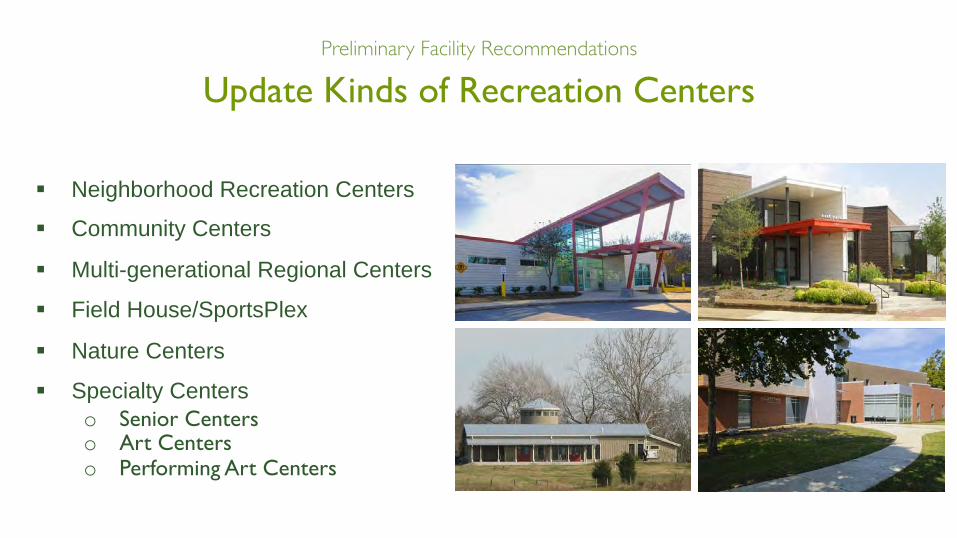
Update Kinds of Recreation Centers Preliminary Facility Recommendations
§ Neighborhood Recreation Centers
§ Community Centers
§ Multi-generational Regional Centers
§ Field House/SportsPlex
§ Nature Centers
§ Specialty Centers o Senior Centers o Art Centers o Performing Art Centers
nm
nm
nm
nmnm
nm
nm
nm
nm
nm
nm
nm
nm
nm
nm
nmnm
nm
nm
nm
nm
nm
nm
nm
nmnm nm
nm
nm
nm
nmnm
nmnm
nm
nm
nm
nm
nm
nm
nm
nm
nm
nm
nm
nmnm
nm
nmnm
nm
nm
nm
nmnm
nm
nm
nm
nm
nm
nm
nmnm
nm
nm
nm
nm
nm
nm
nm
nm
nm
nm
nmnm
nm
nm
nm
nm
nm
nm
nmnm
nm
nm
nm
nm
nmnmnm
nmnm
nm
nm
nmnm
nm nm
nm
nm
nmnm
nmnm
nmnmnm
nm
nm
nm
nm
nmnm
nmnm
nm
nm
nm
nm
nm
nmnmnm
nm
nmnm
nmnm
nmnm
nm
nm nm
nm
nmnm
nm
nm
nm
nmnm
nm
nm nm
nm
nm
nmnm
nm
nm
nm
nm
nmnm
nm
nmnm
nm
nm
nm
nm
A l v i n G .B e am a n Par k
B e l l sB e n dPa r k
Pe rc yWa r n e r
Pa r k
Ra d n o r L a keS t at e N at u ra lA re a
M c Ca b ePa r k
R i v e r f ro n tPa r k
S h e l b yB o t to m s
Pa r k
E .N .Pe e l e r
Pa r k
Ca n eR i d g e
Pa r k
Lon g H u n t e rS t at ePa r k
Ce d a rH i l l
Tw oR i v e r s
Pa r k
Pa ra d i s eR i d g ePa r k
Ly t l eFar m
Te dR h o d e s
Pa r k
C umber landR ive r
Mill Creek
Long Creek
MC
Cro
ryCr
eek
Bro
wn
sC
reek
Hurr
icane C re
ek
Harpet h River
Poplar Creek
Indian Creek
Little Cree k
EatonC
reek
Otter Cre ek
Whi
tes Creek
Ewing Creek
Sulp hurC
reek
Sto n es
Cree k
Seven
M
ile
Cre
ek
Bull R un Creek
J PercyPriest
Reservoir
CHURCH ST
EST
ES
RD
KINGS LN
HARDING PL
BELL
RD
FOST
ER
AV
E
ANDERSONR
D
UV255
UV265
UV174
UV96
UV254
UV45
UV100
UV155
UV386
UV251
UV12
UV171
£¤41
£¤31e
£¤431
£¤70S
£¤31W
£¤31
£¤70
§̈¦24
§̈¦440
§̈¦65
§̈¦40
CITY OFGOODLETTSVILLE
CITY OFBERRY HILL
CITY OFBELLE
MEADE
CITY OFFORESTHILLS
CITY OFOAK HILL
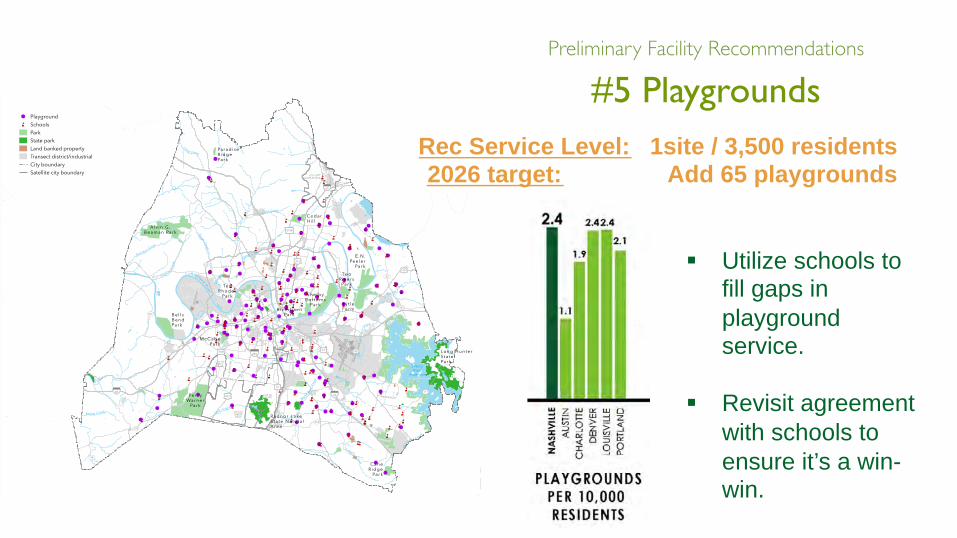
Playground and SchoolsN A S H V I L L E PA R K M A S T E R P L A N
Playgroundnm Schools
ParkState parkLand banked propertyTransect district/industrialCity boundarySatellite city boundary
0 2.5 5Miles ±
DRAFT10/06/2016
October 6, 2016. Copyright © The Trust for Public Land. The Trust for Public Land and The Trust for Public Land logo are federally registered marks of The Trust for Public Land. Information on this map is provided for purposes of discussion and visualization only. www.tpl.org
#5 Playgrounds Preliminary Facility Recommendations
§ Utilize schools to fill gaps in playground service.
§ Revisit agreement
with schools to ensure it’s a win-win.
Rec Service Level: 1site / 3,500 residents 2026 target: Add 65 playgrounds
A l v i n G .B e am a n Par k
B e l l sB e n dPa r k
Pe rc yWa r n e r
Pa r k
Ra d n o r L a keS t at e N at u ra lA re a
M c Ca b ePa r k
R i v e r f ro n tPa r k
S h e l b yB o t to m s
Pa r k
E .N .Pe e l e r
Pa r k
Ca n eR i d g e
Pa r k
Lon g H u n t e rS t at ePa r k
Ce d a rH i l l
Tw oR i v e r s
Pa r k
Pa ra d i s eR i d g ePa r k
Ly t l eFar m
Te dR h o d e s
Pa r k
C umber landR ive r
Mill Creek
Richl a nd Cree
k
L ong Creek
MC
Cro
ryCr
eek
Bro
wn
sC
reek
Hurr
icane C re
ek
Harpet h River
Poplar Creek
Ewing
CreekN Fork
Indian Creek
Little Cree k
EatonC
reek
Otter C reek
Whi
tes Creek
Ewing Creek
Sulp hurC
reek
Sto n es
Cree k
Seven
M
ile
Cre
ek
Bull R un Creek
J PercyPriest
Reservoir
JEFFERSON ST
BLAIR BLVD
CHURCH ST
EST
ES
RD
3RD A
VE N
12
TH
AV
ES
KINGS LN
TUSCULUM RD
HARDING PL
ANDERSON
RD
UV255
UV265
UV174
UV96
UV254
UV45
UV100
UV155
UV386
UV251
UV12
UV171
£¤41
£¤31e
£¤431
£¤70S
£¤31W
£¤31
£¤70
§̈¦24
§̈¦440
§̈¦65
§̈¦40
CITY OFGOODLETTSVILLE
CITY OFBERRY
HILL
CITY OFBELLE
MEADE
CITY OFFOREST
HILLS CITY OFOAK HILL
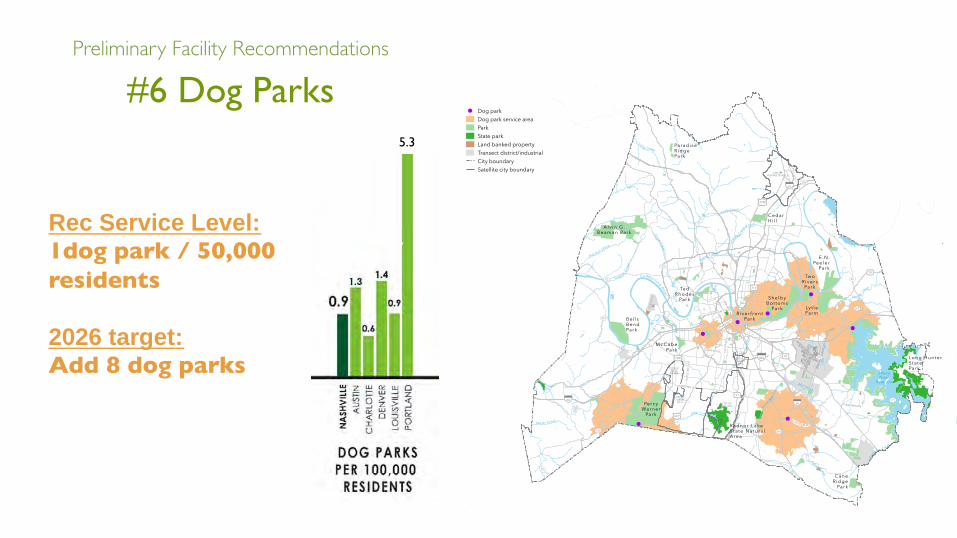
Dog Park Level of ServiceN A S H V I L L E PA R K M A S T E R P L A N
Dog parkDog park service areaParkState parkLand banked propertyTransect district/industrialCity boundarySatellite city boundary
0 2.5 5Miles ±
DRAFT10/06/2016
This map shows the level of service (LOS) analysis for dog parks. The LOS analysis is
based on various distances associated with Nashville Next Transects as identified in the
table. The service areas are based on a dynamic analysis approach for all distances. This
approach uses the full road network to determine how an individual would travel the
specified distance from each dog park.
October 6, 2016. Copyright © The Trust for Public Land. The Trust for Public Land and The Trust for Public Land logo are federally registered marks of The Trust for Public Land. Information on this map is provided for purposes of discussion and visualization only. www.tpl.org
Transect Dog Parks
Rural (T2) n/a
Suburban (T3) 3 miles
Urban (T4) 2 miles
Combined Centers (T5/T6) 1 mile
#6 Dog Parks Preliminary Facility Recommendations
5.3
Rec Service Level: 1dog park / 50,000 residents 2026 target: Add 8 dog parks
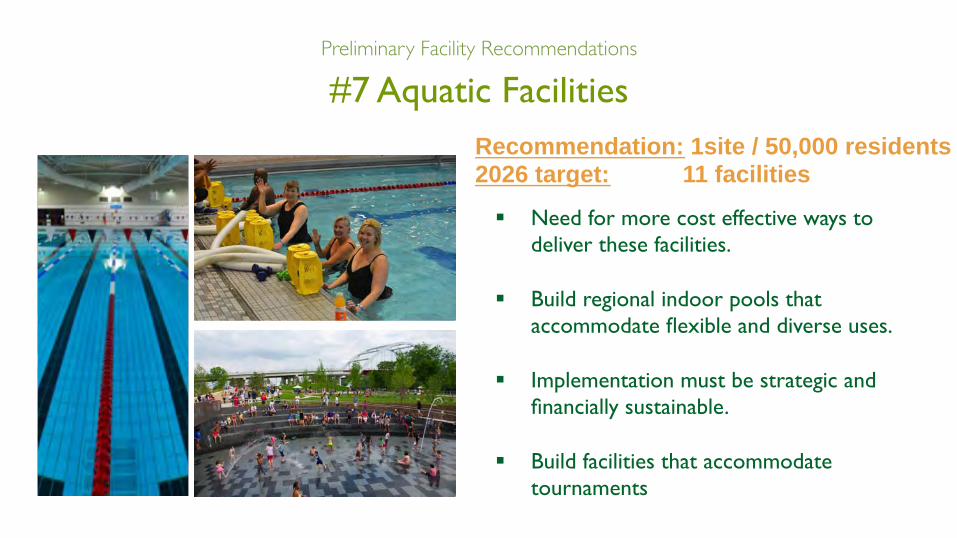
§ Need for more cost effective ways to deliver these facilities.
§ Build regional indoor pools that accommodate flexible and diverse uses.
§ Implementation must be strategic and financially sustainable.
§ Build facilities that accommodate tournaments
#7 Aquatic Facilities Preliminary Facility Recommendations
Recommendation: 1site / 50,000 residents 2026 target: 11 facilities
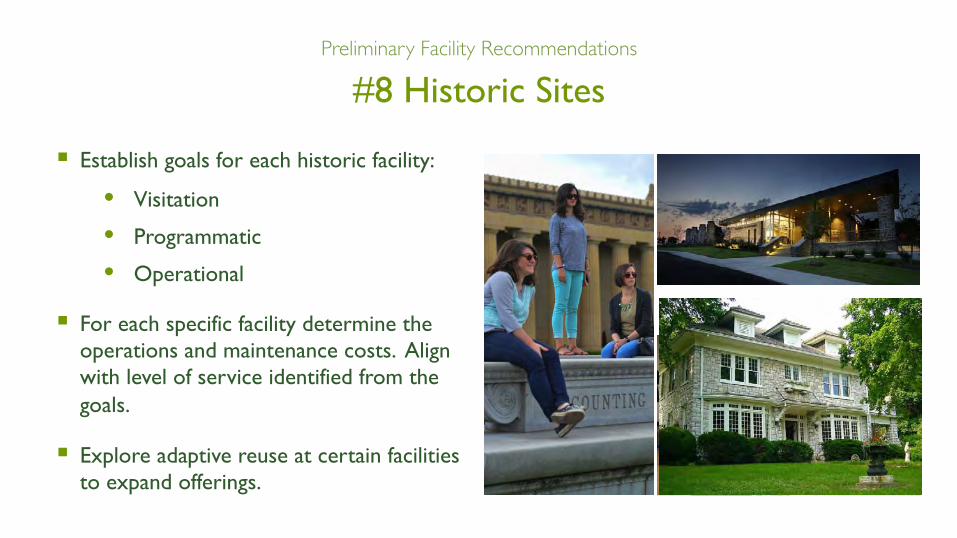
§ Establish goals for each historic facility:
• Visitation
• Programmatic
• Operational
§ For each specific facility determine the operations and maintenance costs. Align with level of service identified from the goals.
§ Explore adaptive reuse at certain facilities to expand offerings.
#8 Historic Sites Preliminary Facility Recommendations
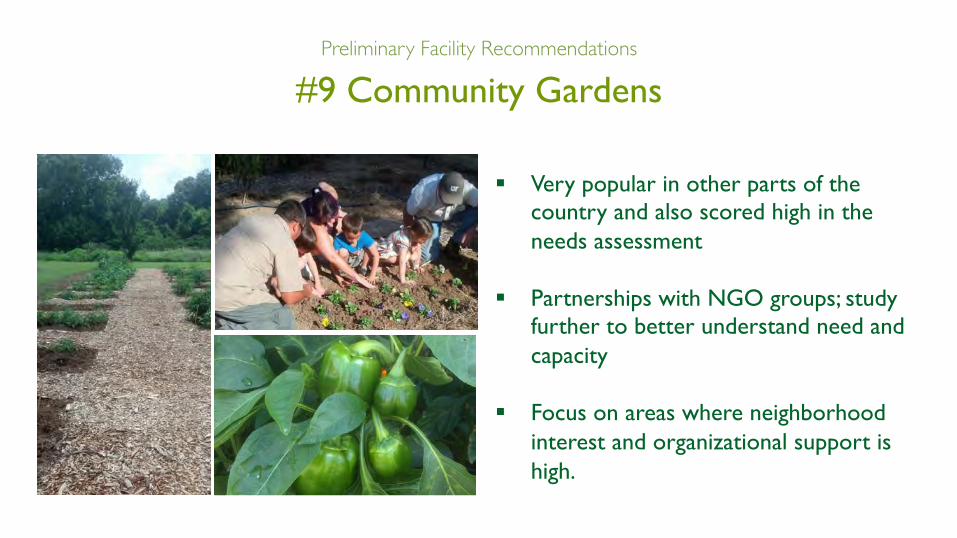
§ Very popular in other parts of the country and also scored high in the needs assessment
§ Partnerships with NGO groups; study
further to better understand need and capacity
§ Focus on areas where neighborhood
interest and organizational support is high.
#9 Community Gardens Preliminary Facility Recommendations
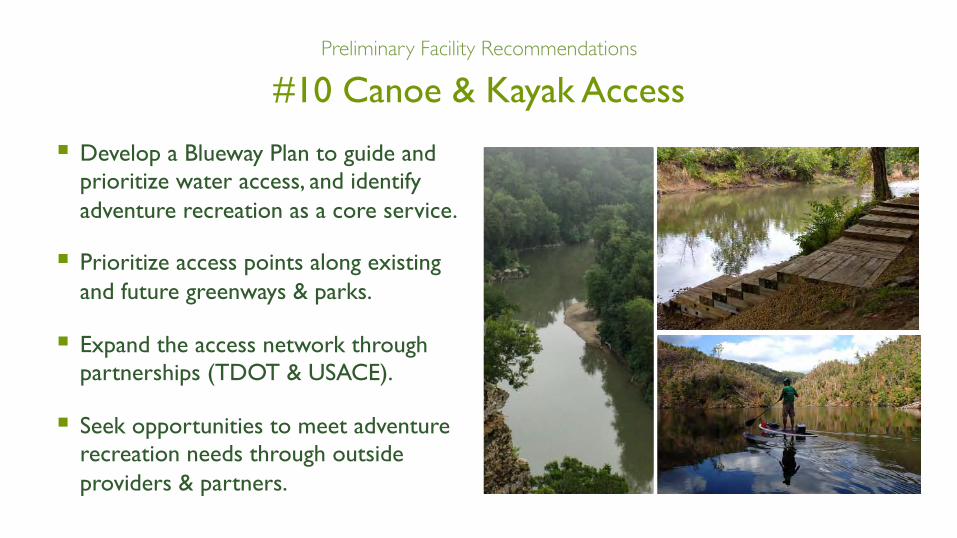
§ Develop a Blueway Plan to guide and prioritize water access, and identify adventure recreation as a core service.
§ Prioritize access points along existing and future greenways & parks.
§ Expand the access network through partnerships (TDOT & USACE).
§ Seek opportunities to meet adventure recreation needs through outside providers & partners.
#10 Canoe & Kayak Access Preliminary Facility Recommendations
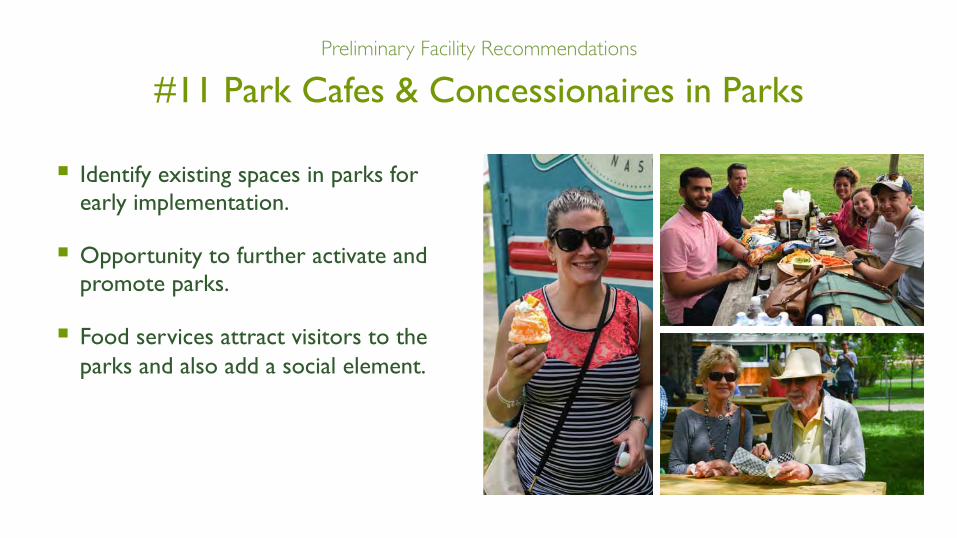
§ Identify existing spaces in parks for early implementation.
§ Opportunity to further activate and promote parks.
§ Food services attract visitors to the parks and also add a social element.
#11 Park Cafes & Concessionaires in Parks Preliminary Facility Recommendations
A l v i n G .B e am a n Par k
B e l l sB e n dPa r k
Pe rc yWa r n e r
Pa r k
Ra d n o r L a keS t at e N at u ra lA re a
M c Ca b ePa r k
R i v e r f ro n tPa r k
S h e l b yB o t to m s
Pa r k
E .N .Pe e l e r
Pa r k
Ca n eR i d g e
Pa r k
Lon g H u n t e rS t at ePa r k
Ce d a rH i l l
Tw oR i v e r s
Pa r k
Pa ra d i s eR i d g ePa r k
Ly t l eFar m
Te dR h o d e s
Pa r k
C umber landR ive r
Mill Creek
Richl a nd Cree
k
L ong Creek
MC
Cro
ryCre ek
Bro
wn
sC
ree
k
Hurr
icane C re
ek
Harpet h River
Poplar Creek
Ewing
CreekN Fork
Indian Creek
Litt le Cree k
EatonC
reek
Otter C reek
Whi
tes Creek
Ewing Creek
Sulp h urC
reek
Sto n es
Cree k
Seven
M
ile
Cre
ek
Bull R un Creek
J PercyPriest
Reservoir
JEFFERSON ST
BLAIR BLVDR IVER RD
CHURCH ST
EST
ES
RD
3RD A
VE N
12
TH
AV
ES
KINGS LN
TUSCULUM RD
HARDING PL
BELL
RD
FOST
ER
AV
E
ANDERSON
RD
UV255
UV265
UV174
UV96
UV254
UV45
UV100
UV155
UV386
UV251
UV12
UV171
£¤41
£¤31e
£¤431
£¤70S
£¤31W
£¤31
£¤70
§̈¦24
§̈¦440
§̈¦65
§̈¦40
CITY OFGOODLETTSVILLE
CITY OFBERRY
HILL
CITY OFBELLE
MEADE
CITY OFFORESTHILLS CITY OF
OAK HILL
Multi-Purpose Field Level of ServiceN A S H V I L L E PA R K M A S T E R P L A N
Multi-purpose fieldsMulti-purpose field service areaParkState parkLand banked propertyTransect district/industrialCity boundarySatellite city boundary
0 2.5 5Miles ±
DRAFT10/07/2016
This map shows the level of service (LOS) analysis for multi-purpose fields. For this
analysis LOS is determined by 1 multi-purpose field within 3 miles. The service areas are
based on a dynamic analysis approach. This approach uses the full road network to
determine how an individual would travel the specified distance from each multi-purpose
field.
October 7, 2016. Copyright © The Trust for Public Land. The Trust for Public Land and The Trust for Public Land logo are federally registered marks of The Trust for Public Land. Information on this map is provided for purposes of discussion and visualization only. www.tpl.org
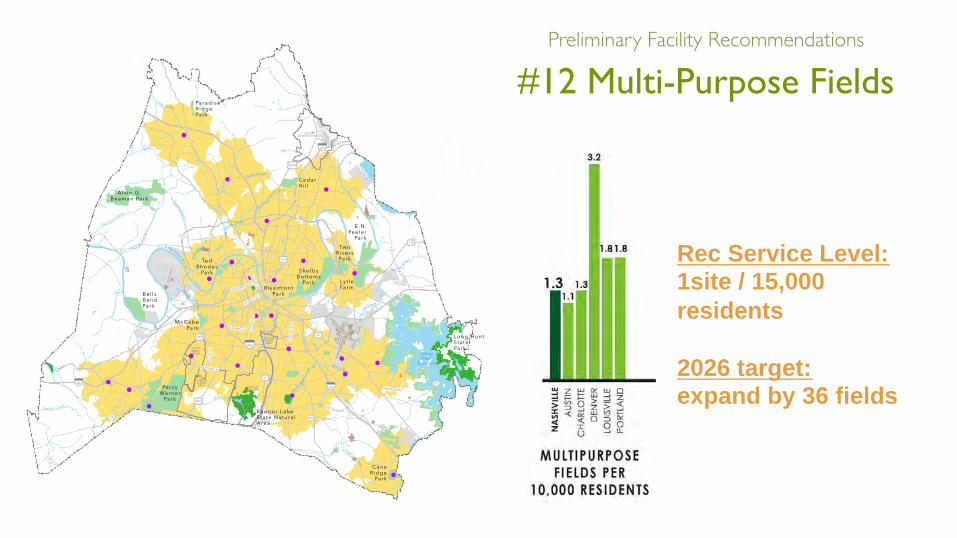
#12 Multi-Purpose Fields Preliminary Facility Recommendations
Rec Service Level: 1site / 15,000 residents 2026 target: expand by 36 fields
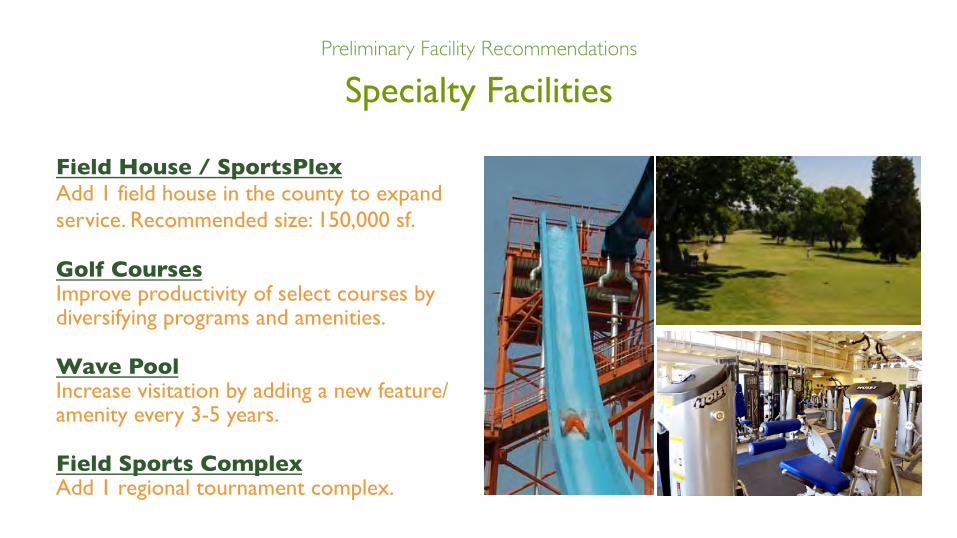
Field House / SportsPlex Add 1 field house in the county to expand service. Recommended size: 150,000 sf.
Golf Courses Improve productivity of select courses by diversifying programs and amenities.
Wave Pool Increase visitation by adding a new feature/amenity every 3-5 years.
Field Sports Complex Add 1 regional tournament complex.
Specialty Facilities Preliminary Facility Recommendations

PRELIMINARY RECOMMENDATIONS: PROGRAMS
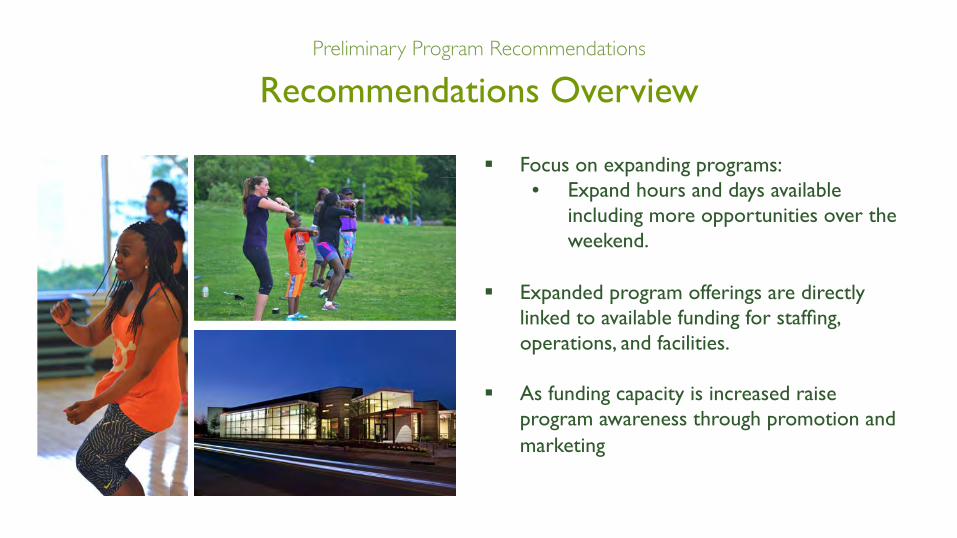
Recommendations Overview Preliminary Program Recommendations
§ Focus on expanding programs: • Expand hours and days available
including more opportunities over the weekend.
§ Expanded program offerings are directly
linked to available funding for staffing, operations, and facilities.
§ As funding capacity is increased raise
program awareness through promotion and marketing
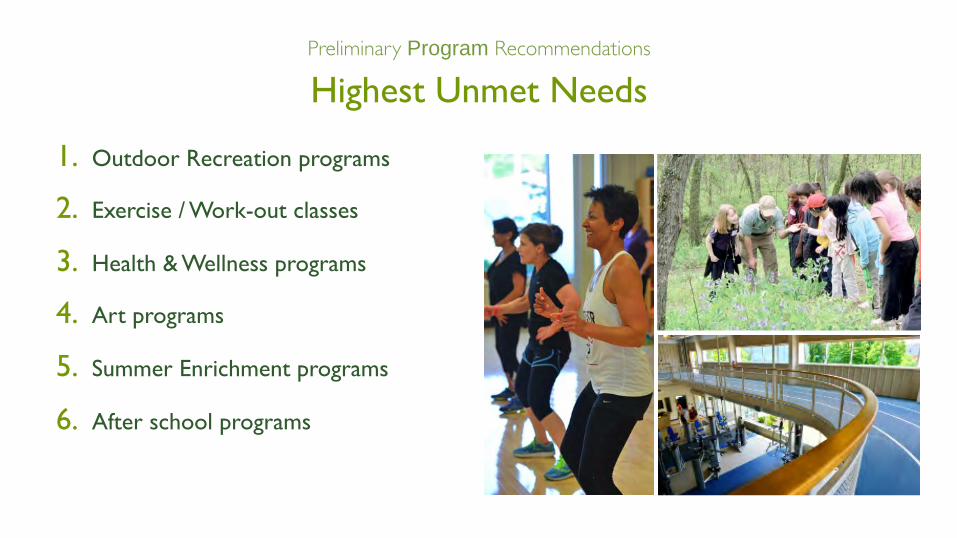
1. Outdoor Recreation programs
2. Exercise / Work-out classes
3. Health & Wellness programs
4. Art programs
5. Summer Enrichment programs
6. After school programs
Highest Unmet Needs Preliminary Program Recommendations
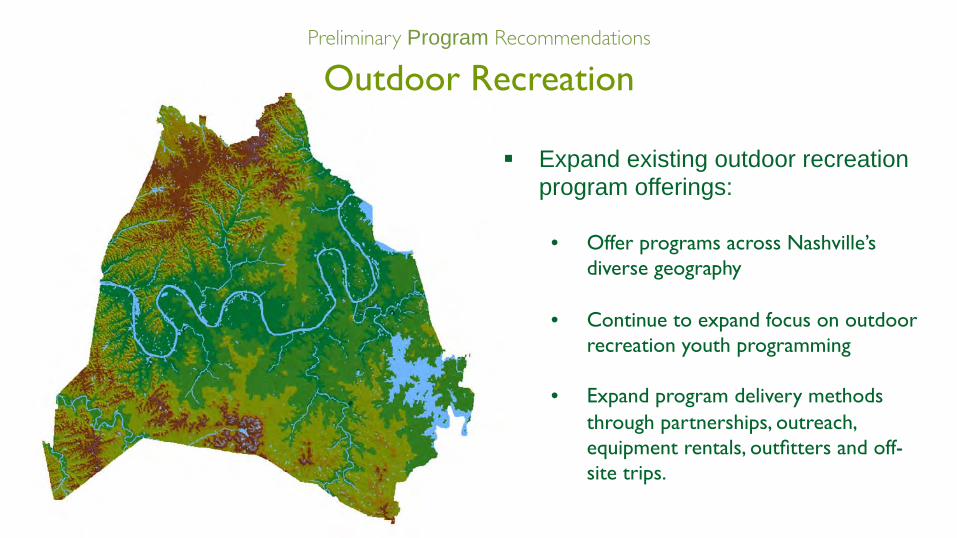
§ Expand existing outdoor recreation program offerings:
• Offer programs across Nashville’s
diverse geography
• Continue to expand focus on outdoor recreation youth programming
• Expand program delivery methods through partnerships, outreach, equipment rentals, outfitters and off-site trips.
Outdoor Recreation Preliminary Program Recommendations
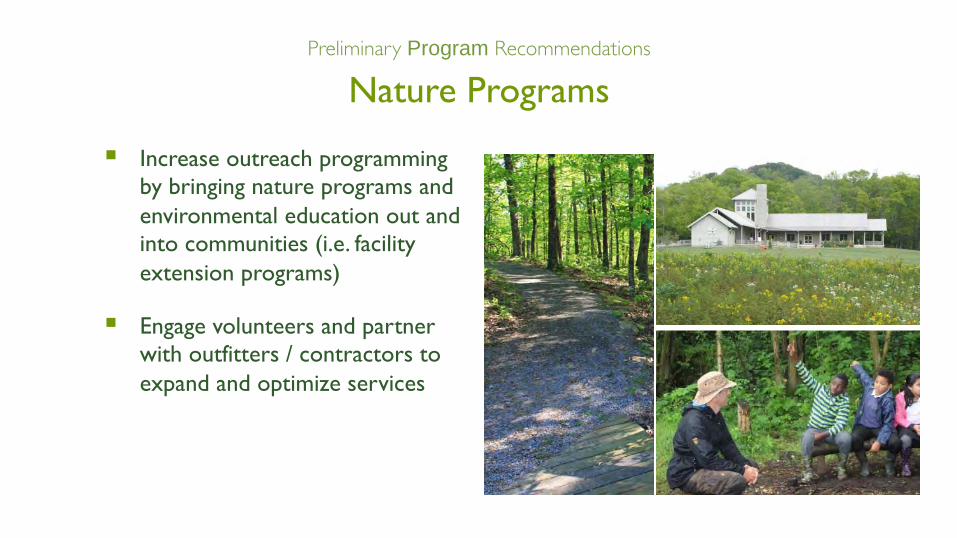
Nature Programs Preliminary Program Recommendations
§ Increase outreach programming by bringing nature programs and environmental education out and into communities (i.e. facility extension programs)
§ Engage volunteers and partner with outfitters / contractors to expand and optimize services
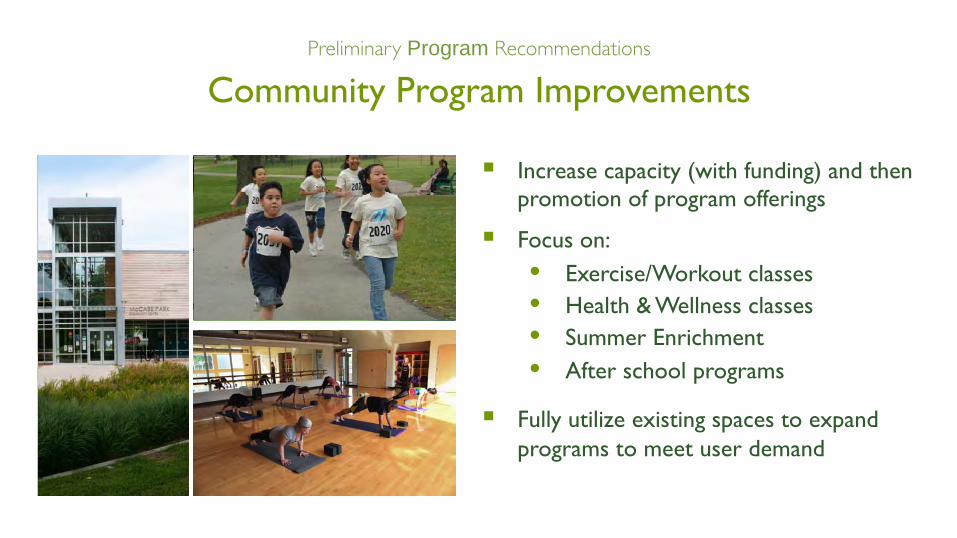
Community Program Improvements
§ Increase capacity (with funding) and then promotion of program offerings
§ Focus on: • Exercise/Workout classes • Health & Wellness classes • Summer Enrichment • After school programs
§ Fully utilize existing spaces to expand programs to meet user demand
Preliminary Program Recommendations
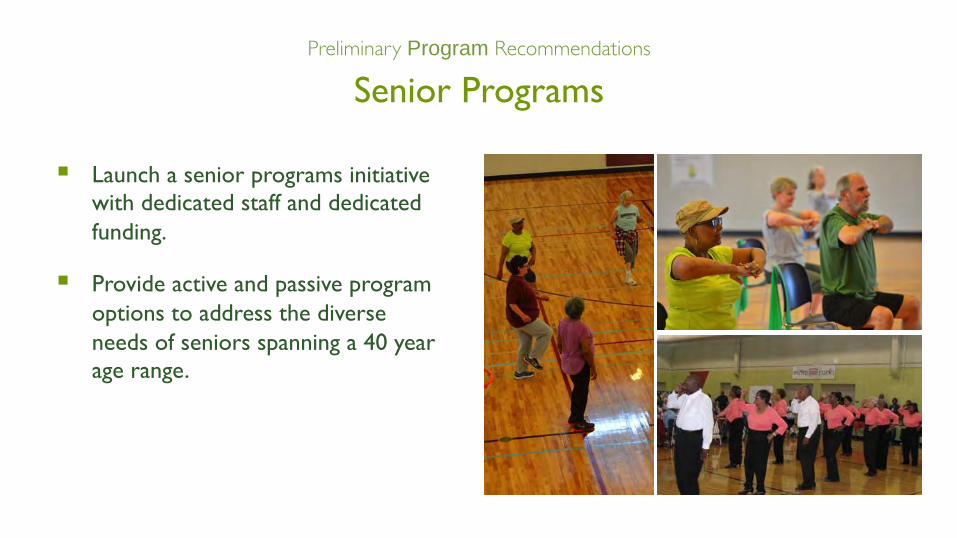
Senior Programs Preliminary Program Recommendations
§ Launch a senior programs initiative with dedicated staff and dedicated funding.
§ Provide active and passive program options to address the diverse needs of seniors spanning a 40 year age range.
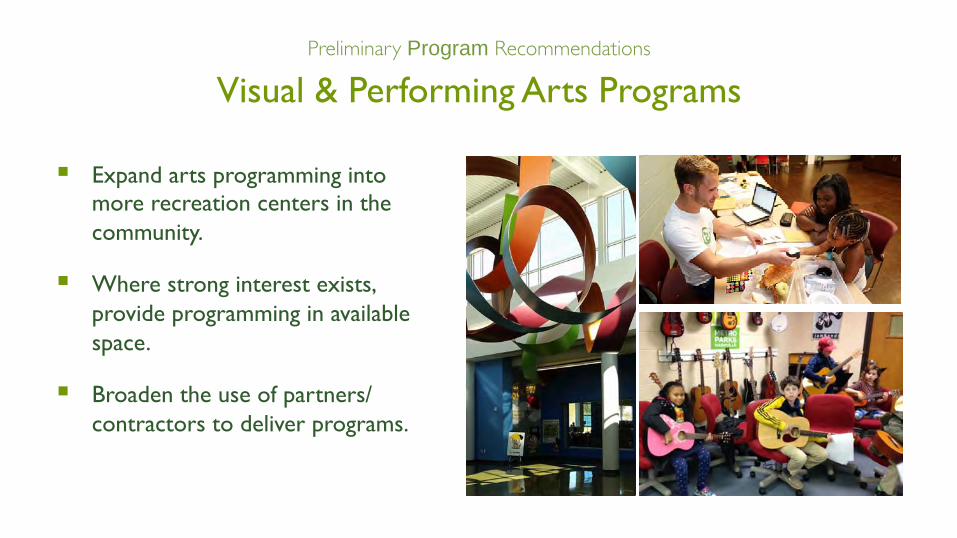
Visual & Performing Arts Programs Preliminary Program Recommendations
§ Expand arts programming into more recreation centers in the community.
§ Where strong interest exists, provide programming in available space.
§ Broaden the use of partners/contractors to deliver programs.
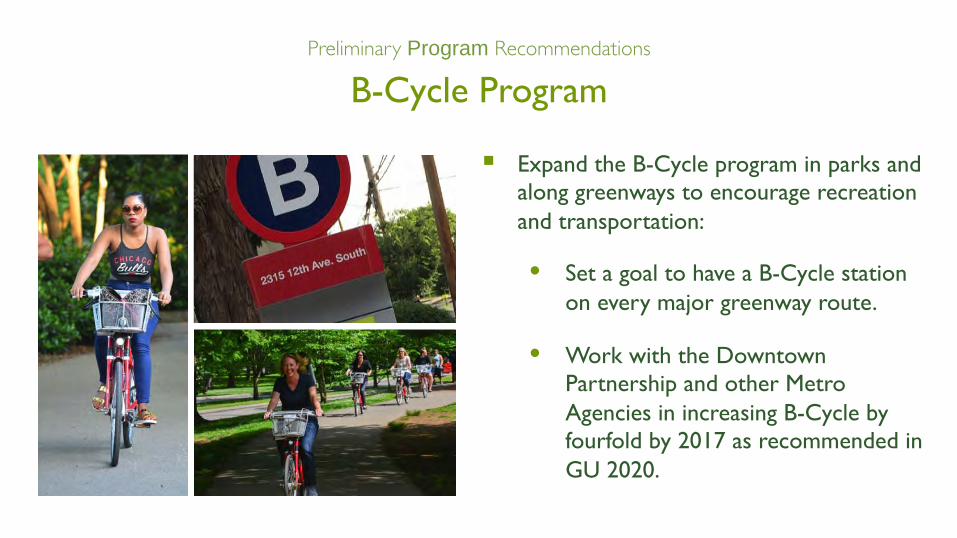
B-Cycle Program
§ Expand the B-Cycle program in parks and along greenways to encourage recreation and transportation:
• Set a goal to have a B-Cycle station on every major greenway route.
• Work with the Downtown Partnership and other Metro Agencies in increasing B-Cycle by fourfold by 2017 as recommended in GU 2020.
Preliminary Program Recommendations
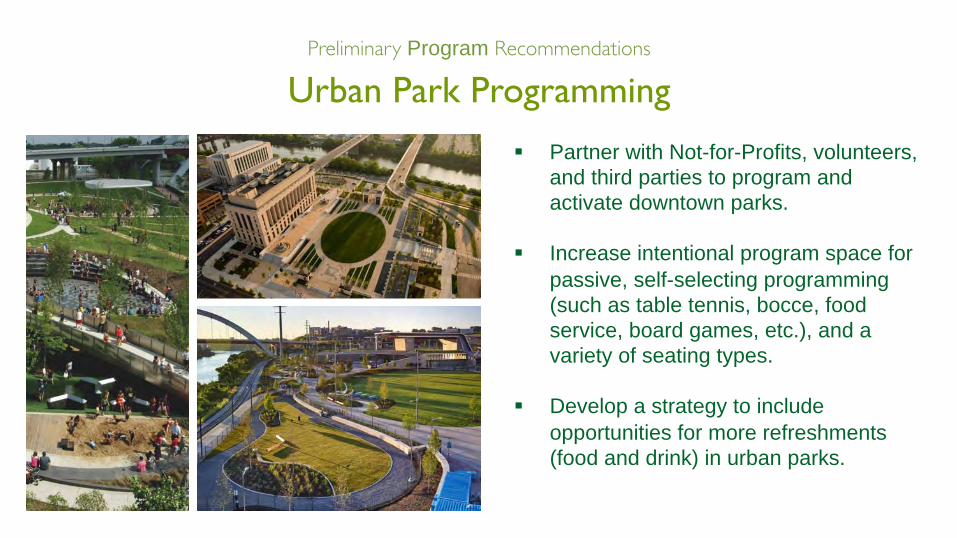
§ Partner with Not-for-Profits, volunteers, and third parties to program and activate downtown parks.
§ Increase intentional program space for
passive, self-selecting programming (such as table tennis, bocce, food service, board games, etc.), and a variety of seating types.
§ Develop a strategy to include
opportunities for more refreshments (food and drink) in urban parks.
Urban Park Programming Preliminary Program Recommendations
Website: plantoplay.nashville.gov
or search: Plan To Play Nashville
Facebook: @PlanToPlayNashville
Twitter: @PlanToPlayNash
Stay Connected Community Input