Plan and Take Action - Office of Superintendent of … · Web viewDistrict and School Data Team...
68
Plan and Take Action Getting Ready Identify Issues Understan d Issues Diagnose Causes Evaluate Results Tools 5.1: Describing the Desired End State 5.2: Writing Measurable Statements 5.3: Identifying Potential Strategies 5.4: Rating Strategies’ Potential for Success 5.5: Rating Feasibility of Implementation 5.6: Constructing a Logic Model 5.7: Developing an Action Plan 5.8:Developing an Washington Data Coaching Development PLAN AND TAKE ACTION Introduction – Where are we now? In Diagnose Causes, the team moved the inquiry forward by identifying the learner-centered problem and succinctly stating a problem of practice that it felt contributed to that problem. The team then consulted the literature and their colleagues to increase their understanding of the learner-centered problem and the problem(s) of practice. In Plan and Take Action, the team will build its capacity to design and monitor a plan for the implementation of an initiative that will solve the problem(s) of practice and positively impact the learner-centered problem that it identified in Identify Issues and Understand Issues and clearly stated in Diagnose Causes. Upon completion of Plan and Take Action, you will have: Written clear and measurable end state descriptions Identified best practice strategies to address the problem (s) of practice Created a logic model that links strategies to end states Developed a detailed action plan for the implementation of the identified strategies Constructed an implementation monitoring plan
Transcript of Plan and Take Action - Office of Superintendent of … · Web viewDistrict and School Data Team...

Washington Data Coaching Development
Plan and Take Action
Getting Ready
Identify Issues
Understand Issues
Diagnose Causes
Evaluate Results
Tools
5.1: Describing the Desired End State5.2: Writing Measurable Statements5.3: Identifying Potential Strategies5.4: Rating Strategies’ Potential for Success5.5: Rating Feasibility of Implementation5.6: Constructing a Logic Model5.7: Developing an Action Plan5.8:Developing an Implementation Monitoring Plan
PLAN AND TAKE ACTIONIntroduction – Where are we now?
In Diagnose Causes, the team moved the inquiry forward by identifying the learner-centered problem and succinctly stating a problem of practice that it felt contributed to that problem. The team then consulted the literature and their colleagues to increase their understanding of the learner-centered problem and the problem(s) of practice.
In Plan and Take Action, the team will build its capacity to design and monitor a plan for the implementation of an initiative that will solve the problem(s) of practice and positively impact the learner-centered problem that it identified in Identify Issues and Understand Issues and clearly stated in Diagnose Causes.
Upon completion of Plan and Take Action, you will have:
Written clear and measurable end state descriptions
Identified best practice strategies to address the problem (s) of practice
Created a logic model that links strategies to end states
Developed a detailed action plan for the implementation of the identified strategies
Constructed an implementation monitoring plan

It is our challenge to continually think of strategies, and the initiative itself (a collection of strategies), as the means to attain the desired end state, and think of impact, goals, outcomes, and targets as terms that describe that end state at different levels of immediacy or specificity.
District and School Data Team Toolkit Plan and Take Action
Defining Clear and Measurable End States
What do we Hope to Gain Through Implementing our Initiative?
To develop an effective plan of action, a data team needs to know what the plan is designed to accomplish, the desired end state, and how the team will know when that end state has been reached. Through the earlier steps in the inquiry process, your team has defined a learner-centered problem that underlies the priority issue and the related problem(s) of practice. The action plan to be developed will be designed to solve the problem(s) of practice, which will mitigate or eliminate the learner-centered problem and thus effectively address the priority issue that initiated the inquiry. The challenge is to express these results in terms that can guide the implementation of the initiative, provide feedback on its progress, and signal when the task has been completed.
The desired end state for the initiative is often called the impact, goal, outcome, target, or the objective. These terms are used in different contexts and can be confusing. To facilitate your work in Plan and Take Action, let’s operationally define them as follows:
Impact A longer-range, high-level result of the initiative that is not always directly measurable, such as increased motivation to do well in school.
Goal A high-level result of the initiative stated in general terms, such as improved student performance in mathematics.
Outcome A longer-range measurable change in behavior, such as continually improving grade 10 mathematics test scores.
Target A shorter-range measurable change, such as an annual increase as part of a multi-year initiative.
Objective Very specifically stated measurable result of a strategy or action steps taken to implement that strategy, such as adjusting the master schedule to allow collaboration time for teachers.
Another common point of confusion results when people think of strategies as the end state and not as the means to attain the desired end state. Strategies and goals are often interchanged in peoples’ minds. It is our challenge to continually think of strategies, and the initiative itself (a collection of strategies), as the means to attain the desired end state, and think of impact, goals, outcomes, and targets as terms that describe that end state at different levels of immediacy or specificity.
Page 2

District and School Data Team Toolkit Plan and Take Action
Examples of Desired End States Related to Problems of Practice
1. A majority of teachers will effectively use differentiated instructional techniques to meet the varied needs of learners in their classrooms.
2. All teachers will use data on their students’ performance to individualize instruction.3. Each teacher team will routinely use data to inform grade-level program decisions.4. Administrators will use student growth data and classroom observation rubrics to improve the
performance of individual teachers.
Examples of Desired End States Related to Learner-Centered Problems
1. The school as a whole, and each NCLB subgroup, will meet AYP targets annually.2. The cohort graduation rate will increase each year.3. High school graduates will be college and career ready.4. Unexcused absences from school will decrease each year at all grade levels.
Constructing a Meaningful End State Description
When writing a description of a desired end state, the terms Specific, Measurable, Attainable, Realistic, and Timely are often used. The acronym S.M.A.R.T1 is commonly associated with goals and objectives that are built with these characteristics in mind.
Specific end states are more likely to be achieved than those that are more loosely defined. Measurable end states have concrete criteria than can be used to monitor progress and provide
evidence that the end state has been reached. Attainable end states are those that the team believes can be reached. Most any end state is
attainable if the action plan is constructed wisely, the time frame is adequate, and all those involved in the planning and implementation of the initiative are committed to success.
Realistic end states are those that the team and stakeholders are both willing and able to work toward. An end state can be high and realistic, since a high goal often brings out the best in those who are implementing the initiative.
Timely end states are set in a time frame. Without a time frame, there is no sense of urgency and less effort and fewer resources may be devoted to the initiative.
Specificity when describing an end state is essential. When developing end state descriptions, it is critical to include specific information about who will be impacted by the initiative, what change will occur as a result of the initiative, the magnitude of the desired change, and the time frame. In addition, the team must determine if the end state they are describing is realistic and attainable within the real world context in which they function.
Determining the magnitude of the desired change often presents a challenge when teams are constructing measurable end states. The question is, how do you know what is a realistic and attainable change within the context of a given situation? Faced with this challenge, teams often look to their collective guts to set the magnitude of the improvement target without considering hard evidence about past performance or other available data. As a result, the target may be set too high or too low. It
Page 3
Describing the Desired End StateWriting Measurable Statements 5.1, 5.2
District and School Data Team Toolkit Plan and Take Action
is recommended that as much data about the impacted population as possible be analyzed to help the team set a realistic and attainable magnitude for the desired change.
Tools 5.1 Describing the Desired End State and 5.2 Writing Measurable Statements are related tools that will help the data team vision the results of the successful initiative and define that vision in measurable terms. Tool 5.2 Writing Measurable Statements provides background on the four elements of a good end state description and gives the team an opportunity to apply what it has learned.
Page 4

At Hidden Valley Once the Hidden Valley Data Team had clearly stated the learner-centered problem and problem of practice, and had gathered research and local data on each, team was in a position to describe, and state in measurable terms, the desired end state that would result when the problems were appropriately addressed. After using tool 5.1 Describing the Desired End State to build its capacity to identify the end states, the team used tool 5.2 Writing Measurable Statements to help them describe the desired end state for student outcomes and professional practice and to write measurable outcome statements for each. The team described the end states as:Measurable Learner-centered End State (student outcomes):The percentage of students who leave Carter Tech at the end of 8th grade will decrease from 70% in 2009–10 to 30% in 2012–13.Change in Practice:A system of tiered intervention to provide academic support and counseling for grade 7 and 8 students who may not meet the criteria for advancement to the next grade will be implemented in lieu of retention by the beginning of the 2011–12 school year.
At Hidden Valley Based on the research that it has done, the Hidden Valley Data Team has described the desired end states in measurable terms and can move forward to identify high impact strategies that are feasible to implement given the context of their local situation. The team used tools 5.3 Identifying Potential Strategies and 5.4 Rating Strategies’ Potential for Success to help identify these strategies and to select those that would be feasible to implement. The team decided to implement an initiative based on the following strategies:Differentiated instruction through tiered interventions (RtI)Elimination of the retention policyEnhanced college and career counselingTargeted counseling and support for at risk students
Identifying Potential StrategiesRating Strategies’ Potential for Success
5.4
Rating Feasibility of Implementation
5.4
5.5
District and School Data Team Toolkit Plan and Take Action
Identifying Potential Best Practice Strategies Once any team has
written a measurable statement that describes the desired end state, it needs to determine how best to address the identified problem of practice so that the end state can be realized. In Diagnose Causes, you and your team explored ways to learn as much as possible about the identified learner-centered problem and related problem of practice. Tools 4.7 Building Your Knowledge Base and 4.8 Consulting Your Colleagues helped the team begin to identify best practice strategies described in the literature and employed by their colleagues to reach the desired end state.
Armed with the knowledge gained from consulting the literature and colleagues, a team is now in a position to identify strategies that may address the root cause and problem of practice. Once identified, the team can decide which of the strategies are most likely to be effective in achieving the desired end state. Tools 5.3 Identifying Potential Strategies and 5.4 Rating Strategies’ Potential for Success will help the team identify and select high impact strategies.
It takes more than a good set of strategies to ensure the problem of practice will be solved. The capacity of the organization and infrastructure will also impact the success of the initiative. Once the high impact strategies have been identified, the data team can use tool 5.5 Rating Feasibility of Implementation to determine if the institutional environment will support the identified high impact strategies. Through the use of tools 5.3 Identifying Potential Strategies, 5.4 Rating Strategies’ Potential for Success, and 5.5 Feasibility of Implementation, the data team will be able to
Page 5

District and School Data Team Toolkit Plan and Take Action
select the evidence-based strategies that will have the most impact on the problem(s) of practice and that are likely to be successfully implemented.
Page 6
District and School Data Team Toolkit Plan and Take Action
Implementation, Scaling-up, and Sustainability
Now that you have researched best practice and high-impact strategies to address the learner-centered problem and the problem(s) of practice, it is time to plan for the implementation of those best practices through action planning. Before we begin the actual planning, however, it is important to take a step back and think about the implementation process.
In 2003, Grigg, Daane, Jin, & Campbell (in Fixsen, Naoom, Blase, & Frances, 20072) noted that in the 20 years since A Nation at Risk was published, billions of dollars had been spent on high-quality scientific research to identify best practices that can be employed by educators to improve the performance of students in the United States. Over this time period, “… the National Assessment of Educational Progress showed the achievement of U.S. students was virtually identical to what it was in the early 1980s.” In the article Implementation: The Missing Link between Research and Practice, Dean Fixsen and his colleagues make the case, based on their synthesis of the literature on implementation science, that the quality of the implementation process is the key link between sound research and desired outcomes (Fixsen et al, 2007). That being said, it is particularly important for your data team, and the other stakeholders involved in efforts to address the identified problems, to pay close attention to the fidelity and intensity of the implementation of the evidence-based best practices you have selected as you develop the action plan that will guide your work over time.
In addition to fidelity and intensity issues, the data team and stakeholders need to consider the infrastructure that needs to be in place to not only promote effective implementation, but to also set the stage for taking the initiative to scale—ensuring that an effective initiative impacts the majority of students—and promoting the sustainability of the initiative over time.
The State Implementation and Scaling-up of Evidence-based Practices (SISEP) Center located at the Child Development Institute of the University of North Carolina has researched and disseminated strategies to help states establish capacity to carry out effective implementation, organizational change, and systems transformation. The Center defines scaling-up innovations in education as providing the initiative to at least 60% of the students who could benefit from them. To accomplish this, states, districts, and schools must capitalize on every opportunity to develop and institutionalize the infrastructure needed to support the full and effective use of the initiative.
The Center notes that many initiatives or innovations that implement evidence-based best practices do so as pilot or demonstration projects and that, although these efforts are a necessary part of the change process, they rarely lead to widespread or sustainable use. The Center’s research suggests that part of the reason for this is that attention is not paid to making the systems changes (e.g., policy, funding, and/or regulatory changes) or establishing implementation capacity. To overcome this, the Center suggests that organizations establish transformation zones that address not only the initiative, but also focus on infrastructure development. Transformation zones “…establish simultaneously new ways of work (the intervention) and the capacity to support the new ways of work (infrastructure to assure effective use of the intervention).”3 At the outset, the transformation zone is a relatively narrow vertical slice through the organization centered on the initiative that touches all aspects of the infrastructure that are necessary to support the effectiveness of implementation. As success of the initiative is
Page 7

District and School Data Team Toolkit Plan and Take Action
supported through progress monitoring and the evaluation of outcomes, the transformation zone can be broadened to encompass a larger segment of the organization and impact a larger population (i.e., it can be scaled-up). Additionally, since attention has been paid to building the infrastructure necessary to support the successful initiative, the stage has been set to sustain the initiative over time. As a result, “…in four or five years the entire system is in the transformation zone, and the innovation and the implementation infrastructure are embedded as standard practice.”4
As the data team moves forward with the action planning and evaluation components of the District and School Data Team Toolkit, it is important to keep these concepts in mind. Action plans and implementation monitoring plans should include action steps and feedback mechanisms that address not only the evidence-based best practices, but the process of implementation and infrastructure development.
Please see the Resources portion of this toolkit on page 14 for further information on stages of implementation, the core components or key drivers of the implementation process, and the infrastructure or systems that need to be in place or considered up front to enhance the effectiveness, impact, and sustainability of the initiative.
Page 8

A logic model shows the logical connection between the initiative (one or more strategies) and the desired end state or result.
At Hidden Valley In preparation for creating an action plan for the implementation of their initiative, the Hidden Valley Data Team created a high-level logic model to guide its work. The team used tool 5.6 Constructing a Logic Model to create a logic model that was based on the general proposition that:IF we implement the best practice strategies with appropriate fidelity and intensity,THEN, the desired measurable end states will be achieved.In conjunction with the development of the logic model, the team also reviewed tool 6.1 Developing an Evaluation Plan to ensure that they were mindful of the provisions that need to be made, up front, to ensure that the team would have the data to provide evidence of the success of the initiative.
District and School Data Team Toolkit Plan and Take Action
Creating a Logic Model
So far we have defined problems and desired end states. It may be tempting to leap into action right now, or at the very least begin articulating the action steps that can and should be taken on route to your success. However, before launching action, it is useful to begin by developing a high level map of your course from current state to end state.
A logic model shows the logical connection between the initiative (one or more strategies) and the desired end state or result. The logic model is expressed in terms of an If… Then proposition (just like we learned in our high school geometry class).
If X is true, Then Y will logically follow.
In the case of action planning, the proposition is: If the high-impact strategies are implemented faithfully and effectively, Then the problem of practice will be corrected and the learner-centered problem solved. This logic model shows the overall relationship between the strategies and the desired end state. The logic model can also contain more limited propositions that show the relationship between strategies and objectives, objectives and action steps, implementation indicators and interim outcomes.
In addition to helping the team shape the steps of its action plan, the logic model will facilitate communication with stakeholders about the outcome of the initiative and how the actions being taken are connected to those outcomes.
Page 9

Constructing a Logic Model5.6
District and School Data Team Toolkit Plan and Take Action
Tool 5.6 Constructing a Logic Model provides a template that will help the team develop a model to guide the construction of the action plan needed for the implementation of the initiative. The logic model the team creates will also be critical for evaluating the impact of its work later. As the team prepares to construct a logic model, it should also review 6.1 Developing an Evaluation Plan to be sure to lay the groundwork for evaluating the improvement effort. As the team works through the development of the logic model, it needs to keep the following proposition in mind:
IF we successfully implement the high-impact strategies to address the problem of practices, THEN we can expect to reach the measurable objectives related to each strategy.
IF each objective is reached, THEN the problem of practice improvement target will be attained. IF the problem of practice improvement target is attained, THEN the learner-centered problem
improvement target should be met.
Page 10

At Hidden Valley The logic model constructed by the Hidden Valley Data Team provided guidance for the development of an action plan that described the nuts and bolts of the implementation effort. The team used the logic model and tool 5.7 Developing an Action Plan.
District and School Data Team Toolkit Plan and Take Action
Developing an Action Plan
The logic model provides a firm conceptual base that will enable the team to develop an action plan for the implementation of the initiative. Where the logic model is a conceptual overview of your intended course, the action plan spells out the detailed steps of the implementation process.
The action plan provides the practical information needed for the successful implementation of the initiative by identifying:
The desired end state/improvement target Each of the high-impact strategies that will lead to the desired end state Measurable objectives to guide the implementation of each of the strategies A person responsible for overseeing the implementation of each strategy/objective/ action step The steps that need to be taken to achieve each objective. Each action step should be focused on
reaching one of the measurable objectives or working together with other action steps to reach an objective. Keep them simple!
A timeline for implementation (date at which an action step is completed or, in the case of an ongoing action, is up and running)
Inputs or resources needed to support the implementation effort
Tool 5.7
Developing an Action Plan provides a template for constructing an action plan that includes the information referenced above.
Page 11

District and School Data Team Toolkit Plan and Take Action
Constructing an Implementation and Monitoring Plan
Many teams feel that their work is done once the action plan has been constructed—actually the work has just begun. The challenge now is to ensure that the implementation of the initiative is conducted as planned and that adjustments are made in response to feedback and data analysis. The monitoring and fine tuning of the initiative will be much easier if the team has:
1. Identified and clearly stated the priority issue and learner-centered problem2. Identified and clearly stated the problem of practice that contributes to the learner-centered
problem3. Created measurable end state statements4. Identified best practice strategies shown to have an impact on the problem of practice
Constructed measurable objectives for each strategy5. Developed a complete action plan
Using what you have learned and written into your action plan, your team can now create an implementation monitoring plan that will allow the team to systematically collect, analyze, report, and act on data generated as the initiative is implemented. Through the use of this formative feedback (data collection and analysis), the team will be able to make mid-course corrections as necessary and, of equal importance, report progress to stakeholders.
Critical to the effectiveness of an implementation monitoring plan is the identification of implementation and progress indicators that not only report on the completion of action steps, but also provide information about the effect that those actions have had. For instance, it is necessary to gather data on the number of professional development sessions that were held and the number of participants at each session (often referred to as outputs), but those data are not sufficient to inform decisions about the effectiveness of those professional development sessions. Additional data need to be collected on how teacher behavior has been changed through participation in the professional development sessions (e.g., are teachers now able to implement the strategy that was introduced through the professional development session?)
Page 12

Developing an ImplementationMonitoring Plan 5.8
At Hidden Valley With the completed action plan in hand, the Hidden Valley Data Team took a step back to think about how it would monitor the implementation of the plan to ensure that the strategies were carried out with appropriate fidelity and intensity and that progress was being made toward the desired end states. Using the action plan and tool 5.8 Developing an Implementation Monitoring Plan as a guide, the team identified implementation indicators and interim outcomes that would provide evidence that the initiative was on the right track. Feedback derived from these indicators and outcomes would also enable the team to make mid-course corrections if necessary and would provide information on the initiative’s progress that could be reported to stakeholders on a regular basis.
District and School Data Team Toolkit Plan and Take Action
By
creating an implementation monitoring plan, the team will be proactive in identifying factors that will inform its decisions about the progress of the initiative and what changes need to be made as the initiative moves forward. By identifying up front the data needed to inform the team’s decisions and how and when those data will be collected, the team will ensure that the data will be available when needed to monitor progress and communicate with stakeholders. Tool 5.8 Developing an Implementation Monitoring Plan provides instructions that will help the team develop an effective implementation monitoring plan. The template provided will enable the team to walk, step-by-step, through the identification of implementation indicators and interim outcomes for each strategy and its associated objectives. In each cell of the template, the team can identify activities, participation, adult and student outcomes, and the data needed to inform decisions about each of these indicators.
Page 13

District and School Data Team Toolkit Plan and Take Action
Summary
Through Getting Ready to Plan and Take Action of the District and School Data Team Toolkit, the data teams have learned how to identify a critical issue, the learner-centered problem, and the problem(s) of practice that contribute to the leaner-centered problem . The team has developed an action plan to address the issue and an implementation monitoring plan to ensure that the plan is implemented faithfully and with appropriate intensity.
A thoughtfully designed intervention addresses the learner-centered problem and the associated problem of practice. If effectively implemented, the intervention leads to improved practices, the solution of the learner-centered problem and improved outcomes for students. Figure 1 below summarizes the process.
As the initiative is implemented, the team will monitor its progress and make mid-course adjustments as indicated. The team will assess the implementation indicators and interim outcomes to ensure that the initiative is being implemented faithfully and with appropriate intensity. They will also use the monitoring information to keep stakeholders informed of the progress of the initiative. In Evaluate Results, the team will develop the skills necessary to plan, conduct, and report on the evaluation of the initiative. They will identify, up front, the data that will need to be collected to provide the evidence they will need to answer two fundamental questions: 1) Did the initiative have the desired impact? 2) Why was, or wasn’t, the initiative effective? The logic model, objectives, and measurable end state descriptions developed in Plan and Take Action are critical components of the evaluation plan that the team will develop and eventually implement. Now the challenge is to implement the plan and evaluate the results.
Page 14
Figure 1. End States Flow Chart ©2012 Public Consulting Group, Inc.

References
1 Top Achievement. (n.d.). Creating S.M.A.R.T. Goals. Retrieved 2012, from TOP Achievement Self Improvement An Personal Development Community: http://topachievement.com/smart.html2 Fixsen, D. L., Naoom, S. F., Blase, K. A., & Frances, W. (2007). Implementation: The Missing Link Between Research and Practice. The APSAC Advisor.3 State Implementation and Scaling-up of Evidence-based Practice (2010). Tools to support the Development of a coherent and Aligned System FPG Child Develop Institute, University of North Carolina Chapel Hill, The National Implementation Research Network, September, 2010.4 State Implementation and Scaling-up of Evidence-based Practice (2010). Stage-Based Measures of Components: Installation Stage Action Planning Guide for Implementation FPG Child Develop Institute, University of North Carolina Chapel Hill, The National Implementation Research Network, Page 2, September 2010.
Resources
An Implementation Informed Approach to Education Initiatives in Washington State: State Implementation and Scaling-up of Evidence-based Practices (SISEP): University of North Carolina FPG Child Development Institute; PowerPoint Presentation: Chapel Hill, NC. June, 2012.Stages of Implementation: An Introduction: State Implementation and Scaling-up of Evidence-based Practices (SISEP): University of North Carolina FPG Child Development Institute; Chapel Hill, NC Implementation Action Plan: State Implementation and Scaling-up of Evidence-based Practices (SISEP): University of North Carolina FPG Child Development Institute: Chapel Hill, N.C. Adapted from MiBLSi 10/20/11.Implementation Drivers by Stage of Implementation: National Implementation Research Network (NIRN); Implementation Drivers: An Initial Conversation When Planning or Reviewing a Practice, Program or Initiative: National Implementation Research Network (NIRN).
District and School Data Team Toolkit Plan and Take Action
Page 15

To develop a shared vision among the data team and all stakeholders of what the desired end state will look like.The team will clearly visualize what it will look like if the initiative is successful.
30 minutes of team meeting time and additional time for stakeholder collaboration.
5.1District and School Data Team Toolkit
5.1 Describing the Desired End State
Before planning and taking action, it is critical for all stakeholders to share a common vision of the desired outcome of the initiative. The team has identified and achieved consensus on the learner-centered problem and the problem of practice. It is now important for the team to clearly visualize what it will look like, the desired end state, if the initiative is successful in addressing the problem of practice and the underlying problem. Examples of desired end states can be found on page 3 of the Plan and Take Action handbook.
Directions:
1. Based on your research and feedback gathered from your colleagues, work with your team to brainstorm the desired end state1: what it would look like if the identified problem of practice was solved. Appoint a note taker to record your suggestions on chart paper.
2. Once each team member has made his/her suggestions, reach consensus on a succinct description of what the desired end state should look like.
3. Using Tool 1.4D Communication Organizer Template introduced in Getting Ready, share the team’s description of the desired end state with key stakeholders. Adjust the statement based on stakeholder feedback as appropriate.
1 Portions of this tool were developed within the DATAUSE project (Using Data for Improving School and Student Performance) by the consortium of partners including: Public Consulting Group, University of Twente (the Netherlands), Institute of Information Management Bremen GmbH (Germany), Modern Didactics Center (Lithuania) and Specialist Schools and Academies Trust (UK). For more information on the project please visit: www.datauseproject.eu
Page 17

To learn how to create measurable outcome targets and implementation goals.The data team will review the components of a well written measurable target or goal statement. They will also practice writing measurable targets and goal statements.
About 45 minutes.
5.2District and School Data Team Toolkit
5.2 Writing Measurable Statements
Directions:
1. Review Elements of a Well-Written Measurable Statement 2 (page 20).2. Using the Elements of a Well-Written Measureable Statement document as a guide, each data
team member should create a well-written statement for each of the scenarios described on pages 21–26 by:
Identifying each of the four elements of a well-written measurable statement Writing a clear target/goal statement
3. As a data team, reach consensus on the most appropriate measurable statement for each scenario. Possible answers are included in Possible Answers to Scenarios (pages 25–30). You may want to consult the answers after your discussion.
2 Portions of this tool were developed within the DATAUSE project (Using Data for Improving School and Student Performance) by the consortium of partners including: Public Consulting Group, University of Twente (the Netherlands), Institute of Information Management Bremen GmbH (Germany), Modern Didactics Center (Lithuania) and Specialist Schools and Academies Trust (UK). For more information on the project please visit: www.datauseproject.eu
Page 19

5.2District and School Data Team Toolkit
Elements of a Well-Written Measurable Statement
Typical Goal or Desired Outcome
Increase the achievement of all students in mathematics.
Typical Goal Statement
Increase the percentage of students who score at the proficient level on the state mathematics assessment.
A clearer and more useful statement would address the following questions:
1. What will change? The percentage of students who score at the proficient level .
2. For what population? All students who are taking the state assessment .
3. By how much? In this example, the target could be to reach 80% in 4–5 percentage point annual
increments. 4. By when?
In this example, within 5 years .The resulting measurable statement (compare to the typical statement above):
To increase the percentage of all students who score at the proficient level on the state mathematics assessment to 80% within the next five years.
Page 20
A Few Words about Targets and Timeframes
Sometimes the ultimate target we must set or the timeframe in which we must accomplish our goals are given to us by state or district policies that are outside of our control. For example, NCLB required schools to have an ultimate goal of all students reaching proficiency in reading and mathematics by 2014. If a target and timeframe have been handed down to you, the gap between the current proficiency level and the target level could be broken down into annual incremental targets if desired.
(Target level - current level)(Target year-current test year)
If an external target and timeframe are not given, it is important to set them in a meaningful and realistic way. For example, if the percent proficient at the state level is 75% and the percent proficient in similar districts is 78%, those might be realistic targets to strive for. If the local percent proficient in math was 58%, 56%, 57%, and 59% over the past four years, it is unlikely that 80% of the local students would be proficient after the first year of the intervention. It would be more realistic to set a target of 80% after five years of the initiative with a predicted 4–5 percentage point increase each year to reach the 80% level in about five years.

5.2District and School Data Team Toolkit
Scenarios
Scenario 1A: Learner-Centered Problem End State Description
The Hidden Valley School District needs to determine if the new grade 3–6 reading program purchased in 2009 and used with the English language learners (ELLs) with special needs has been effective in reducing the performance gap between special education and general education ELLs as measured by the Measurements of Student Progress (MSP) reading test from 10 percentage points to 0 by the 2012 test.
Elements:
What will change? For whom? By how much? By when?
Statement:
Scenario 1B: Problem of Practice End State Description
The performance gap in reading between ELL students with special needs and general education students with special needs did not decrease since the introduction of the new reading series in 2008–2009 as measured by the 2010 Measurements of Student Progress (MSP) reading test. Staff surveys and supervisor observations confirmed that teachers were not adequately prepared to implement the new reading program. A summer workshop with embedded professional development for all teacher teams was held during the 2010–2011 school year to address this problem of practice.
Elements:
What will change? For whom? By how much? By when?
Statement:
Page 21

5.2District and School Data Team Toolkit
Scenario 2A: Learner-Centered Problem End State Description
In response to chronically low mathematics performance across the district, the superintendent reallocated resources from the professional development budget to the salary account to fund the hiring of mathematics coaches to provide embedded professional development for the middle school mathematics teachers in one of the two district middle schools. The superintendent hoped to see a significant increase in the percent of proficient students (at least a 10 percentage point increase) in the middle school students whose teachers had participated in the embedded professional development provided by mathematics coaches within three years.
Elements:
What will change? For whom? By how much? By when?
Statement:
Scenario 2B: Problem of Practice End State Description
Through surveys and conversation with her staff, the K–12 math supervisor determined that the majority of middle school math teachers did not have the content or pedagogic background needed to successfully implement the new standards-based mathematics curriculum. She convinced the superintendent to reallocate resources from the professional development budget to the salary account to fund the hiring of mathematics coaches to provide embedded professional development for the middle school mathematics teachers during the 2011–12 school year to address this perceived need.
Elements:
What will change? For whom? By how much? By when?
Statement:
Page 22

5.2District and School Data Team Toolkit
Scenario 3A: Learner-Centered Problem End State Description
The superintendent of the Hidden Valley School District reviewed cohort graduation data (same students grade 9 to grade 12) for the class of 2009 and was shocked to see that only 80% of the cohort graduated on time, while the state average was 95%. The superintendent instructed the assistant superintendent to work with the district data team to develop a measurable improvement target for the class of 2014, in order to bring the district in line with the current state graduation rate.
Elements:
What will change? For whom? By how much? By when?
Statement:
Scenario 3B: Problem of Practice End State Description
The On Time Graduation Task Force in the Hidden Valley School District reviewed data on students who did not graduate with the class of 2009 and the prior five graduating classes. The data suggested that these students were not identified as at-risk students and therefore did not receive dedicated support services. The Task Force recommended to the superintendent that the district establish a protocol, by the beginning of the 2010–11 school year, to be used at each grade level to identify at-risk students.
Elements:
What will change? For whom? By how much? By when?
Statement:
Page 23

5.2District and School Data Team Toolkit
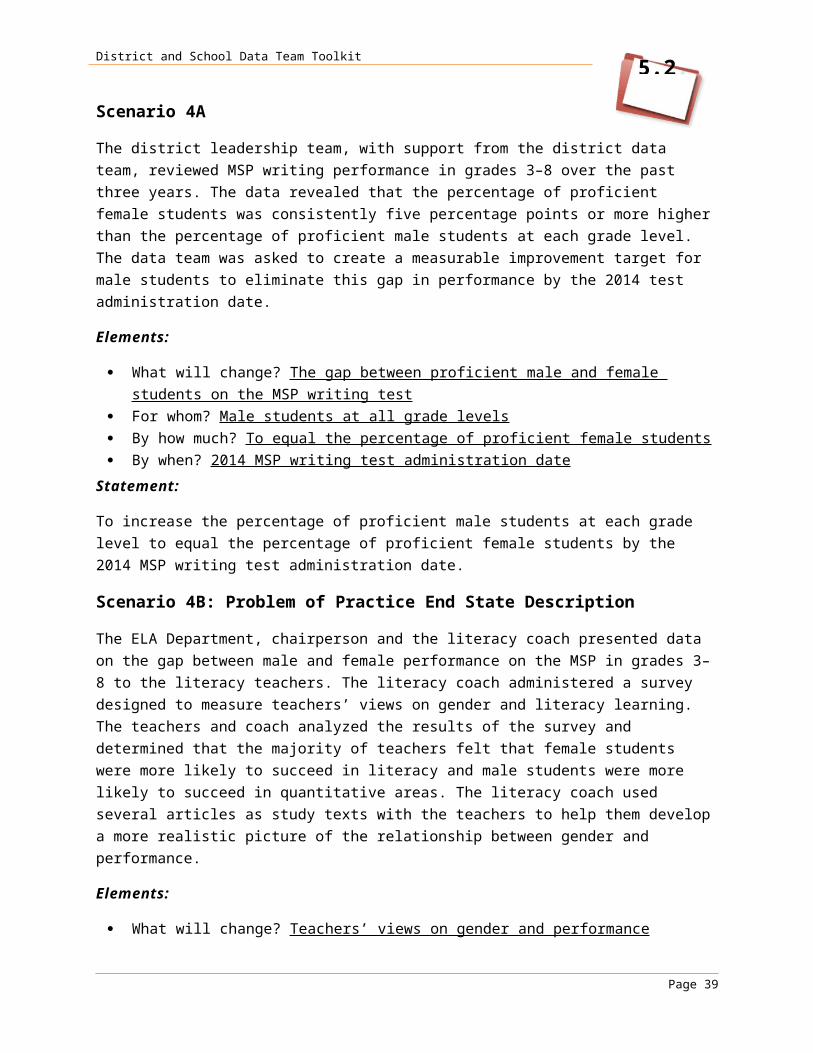
Scenario 4A: Learner-Centered Problem End State Description
The district leadership team, with support from the district data team, reviewed MSP writing performance in grades 3–8 over the past three years. The data revealed that the percentage of proficient female students was consistently five percentage points or more higher than the percentage of proficient male students at each grade level. The data team was asked to create a measurable improvement target for male students to eliminate this gap in performance by the 2014 test administration date.
Elements:
What will change? For whom? By how much? By when?
Statement:
Scenario 4B: Problem of Practice End State Description
The ELA Department, chairperson and the literacy coach presented data on the gap between male and female performance on the MSP in grades 3–8 to the literacy teachers. The literacy coach administered a survey designed to measure teachers’ views on gender and literacy learning. The teachers and coach analyzed the results of the survey and determined that the majority of teachers felt that female students were more likely to succeed in literacy and male students were more likely to succeed in quantitative areas. The literacy coach used several articles as study texts with the teachers to help them develop a more realistic picture of the relationship between gender and performance.
Elements:
What will change? For whom? By how much? By when?
Statement:
Page 24

5.2District and School Data Team Toolkit
Scenario 5A: Learner-Centered Problem End State Description
During the district principals’ meeting, the principals of the four district high schools noted that the data displays the district data team provided clearly showed a positive relationship between high absence and low performance on the High School Proficiency Examination (HSPE). On the 2009 HSPE, 30% of the tested students had been absent for ten or more days prior to test administration. Of these, 90% scored at the failing level. The principals worked together, with support from the district data team, to create an improvement goal for attendance in their schools that would have no student with 10 or more absences prior to the 2012 test administration date.
Elements:
What will change? For whom? By how much? By when?
Statement:
Scenario 5B: Problem of Practice End State Description
The district’s high school principals, led by the district data team, used several protocols to determine the root cause of absenteeism in their schools. The driving causes appeared to be the lack of faculty knowledge of the consequences of absenteeism and the faculty’s poor implementation of the district’s attendance policies. To address these causes, the leadership team conducted a session during the 2012 summer faculty institute during which the district attendance policy was reviewed, clear expectations for the implementation of the policy were established, and data were provided on how absenteeism affects students’ academic and social performance.
Elements:
What will change? For whom? By how much? By when?
Statement:
Page 25

5.2District and School Data Team Toolkit
Scenario 6A: Learner-Centered Problem End State Description
While investigating the cohort graduation rate, the assistant superintendent noticed that students who were retained in grade 9 generally didn’t graduate with their class. Five percent of the students in the class of 2011 had been retained in grade 9 and only 10% of those students graduated with their class. To develop an action plan to address this problem, the assistant superintendent must create a measurable target for the reduction of grade 9 retention for the class of 2016 to 1%.
Elements:
What will change? For whom? By how much? By when?
Statement:
Scenario 6B: Problem of Practice End State Description
Retention in grade 9 was determined to correlate with dropping out of school. The 9 th grade faculty met to determine the root cause of retention. They identified the lack of early identification practices and inadequate support services as the major contributors to retention in 9th grade. To address these problems of practice the 9th grade team, principal, and assistant superintendent for instruction developed a protocol for the identification of at risk students and support staff were hired and trained to work individually with these students to ensure that they met promotion requirements.
Elements:
What will change? For whom? By how much? By when?
Statement:
Page 26

5.2District and School Data Team Toolkit
Possible Answers to Scenarios
Scenario 1A
The Hidden Valley School District needs to determine if the new grade 3–6 reading program purchased in 2009 and used with the English language learners (ELLs) with special needs has been effective in reducing the performance gap between special education and general education ELLs as measured by the Measurements of Student Progress (MSP) reading test from 10 percentage points to 0 by the 2012 test.
Elements:
What will change? Gap between special education and general education For whom? English language learners with special needs By how much? 10 percentage points By when? 2012
Statement:
To decrease the gap between special education and general education ELLs’ performance on the MSP reading test from 10 percentage points on the 2009 tests to 0 on the 2012 test.
Scenario 1B: Problem of Practice End State Description
The performance gap in reading between ELL students with special needs and general education students with special needs did not decrease since the introduction of the new reading series in 2008–2009 as measured by the 2010 Measurements of Student Progress (MSP) reading test. Staff surveys and supervisor observations confirmed that teachers were not adequately prepared to implement the new reading program. A summer workshop with embedded professional development for all teacher teams was held during the 2010–2011 school year to address this problem of practice.
Elements:
What will change? Teachers’ proficiency in using the concepts and practices of the reading program introduced during the 2008–09 school year.
For whom? Grade 3–6 teachers By how much? 90% of all teachers will demonstrate proficiency (score of 4 or 5) on the reading
program implementation rubric. By when? By the end of the 2011–12 school year
Statement:
By the end of the 2011–12 school year, 90% of the grade 3–6 teachers will demonstrate proficiency in the use of the concepts and practices imbedded in the reading program introduced during the 2008–09 school year by achieving a score of 4 or 5 (1 low to 5 high, scale) on the program implementation rubric.
Page 27

5.2District and School Data Team Toolkit
Scenario 2A
In response to chronically low mathematics performance across the district, the superintendent reallocated resources from the professional development budget to the salary account to fund the hiring of mathematics coaches to provide embedded professional development for the middle school mathematics teachers in one of the two district middle schools. The superintendent hoped to see a significant increase in the percent of proficient students (at least a 10 percentage point increase) in the middle school students whose teachers had participated in the embedded professional development provided by mathematics coaches within three years.
Elements:
What will change? Percent of students proficient on the MSP mathematics test For whom? Students in the target middle school By how much? 10 percentage points By when? Within three years
Statement:
To increase within three years the percentage of middle school mathematics students in the target school who score at the proficient level or above on the MSP mathematics test.
Scenario 2B: Problem of Practice End State Description
Through surveys and conversation with her staff, the K–12 math supervisor determined that the majority of middle school math teachers did not have the content or pedagogic background needed to successfully implement the new standards-based mathematics curriculum. She convinced the superintendent to reallocate resources from the professional development budget to the salary account to fund the hiring of mathematics coaches to provide embedded professional development for the middle school mathematics teachers during the 2011–2012 school year to address this perceived need.
Elements:
What will change? Specific math content and pedagogic knowledge. For whom? Middle School math teachers. By how much? 90% of the teachers will score at the proficient level or above on an assessment
designed to determine teachers’ ability to use specific math content and pedagogic knowledge in the classroom.
By when? By the end of the 2011–2012 school year.
Statement:
By the end of the 2011–2012 school year, 90% of the middle school teachers will score at the proficient level or above on an assessment designed to measure teachers’ ability to use content and pedagogic knowledge in the classroom.
Page 28

5.2District and School Data Team Toolkit
Scenario 3A
Elements:
What will change? Graduation rate For whom? Class of 2014 By how much? From 80% to 95% By when? 2014
Statement:
To increase the cohort graduation rate from 80% to 95% for the class of 2014.
Scenario 3B: Problem of Practice End State Description
The On Time Graduation Task Force in the Hidden Valley School District reviewed data on students who did not graduate with the class of 2009 and the prior five graduating classes. The data suggested that these students were not identified as at-risk students and therefore did not receive dedicated support services. The Task Force recommended to the superintendent that the district establish a protocol, by the beginning of the 2010–11 school year, to be used at each grade level to identify at-risk students.
Elements:
What will change? A protocol will be in place to identify students who are “at risk” of not graduating with their class
For whom? All grade 9–12 students By how much? All students will be screened using the protocol By when? The beginning of the 2010–2011 school year
Statement:
A protocol will be put in place by the beginning of the 2010-11 school year to screen all students in grades 9–12 to identify those who are at risk of not graduating with their class.
Page 29

5.2District and School Data Team Toolkit
Scenario 4A
The district leadership team, with support from the district data team, reviewed MSP writing performance in grades 3–8 over the past three years. The data revealed that the percentage of proficient female students was consistently five percentage points or more higher than the percentage of proficient male students at each grade level. The data team was asked to create a measurable improvement target for male students to eliminate this gap in performance by the 2014 test administration date.
Elements:
What will change? The gap between proficient male and female students on the MSP writing test For whom? Male students at all grade levels By how much? To equal the percentage of proficient female students By when? 2014 MSP writing test administration date
Statement:
To increase the percentage of proficient male students at each grade level to equal the percentage of proficient female students by the 2014 MSP writing test administration date.
Scenario 4B: Problem of Practice End State Description
The ELA Department, chairperson and the literacy coach presented data on the gap between male and female performance on the MSP in grades 3–8 to the literacy teachers. The literacy coach administered a survey designed to measure teachers’ views on gender and literacy learning. The teachers and coach analyzed the results of the survey and determined that the majority of teachers felt that female students were more likely to succeed in literacy and male students were more likely to succeed in quantitative areas. The literacy coach used several articles as study texts with the teachers to help them develop a more realistic picture of the relationship between gender and performance.
Elements:
What will change? Teachers’ views on gender and performance For whom? All literacy teachers By how much? Survey results will show a shift from gender bias to gender neutrality for 80% of the
literacy teachers in grades 3–8 By when? End of the current school year
Statement:
By the end of the current school year, 80% of the literacy teachers in grades 3-8 will have shown a shift from gender bias to gender neutrality on the Gender Bias survey instrument.
Page 30

5.2District and School Data Team Toolkit
Scenario 5A
Elements:
What will change? The percentage of students with 10 or more days of absence For whom? High school students By how much? No student will have 10 or more absences By when? 2012 HSPE administration date
Statement:
To decrease to 0 the percentage of high school students with 10 or more days of absence prior to the 2012 HSPE administration date.
Scenario 5B: Problem of Practice End State Description
The district’s high school principals, led by the district data team, used several protocols to determine the root cause of absenteeism in their schools. The driving causes appeared to be the lack of faculty knowledge of the consequences of absenteeism and the faculty’s poor implementation of the district’s attendance policies. To address these causes, the leadership team conducted a session during the 2012 summer faculty institute during which the district attendance policy was reviewed, clear expectations for the implementation of the policy were established, and data were provided on how absenteeism affects students’ academic and social performance.
Elements:
What will change? Faculty implementation of the attendance policy For whom? All secondary faculty members By how much? 95% of the faculty will effectively implement the district’s attendance policy By when? Throughout the 2012-13 school year
Statement:
During the 2012–2013 school year, 95% of the secondary school faculty will implement the district’s attendance policy.
Page 31

5.2District and School Data Team Toolkit
Scenario 6A
Elements:
What will change? Grade 9 retention rate For whom? Class of 2016 By how much? To 1% By when? 2013
Statement:
To decrease the grade 9 retention rate for the Class of 2016 to 1%.
Scenario 6B: Problem of Practice End State Description
Retention in grade 9 was determined to correlate with dropping out of school. The 9 th grade faculty met to determine the root cause of retention. They identified the lack of early identification practices and inadequate support services as the major contributors to retention in 9th grade. To address these problems of practice the 9th grade team, principal, and assistant superintendent for instruction developed a protocol for the identification of at risk students and support staff were hired and trained to work individually with these students to ensure that they met promotion requirements.
Elements:
What will change? Identification practices and support services For whom? Ninth grade students By how much? All students will be screened and support service provided to all at risk students By when? The beginning of the next school year
Statement:
By the beginning of the next school year, a protocol will be in place to screen all 9 th grade students to identify those at risk and support services will be provided for these students during the school year to help them meet the promotion requirements.
Page 32

To identify a variety of potential strategies.The data team will identify strategies that could feasibly address the identified problem(s) of practice, and that will support the implementation of the initiative and set the stage for scaling-up and sustainability.
About 30 minutes.
5.3District and School Data Team Toolkit
5.3 Identifying Potential Strategies
Directions:
1. Write the learner-centered problem and problem(s) of practice statements that the team developed in Diagnose Causes on chart paper to focus this brainstorming session3.
2. Using the knowledge the team has gained (4.7 Building Your Knowledge Base, 4.8 Consulting Your Colleagues), brainstorm possible strategies to address the problem(s) of practice.
3. Once the team has reached consensus on strategies that may address the problem(s) of practice, repeat this process to identify strategies that will support the implementation effort and set the stage for eventually scaling-up the initiative and providing for its sustainability. Refer to the resources on implementation science, scaling-up, and sustainability in the Plan and Take Action handbook for guidance.
4. Record the strategies for use with tool 5.4 Rating Strategies’ Potential for Success.
3 Portions of this tool were developed within the DATAUSE project (Using Data for Improving School and Student Performance) by the consortium of partners including: Public Consulting Group, University of Twente (the Netherlands), Institute of Information Management Bremen GmbH (Germany), Modern Didactics Center (Lithuania) and Specialist Schools and Academies Trust (UK). For more information on the project please visit: www.datauseproject.eu
Page 33

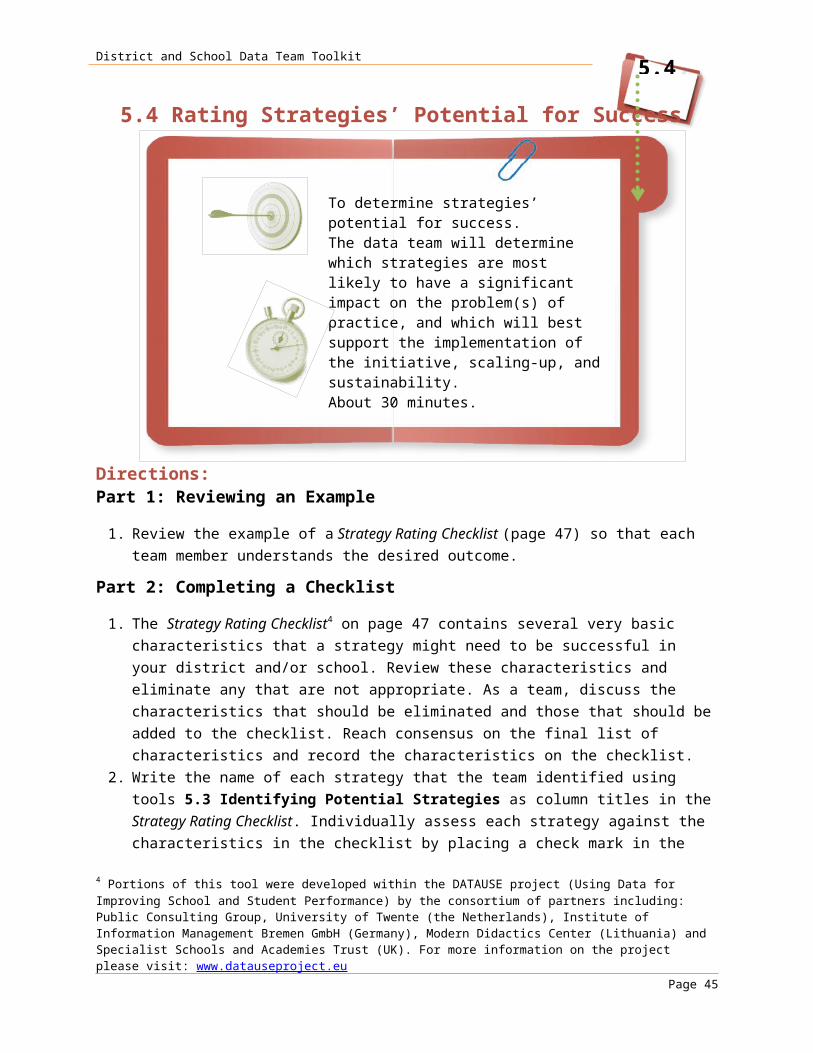
To determine strategies’ potential for success. The data team will determine which strategies are most likely to have a significant impact on the problem(s) of practice, and which will best support the implementation of the initiative, scaling-up, and sustainability.About 30 minutes.
5.4District and School Data Team Toolkit
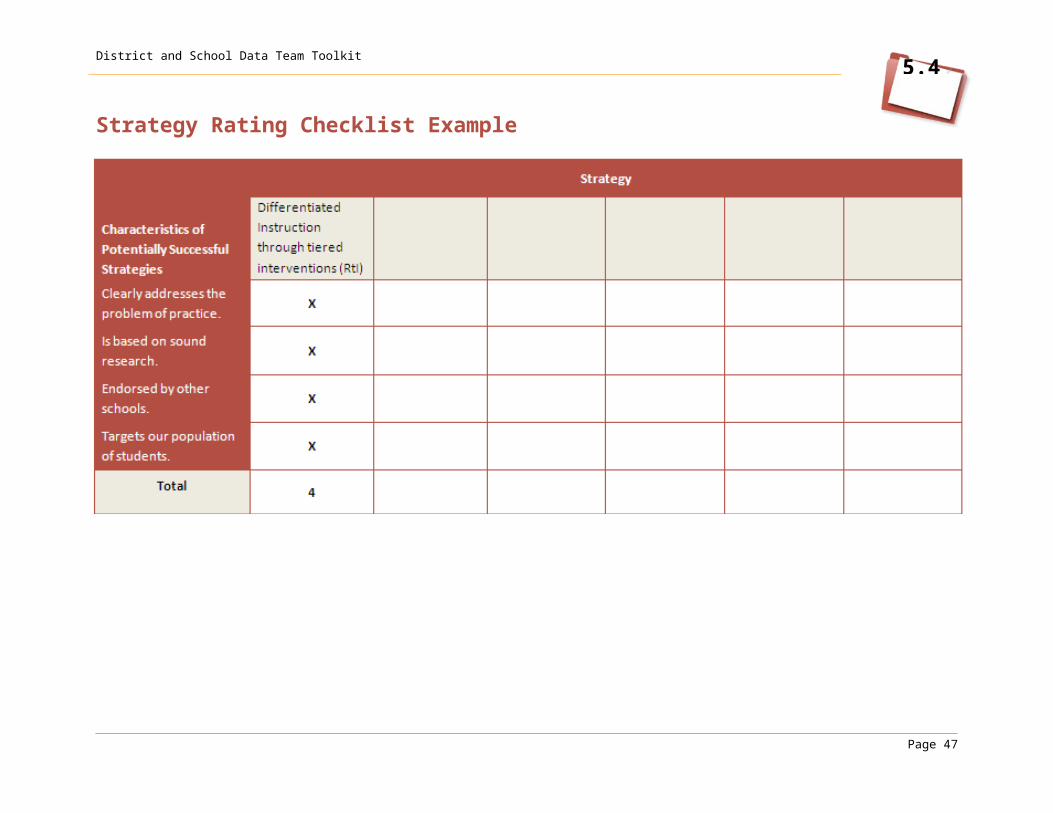
5.4 Rating Strategies’ Potential for Success
Directions:Part 1: Reviewing an Example
1. Review the example of a Strategy Rating Checklist (page 36) so that each team member understands the desired outcome.
Part 2: Completing a Checklist
1. The Strategy Rating Checklist4 on page 36 contains several very basic characteristics that a strategy might need to be successful in your district and/or school. Review these characteristics and eliminate any that are not appropriate. As a team, discuss the characteristics that should be eliminated and those that should be added to the checklist. Reach consensus on the final list of characteristics and record the characteristics on the checklist.
2. Write the name of each strategy that the team identified using tools 5.3 Identifying Potential Strategies as column titles in the Strategy Rating Checklist. Individually assess each strategy against the characteristics in the checklist by placing a check mark in the cell next to each characteristic that the strategy has. Repeat for each strategy.
3. Either project or have the facilitator duplicate the checklist on chart paper. As a team, reach consensus on the assessed characteristics of each of the strategies. Rank order the strategies based on the number of check marks each received. Those with the largest number of check marks are your high-impact strategies.
4 Portions of this tool were developed within the DATAUSE project (Using Data for Improving School and Student Performance) by the consortium of partners including: Public Consulting Group, University of Twente (the Netherlands), Institute of Information Management Bremen GmbH (Germany), Modern Didactics Center (Lithuania) and Specialist Schools and Academies Trust (UK). For more information on the project please visit: www.datauseproject.eu
Page 35

5.4District and School Data Team Toolkit
Strategy Rating Checklist Example
Page 36

5.4District and School Data Team Toolkit
Strategy Rating Checklist
Characteristics of Potentially Successful Strategies
Strategy
Clearly addresses the problem of practice
Is based on sound research
Endorsed by other schools
Targets our population of students
[Insert additional]
[Insert additional]
[Insert additional]
Total
Page 37

To rate the identified high-impact strategies by their feasibility of successful implementation.The data team will discuss the feasibility of implementation for the strategies it has identified as high impact and rank order them by perceived likelihood for success.
30 minutes.
5.5District and School Data Team Toolkit
5.5 Rating Feasibility of Implementation
Directions:
1. The Feasibility of Implementation Checklist5 on page 40 contains several very basic characteristics that a strategy might need to be successful in your district or school. Review these characteristics and eliminate any that are not appropriate. Add characteristics that you believe are necessary for successful implementation
2. As a team, discuss the characteristics that should be eliminated and those that should be added to the checklist. Reach consensus on the final list of characteristics and record the characteristics as additional row titles in the checklist.
3. Write the name of the high-impact strategies that the team identified using tool 5.4 Rating Strategies’ Potential for Success as column titles in the Feasibility of Implementation Checklist. Individually rate each strategy against the characteristics in the checklist by placing a check mark in the cell next to each characteristic the strategy has. Repeat for each strategy.
4. The facilitator will project or duplicate the checklist on chart paper. As a data team, reach consensus on the characteristics of each of the strategies. Rank order the strategies based on the number of check marks each received. Those with the largest number of check marks are your high-impact strategies with the highest feasibility for successful implementation.
5 Portions of this tool were developed within the DATAUSE project (Using Data for Improving School and Student Performance) by the consortium of partners including: Public Consulting Group, University of Twente (the Netherlands), Institute of Information Management Bremen GmbH (Germany), Modern Didactics Center (Lithuania) and Specialist Schools and Academies Trust (UK). For more information on the project please visit: www.datauseproject.eu
Page 39

5.5District and School Data Team Toolkit
Feasibility of Implementation Checklist
Criteria High-Impact Strategies
Administrative support
District policies
Superintendent
Principals
Department heads
Union leadership
Resources
Funding
Staff
Materials
Teacher support
Understand need
Willingness to be involved
Page 40

5.5District and School Data Team Toolkit
Criteria High-Impact Strategies
Capacity
Already trained staff
Training available
Time to plan and monitor
[Insert Additional]
[Insert Additional]
Total
Page 41
To create a logic model that will guide the implementation, monitoring, and eventual evaluation of the initiative. The data team will determine the logical connection of the intervention to the desired outcome and express the connections as If…Then propositions. About 20 minutes to introduce and additional time to complete.
5.6District and School Data Team Toolkit
5.6 Constructing a Logic Model
A logic model will help your team determine and illustrate the logical connection of the intervention that you design to the desired end states (outcomes). If … then…. logic statements form the bridge between the strategies and objectives of your intervention and the desired outcomes. This relationship is illustrated on page 44. By keeping these logical connections between the intervention and the desired outcomes, the team will be able to move forward efficiently and effectively.
Directions:
Part 1: Reviewing an Example
1. Review the Logic Model Example provided on page 44.
Part 2: Developing a Logic Model
1. Record the learner-centered problem statement and the problem of practice statement that the team previously developed in the template.
2. Using the skills that you developed in tools 5.1 Describing the Desired End State and 5.2 Writing Measurable Statements, generate improvement targets for the learner-centered problem and the problem of practice. Record them on the template.
3. Record the high-impact strategies that the team selected using tool 5.4 Rating Strategies’ Potential for Success in the template.
4. For each strategy, develop a measurable objective that will guide the implementation of that strategy. Each objective should be narrow in focus and guide only one aspect of the implementation or outcome of the strategy. It is common to have several objectives associated with each strategy. Expand the template as necessary.
Page 43

5.6District and School Data Team Toolkit
Logic Model Example
Page 44

5.6District and School Data Team Toolkit
Logic Model Template
Logic Model
Learner-Centered Problem Statement: Measurable Desired End State:
Problem of Practice Statement : Measurable Desired End State:
If we successfully implement these strategies to address the problem of practice
Then we can expect to reach the measurable objectives related to each strategy.If each objective is reached, Then the problem of practice improvement target will be attained.If the problem of practice improvement target is attained, Then the learner-centered problem measurable desired end state should be met.
Strategy 1 Objective 1
Objective 2
Strategy 2 Objective 1
Objective 2
Strategy … Objective 1
Objective 2
Page 45

To translate the logic model developed with 5.6 Constructing a Logic Model into a plan to implement the intervention.The data team will outline the specific steps to be taken to achieve each of the objectives for each strategy.About 30 minutes to introduce and additional time to complete.
5.7District and School Data Team Toolkit
5.7 Developing an Action Plan
Directions:Part 1: Reviewing an Example
1. Review the example, which is a portion of an Action Plan on page 48.
Part 2: Developing an Action Plan
1. Record the problem of practice measurable desired end state and each strategy with its associated objectives where indicated in the template6.
2. Start with the first strategy and individually identify actions that need to be taken to reach each of the objectives and record each action on a large sticky note.
3. Place the sticky notes on a piece of chart paper organized by objective.4. As a team, reach consensus on the required actions steps.5. Once consensus has been reached, rearrange the sticky notes so that they appear in chronologic
order.6. Record the action steps in the Action Plan Template on page 47.7. Next determine the inputs or resources that will be needed to accomplish each of the action
steps. Record them next to the appropriate action step in the Action Plan Template.
6 Portions of this tool were developed within the DATAUSE project (Using Data for Improving School and Student Performance) by the consortium of partners including: Public Consulting Group, University of Twente (the Netherlands), Institute of Information Management Bremen GmbH (Germany), Modern Didactics Center (Lithuania) and Specialist Schools and Academies Trust (UK). For more information on the project please visit: www.datauseproject.eu
Page 47

5.7District and School Data Team Toolkit
8. As a team, determine a best estimate of the timeline for each of the action steps. Think of when the action will start and finish. Many actions will result in the production of something that is finite; other actions will reach an end state and then continue in that end state for a long period of time. Consider the end date for an ongoing action as the time when the action or product is fully functional and sustainable.
9. Once the team has determined the action steps for each objective and its associated timeline and inputs/resources, assign a team member or other appropriate stakeholder to be the steward for that objective or action step(s) within the objective. As an alternative, the team may decide to assign one individual to be responsible for all of the objectives and action steps within one of the strategies. Make note of each of these items in the Action Plan Template.
10. Repeat steps 3 through 9 for each strategy. Expand the template as necessary.
Action Plan Example
Page 48

5.7District and School Data Team Toolkit
Action Plan Template
Action Plan
Measurable Desired End State:
Strategy 1:
Objective 1:
Person(s) Responsible Action Steps Timeline Inputs/Resources
Objective 2:
Person(s) Responsible Action Steps Timeline Inputs/Resources
Objective 3:
Person(s) Responsible Action Steps Timeline Inputs/Resources
Page 49
5.7District and School Data Team Toolkit
Action Plan
Strategy 2:
Objective 1:
Person(s) Responsible Action Steps Timeline Inputs/Resources
Objective 2:
Person(s) Responsible Action Steps Timeline Inputs/Resources
Objective 3:
Person(s) Responsible Action Steps Timeline Inputs/Resources
Page 50

5.8
To construct a plan for the ongoing monitoring of the implementation of the initiative.The team will establish a plan to collect and analyze data on the progress of the initiative.About 30 minutes to introduce and additional time to complete.
District and School Data Team Toolkit
5.8 Developing an Implementation Monitoring Plan
Directions:
Part 1: Reviewing an Example
1. Review the example of a portion of an Implementation Monitoring Plan7 on page 52.
Part 2: Creating an Implementation Monitoring Plan
2. As in tool 5.7 Developing an Action Plan, add the strategies and objectives where indicated in the template.
3. As a team, brainstorm observable outputs or events that can serve as implementation indicators, or show that the initiative is being implemented faithfully and effectively. These indicators may be activities (e.g., events that are held, products that are produced) or they may be measures of participation in events or programs. Determine which of these indicators will best inform the team of the progress of the initiative. Record them in the template.
4. Again as a team, brainstorm observable interim outcomes for adults or students. These may be observable changes in teacher behavior, such as the implementation of a new instructional technique after participating in a professional development course. The actions associated with an objective may also produce observable changes in student behavior, such as increased engagement or improved performance on a benchmark assessment.
7 Portions of this tool were developed within the DATAUSE project (Using Data for Improving School and Student Performance) by the consortium of partners including: Public Consulting Group, University of Twente (the Netherlands), Institute of Information Management Bremen GmbH (Germany), Modern Didactics Center (Lithuania) and Specialist Schools and Academies Trust (UK). For more information on the project please visit: www.datauseproject.eu
Page 51
5.8District and School Data Team Toolkit
5. As the action plan unfolds and the initiative is implemented, the Implementation Monitoring Plan will help the team keep track of, and report on, the progress of the initiative. It is important for the team to collect and analyze data on the indicators and outcomes to inform decisions about mid-course corrections in the initiative and to keep stakeholders informed about the progress that the initiative is making. The team should select specific dates by which progress data will be collected, analyzed, and reported in the status column of the Implementation Monitoring Plan. The periodic status reports for each strategy can be summarized and easily reported to stakeholders. As in previous tools, 1.4D Communication Organizer may be helpful as the team reports on the progress of the initiative.
Implementation Monitoring Plan Example
Page 52

5.8District and School Data Team Toolkit
Implementation Monitoring Plan Template
Implementation Monitoring Plan
Measurable Desired End State:
Strategy 1
Objective 1
Implementation Indicators Interim Outcomes Status of the Objective (dated)Activities Participation Adults Students
Objective 2
Implementation Indicators Interim Outcomes Status of the Objective (dated)Activities Participation Adults Students
Page 53