
plains all american pipeline Annual Reports 2006
14
-
Upload
finance13 -
Category
Economy & Finance
-
view
218 -
download
1
Transcript of plains all american pipeline Annual Reports 2006


Historical Distribution GrowthRepresents cash distribution paid during each period
2002 AnnuAlized RAte
$0
.513
$2
.05
Q1
$0
.525
$2
.10
Q2
$0
.53
8$
2.1
5
Q3$
0.5
38
$2
.15
Q4
$0
.53
8$
2.1
5Q1
$0
.55
0$
2.2
0
Q2
$0
.55
0$
2.2
0
Q3
$0
.55
0$
2.2
0
Q4
2003 $
0.5
63
$2
.25
Q1
$0
.56
3$
2.2
5
Q2
$0
.578
$2
.31
Q3
$0
.60
0$
2.4
0
Q4
2004
$0
.613
$2
.45
Q1
$0
.63
8$
2.5
5
Q2
$0
.65
0$
2.6
0
Q3
$0
.675
$2
.70
Q4
2005
$0
.68
8$
2.7
5
Q1
$0
.70
8$
2.8
3
Q2
$0
.725
$2
.90
Q3
$0
.75
0$
3.0
0
Q4
2006
2%
Total Return to Unitholders
Five-YeAR AnnuAl totAl RetuRn = 23%
44% 25% 11% 38%
Plains All American Pipeline, l.P. (“PAA”) is a publicly traded master limited partnership (“MLP”) engaged in the transportation, storage, terminalling and marketing of crude oil, refined products and liquefied petroleum gas and other natural gas related petroleum products (collectively, “LPG”). Through our 50% equity ownership in PAA/Vulcan Gas Storage, LLC, we develop and operate natural gas storage facilities.
We own and operate a diversified portfolio of strategically-located assets that play a vital role in the movement of U.S. and Canadian energy supplies. On average, we handle over 3 million barrels per day of crude oil, refined products and LPG through our extensive network of assets located in key North American producing regions and transportation gateways.
As an MLP, we make quarterly distributions of our available cash to our Unitholders. Since our initial public offering in 1998, we have increased our quarterly distribution by approximately 78% to its current level at February 2007 of $0.80 per unit, or $3.20 per unit on an annualized basis. It is our goal to increase our distribution to Unitholders over time through a combination of internal expansion and acquisition-driven growth.
Our common units are traded on the New York Stock Exchange under the symbol “PAA.” We are headquartered in Houston, Texas.

01
PAA
» exited 2006 with strong balance sheet and highest level of liquidity in our history
» Generated approximately $136 million of cash flow in excess of distributions
» Achieved targeted equity financing metrics for $3.4 billion of investments in 2006
» Substantially pre-funded the targeted equity component of our 2007 expansion capital program
Maintain and improve our present credit rating and further expand our liquidity and financial flexibility to accommodate future growth.
deliver operating and financial performance in line with our guidance.
» exceeded original Adjusted eBitdA guidance by 40% including (24% excluding) unforecasted acquisitions
increase our distribution paid to unitholders in 2006 by 10% over 2005 payments.
» increased distributions paid to unitholders in all four quarters of 2006 for a total increase of 11.5%
optimize our existing asset base and operations and expand our inven-tory of internal expansion projects.
Pursue our target of averaging $200–$300 million of accretive and strategic acquisitions.
» executed an aggregate of $3.4 billion in internal growth projects and acquisitions
– implemented $332 million of expansion projects, including $18 million associated with Pacific
– Completed eight acquisitions for $609 million – Completed merger with Pacific energy Partners, l.P. valued at
$2.5 billion
» initiated, developed or advanced a number of new internal expansion projects for implementation in 2007 and beyond; resulted in 2007 expansion capital program of $500 million
» entered refined products business and acquired interest in a crude oil barging company
PeRFoRM
StRenGthen
diStRiBute
GRoW
2006 Goals and Achievements
Well Positioned for the Future
1.
2.
3.
5.
4.

Chairman andPresident’s letter
dear Fellow unitholders:2006 was a very active, productive and rewarding year for the Partnership. We achieved or exceeded each of our stated goals as we delivered record operating and financial performance, increased our distributions paid to unitholders by 11.5%, completed the largest acquisition in the history of the Partnership and executed a record level of internal growth projects. Despite investing nearly $3.4 billion during the year, we exited 2006 with a strong balance sheet and capital structure, and the highest level of liquidity in our history.
When combined with the results of prior years’ initiatives, these events and accomplishments made 2006 a trans-formational year as well. As a result, we believe we have established a solid foundation for future growth for several years to come.
As tempting as it is to use this annual report to dwell on the significant accomplishments of 2006, we recognize that the vast majority of our stakeholders’ focus is, and should be, on the Partnership’s prospects for 2007 and beyond. Accordingly, while we have provided a review of 2006 performance and activities, you will note that the majority of this annual report is devoted to the opportu-nities that set the stage for the next several years as well as the associated execution challenges.
2006 ReviewAt the beginning of each year, we provide our unitholders and the financial community with a slate of specific goals that guide our activities and provide a gauge by which to measure our performance throughout the year. The report card on page 1 summarizes our performance against the five goals we established at the beginning of 2006, while a more detailed description of the year’s activities is provided in the following four paragraphs.
Our Partnership achieved very strong operating and financial performance in 2006. Adjusted EBITDA of $511 million exceeded the mid-point of our original guid-ance of $365 million by approximately 40%. Such results include contributions from unforecasted acquisitions, including a 46-day contribution from the Pacific acquisition. Excluding the impact of unforecasted acquisitions, our Adjusted EBITDA exceeded our original guidance by approximately 24%. These results enabled us to generate approximately $136 million of cash flow in excess of distributions, which we reinvested in our expansion capital programs, thereby reducing the amount of external equity financing required to meet our targeted credit profile.
We invested a total of approximately $3.4 billion in capital during the year in internal growth projects and acquisi-tions – a record level by a wide margin. We executed the largest expansion capital program in the history of the Partnership, which totaled $332 million and, principally due to our ability to develop and implement additional projects, we surpassed our initial $230 million capital plan
2006
Well Positioned for the Future
02
PAA

for the year by over 40%. We completed an aggregate of $3.1 billion in acquisitions, including the $2.5 billion merger with Pacific Energy Partners, L.P. and eight addi-tional acquisitions totaling $609 million. As a result of these transactions and projects, we expanded our crude oil and LPG businesses and activities, and established a solid footprint in the refined products transportation and terminalling businesses. We also acquired a 50% interest in a barging company that provides a significant portion of our current barge transportation needs and through which we believe we can further expand our barge trans-portation activities.
We were very proactive in our financing activities through-out the year, keeping pace with our expansion capital program and acquisitions. We issued approximately $1.6 billion of equity in four transactions consisting of the Pacific merger and three direct placements, and we completed two bond issues for a total of $1.3 billion. We expanded our revolving credit facility from $1.0 billion to $1.6 billion and increased our contango inventory credit facility from $800 million to $1.0 billion, extending the maturities on both facilities. In addition to financing our expansion capital program and acquisitions, these activities also funded a significant increase in inventory due to the overall growth of our business, a pronounced contango market and higher oil prices. As a result of these proactive financing activities, we ended the year with a strong balance sheet and capital structure, and the highest level of liquidity in our history. In addition, we pre-funded the vast majority of the equity component required to fund our 2007 expansion capital program. Notably, in conjunction with the Pacific transaction, both credit ratings agencies affirmed our investment grade rating.
Appropriately, 2006 was also a rewarding year for our unitholders. We raised our distribution in all four quarters, increasing our unit distributions paid in 2006 by 11.5% over 2005. Combining distributions with appreciation in the market price of our units, our total return for the year was approximately 38%, which compares favorably to a total return of approximately 34% and 26% for our large capitalization pipeline MLP peer group and the Alerian MLP Index, respectively. Our total return more than doubled the results delivered by the Dow Jones Industrial Average and S&P 500, which were 19% and 16%, respectively.
Future outlookWe believe that we have a bright future ahead of us. A positive transformation that began several years ago was substantially completed in 2006. As recently as five years ago, the Partnership was largely dependent upon acquisitions to grow its distribution. Today, we possess a balanced and diversified business profile and a significant and high-quality portfolio of internal growth projects and asset optimization plans that provide clear visibility for our future distribution growth, without reliance on future significant acquisitions.
Over the past two years alone, we have significantly expanded our presence in the crude oil and LPG sectors and extended our business model to the natural gas storage and refined products businesses, providing us with a diversified group of complementary businesses in which to generate future growth. In certain of these busi-nesses, we have entered new areas, such as crude oil barging and LPG processing activities.
Within these businesses, we have developed a robust portfolio of internal growth projects that will be the prin-cipal driver of distribution growth over the next several years. To be clear, we recognize that the very attractive and cohesive inventory of growth opportunities also poses our biggest challenge – Execution. Specifically, we face five primary execution challenges:
Successfully Integrate the Pacific Acquisition – While we have significant experience and expertise in this area, having successfully integrated over 45 acquisitions in the last eight years, the acquisition of Pacific is indeed a challenge as it requires the integration of a large expanse of assets, operations, controls, systems and personnel from a regional profit center-based structure into a functional operating environment. We believe we have a well designed game plan in this regard and we are targeting to substantially complete the integration by the beginning of the second quarter of 2007.
Achieve the Targeted Acquisition Synergies and Deliver Operating and Financial Performance in Line with Guidance – The mid-point of our guidance for 2007 incorporates our projected Pacific-related synergies and calls for the Partnership to generate Adjusted EBITDA of approximately $690 million. This is approximately $6 million higher than the preliminary 2007 guidance we provided at the time we announced the Pacific transaction. Inevitably, actual results will be impacted by market-related developments and unforeseen operating issues,
03
PAA

transformationAs a result of a management-led buyout of our general partner that began in late 2000 and was consummated in June 2001,
our management team, which had been simultaneously managing two public companies in separate lines of business with
diverse stakeholders, was able to allocate 100% of their efforts toward the management and growth of Plains All American.
While not without our challenges, we have experienced significant growth and generated attractive returns since that time.
As a result of our activities over the past several years, we have significantly improved our growth visibility and risk profile.
The table below illustrates the transformation that has occurred with the Partnership over the past six years.
Category
enterprise value
Credit Ratings
liquidity(availability under revolving credit facilities)
Growth visibility
Business Mix
Asset Footprint
Management depth
2000
• $977 million
• BB- / Ba3
• ~$80 million
• Dependent upon acquisitions to grow• Executed $11 million expansion capital program;
$7 million planned for 2001
• Focused exclusively on crude oil
• 2,800 miles of crude oil pipelines• 9.8 million barrels of crude oil storage• Meaningful fleet of trucks• Handled 0.6 million barrels per day
of physical crude oil• No waterborne foreign imports
• 11-member senior management team
2006
• $8.2 billion
• BBB- / Baa3
• ~$1.3 billion
• Existing expansion capital projects are expected to drive 7% to 9% average annual distribution growth over next several years
• Executed $332 million expansion capital program; $500 million planned for 2007
• Diversified portfolio of assets in the crude oil, LPG, refined products and natural gas storage businesses
• 20,000 miles of crude oil, refined products and LPG pipelines
• 61.3 million barrels of crude oil, refined products and LPG storage (12.5 million under construction)
• 50% interest in 25.7 Bcf of natural gas storage (24 Bcf under construction)
• Significant fleet of truck, rail and barge transportation assets
• Handled over 3 million barrels per day of physical crude oil, LPG and refined products
• 60,000 bpd waterborne foreign imports
• >25-member senior management team
At december 31,
04
PAA
both positive and negative, and our team will be tasked with making mid-course corrections. Operating and financial projections seldom happen exactly as forecast, but we believe the guidance we have provided is both realistic and achievable and that we are well equipped to address these challenges.
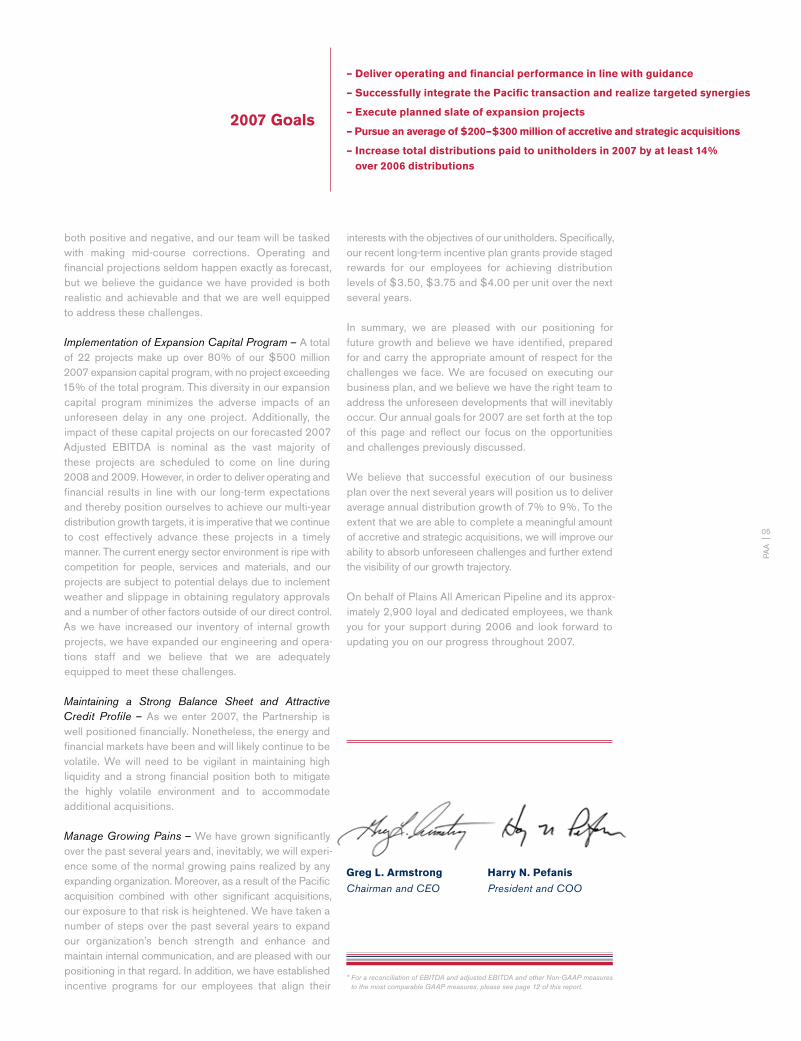
Implementation of Expansion Capital Program – A total of 22 projects make up over 80% of our $500 million 2007 expansion capital program, with no project exceeding 15% of the total program. This diversity in our expansion capital program minimizes the adverse impacts of an unforeseen delay in any one project. Additionally, the impact of these capital projects on our forecasted 2007 Adjusted EBITDA is nominal as the vast majority of these projects are scheduled to come on line during 2008 and 2009. However, in order to deliver operating and financial results in line with our long-term expectations and thereby position ourselves to achieve our multi-year distribution growth targets, it is imperative that we continue to cost effectively advance these projects in a timely manner. The current energy sector environment is ripe with competition for people, services and materials, and our projects are subject to potential delays due to inclement weather and slippage in obtaining regulatory approvals and a number of other factors outside of our direct control. As we have increased our inventory of internal growth projects, we have expanded our engineering and opera-tions staff and we believe that we are adequately equipped to meet these challenges.
Maintaining a Strong Balance Sheet and Attractive Credit Profile – As we enter 2007, the Partnership is well positioned financially. Nonetheless, the energy and financial markets have been and will likely continue to be volatile. We will need to be vigilant in maintaining high liquidity and a strong financial position both to mitigate the highly volatile environment and to accommodate additional acquisitions.
Manage Growing Pains – We have grown significantly over the past several years and, inevitably, we will experi-ence some of the normal growing pains realized by any expanding organization. Moreover, as a result of the Pacific acquisition combined with other significant acquisitions, our exposure to that risk is heightened. We have taken a number of steps over the past several years to expand our organization’s bench strength and enhance and maintain internal communication, and are pleased with our positioning in that regard. In addition, we have established incentive programs for our employees that align their
interests with the objectives of our unitholders. Specifically, our recent long-term incentive plan grants provide staged rewards for our employees for achieving distribution levels of $3.50, $3.75 and $4.00 per unit over the next several years.
In summary, we are pleased with our positioning for future growth and believe we have identified, prepared for and carry the appropriate amount of respect for the challenges we face. We are focused on executing our business plan, and we believe we have the right team to address the unforeseen developments that will inevitably occur. Our annual goals for 2007 are set forth at the top of this page and reflect our focus on the opportunities and challenges previously discussed.
We believe that successful execution of our business plan over the next several years will position us to deliver average annual distribution growth of 7% to 9%. To the extent that we are able to complete a meaningful amount of accretive and strategic acquisitions, we will improve our ability to absorb unforeseen challenges and further extend the visibility of our growth trajectory.
On behalf of Plains All American Pipeline and its approx-imately 2,900 loyal and dedicated employees, we thank you for your support during 2006 and look forward to updating you on our progress throughout 2007.
* For a reconciliation of EBITDA and adjusted EBITDA and other Non-GAAP measures to the most comparable GAAP measures, please see page 12 of this report.
harry n. Pefanis
President and COOGreg l. Armstrong
Chairman and CEO
– deliver operating and financial performance in line with guidance
– Successfully integrate the Pacific transaction and realize targeted synergies
– execute planned slate of expansion projects
– Pursue an average of $200–$300 million of accretive and strategic acquisitions
– increase total distributions paid to unitholders in 2007 by at least 14% over 2006 distributions
2007 Goals
05
PAA

2006
06
PAA
As a result of the transformation that has occurred over the past several years, today we possess a diversified platform of complementary businesses in which to generate future growth, including our core crude oil business, our related LPG business as well as our recently acquired refined products and natural gas storage businesses. Importantly, our assets in each of these businesses are well positioned to benefit from long-term trends in the energy industry, such as increasing imports and the need for additional storage capacity. We believe that there are compelling opportunities to
PAA
Platform forFuture Growth
lPG Transportation, Facilities and Marketing
Opportunity» Increasing U.S. consumption of LPG should lead to increased
demand for infrastructure» Inefficiency caused by numerous regional supply and demand
imbalances and multiple supply sources
PAA Positioning» Strategic storage and processing assets with flexible distribu-
tion as a result of transportation assets (railcars, trucks and pipelines) and marketing expertise
» Synergies with Canadian pipeline operations as heavy crude oil requires certain liquids as diluent for transportation
Railcar
PipelineAbove Ground or
Underground Storage
Truck
Truck
Truck
Truck
Truck
Pipeline Gathering
Barge / Tanker
Injection Station Terminal/Storage/Exchange Location
Pipeline
Pipeline
Underground Storage
Injection/Withdrawal Facilities
SaltDome
DepletedReservoir
Gas Plants
Refinery
Diluent forHeavy Crude
Chemical Plants
RetailDistribution
Producers
Producers End Users
Refineries
Tanker
Barge
LNG Tanker
Gathering Pipelines
CommonCarrierPipelines
Common Carrierand LDC Pipelines
RefineriesGasStations
Bulk StorageTerminal
Storage
Common Carrier Pipeline
Crude oil Transportation, Facilities and Marketing
Opportunity» Increasing volumes of waterborne foreign imports into the
Gulf Coast and California and increasing production from Canadian oil sands
» Changing market demands, greater needs for inventory, additional demand for blending and segregated storage services and reduction in storage capacity due to regulation
PAA Positioning» Our major crude oil storage facilities located in Cushing,
St. James and Patoka and on the West Coast should benefit from these trends
» Certain of our pipeline assets, such as the Capline system as well as our infrastructure in California, the Rocky Mountains and Canada, are also well positioned to participate in increased crude oil movements
Railcar
PipelineAbove Ground or
Underground Storage
Truck
Truck
Truck
Truck
Truck
Pipeline Gathering
Barge / Tanker
Injection Station Terminal/Storage/Exchange Location
Pipeline
Pipeline
Underground Storage
Injection/Withdrawal Facilities
SaltDome
DepletedReservoir
Gas Plants
Refinery
Diluent forHeavy Crude
Chemical Plants
RetailDistribution
Producers
Producers End Users
Refineries
Tanker
Barge
LNG Tanker
Gathering Pipelines
CommonCarrierPipelines
Common Carrierand LDC Pipelines
RefineriesGasStations
Bulk StorageTerminal
Storage
Common Carrier Pipeline
Well Positioned for the Future
CRude oil
lPG
Below is an overview of the opportunity and our strategic positioning for each of these businesses along with a graphical depiction of our activities. Activities in which we participate are shown in red.

natural Gas Storage Facilities
Opportunity» Projected shortfall in U.S. natural gas supply to be met with
imports of liquefied natural gas, which will create inconsistent surges and shortfalls in supply and require storage to meet consumer needs
» Regional production declines will require storage facilities to be able to access multiple markets
PAA Positioning» 24 Bcf high-deliverability Pine Prairie facility under construction in
Louisiana will connect to seven pipelines with access to major markets in the Midwest, Northeast and Southeast and can be sig-nificantly expanded to meet market needs
» 25.7 Bcf Bluewater facility is positioned to meet seasonal gas demand in Michigan and is connected to regional market hubs
Refined Products Transportation, Facilities and Marketing
Opportunity» Increasing U.S. consumption of refined products» Increasing demand for infrastructure due to boutique gasoline
blends, specification changes to existing products, new products (such as bio-fuels), the aging of existing infrastructure and reduction in storage capacity due to regulation
PAA Positioning» Refined products terminals located on the East and West
Coasts are well positioned to benefit from these trends» Expansion projects in progress at several facilities» Intend to optimize value of our refined products assets
by building complementary supply and marketing business (beginning with February 2007 acquisition)
Railcar
PipelineAbove Ground or
Underground Storage
Truck
Truck
Truck
Truck
Truck
Pipeline Gathering
Barge / Tanker
Injection Station Terminal/Storage/Exchange Location
Pipeline
Pipeline
Underground Storage
Injection/Withdrawal Facilities
SaltDome
DepletedReservoir
Gas Plants
Refinery
Diluent forHeavy Crude
Chemical Plants
RetailDistribution
Producers
Producers End Users
Refineries
Tanker
Barge
LNG Tanker
Gathering Pipelines
CommonCarrierPipelines
Common Carrierand LDC Pipelines
RefineriesGasStations
Bulk StorageTerminal
Storage
Common Carrier Pipeline
ReFined PRoduCtS
nAtuRAl GAS StoRAGe
apply our proven business model to each of these businesses. The combination of our strategically-located asset base, business model and skill sets enables us to address and profit from regional supply and demand fluctuations; changing inventory requirements, including both volume and quality; market volatility and similar conditions that are inherent in each of these businesses. Over time, we intend to optimize the performance of our existing assets and further expand our footprint in each of these businesses through a combination of internal growth projects and acquisitions.
07
PAA
Activities in which we participate are shown in red.

the Capstone eventIn November 2006, we acquired Pacific Energy Partners, L.P. in a transaction valued at approximately $2.5 billion, including the assumption of debt and transaction costs. Under the terms of the deal, we acquired the general partner interest, incentive distribution rights and an aggregate of 10.5 million limited partner units of Pacific for a total of $700 million in cash. We acquired the balance of the equity in Pacific through a unit-for-unit merger in which each Pacific unit was exchanged for 0.77 Plains All American units. As a result of the transaction, the Pacific operating subsidiaries are now directly or indirectly owned by Plains All American.
We are very pleased with this transaction, which we believe was the capstone event in the multi-year transformation of PAA. From an industrial logic and strategic perspective, the combination of PAA and Pacific was highly desirable. The assets acquired in the Pacific transaction included approximately 4,500 miles of active crude oil pipelines, 550 miles of refined products pipelines, over 13 million barrels of crude oil storage capacity and 9 million barrels of refined products storage capacity. The acquired assets provided an excellent complement to our existing crude oil assets in California, the Rocky Mountains and Canada. Additionally, the transaction immediately pro-vided PAA with a meaningful presence in the refined products business.
From a financial perspective, the acquisition of Pacific further diversified our cash flow stream and increased the percentage of our cash flow derived from tariff and fee-based activities to approximately 66% as shown on the top of page 9. It also increased our exposure to non-depleting waterborne foreign imports and increasing production of Canadian synthetic crude oil from the oil sands. As part of the transaction, we have acquired an attractive portfolio of internal growth projects, many of which are backed by long-term contracts with major oil companies and refiners.
transformation BenefitsAs a result of the Pacific acquisition and other activities over the past several years, we now have strategically-located assets at a significant number of key market hubs in the U.S. and Canada that will benefit from increasing imports and regional supply and demand imbalances of crude oil, refined products, LPG and natural gas.
Accordingly, we believe the Partnership is well positioned to meet the dynamic demands of the U.S. energy markets well into the future. See map on the following page.
2006
Well Positioned for the Future
Acquisition of Pacific energy Partners, l.P.
08
PAA

Rapid City
Ft. Laramie
ColoradoSprings
Cheyenne
Edmonton
ARLINGTON
Cut Bank
Big PineySalt Creek
WASHOUGAL
Martinez
Richmond
ANDREWS LPG
Huntington Beach
El Segundo
IlesRangley
Salt Lake City
Billings
CORDOVA
ALTO BLUEWATER
FORT MADISON
CLAREMONT
SCHAEFFERSTOWNPhiladelphia
PINEPRAIRIE
Kerrobert
Regina
KINCHELOE
CUSHING
MIDLAND
ST J AMES
MOBILE
PATOKA
Texas
Utah
Montana
California
Arizona
Idaho
Nevada
Oregon
Iowa
Colorado
Kansas
Wyoming
New Mexico
Illinois
Ohio
Missouri
Minnesota
Nebraska
Georgia
Florida
Oklahoma
Alabama
Washington
South Dakota
Arkansas
Wisconsin
North Dakota
Virginia
Maine
New York
Indiana
Louisiana
Michigan
Mississippi
Kentucky
Tennessee
Pennsylvania
North Carolina
South Carolina
West Virginia
Michigan
Vermont
Massachusetts
Connecticut
Maryland
New Jersey
New Hampshire
Delaware
Rhode Island
District of Columbia
Québec
Ontario
Alberta
Manitoba
Saskatchewan
British Columbia
Newfoundland and Labrador
New BrunswickNova Scotia
Newfoundland and Labrador
British Columbia
Nova Scotia
Nunavut
Prince Edward Island
NunavutNunavutNunavut
Nunavut
Nunavut
Nunavut
Sonora
Chihuahua
Coahuila De Zaragoza
Baja California Norte
Baja California Sur
Nuevo LeonSinaloa
Legend
Refined Products Facilities
Crude Oil Facilities
LPG Facilities
Natural Gas Storage Facilities
Crude Oil Pipelines
LPG Pipeline
Refined Products Pipelines
Crude Oil Pipeline (Under Construction)
Major 3rd Party Pipelines
PADD V CrudeImports1.2 MMbpd
PADD III CrudeImports5.9 MMbpdLNG
Imports284 MMcfd
PADD V Products Imports0.3 MMbpd
PADD I Products Imports1.9 MMbpd
PADD II CrudeImports1.1 MMbpd
PADD IV CrudeImports0.3 MMbpd
20072006 20072006
increasing Percentage of Fee-Based Cash Flow (Based on Adjusted Segment Profit)
2006 2007 Guidance1
49% Marketing
8% Facilities
43% Transportation
34% Marketing
17% Facilities
49% Transportation
Fee based non-fee based
51% Fee-based 66% Fee-based
PAA is Well Positioned to Meet dynamic demands of u.S. energy Markets
1 Based on mid-point guidance furnished on Form 8-K on February 22, 2007
Import data from Energy Information Administration
09
PAA

Performance Metrics6
37
02
90
2
03
1,4
86
04
1,79
9
05
2,1
06
06
transportation Segment volumes(thousands of barrels per day)
Marketing Segment volumes(thousands of barrels per day)
Adjusted eBitdA(millions of dollars)
Facilities Segment volumes1
(average monthly capacity in million of barrels)
$13
0
02
$16
9
03
$25
2
04
$4
08
05
$51
1
06
3.9
02
12.1
03
14.8
04
17.5
05
23.2
06
1 Includes crude oil, refi ned products, LPG and natural gas (converted at 6:1 Mcf of gas to crude oil barrel ratio) storage capacity and LPG processing volumes.
02 03 04
650
05 06
7063
610
5659
589
4812
437
3835
410
Crude Oil Lease GatheringLPG SalesWaterborne Foreign Crude Imported
10
PAA

directors of Plains All American GP llC
The General Partner of Plains AAP, L.P., The General Partner of Plains All American Pipeline, L.P.
Greg L. Armstrong Chairman of the Board and Chief Executive Officer Plains All American GP LLC
David N. Capobianco Managing Director and Co-head of Private Equity of Vulcan Capital, an affiliate of Vulcan Inc. Chairman of the Board, Vulcan Energy Corporation
Everardo Goyanes President and Chief Executive Officer Liberty Energy Holdings LLC
Gary R. Petersen Senior Managing Director EnCap Investments L.P.
Robert V. Sinnott President, Chief Investment Officer and Senior Managing Director of Energy Investments Kayne Anderson Capital Advisors, L.P.
Arthur L. Smith Chairman and Chief Executive Officer John S. Herold, Inc.
J. Taft Symonds Chairman of the Board Symonds Trust Co. Ltd.
officers of Plains All American GP llC
Greg L. Armstrong Chairman of the Board and Chief Executive Officer
Harry N. Pefanis President and Chief Operating Officer
Phillip D. Kramer Executive Vice President and Chief Financial Officer
George R. Coiner Senior Group Vice President
Mark F. Shires Senior Vice President – Operations
Alfred A. Lindseth Senior Vice President – Technology, Process & Risk Management
Lawrence J. Dreyfuss Vice President, General Counsel – Commercial and Litigation and Assistant Secretary
Roger D. Everett Vice President – Human Resources
James B. Fryfogle Vice President – Refinery Supply
Mark J. Gorman Vice President
Jim G. Hester Vice President – Acquisitions
John Keffer Vice President – Terminals
Tim Moore Vice President, General Counsel and Secretary
Daniel J. Nerbonne Vice President – Engineering
John F. Russell Vice President – Pipeline Operations
Robert Sanford Vice President – Lease Supply
Al Swanson Vice President – Finance and Treasurer
Tina L. Val Vice President – Accounting and Chief Accounting Officer
Troy E. Valenzuela Vice President – Environmental, Health and Safety
John P. vonBerg Vice President – Trading
David E. Wright Vice President
Management team of PMC (nova Scotia) Company
W. David Duckett President
D. Mark Alenius Vice President and Chief Financial Officer
Stephen L. Bart Vice President – Operations
Ralph R. Cross Vice President – Business Develop-ment and Transportation Services
M.D. (Mike) Hallahan Vice President – Crude Oil
Richard H. (Rick) Henson Vice President – Corporate Services
Ron F. Wunder Vice President – LPG
unitholder information
The Common Units are listed and traded on the New York Stock Exchange under the symbol “PAA.”
The following table sets forth the high and low sales prices for the common units as reported on the New York Stock Exchange Composite Tape for the periods indicated:
2006 High 2006 Low 2005 High 2005 Low
1st Quarter $ 47.00 $ 39.81 $ 40.98 $ 36.502nd Quarter $ 48.92 $ 42.81 $ 45.08 $ 38.003rd Quarter $ 47.35 $ 43.21 $ 48.20 $ 42.014th Quarter $ 53.23 $ 45.20 $ 42.82 $ 38.51
Partnership information
transfer Agent
American Stock Transfer & Trust 59 Maiden Lane New York, New York 10038-4502 800.937.5449
independent Accountants
PricewaterhouseCoopers LLP 1201 Louisiana Street, Suite 2900 Houston, Texas 77002-5607
executive office of the General Partner
Plains All American GP LLC 333 Clay Street, Suite 1600 Houston, Texas 77002-4101 Phone: 713.646.4100 / 800.564.3036 Fax: 713.646.4572 E-mail: [email protected] Website: www.paalp.com

Plains All American Pipeline, l.P.
333 Clay Street, Suite 1600 Houston, Texas 77002 www.paalp.com