Place-shaping: a shared ambition for the future of local ...
166
March 2007 Sir Michael Lyons Annexes Place-shaping: a shared ambition for the future of local government
Transcript of Place-shaping: a shared ambition for the future of local ...

March 2007 Sir Michael Lyons
Annexes
Place-shaping: a shared ambition for thefuture of local government

Lyons Inquiry into Local Government - Final Report 1
CONTENTS
Page
Annex A Understanding the current grant distribution system 3
Annex B Introduction to Inquiry modelling 13
Annex C Background to support Chapter 7 23
Annex D Background to support Chapter 8 79
Annex E Background to support Chapter 9 91
Annex F Summary of submissions 111
Annex G Stakeholder views on Barker, Eddington and Leitch 135
Annex H Research and stakeholder engagement 155

Lyons Inquiry into Local Government - Final Report 3
INTRODUCTION
A.1 This annex reports on work by the Inquiry team which investigates the four block model method of distributing Revenue Support Grant and redistributed business rates. This analysis was undertaken to support the team’s modelling work, particularly on the role of business rates, assignment, grant, equalisation and incentives. It describes each of the blocks, compares the model with its predecessor and makes some qualitative assessments of the model. It also identifies elements of the model where it is necessary for policy and political judgment to be exercised. There is also a discussion of the amount of grant needed for equalisation to take place, and consideration of the scope for using benchmark measures of local authority expenditure.
HISTORICAL CONTEXT
A.2 For the last few decades, the English local government finance system has been designed so that the distribution of non-ring-fenced revenue grant takes some account of both the relative needs and the relative resources of each local authority. Although both the terminology involved and the precise extent to which ‘equalisation’ has occurred have varied over time, the underlying approach has remained similar, even if each system has been presented as different from its predecessor.
A.3 Such an approach can be traced at least as far back as 1929, when block grant was introduced, following proposals for an equalisation formula made by Lord Balfour at the start of the 20th century which were not implemented.1 The 1929 block grant calculation took account of both needs and resources, albeit not in a very transparent way. The process of equalisation developed in the ensuing decades, with the introduction of an explicit Exchequer Equalisation Grant in 1948 whereby central government contributed to bring authorities’ rateable value per head up to the national average.
A.4 Equalisation calculations have usually involved an ‘approved’ measure of expenditure, variously called ‘needs assessment’, ‘standard expenditure’, ‘Grant-related expenditure assessment’, ‘standard spending assessment’ (SSA) and ‘formula spending share’ (FSS). Each of these has involved an assessment – based on demographic, economic and social data – of the appropriate share of revenue spending for each local authority given a fixed national total. Although these have tended be a measure of the relative – rather than absolute – need to spend, the extent to which the size of the national total has differed from the amount that authorities have actually been spending collectively has varied over the years.2 The current way of reflecting relative spending needs in the calculations is discussed later in this annex.
A.5 Similarly, account has usually been taken of a local authority’s capacity for raising tax locally. In recent years, this has been done by using information on each authority’s tax base (the number of band D-equivalent properties in its area) and multiplying it by an assumed national average council tax for the appropriate class of authority. The capacity for raising other income - such as fees and charges - is not taken into account.
1 Foster, Jackman and Perlman, Local Government Finance in a Unitary State, 1980
2 For example, the FSS control totals were increased to reflect actual spending in 2003-04.
A UNDERSTANDING THE CURRENT GRANT
DISTRIBUTION SYSTEM

A UNDERSTANDING THE CURRENT GRANT D ISTR IBUT ION SYSTEM
4 Lyons Inquiry into Local Government - Final Report
A.6 By 2005-06, the calculation for each local authority could be summarised as:
FSS (allocated for a range of service blocks using various formulae)
less assumed income from council tax (allocated as taxbase multiplied by a share of an assumed national council tax level)
less income from redistributed business rates (allocated on a per head basis)
equals Revenue Support Grant (RSG), before floor damping.
A.7 The amount of RSG was then modified - by means of floor damping - to guarantee a minimum percentage increase in Formula Grant (the combined total of RSG, redistributed business rates and principal formula Police Grant).3
THE FOUR-BLOCK MODEL
A.8 The four-block model has replaced the previous system for 2006-07 onwards. It is summarised in Chart A1 below:4
A.9 It was introduced largely to get away from what the Government regarded as the widespread misinterpretation of some of the components of the previous system – particularly in relation to FSS and assumed national council tax figures. This is discussed later in this annex. When the four-block model was introduced a commitment was made not to change the underlying distribution. Over time, fresh judgments about the percentage shares that should go into each block will need to be made. The percentage share attributed to each block depends upon a policy and ministerial judgment, and there is scope for the model to move away from the previous approach for future years. The only change so far is that the percentage shares applied to each block for 2006-07 are also being applied for 2007-08, resulting in some small distributional effects as a result of data changes.
3 Police Grant was distributed using a formula almost identical to that used to distribute the police element of FSS.
4 Taken from a slide from a presentation on Distribution of Formula Grant to Local Authorities given to the 2006 Government Statistical Service (GSS) Methodology Conference. This is available at http://www.statistics.gov.uk/events/gss2006/downloads/A1Sussex.ppt.
Chart A1: The four-block model
4-block model
Central Allocation
Positive figure
2006-7 = 53.57%(100%-70.99% - - 24.57%)
Floor Damping
Positive/Negative figure
2006-7 = 0%
Relative Needs
Amount
Positive figure
2006-7 = 70.99%
RelativeResourceAmount
Negative figure
2006-7 = -24.57%

UNDERSTANDING THE CURRENT GRANT D ISTR IBUT ION SYSTEM A
Lyons Inquiry into Local Government - Final Report 5
A.10 Taking each block in the order in which they feature in the distribution of RSG and redistributed business rates:
The Relative Needs block takes account of a range of relative needs formulae to cover the major services which local authorities provide. They recognise the various factors which affect local authorities’ costs locally in a similar way to FSS formulae. They differ from FSS, however, in that they are measured with reference to the extent to which relative needs factors per head of population exceed the minimum figure for the group of authorities that provides the same range of services. The national Relative Needs Amount for 2006-07 is £14.82 billion, which is allocated to give a separate figure for each local authority.
The Relative Resource block is a negative figure which takes account of each local authority’s capacity for raising money locally through council tax. It differs from the calculation of assumed council tax income used in the previous system in that it uses the amounts above the minimum council tax base per head of population, rather than the figures for the total tax base. The total Relative Resource Amount for 2006-07 is -£5.13 billion. This particular amount depends upon a combination of taxbase figures and the level of resource equalisation inherited from the previous system. While it could theoretically be a positive amount, the model is designed with it being negative due to the constraints that apply to the total amount of grant available, following the outward transfer of RSG to pay for the Dedicated Schools Grant (see below). Again, the Relative Resource Amount is allocated to give a separate figure for each local authority. It can then be set against the Relative Needs Amount to give a further figure for each local authority which takes into account their relative needs and relative resources.
The Central Allocation is the amount left in the overall grant pot for local authorities once account has been taken of the Relative Needs and Relative Resources of each authority. It totals £11.19 billion for 2006-07 and is allocated on a per-head of population basis, based on the minimum figures calculated for the needs and resources blocks. Although it can be seen as a basic allowance per head – albeit with at least one caveat – it is too simplistic to regard this, in isolation, as being the required contribution to the cost of local services.5 There was no exact parallel to the Central Allocation in the previous system.6
The Floor Damping block is entirely self-funding (i.e. it sums to zero nationally). It reallocates the amounts calculated in the previous three blocks to ensure that each local authority receives a guaranteed minimum percentage increase in Formula Grant over the comparable figure for the previous year. Different minimum percentage increases are set for different groups of authorities. In practice, floor damping has a significant effect for many authorities, eclipsing large changes in grant that would otherwise result from applying the first three blocks. This is shown in Chart A2 below
5 The caveat is that the amount calculated as the Central Allocation for a local authority cannot be guaranteed to feed into Formula Grant, even before damping, because some of it is in effect ‘used up’ for authorities where the negative Relative Resource Amount exceeds the positive Relative Needs Amount.
6 The first three blocks can, however, be shown to be equivalent to the sum of RSG and redistributed business rates (NNDR) in the old system, in that: RSG + NNDR = FSS – Taxbase x Assumed National Council Tax (ANCT) x Share of Assumed National Council Tax (SANCT) = {FSS – min(FSS)} – {Taxbase x ANCT x SANCT x min(Taxbase x ANCT x SANCT)} + {min(FSS) – min (Taxbase x ANCT x SANCT} = Relative Needs Amount + Relative Resource Amount + Central Allocation.

A UNDERSTANDING THE CURRENT GRANT D ISTR IBUT ION SYSTEM
6 Lyons Inquiry into Local Government - Final Report
which shows, for shire district councils for 2006-07, the extent to which increases, or decreases, before floor damping (the thin blue line) are ‘trumped’ by the effect of floor damping (the thick black line). More details of the effects of floor damping are given in Annex E.7
A.11 This means that, for many local authorities, the indicators used in the relative needs and resources calculations (such as sparsity, or numbers of student exemptions from council tax) do not strongly influence the amount of Formula Grant that the authority receives in practice. This may not be fully understood by all the local authorities which put time and energy into lobbying for particular needs indicators to be added, altered or removed.
A.12 The amount resulting after applying floor damping is then split between RSG and redistributed business rates simply on the basis of the split between the national totals of the two amounts. These are £3.38 billion and £17.50 billion, or about 16% and 84% respectively, for 2006-07. The overall total (£20.88 billion) is agreed in the spending review process, with the redistributed business rates element being calculated a few months in advance of the financial year (as the ‘distributable amount’), taking account of the latest estimates of business rates income available for distribution from the central and local lists. Over time, business rates that are paid to central government are distributed back to local authorities but are in effect treated as the proceeds of a national rather than local tax.
7 Taken from Distribution of Formula Grant to Local Authorities, presentation given to the 2006 GSS Methodology Conference. This is available at http://www.statistics.gov.uk/events/gss2006/downloads/A1Sussex.ppt.
Chart A2: Floor damping for shire district councils, 2006-07
Source: Communities and Local Government
-25.0%
-20.0%
-15.0%
-10.0%
-5.0%
0.0%
5.0%
10.0%
15.0%
20.0%
Shire districts
Perc
enta
ge c
hang
e
Increase before damping scheme Increase after floor damping scheme

UNDERSTANDING THE CURRENT GRANT D ISTR IBUT ION SYSTEM A
Lyons Inquiry into Local Government - Final Report 7
A.13 In effect, a fifth block is applied for police authorities. This is the calculation of principal formula Police Grant. It is essentially a further relative needs block, which totals £3.94 billion for 2006-07. Not taking account of differences in resources in this calculation is consistent with the approach that is usually taken when distributing specific grants more generally. It is assumed that variations in raising resources have already been fully reflected in the Relative Resource block.
A.14 The sum of RSG, redistributed business rates and -– where relevant – principal formula Police Grant – is usually known as Formula Grant. This therefore totals £24.81 billion for 2006-07 (being the sum of £3.38 billion, £17.50 billion and £3.94 billion, as above, after rounding).
Dedicated Schools Grant and related changes for 2006-07 onwards
A.15 As well as moving to the four-block approach, 2006-07 has seen a significant reduction in the scope of the local government finance system, and a correspondingly significant reduction in the total amount of Formula Grant, from £49 billion for 2005-06 to about £25 billion for 2006-07. This is largely due to the outward transfer of about £25 billion schools funding, which is now funded wholly from the specific Dedicated Schools Grant (DSG). CLG reflected this in the national totals by deducting the whole of the £25 billion from RSG, this being the main reason for its large decrease, from £26.7 billion for 2005-06 to £3.4 billion for 2006-07.
A.16 The large reduction in RSG meant that it was no longer large enough nationally to allow the equalisation that had previously been carried out by taking account of authorities’ relative spending needs (through FSS figures) and resources (through figures for assumed income from council tax). As a result, redistributed business rates -– which had previously been distributed on a per head of population basis -– were added to the pot to be used for equalisation. This is why the four-block model covers redistributed business rates in addition to RSG (as explained above), whereas the calculation used for 2005-06 was for the amount of RSG only, albeit taking account of the amount of redistributed business rates that each authority was receiving.
Reconciliation of percentage shares for the four blocks with national grant totals A.17 The percentage shares that are typically referred to when examining the four block model - such as those in the diagram at Chart A1 - can be confusing. This is partly because the share associated with the Relative Resource block is negative. The Central Allocation block share is, effectively, the residual that is left when deducting the (positive) Relative Needs block share and the (negative) Relative Resource block share from 100 per cent, as shown in the diagram. The shares are percentages of the sum of RSG and redistributed business rates, which total £20.88 billion for 2006-07, as explained above.

A UNDERSTANDING THE CURRENT GRANT D ISTR IBUT ION SYSTEM
8 Lyons Inquiry into Local Government - Final Report
Assessment of the four-block model
A.18 Views on the four-block model vary. The Government regards it as a positive move away from notional spending (FSS) and assumed tax income (assumed national council tax figures, or ANCT) which were being misunderstood and misused for a variety of purposes – e.g. with FSS being regarded as a spending target and the percentage increase in ANCT being regarded as a forecast of the percentage increase in council tax. In contrast, Anna Capaldi of CIPFA, who has re-assembled the 2006-07 Settlement on a 2005-06 basis (giving an FSS of £42.52 billion, an assumed income from council tax of £22.624 billion and an assumed national council tax of £1,258), has concluded that the new system is less transparent and more complex, with its introduction coinciding with a significant increase in specific grant funding (due to DSG).8 She has observed that the notional spending and tax figures still underlie the system, and that ministers exercise a considerable degree of judgment.
A.19 Despite the fact that a local authority’s Relative Needs Amount is not directly comparable to its FSS, it is possible to scale up its Relative Needs Formulae by a particular scaling factor to give amounts in £, where the resulting figure is equivalent to its FSS.
A.20 The two systems are compared in Chart A3, where the areas of each block are roughly proportional to the amounts of money involved. Both diagrams give figures for 2006-07: Anna Capaldi’s representation of the previous system in a), and actual figures in b).9
8 Anna Capaldi Basics of Local Government Finance and introduction to New Grant System and 2006/07 and 2007/08 Settlements, 2006
9 Only three blocks are shown in the diagram of the four-block model because the floor damping block has a zero effect nationally
Chart A3: Comparing previous and current systems
1 Note: only three blocks are shown because floor damping block has a zero effect nationally.
a) Previous system b) Four-block model 1
Equals RSG + NNDR of £20.9bn
Less
Assumed income from council tax
£22.6bn FSS
£43.5bn
RSG + NNDR of £20.9bn
RNA
£14.8bn
Less RRA
£5.1bn
Central allocation £11.2bn
Equals
UNDERSTANDING THE CURRENT GRANT D ISTR IBUT ION SYSTEM A
Lyons Inquiry into Local Government - Final Report 9
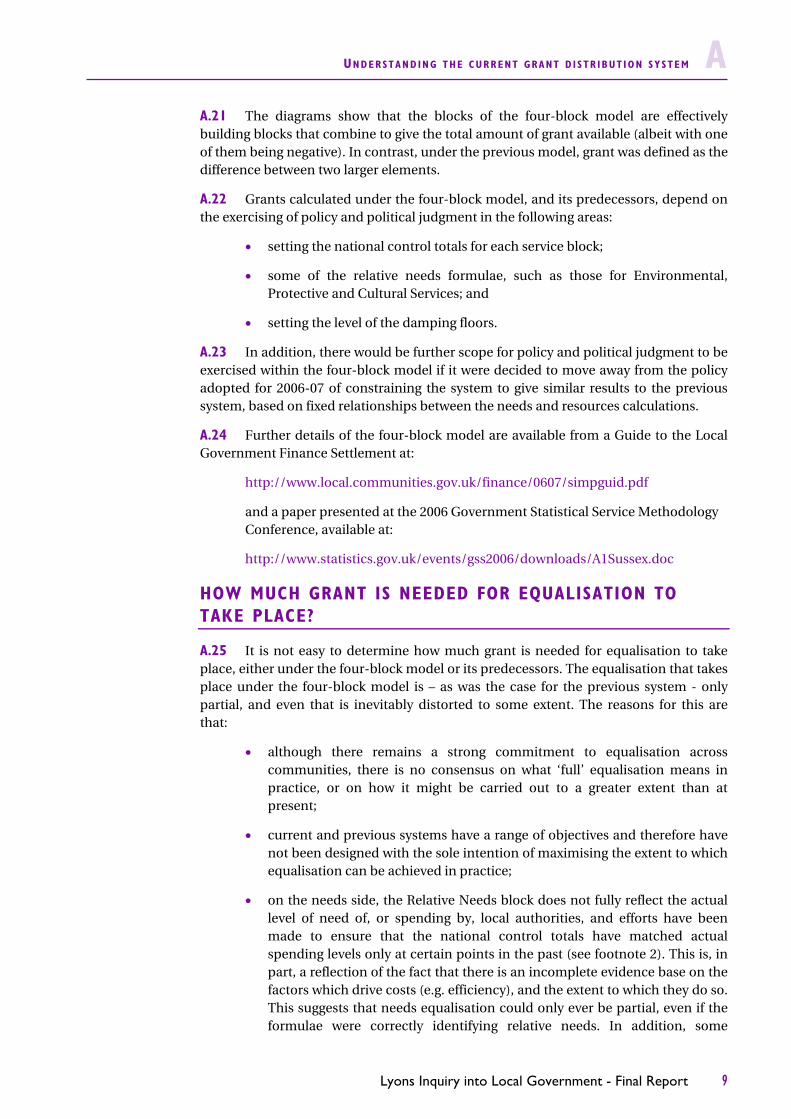
A.21 The diagrams show that the blocks of the four-block model are effectively building blocks that combine to give the total amount of grant available (albeit with one of them being negative). In contrast, under the previous model, grant was defined as the difference between two larger elements.
A.22 Grants calculated under the four-block model, and its predecessors, depend on the exercising of policy and political judgment in the following areas:
setting the national control totals for each service block;
some of the relative needs formulae, such as those for Environmental, Protective and Cultural Services; and
setting the level of the damping floors.
A.23 In addition, there would be further scope for policy and political judgment to be exercised within the four-block model if it were decided to move away from the policy adopted for 2006-07 of constraining the system to give similar results to the previous system, based on fixed relationships between the needs and resources calculations.
A.24 Further details of the four-block model are available from a Guide to the Local Government Finance Settlement at:
http://www.local.communities.gov.uk/finance/0607/simpguid.pdf
and a paper presented at the 2006 Government Statistical Service Methodology Conference, available at:
http://www.statistics.gov.uk/events/gss2006/downloads/A1Sussex.doc
HOW MUCH GRANT IS NEEDED FOR EQUALISATION TO TAKE PLACE?
A.25 It is not easy to determine how much grant is needed for equalisation to take place, either under the four-block model or its predecessors. The equalisation that takes place under the four-block model is – as was the case for the previous system - only partial, and even that is inevitably distorted to some extent. The reasons for this are that:
although there remains a strong commitment to equalisation across communities, there is no consensus on what ‘full’ equalisation means in practice, or on how it might be carried out to a greater extent than at present;
current and previous systems have a range of objectives and therefore have not been designed with the sole intention of maximising the extent to which equalisation can be achieved in practice;
on the needs side, the Relative Needs block does not fully reflect the actual level of need of, or spending by, local authorities, and efforts have been made to ensure that the national control totals have matched actual spending levels only at certain points in the past (see footnote 2). This is, in part, a reflection of the fact that there is an incomplete evidence base on the factors which drive costs (e.g. efficiency), and the extent to which they do so. This suggests that needs equalisation could only ever be partial, even if the formulae were correctly identifying relative needs. In addition, some

A UNDERSTANDING THE CURRENT GRANT D ISTR IBUT ION SYSTEM
10 Lyons Inquiry into Local Government - Final Report
formulae, such as those for Environmental, Protective and Cultural Services, are based on judgment rather than analysis because it is not possible to carry out a robust and objective analysis of relative spending needs for these blocks;
on the resources side, no account is taken of income from sources other than council tax, such as fees and charges; and the council tax figures are subject to certain assumptions, such as a 100 per cent collection rate, and that all second homes discounts are 50 per cent, even if the discount has been reduced in reality;10
the national control totals for each relative needs service block are set by central government in the light of information gathered in spending reviews and when assessing new pressures and burdens, rather than drawing on detailed local authority level information on the relative levels of need for services across blocks; and
a further – and significant – distortion is that the floor damping block waters down or cancels out some shifts in grant that would contribute to equalisation if they were allowed to feed through. While grant figures before floor damping can be extracted from the system, they have no practical application.
A.26 Further, the structure of the four blocks mean that it is not possible to disentangle needs equalisation and resource equalisation. Any attempts to quantify the amount needed for these separate elements of equalisation would, therefore, be constrained by this unless the system were changed. This was also true for the previous system.
A.27 Various figures have nevertheless been suggested as the amount of grant needed for equalisation to take place. In one sense, there is not currently enough money provided for Formula Grant to equalise for needs and resources, given that the Relative Resource Amount is negative, making it necessary to reallocate resources. However, an approximation of the amount needed to achieve equalisation, can in practice be made by regarding the Relative Needs and Relative Resource blocks as contributing to equalisation. The Central Allocation block does not contribute to equalisation, except where an authority’s Relative Resource Amount exceeds its Relative Needs Amount, so that part of its Central Allocation is eroded in order to fully deduct the Relative Resource Amount.11 This means that about £10.0 billion (excluding principal formula Police Grant) was needed for equalisation for 2006-07.12
A.28 While conceptually similar, this is not the same as the amount of grant needed to ensure that all authorities receive a positive grant for 2006-07, which is estimated to be £15.8 billion excluding police grant. The difference between the two calculations is set out in Chart A4.
10 The assumption regarding second homes is made to ensure that the additional council tax yield resulting from a reduction in the discount is not clawed back by central government.
11 That is, there is not enough money in the system for Relative Needs Amount minus Relative Resource Amount to be greater than or equal to zero for all local authorities.
12 This leaves an amount of some £10.9 billion as the benchmark for local assignment. This is made up from Formula Grant minus police grant minus amount for equalisation

UNDERSTANDING THE CURRENT GRANT D ISTR IBUT ION SYSTEM A
Lyons Inquiry into Local Government - Final Report 11
EXPENDITURE AND COUNCIL TAX BENCHMARK FIGURES
A.29 The four-block model does not involve the use or production of any explicit expenditure and council tax benchmark figures in the way that the previous system used FSS and levels of, and increases in, ANCT. Indeed, as explained above, one of the main reasons for moving away from the previous system was to avoid the misinterpretation of FSS and ANCT. There is therefore no benchmark within the current system to enable assessment of whether a local authority is spending above or below an expected level.
A.30 Furthermore, there are no measures of expenditure or council tax which can be used generically as benchmarks. While some measures might be used in some contexts – such as actual average council tax levels and budgets, retrospectively, once budgets and council taxes have been set – no measure can be regarded as a pure measure of need.13 Ways can, however, be found to summarise local authority financial decisions and activities when explicit measures of need are not required, such as in assessing the effects of policy options modelled by the Inquiry team.
13 For example, an individual authority’s budget requirement and band D council tax are both clearly affected by its own policy decisions and level of efficiency. However, whilst moving to a class average council tax and the corresponding budget requirement (effectively Formula Grant plus council tax requirement if the authority set its Band D council tax at its class average) might be seen positively, as diluting the effects of policy decisions and varying efficiency levels, it might also be seen negatively as moving away from a locally-based response to needs.
Chart A4: Amounts of grant needed for equalisation and implications of seeking to ensure that no local authority receives a negative grant
Amount needed to equalise = £10,009m (excluding police grant)
LESS…
Central allocation used for equalisation
only for LAs with a negative (RNA - RRA) figure.
The amounts total £318m.£10,868m not used to equalise
RNARRA
Central allocation
£14,821m-£5,130m
Lyons Inquiry into Local Government - Final Report 13
BACKGROUND
B.1 This annex sets out the approach taken to the statistical modelling used to support the analysis and recommendations in the Inquiry’s final report. The Inquiry team developed several detailed models to inform the analysis of options for the reform of the local government funding system over the course of the Inquiry.
B.2 The first wave of modelling work for the Inquiry examined the impact of council tax revaluation and was reported in annexes to the Interim Report and Consultation Paper in December 2005. It was published before the 2006-07 local government finance settlement had been finalised, and so Annex C reports results of an updated version of the extra bands reform option using figures for 2006-07.
B.3 The other annexes to this report complement that earlier work by providing details of statistical modelling of possible options for reform, including further work on council tax and other property taxes, local income tax, business rates, the assignment of revenues and grant equalisation. The material is grouped by the areas covered by Chapters 7, 8 and 9 as shown below.
CONTENTS OF THE TECHNICAL ANNEXES
B.4 This annex is an introduction to the modelling of the report and covers methodology and approach used for modelling; the main data sources; the availability of data used for modelling; and the pressures scenarios used to inform Chapter 3.
B.5 Annex C explains the technical background to support Chapter 7 and covers the following:
council tax and point value property tax;
council tax benefit (CTB) and related changes; and
local income tax as a full or partial replacement for council tax.
B.6 Annex D outlines the technical background to support Chapter 8 and examines:
full relocalisation of business rates;
supplementary business rate;
the impact of rents on rateable values;
estimated yield from removing the business rates exemption for agricultural land and buildings; and
breakdown of the empty property relief.
B.7 Annex E explains the technical background to support Chapter 9 on incentives and the grant system, including:
council tax incentives;
business rates incentives; and
options for assignment of national taxation.
B INTRODUCTION TO INQUIRY MODELLING
B INTRODUCT ION TO INQUIRY MODELL ING
14 Lyons Inquiry into Local Government - Final Report
B.8 A series of supplementary charts and tables which provide background information to the modelling work carried out by the Inquiry team is also available on the website.
METHODOLOGY AND APPROACH
B.9 The general approach taken in the technical annexes is to present the methodology used in the analysis; assumptions; data sources; and detailed findings, particularly the impact on bills and grant by local authority region and type of household. Some pieces of modelling work do not, by their nature, fully lend themselves to this approach.
General technical issues
B.10 Although every piece of modelling work involves some technical methods and terminology, a few of them are relevant for several pieces of modelling work. Those with a more general application are defined in the glossary, with the more technical details being discussed below. Further details are given as necessary in other annexes, in the descriptions of particular pieces of modelling work.
B.11 The Inquiry team has run analysis using the Department for Work and Pensions’ (DWP) Policy Simulation Model (PSM) and the Inter-Governmental Tax Benefit Model (IGOTM). Both are static micro-simulation models of the Great Britain tax and income-related benefit system and can be used to estimate the impact of changes on different types of household and on the overall government budget. The Inquiry team used these simulation models to estimate the impact of policy changes on households and the overall cost of CTB to government.
B.12 Both the IGOTM and PSM simulation models are based on Family Resources Survey (FRS) data and calculate household or benefit unit liability for taxes and entitlement to benefits.1 Although similar, the models are not identical and each has particular strengths for analysing different areas of the tax and benefit system.
B.13 Most of the council tax reform analyses were run using IGOTM, but analyses of the costs of some CTB reforms were based on PSM to check the implications for the overall government budget at full take-up of CTB. Survey data are recognised as having limitations but the Inquiry team used them as the most accurate available data, and to ensure consistency with central government’s own work.
B.14 Net household income is usually defined as the income received by a household after taking account of taxes and benefits, but before deducting housing costs. The usual presentation of analyses involving net household income includes a breakdown by income decile, where each decile represents the range of incomes relating to one tenth of the number of households after sorting by income. The first decile represents the 10 per cent of people on lowest incomes, whereas those in the tenth decile are the 10 per cent with highest incomes.
B.15 The usual presentation of analyses involving household types includes a breakdown into seven categories of household: single non-pensioner; married without
1 In IGOTM, the most recent available estimates of CTB take-up are applied to the FRS-based data in modelling where actual take-up rates are modelled, even if they relate to an earlier year in practice. In particular, the IGOTM modelling work carried out by the Inquiry team is based on estimates of take-up for 2003-04. DWP has since published some estimates for 2004-05, which are similar to those for 2003-04 for overall take-up rates.
Models used

INTRODUCT ION TO INQUIRY MODELL ING B
Lyons Inquiry into Local Government - Final Report 15
children; married with children; one-parent families; single pensioners; married pensioners and multiple tax units with or without children.
B.16 When interpreting figures for the average local tax as a percentage of household income produced using IGOTM, it should be noted that they are calculated on a ‘democratic’ (or unweighted), rather than ‘plutocratic’ (or weighted) basis. This helps to explain the findings that show increased average tax bills, but decreased average percentage burdens, which arise in some of the analyses. Details are given below:
B.17 This section explains some of the key terms used in the modelling. The local authorities included in this modelling work are billing authorities and major precepting authorities. The modelling has not included separate figures for parish and town councils – which are known as local precepting authorities – although aggregate amounts of council tax precepted by them have been included in the council tax figures for the relevant billing authority where appropriate to the modelling.
B.18 The precise definition of ‘budget requirement’ includes adjustments for collection fund surpluses and deficits. It also includes expenditure funded from certain other items for particular authorities, such as GLA General Grant for the Greater London Authority, and the business rate yield from the City of London’s own multiplier.
B.19 There are two different definitions of ‘tax base’. The ‘tax-setting tax base’ for a local authority, is used in practice when calculating the average band D council tax for a local authority, whereas the ‘tax base for Formula Grant purposes’ is used in the calculation of Formula Grant. They differ in respect of the treatment of second home discounts. In addition, the former reflects a billing authority’s estimate of its council tax collection rate, whereas the latter assumes 100 per cent collection for all billing authorities.
Plutocratic and democratic averages
Suppose there are three people whose tax bills are £5, £10 and £15 per week, with incomes of £50, £150 and £400 per week respectively. For both plutocratic and democratic averages, the average bill is calculated in the ‘normal way’, as (£5+£10+£15)/3 = £10.
For plutocratic averages, the average burden is the sum of all bills divided by the sum of all incomes; (£5+£10+£15)/(£50+£150+£400) x 100% = 5%.
For democratic averages (as calculated in IGOTM), the average burden is the unweighted average of the individual burdens: (£5/£50+£10/£150+£15/£400)/3 x 100% = 7%.
The plutocratic average gives more weight to the taxpayer who is contributing more to the total pot, who here has a lower burden. Democratic averages are not weighted like this.
This explains some instances where the results seem counter-intuitive. For example, calculating, the average tax bill in the ‘normal’ way can result in an increase in average bill at the same time as the percentage burden appears to reduce. This is because the burden is calculated using an unweighted democratic average, which does not give more weight to those taxpayers contributing more to the pot whose burdens have increased.
Terminology and
definitions

B INTRODUCT ION TO INQUIRY MODELL ING
16 Lyons Inquiry into Local Government - Final Report
B.20 The Formula Grant figures used in the modelling work usually exclude the effects of floor damping, in order to identify the effects of using the underlying grant figures.2
B.21 When calculating the impact on council tax bills of changes to grant distribution (for example in revaluation modelling), the modelling generally assumed that a local authority’s budget requirement remains the same. Calculation of average council tax bills was therefore carried out by using the recalculated grant figures in place of the actual 2006-07 Formula Grant figures. The resulting required council tax yield was then divided by the tax-setting tax base figure to give a revised band D council tax figure for each local authority.3 These were then added up to give a revised figure for the band D area council tax – the average band D bill – for each billing authority area. These figures were used in conjunction with data based on the Family Resources Survey to model the effects at a household level.
B.22 Unless otherwise stated, each analysis relates to England as a whole.
MAIN DATA SOURCES
B.23 The main data sources used were:
Council tax
figures relating to numbers of dwellings, council tax discounts and council tax exemptions, broken down by band, submitted by billing authorities to the department for Communities and Local Government (CLG) on council tax base (CTB1) returns for October 2005;4
figures relating to 2006-07 budget requirements and council tax requirements and council tax bases, submitted by local authorities to CLG on Budget Requirement (BR) returns;5 and
figures for amounts of Formula Grant for 2006-07, as calculated by CLG, and subsequently reported on BR returns.6
Business rates
figures relating to forecast and actual yields from business rates and associated information on rateable values and reliefs submitted by billing authorities to CLG on NNDR returns.
2 Floor damping occurs as the final block of the four-block model. It involves constraining the figures calculated for each authority to guarantee a minimum year-on-year percentage increase in grant for each class of authority. More details are given in Annex A.
3 Tax bases were revised where necessary, for example to reflect new band ratios or the introduction of extra bands.
4 Figures from CTB returns for October 2006 are available at the time of publication of the final report, but were not available at the time of modelling.
5 Figures from BR returns for 2007-08 are expected to become available at about the time of publication of the final report, but were not available at the time of modelling.
6 Although provisional Formula Grant figures for 2007-08 were available at the time of modelling, final figures were not available, and neither council taxes nor budget requirements for 2007-08 had been set, so that any 2007-08-based modelling would have been incomplete.
Common assumptions

INTRODUCT ION TO INQUIRY MODELL ING B
Lyons Inquiry into Local Government - Final Report 17
Characteristics of households
household data based on the Family Resources Survey. A combined sample from the surveys for 2003-04 and 2004-05 was used, with the sample size in England being just over 20,000 in each year. The survey results were grossed to give results for all 21 million households in England.
B.24 Table B1 shows how the households for which figures were used in modelling can be broken down by household type and income decile.7 The seven household types that are used in the analysis vary in size from 1.3 million households (one-parent families) to 3.9 million households (married without children).
B.25 Other data sources were also used for particular pieces of work, such as income tax yields and average domestic property values. They are described in the relevant section.
THE AVAILABILITY OF DATA USED FOR MODELLING
B.26 Some of the data used for modelling are available to anyone who may wish to use them, though this varies according to the particular data sets used. Details of the availability of the main data used are given below.
Council tax and business rates
B.27 Figures taken from CTB1, BR and NNDR returns provided by local authorities to Communities and Local Government are available from the Data & Dissemination team, Local Government Finance – Capital Finance and Analysis Division, Communities and Local Government, 5th floor, Eland House, Bressenden Place, London, SW1E 5DU. Statistical releases containing national totals, and local authority level figures from BR returns, are available from http://www.local.communities.gov.uk/finance/stats/index.htm. Further information is
7 In addition, figures for some households were excluded from modelling because they were outliers.
Table B1 - breakdown of grossed household figures used in IGOTM modellingThousand
Equivalised Income Decile
Single non-pensioner
Couple without children
Couple with children
One-parent families
Single pensioners
Pensioner couples
Multiple tax units with or
without children
Total
1 445 200 270 306 247 175 371 2,015 2 230 186 377 281 425 353 250 2,101 3 232 194 374 194 468 359 290 2,111 4 259 200 353 152 535 286 331 2,114 5 266 251 392 121 427 274 382 2,113 6 318 329 420 79 303 210 459 2,118 7 323 426 422 50 263 151 483 2,116 8 377 556 430 40 133 135 448 2,118 9 456 686 361 30 75 96 413 2,117 10 537 838 337 10 70 88 237 2,117
Total 3,443 3,866 3,735 1,262 2,945 2,126 3,664 21,041
Source: IGOTM
Household type

B INTRODUCT ION TO INQUIRY MODELL ING
18 Lyons Inquiry into Local Government - Final Report
available from John Farrar at [email protected] and on 020 7944 020 7944 4158.
Formula Grant
B.28 A wide range of information on the local government finance settlement for 2006-07 is available at http://www.local.communities.gov.uk/finance/0607/grant.htm. There are constraints on the dissemination of some of the data used in the settlement, placed on Communities and Local Government by the suppliers, which mean that some of the data are published authority-by-authority at http://www.local.communities.gov.uk/finance/0607/tabs067s.htm, rather than all in one place. More comprehensive databases are made available to a limited audience for the purposes of research only. Further information is available from Jo Joslin at [email protected] and on 020 7944 4048.
Characteristics of households
B.29 As stated above, two models were used to examine the effects of various policy options on households: the Department for Work and Pensions (DWP) Policy Simulation Model (PSM) and the Inter-Governmental Tax Benefit Model (IGOTM), both of which use datasets derived from the Family Resources Survey.
B.30 The PSM and IGOTM require access to detailed data at an individual level in order to model accurately the calculation of individual taxes and income-related benefit entitlements. Both models use datasets derived from the Family Resources Survey, which provides the detailed microdata used within the model to represent the population. An anonymised version of this dataset is deposited at the UK Data Archive at the University of Essex. Further details are available from http://www.data-archive.ac.uk/Introduction.asp.
Domestic property values
B.31 Data relating to average property values at 1 April 2005 in billing authority areas were provided by the Valuation Office Agency (VOA) and used in the modelling of extra council tax bands without revaluation and a point value property tax scenario. The particular datasets used in the modelling cannot be released because doing so would breach the VOA's statutory duty of confidentiality.
Income tax data
B.32 Estimates of the yield from 1p on the basic rate of income tax for each local authority area for 2006-07 were provided by Her Majesty’s Revenue & Customs (HMRC) and used in the modelling of several options relating to a local income tax. They were produced using the Department’s Personal Tax Model (PTM) and information from the Survey of Personal Incomes (SPI). The particular datasets used in the modelling cannot be released because they contain confidential taxpayer information.
B.33 There are two sources of publicly available material:
HMRC publishes National Statistics on income tax and personal incomes on their website. Tables 2.1 to 2.7 can be found at http://www.hmrc.gov.uk/stats/income_tax/menu.htm, and tables 3.1 to 3.15 are available at http://www.hmrc.gov.uk/stats/income_distribution/menu.htm,

INTRODUCT ION TO INQUIRY MODELL ING B
Lyons Inquiry into Local Government - Final Report 19
HMRC also makes available an anonymised public usage tape of the Survey of Personal Incomes, which is deposited in the UK Data Archive at the University of Essex, http://www.data-archive.ac.uk/. The datasets can be accessed at http://www.data-archive.ac.uk/findingData/subjectResults.asp?gn=33297&subcat=VII%5CD.
B.34 Further information is available from Shahida Begum at [email protected] and on 020 7147 3045.
Rating of agricultural premises
B.35 Details of the method used to estimate the rateable values of agricultural land and buildings, based on data from the Defra Farm Business Survey (FBS), are given in Annex D. Further information on the Defra Farm Business Survey is available from the Defra website at http://statistics.defra.gov.uk/esg/asd/fbs/default.htm. More generally, a range of statistical notices and publications that use FBS data are available at http://statistics.defra.gov.uk/esg. Further information is available from Selina Matthews at [email protected] and on 020 7238 3274.
PRESSURES SCENARIOS
Description of the methodology
B.36 The Inquiry team modelled some simplified scenarios for local spending and revenues over the next twenty years. These are purely illustrative and are not predictions, nor were they based on any specific or private information about what might actually happen. They are simply intended to give a sense of the range and scale of possible pressures, depending on trends in spending and revenues.
B.37 Data on local authority expenditure and revenues is published by CLG, as:
net current expenditure by service; and
revenue expenditure and financing.
B.38 The difference between projected expenditure (after efficiency savings) and projected revenues from central government was deemed to be the amount of yield required from council tax. This generated an assumed increase in council tax yield from one year to the next. The model converted this increase in yield into a percentage increase in band D bills, assuming total tax base growth of 0.8 per cent per year.8 If income was less than forecast expenditure, council tax was assumed to increase. If income exceeded forecast expenditure, council tax bills were assumed to reduce.
B.39 All figures are expressed in cash terms. Assumptions are in some cases informed by the predicted rate of inflation, which is based on GDP growth according to HM Treasury forecasts. At the Pre-Budget Report 2006 this measure of inflation was running at 2.7 per cent.
8 Tax base growth projections of 0.8% per year were based on advice from CLG, and reflects trend growth over recent years.

B INTRODUCT ION TO INQUIRY MODELL ING
20 Lyons Inquiry into Local Government - Final Report
Assumptions
Spending on waste services increases in line with the projections in the 2005 waste strategy review; 9
Growth in spending on social care for older people in line with the projections made in Derek Wanless’ report for the King’s Fund. Figures related to Wanless’ baseline scenario, and do not assume any policy change;10
Growth in all other service expenditure was subject to a variable assumption as part of the scenarios modelled;
Efficiency savings across total expenditure were projected at 3 per cent year-on-year until 2010-11, in line with the commitment set out in the 2006 Pre-Budget Report. Thereafter a lower rate of 1 per cent year-on-year efficiency savings is assumed, on the basis that a stronger assumption that this might imply policy change on service provision, which is not within the scope of this model; and
Revenues from central government were subject to variable assumptions. These were separately input for Formula Grant (business rates and Revenue Support Grant combined), and Specific and Special Grants (excluding Dedicated Schools Grant).11
9 Defra, Review of England’s Waste Strategy, 2006
10 Derek Wanless, Securing Good Care for Older People; taking a long term view, King’s Fund 2006. Since Wanless’ projections are expressed in real terms, a GDP deflator was applied to give cash figures. The rate of growth in these, averaged over five year periods, was applied to the model.
11 DSG growth is held constant at 5.7%, which is consistent with current growth rates. This is not assumed to have an impact on council tax since the model assumes that changes in schools funding would be mirrored in schools spending, and so made neutral overall. Grant to police and fire authorities, and to the Greater London Authority, are assumed to grow in line with Formula Grant.

INTRODUCT ION TO INQUIRY MODELL ING B
Lyons Inquiry into Local Government - Final Report 21
Outputs
Revenue growth Spending growth12
Implied average increase in band D council tax over 20 years
3.7%
(or 1% real growth)
-3.4% per year
Varying the rate of spending growth
Formula grant 2.7%
Specific grants 5% 5.2%
(or 2.5% real growth)
5.6% per year
Revenue growth Spending growth12
Average increase in band D council tax over 20 years
Formula grant 3.7%
Specific grants 5% 5.0% per year Varying the rate of
funding growth from central government
Formula grant 5.2%
Specific grants 5%
5.2%
(or 2.5% real growth)
3.5% per year
12 Excluding waste and social care for older people

Lyons Inquiry into Local Government - Final Report 23
C.1 This annex provides details of the modelling undertaken as part of the Inquiry’s work on council tax, council tax benefit (CTB) and local income tax (LIT). It includes the options discussed in Chapter 7 of the main report, as well as some others.
C.2 Further outputs from this modelling are available as supplementary tables and charts, on the Inquiry’s website: www.lyonsinquiry.org.uk (archived at www.nationalarchives.gov.uk)
OPTIONS FOR REFORM OF COUNCIL TAX
C.3 This section summarises the options modelled by the Inquiry for reform of council tax as a property tax.
C.4 Modelling of options for council tax reform as part of a revaluation of properties was published in full in the Consultation Paper and Interim Report in December 2005, and are only summarised here. A summary is provided of:
revaluation modelling conducted in 2005; and
work undertaken in 2006 to update the revaluation modelling using data on the 2006-07 local government finance settlement.
C.5 Further modelling was conducted in 2006 after the extension of the Inquiry’s remit, and is detailed below. This covers:
changes to council tax band ratios;
extra bands using 1991 valuations;
reform of band H; and
point value property tax.
C BACKGROUND TO SUPPORT CHAPTER 7

C BACKGROUND TO SUPPORT CHAPTER 7
24 Lyons Inquiry into Local Government - Final Report
SUMMARY: 2005 REVALUATION MODELLING
C.6 Under the Inquiry’s original remit to prepare for a revaluation of properties for council tax, a range of options for reform through revaluation were explored. The options modelled were:
National update: a straightforward revaluation that retains the existing band and ratio structure;
Regional update: retaining the existing band and ratio structure, but with nine sets of regional bands based on regional house prices;
Extra bands: adding new bands to the top and bottom of the existing structure. This creates a new lowest band by splitting the existing band A, splits band G, and creates two new bands at the top. This option also stretches the ratios between bands, such that the new highest band ratio is more than seven times the lowest.
Extra bands with Inner London region: adopts the same band and ratio structure as the Extra Bands option, but has two sets of regional bands: one for Inner London and one for the rest of the country. This option was developed to address the large proportion of properties that would move up to a higher band in Inner London in a national revaluation or reform option (which was significantly higher than any other region examined).
Extra bands with limited upward movement: designed to limit upward band movements to one band per revaluation cycle, whilst allowing unlimited band reductions. The option was developed in the context of considering more frequent revaluations, for example every five years.
C.7 The results of that modelling showed that under any of the options modelled, between half and two thirds of all households would stay in the same band, with only minimal changes in their council tax bills (less than £1 per week up or down). Just over a third of all households would move bands under the national or regional update options, increasing to around half of all households under options which introduce new bands at the top and bottom of the range.
C.8 Introducing extra bands allows around a quarter of all households to see bills reduced by between £1-3 per week, and a further 6 per cent see larger reductions of more than £3 per week after revaluation. Up to 12 per cent of households would experience an increase in bills of £1-3 per week, and a further 10 per cent see increases of over £3 per week.

BACKGROUND TO SUPPORT CHAPTER 7 C
Lyons Inquiry into Local Government - Final Report 25
Table C1: Band movements by revaluation and reform option, England
Numbers of properties moving bands millions (%)
Down 2 or more
bands
Down 1 band
Same band Up 1 band
Up 2 or more bands
Changing band
National update 0.3 (1) 3.4 (16) 14.0 (64) 4.0 (18) 0.3 (1) 7.9 (36)
Regional update 0.3 (1) 3.4 (16) 14.1 (64) 3.9 (18) 0.3 (1) 7.8 (36)
Extra bands 0.4 (2) 6.1 (28) 10.8 (49) 4.2 (19) 0.4 (2) 11.1 (51)
Extra bands with Inner London region
0.4 (2) 6.2 (28) 10.9 (50) 4.1 (19) 0.3 (2) 11.0 (51)
Extra bands with limited upward movement
0.4 (2) 6.1 (28) 10.8 (49) 4.6 (21) 0.0 (0) 11.1 (51)
Source: Lyons Inquiry analysis
Table C2: Estimated bill changes as a result of revaluation and reform options before discounts and exemptions, transition and council tax benefit 1
Estimated bill changes millions (%)
Down at least £3 per week
Down £1–3 per week
Within £1 per week
Up £1–3 per week
Up £3+ per week
National update 1.3 (6) 2.3 (11) 13.9 (64) 2.7 (12) 1.6 (7)
Regional update 1.4 (6) 2.4 (11) 13.9 (64) 2.7 (12) 1.5 (7)
Extra bands 1.4 (6) 5.2 (24) 10.6 (49) 2.5 (12) 2.2 (10)
Extra bands with Inner London region 1.4 (6) 5.2 (24) 10.9 (50) 2.3 (11) 2.1 (9)
Extra bands with limited upward movement
1.4 (6) 5.2 (24) 10.6 (49) 2.6 (12) 2.1 (10)
Source: Lyons Inquiry
1 Row totals may sum to 101% due to rounding

C BACKGROUND TO SUPPORT CHAPTER 7
26 Lyons Inquiry into Local Government - Final Report
C.9 The Consultation Paper and Interim Report included a commitment to finalise modelling on the basis of the 2006-07 local government funding settlement, in order to ensure that the analysis took account of significant recent changes. In that context, the Extra Bands option was re-run using latest settlement data.
C.10 Table C3 below shows that the new settlement data did not significantly alter the outcome of the modelling. The same proportion of households (49%) would see only a minimal change in their council tax bill (before CTB) after revaluation and reform under both modelling runs. Similar proportions of all households would experience a £1 or more increase in their council tax bill as a result of the change, although the proportion experiencing an increase of £3 per week or more rises slightly in the 2006-07 run. This reflects the combined impact of 2006-07 tax increases, and any upward band movements due to revaluation.
Table C3: Estimated changes in household weekly council tax bills as a result of the Extra Bands option, 2005-06 and 2006-07
Source: Lyons Inquiry analysis
C.11 The updated modelling shows a very similar proportion of income paid in council tax in each income decile, both before and after council tax benefit. This further confirms the conclusion expressed in the Interim Report: that revaluation does not have a significant effect on the progressiveness of council tax to income overall.
millions (%)
2005-06 1.4 (6) 5.2 (24) 10.6 (49) 2.5 (12) 2.2 (10)
2006-07 1.5 (7) 5.1 (23) 10.7 (49) 2.3 (10) 2.4 (11)
Up £3
per week
Down at least
£3 per week
Down £1-£3
per week
Within £1
per week
Up £1-£3
per week

BACKGROUND TO SUPPORT CHAPTER 7 C
Lyons Inquiry into Local Government - Final Report 27
CHANGING COUNCIL TAX BAND RATIOS
Summary of modelling work
C.12 Local authorities are responsible for setting the level of band D bills in their area. Bills for properties in all other bands are set at a fixed proportion of the band D amount. These ‘band ratios’ are set by legislation and have not been changed since council tax was introduced in 1993.
C.13 Modelling was carried out to identify the effect of changing the current ratios between council tax bands.2 At the moment band H properties pay only three times as much as those in band A. Reform options were designed with a particular focus on increasing the differential between bills in the top and bottom bands, by widening the ratios applied either side of band D.
C.14 Two options were modelled as alternatives to the current ratio of 3 to 1 between the amounts payable for band H and band A properties:
a ratio of 5 to 1, which would be more closely linked to the average household income in the top and bottom bands; and
a ratio of 10 to 1, which would be more closely linked to the mean property value in the top and bottom bands, at 2005 prices.
C.15 The two scenarios are intended to be illustrative: in practice the Government could adjust the ratio applied to each band, and the overall ratio between bands A and H, according to its judgements about the appropriate scale of reform.3
Main findings
C.16 Two thirds of households (those in bands A to C) would pay less council tax than at present, before council tax benefit. One third would pay more than now (those in bands D to H). Average band D council tax would need to increase, by 5.4 per cent for a 5 to 1 ratio, and by 9.4 per cent for a 10 to 1 ratio. This is to compensate for the national tax base decreasing overall, without placing an excessive burden on bands E to H.
Description of methodology
C.17 The individual band ratios for the two options were set as in Table C.4, where the amount paid in each case is expressed as a proportion of the band D bill.
2 In particular, the aim was to identify the effect on 2006-07 Formula Grant distribution and consequent potential impact on council tax levels.
3 As reported in the findings, both the modelled options resulted in a decreased tax base nationally, and hence increased band D bills, because the increase in bills paid by the higher band properties did not make up for the shortfall in yield from the much greater number of lower band properties. Whilst alternative options involving no reduction in the national tax base could have been modelled (for example, by significantly increasing the ratios for Bands E and F), such an approach would result in a reformed council tax structure in which ratios were determined rather arbitrarily.

C BACKGROUND TO SUPPORT CHAPTER 7
28 Lyons Inquiry into Local Government - Final Report
Table C4: Band ratios in options examined
Source: Lyons Inquiry
C.18 For each option, intermediate ratios for bands B to G were selected to achieve a relatively even distribution. A marked increase for band H compared with the other bands was, however, introduced in recognition that the average property value in that band is much higher than that in band G.
C.19 Local authorities’ total tax-raising capacity (or tax base) depends on the bandings of the properties in their area, and the amount of tax paid in each band. Changing the band ratios will change the total tax ‘value’ of properties in each area (high banded properties will yield more tax than now, and vice versa), which therefore changes the total size of the council tax base.
C.20 For each option modelled, a revised tax base was calculated for each local authority, taking account of the new ratio for each band.4 The revised tax bases for Formula Grant purposes were then used in the resource equalisation block of the four-block model to recalculate Formula Grant figures for each local authority for 2006-07. Average council tax bills were calculated for each authority using the process described in Annex B.
Assumptions
Modelling of the distribution of Formula Grant does not take account of floor damping, so that any effects can be properly attributed to the policy change.
Formula Grant and council tax yield remain fixed nationally, but not at local authority level.
Each local authority’s level of spending for 2006-07 – as measured by its budget requirement – is assumed to be fixed, regardless of changes to Formula Grant.
Each local authority’s council tax yield is recalculated as the difference between its budget requirement and Formula Grant and other relevant items, as discussed in Annex B.
4 A few adjustments were made to put tax base figures on to the same basis as those used for calculating Band D council taxes for 2006-07. The biggest adjustment was to take account of each billing authority’s assumed collection rate instead of the 100% assumed initially when calculating the initial tax base figure.
Band Current ratio (3 to 1) 5 to 1 reform option 10 to 1 reform option
A 6/9 4/7 2/5
B 7/9 5/7 3/5
C 8/9 11/14 4/5
D 9/9 7/7 5/5
E 11/9 17/14 6/5
F 13/9 10/7 8/5
G 15/9 13/7 11/5
H 18/9 20/7 20/5

BACKGROUND TO SUPPORT CHAPTER 7 C
Lyons Inquiry into Local Government - Final Report 29
Detailed findings
C.21 Wider band ratios would create a greater disparity in tax bases between local authorities than at present, and consequently a greater proportion of Formula Grant would be needed for resource equalisation. Currently £5.1 billion is removed from grant for resource equalisation in the form of the Relative Resource Amount, but this would increase to £6.1 billion under the 5 to 1 ratio option and £8.6 billion under the 10 to1 option.5
Table C5: Tax base totals under changed band ratios
Ratio H to A Tax base(Band D equivalent properties) -million
Reduction in tax base
(%)
Implied increase in Band D bills (%)
Current ratio (3 to 1) 17.7 - -
5 to 1 16.8 5.1 5.4
10 to 1 16.2 8.6 9.4
Source: Lyons Inquiry
C.22 The modelling was constrained so that the combined total of Formula Grant and council tax yield remained constant nationally. Under both new ratio options, the national tax base (the number of band D equivalent properties) would fall. This is because the increased tax base from the higher band properties would not, at the ratios applied here, fully compensate for the reduced tax yield from the much greater number of band A, B and C properties.
C.23 It would be possible to compensate for this loss of tax base by adjusting the ratios applied to bands E to H. However, given the relatively small numbers of properties in those bands, it was judged that this might concentrate the burden too heavily on those households. Also increasing band D bills would spread the burden more widely (across a third of all properties altogether), and avoid the need for very large bills in the top bands.
C.24 Table C6 shows average annual bills by band, before CTB. Two thirds of households (all those in Bands A to C) would pay less council tax under this model. A third (bands D to H) would pay more.
5 Formula Grant used for resource equalisation’ is defined as the total Relative Resource Amount in the four-block model.
Impact on tax bases
Impact on household tax
bills

C BACKGROUND TO SUPPORT CHAPTER 7
30 Lyons Inquiry into Local Government - Final Report
Table C6: Average annual bills with new band ratios
Source: Lyons Inquiry analysis
C.25 Under the 5 to 1 option, overall ‘turbulence’ (the amount of change in households’ bills at reform) would be relatively limited. Most households would experience a change in bills of less than £1 per week, before council tax benefit. The 10 to1 option unsurprisingly creates greater turbulence, with 3.5 million households seeing bills reduced by more than £3 per week before CTB, while 1.7 million would pay at least £3 per week more before CTB.
C.26 Bills in the lowest income decile would remain unchanged under both new ratio options – many of these households would be receiving CTB or be exempt from council tax. Council tax would become slightly more progressive to income overall.
C.27 After allowing for CTB, there would be little difference between the percentage of net household income payable as council tax for the current bands and those for a 5 to 1 ratio, but the percentage would be more noticeably reduced for most lower and middle deciles under a 10 to 1 ratio.
Chart C1: Council tax as a percentage of net household income by income decile, extra bands without revaluation option
Source: Lyons Inquiry analysis
Current 5 to 1 10 to 1
£ £ £ £ % £ %
A 846 764 555 -82 -9.7 -291 -34.4B 987 955 833 -32 -3.2 -154 -15.6C 1,128 1,050 1,111 -78 -6.9 -17 -1.5D 1,269 1,367 1,388 98 7.7 119 9.4E 1,551 1,623 1,666 72 4.6 115 7.4F 1,833 1,910 2,221 77 4.2 388 21.2G 2,115 2,483 3,054 368 17.4 939 44.4H 2,538 3,820 5,553 1,282 50.5 3,015 118.8
Change
5 to 1 10 to 1
0.00
2.00
4.00
6.00
8.00
10.00
12.00
14.00
16.00
1 2 3 4 5 6 7 8 9 10
Equivalised income decile
Cou
ncil
tax
as %
of i
ncom
e
Current: full CTB
5 to 1: full CTB
10 to 1: full CTB
Current: no CTB
5 to 1: no CTB
10 to 1: no CTB

BACKGROUND TO SUPPORT CHAPTER 7 C
Lyons Inquiry into Local Government - Final Report 31
C.28 Pensioner couples would see the greatest increase in bills if new ratios were introduced. Those households typically living in more expensive homes (for example, those couples with children) would also see increased bills. Single parent families and single non-pensioners would, on average, face reduced bills.
C.29 Chart C2 shows the percentage of net household income paid as council tax by household type. Couple pensioners would be the only group to see the percentage of its net household income to be paid as council tax increase under the new ratios, despite higher average bills overall. This arises from the type of average used in the analysis, as discussed in Annex B.
C.30 Because most of the low-ncome households qualifying for CTB are concentrated in lower value properties, any reform that reduced the liability of those properties would also reduce the amount to be paid through CTB. Even allowing for the increased cost of CTB claims in the higher bands, this would reduce total CTB eligibility by approximately £240 million at a ratio of 5 to 1, and approximately £570 million at a ratio of 10 to 1.6
C.31 Because a wider range of band ratios than at present would mean that bills were more closely related to property values, council tax would also more clearly reflect the regional differences in average house prices at the time when houses were allocated to bands at 1991 prices. This would result in a shift in the tax burden away from the three northern regions and the West Midlands, towards London and the South East. Under the current system of grant equalisation, Formula Grant would therefore be reduced in London and the South East, where tax-raising capacity would have grown. Total Formula Grant would increase in the North East, North West and Yorkshire & the Humber, where tax bases would become smaller as lower-banded properties became
6 The statistical model used by the Inquiry is not adapted to forecast actual take-up levels after policy change. Broadly speaking however, if take-up of CTB entitlements remained at around 65-71 per cent (on an expenditure basis), cashable savings in council tax benefit after reform might be around the same percentage of the gross figure given above.
Chart C2: Council tax as a percentage of net household income, by household type, extra bands without revaluation option
Source: Lyons Inquiry analysis
CTB costs
Regional impact
0
1
2
3
4
5
6
Single non-pensioner Couple without
children
Couple with children One-parent families Single pensioners Pensioner couples Multiple tax units
with or without
children
Overall average
Cou
ncil
tax
as %
of i
ncom
e
Current ratios 5 to 1 ratios 10 to 1 ratios

C BACKGROUND TO SUPPORT CHAPTER 7
32 Lyons Inquiry into Local Government - Final Report
liable for less tax. Chart C.3 indicates the varying distribution of bands across regions on current valuations.
C.32 Wider band ratios would, by altering local authorities’ tax bases, also alter the distribution of grant assuming resource equalization continued as now. Those authorities with more high-banded properties than average would receive less grant (almost 40 per cent of all authorities), whereas those with more lower band properties would receive more grant.
C.33 However, under the 5 to 1 ratio option, the changes in grant allocations would be modest for most authorities. Under that option, 27 authorities would face a reduction of more than 10 per cent; generally those which receive only a low level of grant at present. Under the 10 to 1 option, many more authorities would see a significant reduction in Formula Grant, with 49 authorities facing a reduction of more than 20 per cent, including 30 in the South East, eight in East of England and seven in London.
C.34 The impact on tax bases would vary somewhat by authority class. For example, there are large increases in council tax yield in London, and large reductions in other metropolitan areas.
Chart C3: Proportion of dwellings in each council tax band by region at 1991 values
Source: Valuation Office Agency
0%
20%
40%
60%
80%
100%
North East North West Yorkshire and the
Humber
East Midlands West Midlands East London South East South West
Band A Band B Band C Band D Band E Band F Band G Band H

BACKGROUND TO SUPPORT CHAPTER 7 C
Lyons Inquiry into Local Government - Final Report 33
EXTRA BANDS WITHOUT REVALUATION
Summary of modelling work
C.35 As part of the original modelling, the Inquiry considered the option of adding new bands at the top and bottom of the existing council tax band structure alongside the revaluation of all domestic properties. This was felt to have a number of advantages, but the postponement of revaluation would make it difficult to implement that option in the immediate term. An alternative was therefore to assess the feasibility and attractiveness of adding new bands using the existing, 1991-based property valuations.
Main findings
C.36 About 2.5 million properties would move down to the new lowest band – 11.4 per cent of all households. For those properties, the average bill would be reduced from £846 to £711 per year. Approximately 150,000 households would move up a band (0.7 per cent of all households). This comprises 29,000 band H properties (those moving to bands H2, H3 or H4) and around 122,000 current band G properties (those moving to band G2). Around 800 properties would move into the new highest band, becoming liable for bills of around £6,400 per year.
Description of the methodology
C.37 Modelling work examined the effect of increasing the number of council tax bands based on their 1991 valuations (i.e. without carrying out council tax revaluation). More specifically, the existing bands A, G and H were split as shown in bold in Table C.7. This would effectively widen the current floor and ceiling on council tax liability, but maintain the current practice of assigning properties, including newly-built homes, according to their assumed value at the time of the last valuation exercise in 1993, based on values in 1991.
C.38 The band intervals were based on breakdowns of numbers of properties in bands in the current 1993 list (based on 1991 values) produced by the Valuation Office Agency (VOA). Details of these are given below, together with the rationale for the ratios used.

C BACKGROUND TO SUPPORT CHAPTER 7
34 Lyons Inquiry into Local Government - Final Report
Table C7: Existing council tax bands and extra bands without revaluation
Source: Lyons Inquiry analysis
C.39 Under this model, properties in bands B to F (71 per cent of all households) would be unaffected, because their current bandings are assumed to be correct to 1991 values and there are assumed to no change in their band ratios. The only properties to move bands would be those moving down from the current band A to band A1, and those moving around in the restructured bands G and H. Those properties which, if revalued to current prices, would move from bands B to F, down to Band A or up into the top bands, do not move in this model.
C.40 The intervals for the extra bands within bands A, G and H were chosen so as to be broadly consistent with those used for the extra bands revaluation option, as described in Annex A to the December 2005 Interim Report (although this modelling involved splitting Band H into four, rather than three, sub-bands, to include a top band for properties worth more than £1 million in 1991). The underlying aim was for the margins of the higher bands to be set so that there was a consistently reducing number of properties through the top bands, but with approximately equal numbers of properties in Bands A1 and A2.7 See Table C8 for more details.
C.41 The band ratios were also chosen to be broadly consistent with those used for the extra bands revaluation option. This led to a wider overall range of ratios than at present, with the ratio between the bottom end of the highest band (H4) and the top end of the lowest band (A1) being nine, compared with three under the current bandings.
C.42 For each local authority, a revised tax base was derived, taking account of the number of properties in each band and each band’s ratio. To ensure that the modelling quantified only the effects of introducing extra bands – rather than also reflecting differences between CLG and VOA figures for tax bases - the VOA national totals for
7 The aim of achieving tapering numbers of properties in the top and bottom bands was regarded as desirable in the interests of arriving at a coherent distribution of properties across bands.
Bands Existing range of 1991 values
Existing band ratios
Bands New range of 1991 values New band ratios
A1 Under £30,000 5/9
A2 £30,001 to £40,000 6/9
B £40,001 to £52,000 7/9 B £40,001 to £52,000 7/9
C £52,001 to £68,000 8/9 C £52,001 to £68,000 8/9
D £68,001 to £88,000 9/9 D £68,001 to £88,000 9/9
E £88,001 to £120,000 11/9 E £88,001 to £120,000 11/9
F £120,001 to £160,000 13/9 F £120,001 to £160,000 13/9
G1 £161,001 to £240,000 15/9
G2 £240,001 to £320,000 17/9
H1 £321,001 to £450,000 21/9
H2 £451,001 to £700,000 27/9
H3 £701,001 to £1,000,000 36/9
H4 Over £1,000,000 45/9
Existing bands Extra bands
H Over £320,000 18/9
A Under £40,000 6/9
G £160,001 to £320,000 15/9

BACKGROUND TO SUPPORT CHAPTER 7 C
Lyons Inquiry into Local Government - Final Report 35
bands A1 plus A2 were scaled down slightly so that they totalled the national total of band A dwellings as reported by authorities on CTB1 returns as at October 2005. Similar scaling was carried out for the sub-bands within bands G and H. These figures were then projected to give figures for the tax base for 2006-07, and then scaled in line with 2006-07 budget information to give a corresponding figure for the tax-setting tax base for each local authority.8 The revised tax bases were then used to recalculate Formula Grant figures for each local authority for 2006-07.
C.43 Average council tax bills were calculated for each local authority as described in Annex B.
Data sources
C.44 Because data on individual property values in 1991 were not directly available, they were derived by VOA at a billing authority level as follows:
a) Values of properties as at 1 April 2005 were taken from the VOA’s Automated Valuation Model (AVM), having been based on verified and validated sales data, using preparatory work which was undertaken as part of the now-postponed revaluation. These valuation estimates were all direct outputs from the AVM, without having been reviewed or adjusted.9
b) The distributions of banded properties from the current council tax list – i.e. banded values as at 1991 – were compared with the AVM value estimate profiles as at 2005, by VOA. The resulting information helped to identify where the numbers of properties that were in the tails of the distribution (i.e. the numbers of properties at the extreme low and high levels of value) had changed significantly between 1991 and 2005.
c) A ‘market movement ratio’ was derived for each billing authority by dividing the median value at 1 April 2005 (provided by data in (a) above)by the median value at 1 April 1991 (derived from the current council tax band distribution) to provide a proxy for average price change.
d) For properties in existing bands A, G or H, each billing authority’s market movement ratio was used to scale down property values as at 1 April 2005 to give an estimate of the number of properties in each new band as at 1 April 1991. For some billing authorities, this approach resulted in extreme values, which were then manually adjusted on a case-by-case basis to bring them more in line with figures for other authorities.
Assumptions
The market movement ratio calculated for each billing authority area accurately reflects changes in value between 1991 and 2005 for each property in the billing authority’s area, regardless of its band.
Total Formula Grant and council tax yield remain fixed nationally, but not at local authority level.
8 As reported on Budget Requirement returns to CLG for 2006-07.
9 Only properties with insufficient attribute data - and figures for the Isles of Scilly, which were thought to be skewed relative to those for elsewhere - were excluded from the modelling. As a result, the total number of properties included across England (22.051 million) was only slightly below the number reported by VOA as being on valuation lists as at 26 March 2006 (22.086 million).

C BACKGROUND TO SUPPORT CHAPTER 7
36 Lyons Inquiry into Local Government - Final Report
The redistribution of Formula Grant does not take account of floor damping, so that any effects can be properly attributed to the policy change.
Each local authority’s level of spending for 2006-07 – as measured by its budget requirement - is assumed to be fixed, regardless of changes to Formula Grant and changes resulting from the creation of the extra bands.
Each authority’s council tax yield is recalculated as the difference between its budget requirement and Formula Grant.10
Detailed findings
C.45 Table C8 shows how the numbers of properties in Bands A, G and H would be split across the new bands. It also shows the average bills for 2006-07 for each band.
Table C8: Bills by council tax band – existing bands and extra bands without revaluation
Source: CTB1 and BR returns to CLG; Valuation Office Agency, Lyons Inquiry
C.46 The resulting national total tax base for Formula Grant purposes was 0.8 per cent lower than that used in the 2006-07 Settlement. This was due mainly to a large reduction for band A, resulting primarily from band A1 being given a lower band ratio, of 5/9. This more than cancelled out the results of applying significantly higher band ratios than at present to the relatively few properties within band H.
C.47 Under the option modelled there would therefore need to be a small increase of 0.8 per cent in the national average band D council tax, to compensate for the 0.8 per cent reduction in the total council tax base.
C.48 Table C.9 shows that council tax as a percentage of net household income under extra bands, before taking account of CTB, would be more progressive in the lower
10 Also taking account of other relevant items, as discussed in Annex B.
Impact on household tax
bills
A1 2,506 711
A2 3,069 853
B 4,237 987 B 4,237 995
C 4,745 1,128 C 4,745 1,138
D 3,333 1,269 D 3,333 1,280
E 2,081 1,551 E 2,081 1,564
F 1,100 1,833 F 1,100 1,848
G1 663 2,133
G2 122 2,147
H1 94 2,986
H2 24 3,839
H3 4 5,119
H4 0.8 6,399
Total 21,979 1,268 Total 21,979 1,268
Existing bands New bands
G 785 2,115
Average area council tax for
2006-07 (£)
New bands
H 123 2,538
Number of properties (thousand)
A 5,575 846
Existing bands
Number of properties (thousand)
according to CTB1 returns
Average area council tax for
2006-07 (£)

BACKGROUND TO SUPPORT CHAPTER 7 C
Lyons Inquiry into Local Government - Final Report 37
bands The changes in levels of burden within bands A, G and H may be partly explained by the random allocation of households to new bands, discussed below, and partly to the smaller sample size for higher bands giving larger sample errors.11
Table C9: council tax as a percentage of net household income under extra bands without revaluation
C.49 A note of caution should be attached to the distributional analyses described below because, in reality, the allocation of properties to the new bands would differ from that shown. This is because, in order to split bands A, G and H, households were allocated to one of the new bands in proportion to the national total of properties in that band according to VOA data.12 This means that, particularly for bands A, G and H and their replacement bands, the relationship between household income and property value in reality is likely to be stronger than that between household income and the randomised band allocation used in the model.13
C.50 The lower income deciles would see the largest changes in average weekly council tax bill, with the changes taking the form of reductions. This is due largely to the structure of the changes in bands, with many benefiting from the creation of band A1. Council tax would become slightly more progressive to income, although the overall burden of council tax (before CTB) would remain regressive. Average net bills would be lower as a result of introducing extra bands.
11 IGOTM’s use of democratic averages may compound the low burdens in the higher bands because outliers that have lower burdens would skew the average downwards more than would be the case with plutocratic averages. See Annex B.
12 This was done by assigning a random number to each household that was in either Band A, G or H according to the FRS-based data, with the allocation to sub-bands within a billing authority area being constrained so that the spread across the bands equated to the VOA figures for that billing authority area. For example, for billing authority A, if VOA data showed that 60% of band A properties would be in A1, IGOTM ensured that 60% of band A households in that billing authority area were allocated to Band A1
13 A table showing the distribution of households across bands used in the IGOTM was broadly similar to the distribution of underlying VOA property data for 2005. The FRS dataset allocated very small numbers of households to Band H4, however, and so results for Band H4 are not displayed in the table. The same approach was taken in the modelling of extra bands after revaluation reported in the Interim Report
Bands
Current bands Extra bands Current bands Extra bands
A 2.9 .. 7.5 ..
A1 .. 2.5 .. 6.6
A2 .. 2.9 .. 7.2
G 6.4 .. 7.6 ..
G1 .. 6.6 .. 7.9
G2 .. 6.6 .. 7.4
H 6.5 .. 8.8 ..
H1 .. 7.4 .. 10.1
H2 .. 6.2 .. 10.3
H3 .. 8.4 .. 8.4
Council tax as % of net household income
Council tax as % of net household income if no CTB (%)
Full take up of CTB No take up of CTB
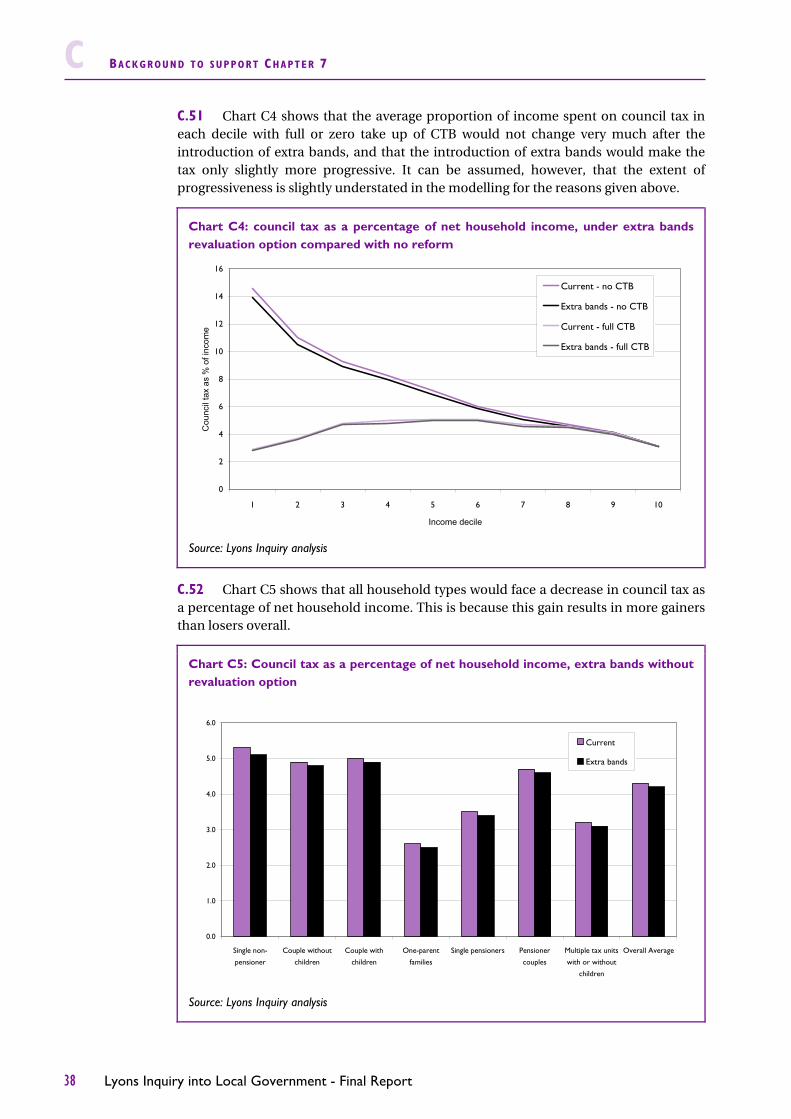
C BACKGROUND TO SUPPORT CHAPTER 7
38 Lyons Inquiry into Local Government - Final Report
C.51 Chart C4 shows that the average proportion of income spent on council tax in each decile with full or zero take up of CTB would not change very much after the introduction of extra bands, and that the introduction of extra bands would make the tax only slightly more progressive. It can be assumed, however, that the extent of progressiveness is slightly understated in the modelling for the reasons given above.
C.52 Chart C5 shows that all household types would face a decrease in council tax as a percentage of net household income. This is because this gain results in more gainers than losers overall.
Chart C4: council tax as a percentage of net household income, under extra bands revaluation option compared with no reform
Source: Lyons Inquiry analysis
Chart C5: Council tax as a percentage of net household income, extra bands without revaluation option
Source: Lyons Inquiry analysis
0
2
4
6
8
10
12
14
16
1 2 3 4 5 6 7 8 9 10
Income decile
Cou
ncil
tax
as %
of i
ncom
e
Current - no CTB
Extra bands - no CTB
Current - full CTB
Extra bands - full CTB
0.0
1.0
2.0
3.0
4.0
5.0
6.0
Single non-
pensioner
Couple without
children
Couple with
children
One-parent
families
Single pensioners Pensioner
couples
Multiple tax units
with or without
children
Overall Average
Current
Extra bands

BACKGROUND TO SUPPORT CHAPTER 7 C
Lyons Inquiry into Local Government - Final Report 39
CTB costs
C.53 Because most of the low-income households qualifying for CTB are concentrated in lower-value properties, any reform that reduced the liability of those properties would also reduce the costs of paying CTB to those households. Many of the properties moving down to the new bottom band would be entitled to full or partial council tax benefit, so reductions in their council tax liability would produce savings in the benefit bill. The option modelled above would be likely to reduce total CTB costs by around £110 million per year, assuming full take-up of entitlements.
Regional impact
C.54 The regional impact of adding new bands at top and bottom is mostly determined by the location of the large number of Band A properties. Since most of them are in the north, a new bottom band would reduce tax bases in many northern authorities, with Formula Grant then shifting towards the northern regions from London, the South East, East and South West.
C.55 To some extent, the regional pattern of tax base change is a mirror image of the shift in Formula Grant shown above, with large increases in tax base for London and the South East. Although there would, as stated above, be a small increase in band D council tax nationally, the pattern would vary regionally, depending largely upon the band mix in each region. For example, the decrease in the council tax yield needed for the North East – as a result of its increase in Formula Grant - is more than cancelled out by a large decrease (of about 5 per cent) in its tax base when the council tax yield is divided by tax base to give a band D figure. This results in a 3.5 per cent increase in average band D council tax. The large reduction in tax base in the North East is due mainly to large numbers of band A properties moving down to the A1 band. This shows that the impact on band D as a result of introducing extra bands could be rather unpredictable if not done in a constrained way, with widely varying changes at a regional level reflecting the widely varying impact of creating extra bands.
REMOVING OR RAISING THE CEILING ON BAND H PROPERTIES
Summary of modelling
C.56 The existing ceiling on band H bills is a feature of the system set in place in 1993, and could be altered through reform of the council tax band structure. Under the current system, the top band contains all properties worth at least £320,000 in 1991 (equivalent to approximately £900,000 in 2005 prices), right up to the most expensive property in the country at that time. Because of the way band ratios are set at present, the most valuable properties can only pay twice the tax paid by a band D home, and only three times as much as the least valuable home in band A, despite being at least eight times more valuable than band A homes at 1991 valuations.
C.57 The options modelled consider the impact of raising the effective ceiling on bills by:
adding new top bands, (in recognition of the fact that the existing top band is extremely wide capturing properties worth £320,000 in 1991, up to the most valuable); and

C BACKGROUND TO SUPPORT CHAPTER 7
40 Lyons Inquiry into Local Government - Final Report
removing the ceiling altogether by operating individual valuations for the most expensive properties, with bills charged at a fixed proportion of property values.
Main findings
C.58 Creating new bands at the top could deliver additional council tax revenue, depending on the band margins and the ratios applied. In the option modelled, extra revenues totalled around £75 million. However, band H properties are heavily concentrated in a small number of authority areas.
Creating extra bands in place of band H
C.59 Work was done to model the effect of replacing existing band H with four new bands. The results are summarised in Table C10. Creating the new bands with the margins and ratios shown in the table would raise about £75 million in additional council tax revenue.

BACKGROUND TO SUPPORT CHAPTER 7 C
Lyons Inquiry into Local Government - Final Report 41
Table C10: Impact of splitting band H into four bands
Applying a point value property tax to band H properties
C.60 The property value data provided by VOA as used for modelling a point value property tax (see separate section) indicates that the median value of a Band H property in England in 2005 was £842,000. If the mean value is assumed to be of a similar order of magnitude to the median, then the yield for 2006-07 from all 104,400 band H equivalent properties of £265 million would be raised by a national rate of 0.3 per cent of property value.14 Increasing the national rate by 0.1 of a percentage point, to 0.4 per cent of property value would raise almost a further £90 million.15 Table C11 shows the yields and average bills that would result from rates of 0.1 and 0.4 per cent as described above, and also 0.1 and 1.0 per cent.
14 That is, 0.30% of £842,000 multiplied by 104,400 equivalent properties would produce a yield of about £265 million. It is recognised that the mean and median values are in practice likely to differ significantly, but it has been assumed that the number of properties of very high value is small enough for the results of the calculations reported here to be of approximately the correct order of magnitude.
15 That is, 0.1% of £842,000 multiplied by 104,400 equivalent properties would produce a yield of about £88 million.
Ratioto Band D
Range(1991 prices)
Number of equivalent properties for the band
(after discounts &
exemptions) (a)
Averagearea CT for
the band
Total yield
£ £m
Existing band:
Band H 2 £320,000+ 104,404 2,538 265.0
New bands:
Band H1 2.33 £321,000 - £450,000 79,617 2,986 237.7
Band H2 3 £451,000 - £700,000 20,276 3,839 77.8
Band H3 4 £701,000 - £1,000,000 3,704 5,119 19.0
Band H4 5 Over £1,000,000 807 6,399 5.2
TOTAL 104,404 339.7
(a) This is the number of properties after taking account of discounts and exemptions but before applying the relevant
band ratio. For example, a property subject to a 50% discount would be counted as half a property.
(b) The total of 104,404 differs from the 123,000 quoted in Table C.8 because Table C.8 counts all properties once, whereas
properties subject to a discount or exemption are counted as less than a whole property in this table. See footnote (a).

C BACKGROUND TO SUPPORT CHAPTER 7
42 Lyons Inquiry into Local Government - Final Report
Table C11: Examples of bills a point value property tax for band H properties
Borderline between bands G and H
C.61 Those properties currently in band H are there by virtue of their value in 1991, and estimates suggest that at revaluation, one in five band H properties (some 25,000 properties) would be likely to move down to band G.16 A larger number of Band G properties (58,000, or 7.5 per cent of that band) would move up to the top band. Measures that target top-banded properties might therefore seek to distinguish between those at the border of band G, and those at the top of the value scale. This has not been done in this modelling.
Distribution of band H properties
C.62 Table C12 shows that the vast majority of the approximately 124,000 band H properties in England are concentrated in London and the South East.
16 The estimates quoted are from the National Update model, as discussed in the Interim Report.
National rate(% of property valueat 2005)
Yield from the 104,400 equivalent properties
for 2006-07 (£m)
Average billfor 2006-07 (£)
0.10% 88 842
0.30% 264 2,526
0.40% 352 3,368
1.00% 879 8,420

BACKGROUND TO SUPPORT CHAPTER 7 C
Lyons Inquiry into Local Government - Final Report 43
Table C12: Band H properties on valuation lists at 18 September 2006
C.63 Even within the South East, band H properties are concentrated in only a few local authorities. For example:
23 per cent of all band H dwellings in England are concentrated in either Kensington & Chelsea, or Westminster (each contain 11 per cent of all band H properties); and
Camden and Barnet between them contain around 6 per cent of all band H dwellings in England.
C.64 As a proportion of total local authority tax bases, band H properties are equally concentrated in a few areas:
band H properties in Kensington & Chelsea, and Westminster represent respectively 17 per cent and 12 per cent of the total number of dwellings in their area; and
these are followed by eight billing authorities where that proportion varies between 3 per cent and 7 per cent (South Bucks, Elmbridge, Chiltern, Camden, Three Rivers, Waverley, Richmond-upon-Thames and Tandridge); and
band H properties represent less than 3 per cent of all dwellings in each of the other 344 billing authority areas.
Band H (1991 values over £320,000)
% of national total of Band H properties
Band H as % of total
properties in England
England 124,033 100.0 0.6
London 55,546 44.8 1.7
South East 31,742 25.6 0.9
East 11,444 9.2 0.5
South West 6,914 5.6 0.3
North West 6,020 4.9 0.2
West Midlands 5,172 4.2 0.2
Yorkshire and the Humber 3,062 2.5 0.1
East Midlands 2,908 2.3 0.2
North East 1,225 1.0 0.1
Source: Valuation Office Agency
C BACKGROUND TO SUPPORT CHAPTER 7
44 Lyons Inquiry into Local Government - Final Report
A POINT VALUE PROPERTY TAX
Summary of modelling work
C.65 Modelling was done to examine the effects of introducing a point value property tax to replace council tax. It involved sing a fixed national rate, expressed as a percentage of each domestic property’s capital value, to generate an amount of tax equivalent to the national council tax yield (approximately £22 billion in 2006-07).
Main findings
C.66 A point value property tax would achieve a perfect relationship between tax liability and property value if a universal multiplier (tax rate) were used. To achieve the same yield as produced by council tax now, the multiplier would need to be set at 0.64 pence per pound of property value.
C.67 A point value tax would also produce a closer relationship between tax and income than current council tax bands, though it would still be regressive to income overall, before council tax benefit. Savings in the CTB bill as a result of a point value tax could be significant.
C.68 More households would gain than would lose from the move to a point value tax, but some of those paying more would face significant increases in bills.
C.69 The regional impact of a point value tax would shows the same pattern as national revaluation (with the tax burden shifting from the north to the south and London) but, without constraints of council tax bands, the impact is even greater; and
Data sources
C.70 Property value data were provided by VOA. This included the median value as at 1 April 2005 for domestic properties in each band in each billing authority area.17 Counts of properties in each band as recorded on valuation lists as at September 2005 were used to derive the total value of properties to calculate the national rate, or local rates, as appropriate. Data from returns to CLG and household data based on the Family Resources Survey were also used, as described in Annex B.
Assumptions
Tax is based on estimated property values at 1 April 2005.
Total formula grant and local tax yield remain unchanged.18
Bills are calculated as tax rate multiplied by value of property, less any discounts or exemptions.19
17 Mean values were also used for some of the earlier work on the redistribution of Formula Grant and effects at a household level. These were consistent with a national rate of 0.62% of property value rather than the 0.64% quoted above. However median values were held to be a better indicator of the likely tax rate required, since a few high value properties might skew mean values in the top band and so overestimate the yield likely from that band, depressing the multiplier. This does not affect the validity of the distributional analysis at local authority and household level, which is based on the earlier multiplier of 0.62%.
18 It was assumed for some of the modelling work that Formula Grant levels remained fixed at local authority level, but was assumed for other modelling work that it would be redistributed to take account of property values.
19 This includes all existing discounts and exemptions. If a point value property tax were to be regarded as a full property tax, a case could be made for considering whether they should all continue to be granted.

BACKGROUND TO SUPPORT CHAPTER 7 C
Lyons Inquiry into Local Government - Final Report 45
There is no ceiling on the maximum tax liability.
Households are still eligible for CTB, as now.
Equalisation for relative resources – and hence recalculation of Formula Grant – is needed.
A single rate per pound value of property is payable for all non-exempt properties in billing authorities, equal to the national 2006-07 council tax yield divided by the national total property value.
Description of the methodology
C.71 The fixed national rate was calculated by holding the national total 2006-07 council tax yield constant across England, and dividing it by the total value of equivalent dwellings across England.20 This was calculated by summing, for each council tax band, the product of the national median value for the band and the number of equivalent dwellings, taking account of information on discounts and exemptions reported on CTB1 returns.
C.72 The average bill for a property in a particular band was calculated by multiplying the average property value for the band by the national rate. These figures were then used in conjunction with data based on the Family Resources Survey to model the impact on households of introducing a point value property tax.
More detailed findings
C.73 Examples of 2006-07 point value annual tax bills based on a fixed national rate of 0.64 per cent of a property’s value are given in Table C13. Tax liabilities would begin to exceed current band H council tax liability at around £400,000 in capital value.
Table C13: Examples of bills under a point value property tax
2005 property value Annual tax bill based on a national rate of 0.64%
£100,000 £640
£170,000 £1,088 (approximately the average council tax bill per property for 2006-07 of £1,056)
£250,000 £1,600
£400,000 £2,560 (approximately the average Band H council tax bill for 2006-07 of £2,536)
£1,000,000 £6,400
C.74 The point value tax modelled has the effect of reducing bills for low value properties and increases them for high value properties. For a fixed national rate, the extent of change varies widely across bands, as shown in Table C14.
20 The model assumes that all discounts and exemptions applied to council tax would continue to apply to a point value property tax. The number of equivalent dwellings is therefore number of domestic properties that are liable to council tax, taking account of discounts. For example, a property with a 25% discount is counted as ¾ of an equivalent dwelling.

C BACKGROUND TO SUPPORT CHAPTER 7
46 Lyons Inquiry into Local Government - Final Report
Table C14: Average bills under a point value property tax, by existing council tax band
C.75 The impact on bills varies widely across bands because the constraints of the
existing council tax band ratios are removed. Within the current bands the most that bills can vary is by a ratio of 3 to1 – the differential between bills in the top and bottom bands. Under a point value tax, bills could vary as widely as property values do. Average values in band H are ten times average values in band A, so it is clear that moving from the current bands to a point value tax would remove a major constraint on bills at the moment.
C.76 More properties would gain than lose from a move to a point value property tax. As a consequence, those households who pay more would generally see a bigger difference in bills than those who pay less, in order for the total tax yield to remain the same.
C.77 Part of the change between bills under a point value tax and those under the current system can be attributed to revaluation from 1991 to 2005 values, rather than to the point value tax property itself. This is illustrated in Table C15 below.
C.78 Most households would pay less under point value property tax than under council tax, with almost six in ten households paying at least £52 per year (or £1 per week) less than now. Around 40 per cent would pay at least £3 per week less than now. More than a quarter of all households would, however, pay at least £1 per week more than now, and around 18 per cent would pay more than £3 more than now.21
21 The figures quoted are broad estimates, based on the assumption that all the properties in a particular band in a particular local authority area would face the same change in weekly bill as a property of the average value for that particular band and local authority. They do not take account of actual variations in council tax bills between local authority areas.
Actual average bill for 2006-07
New average bill Change in bill % change in bill
£ £ £ per week
Band A 850 560 -5.59 -34.2
Band B 987 825 -3.11 -16.4
Band C 1,126 1,065 -1.17 -5.4
Band D 1,272 1,366 1.81 7.4
Band E 1,551 1,718 3.20 10.7
Band F 1,827 2,202 7.22 20.6
Band G 2,089 3,078 19.02 47.4
Band H 2,355 5,702 64.37 142.2

BACKGROUND TO SUPPORT CHAPTER 7 C
Lyons Inquiry into Local Government - Final Report 47
Household impacts
C.79 Chart C6 shows that a point value property tax would reduce the proportion of income spent on council tax in the lowest income groups by around 15 per cent and would increase the proportion of income spent on council tax in the top income group by around 20 per cent. A point value tax would be significantly more progressive to income than council tax, though still regressive overall. 22
C.80 Under the current system, council tax bills are also broadly regressive to property value. In particular, most properties are in bands A to C, for which a higher percentage of property value is currently paid than in the higher bands. Under a point value property tax the effective rate of tax would be the same for all properties.
C.81 Chart C7 shows that all household types would pay less than at present on average – except for pensioner couple households when full take-up of CTB is modelled. This is consistent with the fact that more households would gain than lose overall from a point value tax.
22 They are all based on an early data set, based on mean property values in each local authority area, rather than median figures which were used for the higher-level analyses.
Chart C6: Point value property tax as a proportion of household income, before CTB
-
2
4
6
8
10
12
14
16
Lowest 2 3 4 5 6 7 8 9 HighestEquivalised Income Decile
Cou
ncil
tax
as a
% o
f inc
om
Point value property tax: no CTB
Council tax: no CTB
Point value property tax : Full CTB
Council tax: Full CTB

C BACKGROUND TO SUPPORT CHAPTER 7
48 Lyons Inquiry into Local Government - Final Report
Regional impact
C.82 It is known that revaluation from 1991 to more recent prices, retaining a band system, would result in the tax burden shifting broadly from the north to the South East. This is because property values in the South East have, on average, increased more since 1991 than those in the north. Moving to a point value property tax would lead to a similar shift in the local tax burden. Table C15 shows the effect of moving to point values (with a fixed national rate) to be separately identified by comparing results with 2006-07 if the national update revaluation had taken place.
Chart C7: Local tax as a percentage of household income, by household type
0.0
2.0
4.0
6.0
8.0
10.0
12.0
Single non-
pensioner
Couple without
children
Couple with
children
One-parent families Single pensioners Pensioner couples Multiple tax units
with or without
children
Cou
ncil
tax
as %
of i
ncom
e
Point value tax - no CTB
Council tax - no CTB
Point value tax - full CTB
Council tax - full CTB

BACKGROUND TO SUPPORT CHAPTER 7 C
Lyons Inquiry into Local Government - Final Report 49
Table C15: Regional changes in local tax yield under a point value property tax
C.83 Whilst the same overall yield would be raised from a point value tax as from council tax, tax bases that more closely reflected property values would mean the regional distribution of the tax burden would change, with a smaller proportion of all tax being raised in the North West, North East, Yorkshire & the Humber and the East Midlands, and a greater proportion raised in London and the South East, where capital values are highest.23
Impact on local authorities
C.84 The impact of a banded system is that differences in property values are not fully reflected in tax bills, which are compressed towards the band D average. This means that banding also flattens the differences in tax base between authorities. A point value tax would reflect the true value of properties in each authority area, so that tax bases would be much more variable than now. Assuming that the Formula Grant system continued to adjust for differences in tax-raising potential between authorities, the equalisation system would have to play a much greater role to accommodate a point value tax than the current banded model.
C.85 In principle, the distribution of Formula Grant should take account of each authority’s point value tax base. In practice, the Inquiry Team modelled this by applying a notional single tax rate to every authority. Formula Grant has been redistributed by taking total property values into account in the resource equalisation block and assuming a fixed national rate. As usual, the figures are before floor damping.
C.86 Redistributing Formula Grant would result in a significant shift in Formula Grant from London and the South East towards the northern regions, with around three
23 The regional picture would be likely to vary over time, because regional growth rates differ and the gap between London and the South East and the other regions tends to fluctuate. With regular revaluations a point value tax would reflect those fluctuations.
Comparison of yields for 2006-07
Actualcouncil tax yield
2006-07
£ billion £ billion % change £ billion % change £ billionover actual
yieldover actual
yield
East of England 2.633 2.606 -1.0 2.611 -0.8 0.004 0.2
East Midlands 1.802 1.870 3.8 1.534 -14.9 -0.336 -18.6
London 3.505 3.616 3.2 4.630 32.1 1.014 28.9
North East 1.028 1.047 1.8 0.792 -23.0 -0.255 -24.8
North West 2.834 2.816 -0.6 2.329 -17.8 -0.488 -17.2
South East 4.083 4.162 1.9 4.503 10.3 0.340 8.3
South West 2.421 2.338 -3.4 2.438 0.7 0.100 4.1
West Midlands 2.179 2.070 -5.0 1.955 -10.3 -0.115 -5.3
Yorkshire &
the Humber 1.968 1.928 -2.0 1.663 -15.5 -0.265 -13.5
England (a) 22.453 22.453 0.0 22.453 0.0 0.000 0.0
% point difference in
changes
(a) The national totals have been scaled as necessary to equal the precise total for 2006-07. Some of the underlying modelling was based on
different totals.
National update revaluation
2006-07
Point valueestimates2006-07
Difference(Point value - national update revaluation)

C BACKGROUND TO SUPPORT CHAPTER 7
50 Lyons Inquiry into Local Government - Final Report
quarters of all authorities seeing a change of more than 5 per cent upwards or downwards.24 The changes in Formula Grant represent a mirror image of the regional pattern of changes in tax yield, as discussed above. This is as might be expected, given that the system ensures that higher amounts of grant are given to areas with lower capacity to raise its own tax and vice versa.
C.87 Seven authorities would theoretically be in receipt of ‘negative grant’ before floor damping.25 That is, their tax yield, at a rate of 0.64 per cent of property value on all residential properties in the area, would be greater than their total budget requirement. In practice, the government would have to either take powers to reclaim some of the extra revenue for redistribution to other authorities, or provide extra Formula Grant if it were to ensure that no local authority received less funding overall than currently.
CTB costs
C.88 Because most of the low-income households that qualify for CTB are concentrated in lower value properties, any reform that reduced the liability of those properties would also reduce the amount of tax that must be paid for through CTB. A point value property tax would do more than any of the other council tax reform options modelled to reduce the tax burden on those households, and so would also produce the greatest savings in the benefit bill. Estimates suggest that a point value property tax would reduce the number households eligible for CTB by up to 700,000, and reduce the cost of CTB by up to £1 billion, assuming full take-up.26
A LOCALLY-VARIABLE POINT VALUE PROPERTY TAX
Summary of modelling work
C.89 Modelling was done to examine the effects of each billing authority setting its own point value tax rate, assumed to be the level at which a point value tax would raise the same amount yielded by council tax in the authority area in 2006-07.
Main findings
C.90 Locally-set rates would introduce an element of local discretion that would not be present in a point value tax with a single fixed multiplier. However this would mean that the effective rate of tax on property would vary between different authority areas (as is already to some extent the case under council tax).
Assumptions
The locally-set rate option assumes that each billing authority sets its own rate per pound value of property for its area, payable by all non-exempt properties. This equals the 2006-07 council tax yield for its area divided by the total property value in its area.
24 This modelling was based on mean property values from an earlier dataset.
25 This would occur when an authority’s relative resource block, calculated under the four-block model, exceeded the sum of the relative needs and central allocation blocks. The council tax yield that would need adding to the Formula Grant figure so that they summed to the authority’s budget requirement would therefore need to be bigger than the budget requirement itself.
26 The estimates of CTB costs were based on earlier data, using mean, rather than median, property values. Any figures derived from the later data are unlikely to be very different, however, particularly given that the biggest data changes were for higher bands, where CTB eligibility is relatively low.

BACKGROUND TO SUPPORT CHAPTER 7 C
Lyons Inquiry into Local Government - Final Report 51
The locally-set rate includes tax required by county councils, the Greater London Authority, police and fire authorities, as well as billing authorities.27
Each authority’s level of spending on services for 2006-07 – as measured by its budget requirement – is fixed, regardless of changes to Formula Grant.
Each authority’s council tax yield is recalculated as the difference between its budget requirement and Formula Grant.28
Description of methodology
C.91 Locally-set rates were calculated by holding the 2006-07 area council tax yield constant in each billing authority area and dividing it by the total value of equivalent dwellings within the billing authority’s area. The area council tax yield includes tax raised for county councils, GLA, police and fire authorities (i.e. major precepting authorities), as well as the billing authority. In practice, the rate-setting process may need to involve the major preceptors as well as the billing authority, and a method would need to be established for allocating amounts of tax between the tiers.
27 The modelling examined total bills for an area and so did not involve sharing amounts between tiers, although that would need to be done in practice.
28 Taking account of other relevant items, as described in Annex B.

C BACKGROUND TO SUPPORT CHAPTER 7
52 Lyons Inquiry into Local Government - Final Report
Detailed findings
C.92 If a point value tax were introduced to raise the same amount of money locally as council tax, the necessary rate of tax would vary to reflect authorities’ different property tax bases. In that case the necessary multiplier would range from 0.22 per cent to 1.17 per cent at the extremes. In practice, it would be reasonable to assume that the grant system would equalise for the new property tax base rather than the old council tax base. The resulting changes in bills, compared with under council tax based on 1991 bandings, are smaller for a locally-set rate than for a fixed national rate, as shown in Tables C14 and C16.
Table C16: Average bills under a locally-set point value property tax
Source: Lyons Inquiry analysis
Actual average bill for 2006-07
New average bill
Change in bill % change in bill
£ £ £ per week
Band A 850 673 -3.40 -20.8
Band B 987 892 -1.83 -9.6
Band C 1,126 1,086 -0.77 -3.6
Band D 1,272 1,333 1.17 4.8
Band E 1,551 1,641 1.73 5.8
Band F 1,827 2,045 4.19 11.9
Band G 2,089 2,691 11.58 28.8
Band H 2,355 4,097 33.50 74.0
Note: without recalculation for Formula Grant

BACKGROUND TO SUPPORT CHAPTER 7 C
Lyons Inquiry into Local Government - Final Report 53
OPTIONS FOR REFORM OF COUNCIL TAX BENEFIT
Summary of modelling
C.93 The Inquiry examined a range of options for changing the eligibility criteria for council tax benefit (CTB), with a view to establishing the costs and likely impact of such measures. In particular, modelling focused on:
changes to the savings thresholds for CTB eligibility, or ‘capital limits’;
changes to the income thresholds, or ‘applicable amounts’; and
other options for providing rebates on council tax, including an income-related rebate as a supplement to CTB, and CTB for households not paying income tax.
C.94 The Inquiry also examined options for reform of CTB delivery as a means of improving take-up. These are not covered here, since no separate modelling was required for that analysis, which is covered fully in Chapter 7.
Description of the methodology
C.95 The Inquiry team conducted analysis using the Inter-Governmental Tax Benefit Model (IGOTM) and the Department for Work and Pensions (DWP) Policy Simulation Model (PSM). Both are static micro-simulation models of the UK tax and income related benefit system and can be used to estimate the impact of changes on different types of household and on the overall government budget.
C.96 Both simulation models use Family Resources Survey (FRS) data and calculate household or benefit unit liability for taxes and entitlement to benefits. Although similar the models are not identical and each has particular strengths for different areas of the tax and benefit system.
C.97 PSM was used to produce the costings presented on options for changing applicable amounts and capital limits, in order to achieve more fine-grained analysis of the likely costs of change. Figures on households gaining by these measures were also generated in PSM. Due to sampling errors, the total caseloads reported are subject to some statistical uncertainty and do not match exactly the published CTB statistics.
C.98 Other analysis, including charts showing council tax as a proportion of income before and after benefit, and the assessment of a ‘circuit-breaker’ rebate, was done using IGOTM, which looks across the tax and benefit system.
Assumptions
The PSM models the current policy year (2006-07) using the latest FRS data (2004-05), by up-rating the FRS to represent the appropriate policy year.
Policy changes would apply on a Great-Britain basis, and are costed to include Scotland and Wales. This reflects that council tax benefit operates on a GB-wide basis and is not devolved.
The analysis assumes full take-up of income related benefits in the current policy year (2006-07) (except where otherwise specified).

C BACKGROUND TO SUPPORT CHAPTER 7
54 Lyons Inquiry into Local Government - Final Report
All who face an increase in their CTB (as opposed to those who become newly eligible) are already recipients of Second Adult Rebate (an alternative to CTB). This is assumed to be uprated to full CTB.
Some of the rules for income-related benefit receipt are linked to the female state pension age. For the purposes of this work pensioner benefit units are defined as households with any adult over 60, while working age benefit units are households with all adults under 60.29
Capital limits in CTB
The Inquiry considered the following options:
Increasing the upper capital limit in CTB (and Housing Benefit) to £50,000 for pensioners;
Increasing the upper capital limit in CTB to £50,000 and the lower capital limit to £10,000 in CTB (and HB) for pensioners;
Abolishing the upper capital limit in CTB (and HB) for pensioners; and
Increasing the upper capital limit in CTB (and HB) to £50,000 for working age households.
The costs of each options were assessed at both full take-up (the total value of the new CTB eligibility that would be created if these measures were adopted), and at current levels of take-up (as an indication of likely real costs to government). Housing Benefit (HB) and CTB are currently closely linked and administered through local authorities. The costs of applying the same measures in HB are shown for completeness.
29 They may actually be working or not be receiving other benefits as ‘pensioners’. This definition is used because housing benefit and council tax benefit are more generous for this group.

BACKGROUND TO SUPPORT CHAPTER 7 C
Lyons Inquiry into Local Government - Final Report 55
Table C17: Costs of changing capital limits in CTB and HB
Cost of policy change
Full take-up (£ million)
Cost of policy change
Current take-up (£ million)
Option CTB HB CTB HB
1. Upper capital limit £50k for pensioners
195 100 60 50
2. Upper capital limit £50k and lower capital limit £10k for pensioners
260 130 80 65
3. Abolish upper capital limit for pensioners
220 105 65 55
4. Upper capital limit £50k for working age households
20 15 10 5
Table C18: Impact on households of changing capital limits in CTB and HB
Full take-up Number of households likely to benefit
Average weekly gain
(CTB only)
Option CTB HB Already entitled to some CTB
Newly-entitled after
reform
1. Upper capital limit £50k for pensioners
370,000 50,000 n/a £10.10
2. Upper capital limit £50k and lower capital limit £10k for pensioners
1,040,000 350,000 £1.20 £10.00
3. Abolish upper capital limit for pensioners
420,000 54,000 n/a £10.00
4. Upper capital limit £50k for working age households
35,000 9,000 n/a £12.20
C.99 Raising the upper savings limit to £50,000 has the potential to benefit large numbers of pensioner households, benefiting 370,000 pensioner households who are currently ineligible for CTB. Abolishing the upper limit brings a further 50,000 households into CTB eligibility. In both scenarios, the average gain per household would be approximately £10 per week.
C.100 Most of those gaining by an increase in the upper capital limits would be in the lowest income deciles. Increasing the upper limit to £50,000 would bring 370,000

C BACKGROUND TO SUPPORT CHAPTER 7
56 Lyons Inquiry into Local Government - Final Report
pensioner households into CTB eligibility, of which 135,000 are in the bottom income decile.
C.101 Raising the lower capital limit as well as the upper limit benefits around three times as many households. However the average benefit gained by these additional households is small at just £1.20 per week.
C.102 Altering capital limits for working age households affects only a small number of households, as pensioner households hold most savings. These figures should be treated as indicative only, since the sample sizes involved are not large enough to provide precise estimates.
Chart C8: Pensioner households gaining by an increase in the upper capital limit in CTB and HB to £50,000
Source: Lyons Inquiry
0
20
40
60
80
100
120
140
160
Lowest 2 3 4 5 6 7 8 9 Highest
Num
ber
of p
ensi
oner
hou
seho
lds
gain
ing
('000
s)
0
5
10
15
20
25
30
% o
f all
pens
ione
r ho
useh
olds
in
inco
me
deci
le t
hat
gain
Equivalised income decile
Gainers (CTB) Gainers (HB) % of income decile (CTB)

BACKGROUND TO SUPPORT CHAPTER 7 C
Lyons Inquiry into Local Government - Final Report 57
Income thresholds in CTB
C.103 The Inquiry considered the following options for both CTB and HB eligibility:
increasing applicable amounts by 5 per cent for working age households;
increasing applicable amounts by 10 per cent for working age households;
increasing applicable amounts by 5 per cent for pensioner households; and
increasing applicable amounts by 10 per cent for pensioner households.
Table C19: Costs of changing applicable amounts in CTB and HB
Cost of policy change
Full take-up (£ million)
Cost of policy change
Current take-up (£ million)
Option CTB HB CTB HB
5. 5% increase for working age 60 180 35 100
6. 10% increase for working age 125 360 70 195
7. 5% increase for pensioners 180 160 55 80
8. 10% increase for pensioners 340 285 100 140
Chart C9: Council tax as a percentage of income for pensioner households, before and after reform of upper capital limits in CTB
Source: Lyons Inquiry analysis
0
1
2
3
4
5
6
Lowest 2nd 3rd 4th 5th 6th 7th 8th 9th Highest
Equivalised income decile
Cou
ncil
tax
as a
% o
f inc
ome
No reform, full take-up of CTB Upper capital limit £50k, full CTB
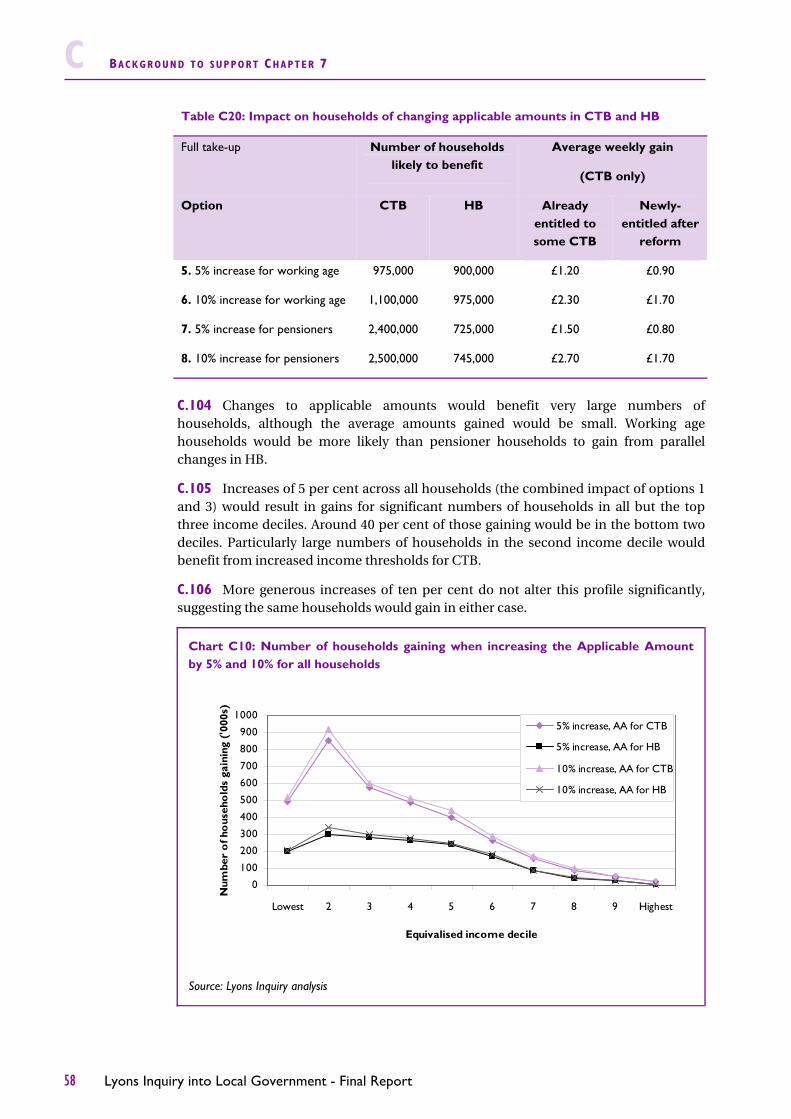
C BACKGROUND TO SUPPORT CHAPTER 7
58 Lyons Inquiry into Local Government - Final Report
Table C20: Impact on households of changing applicable amounts in CTB and HB
Full take-up Number of households likely to benefit
Average weekly gain
(CTB only)
Option CTB HB Already entitled to some CTB
Newly-entitled after
reform
5. 5% increase for working age 975,000 900,000 £1.20 £0.90
6. 10% increase for working age 1,100,000 975,000 £2.30 £1.70
7. 5% increase for pensioners 2,400,000 725,000 £1.50 £0.80
8. 10% increase for pensioners 2,500,000 745,000 £2.70 £1.70
C.104 Changes to applicable amounts would benefit very large numbers of households, although the average amounts gained would be small. Working age households would be more likely than pensioner households to gain from parallel changes in HB.
C.105 Increases of 5 per cent across all households (the combined impact of options 1 and 3) would result in gains for significant numbers of households in all but the top three income deciles. Around 40 per cent of those gaining would be in the bottom two deciles. Particularly large numbers of households in the second income decile would benefit from increased income thresholds for CTB.
C.106 More generous increases of ten per cent do not alter this profile significantly, suggesting the same households would gain in either case.
Chart C10: Number of households gaining when increasing the Applicable Amount by 5% and 10% for all households
Source: Lyons Inquiry analysis
0
100
200
300
400
500
600
700
800
900
1000
Lowest 2 3 4 5 6 7 8 9 Highest
Equivalised income decile
Num
ber
of h
ous
eho
lds
gain
ing
('00
0s)
5% increase, AA for CTB
5% increase, AA for HB
10% increase, AA for CTB
10% increase, AA for HB
BACKGROUND TO SUPPORT CHAPTER 7 C
Lyons Inquiry into Local Government - Final Report 59
C.107 The options modelled suggest that while changes to the income thresholds would affect large numbers of households, targeting the savings thresholds would provide more substantial benefits to those households gaining, and could be particularly important for pensioner households, including many of the poorest pensioners.
INTRODUCTION OF AN EXEMPTION FOR NON-IT PAYERS
Summary
C.108 Some commentators, including the New Policy Institute and the Local Government Information Unit, have asked whether it is right, in principle, that households whose incomes are below the threshold at which income tax is paid, should nonetheless pay council tax. While in principle property taxes and income taxes might reasonably begin at different levels, the Inquiry has examined the cost of making full CTB available to all households who pay no income tax. This option achieves that end by providing a full council tax exemption for any household in which no individual pays income tax.
Main findings
C.109 Approximately 5.2 million households would be exempt from council tax under this option. An estimated 3.7 million of these households are already eligible for CTB and so pay no council tax already (although in practice, some will not have taken up their CTB entitlement so still pay council tax). Another 1.2 million households would receive partial CTB and 346,000 households would receive no CTB. Hence, this option will increase net income for about 1.6 million households.
C.110 The total cost of introducing an exemption of this kind would be approximately £700 million. As such it was judged unlikely to be affordable in the short term, though it has some advantages as an option for targeting support towards low-income households.

C BACKGROUND TO SUPPORT CHAPTER 7
60 Lyons Inquiry into Local Government - Final Report
C.111 Approximately 35 per cent of those who gain are in the second income decile, because although the lowest decile households are more likely to be exempt from income tax they are also more likely to already receive some full or partial CTB. Just over half of those who would gain are pensioners.
Chart C11: Number of gainers and percentage of total households gaining, by income decile
Source: Lyons Inquiry
Chart C12: Number of households gaining, by household type
Source: Lyons Inquiry
-
100
200
300
400
500
600
700
Couples
with
children
Couples
without
children
One-parent
families
Single non-
pensioners
Single
pensioners
Multiple tax
units with
or without
children
Pensioner
couples
Num
ber
of h
ous
eho
lds
gain
ing
(000
's)
0
100
200
300
400
500
600
700
Lowest 2 3 4 5 6 7 8 9 Highest
Equivalised income decile
Num
ber
of h
ouse
hold
s
gain
ing
(000
's)
0
10
20
30
40
50
% o
f all
hous
ehol
ds in
inco
me
deci
le w
ho g
ain
Number of gainers % of gainers in income decile

BACKGROUND TO SUPPORT CHAPTER 7 C
Lyons Inquiry into Local Government - Final Report 61
CTB: INTRODUCING A ‘CIRCUIT BREAKER’ REBATE
Summary of modelling work
C.112 Modelling was undertaken to examine the costs and impact of ensuring that no household paid more than a certain percentage of its net income before housing costs on council tax. Three particular ‘circuit breaker’ options were considered, with thresholds at 8 per cent, 10 per cent and 12 per cent of household income. The household would receive a rebate to cap its net council tax bill at the chosen level of circuit breaker.
Main findings
C.113 The more generous circuit breakers would be more costly, with much of the cost of a generous circuit breaker being spent on rebates to middle income households. The estimated costs are:
£240 million for an 8 per cent circuit breaker;
£95 million for a 10 per cent circuit breaker; and
£50 million for a 12 per cent circuit breaker.
Data sources C.114 The modelling used figures for actual 2006-07 council tax levels, as reported on BR returns, and data on households, based on the Family Resources Survey.
Assumptions
The 2006-07 council tax levels for each local authority area were as actually set, reflecting the distribution of Formula Grant after floor damping.
There is a 100 per cent take-up of CTB. It is assumed that people could apply for a ‘circuit breaker’ rebate only after applying for any CTB to which they are entitled.
Eligibility is assessed against gross household income. 30
CTB costs
C.115 Although the total cost of a circuit breaker has been estimated on the assumption that there is full take-up of CTB, the cost of a circuit breaker would in practice be closely linked to the level of circuit breaker take-up and its effect on CTB take-up, which is currently low, at between 65-71 per cent on an expenditure basis. Although it is possible that a circuit breaker may, in reality, encourage more households to claim CTB, it is very difficult to estimate the effect that a circuit breaker would have on take-up.
C.116 The two extreme cases would be i) if more households claimed the circuit breaker than currently claim conventional CTB; or ii) it might have no effect on take-up rates, and so only those currently receiving CTB would be affected. Given that the
30 While most other analysis in this annex looks at net household income after housing costs, this option assumes that any rebate would need to apply before housing costs, since verifying these as part of the claims process, would add a further degree of complexity which might make such a rebate difficult to implement, and could create some perverse incentives at the margins.

C BACKGROUND TO SUPPORT CHAPTER 7
62 Lyons Inquiry into Local Government - Final Report
modelling work has assumed 100 per cent take-up of benefit of those currently eligible, the cost estimate for the first case above would be likely to be an underestimate of total Exchequer costs because it does not take account of additional conventional claimants. In the second case, the estimate would be overstated. The results presented are based on full take-up of CTB and therefore provide an estimate of the maximum costs of the circuit breaker.
Impact on households by income decile
Table C21: Impact of a circuit-breaker rebate, by income decile
Source: Lyons Inquiry
C.117 Table C21 shows that a circuit breaker could be particularly effective in assisting those low-income households for whom a large percentage of income is absorbed by council tax.
C.118 The 12 per cent circuit breaker would almost exclusively affect the lowest income decile. At the other end of the range, and for a much higher cost to government, the 8 per cent circuit breaker would benefit some middle-income earners without bringing proportional further benefits at the lower end of the scale.
C.119 Households in the lower income deciles would receive, on average, £7 to £8 per week in rebate payments under all three options. As well as paying benefit to more households at the higher income levels, the more generous circuit breakers would pay a higher rebate to all recipients – albeit only slightly higher amounts at the lower income bands.
No circuit breaker
Decile
Council tax as % of net
income
Council tax as % of net
income
Number of households
assisted
Average rebate Council tax
as % of net income
Number of households
assisted
Average rebate Council tax
as % of net income
Number of households
assisted
Average rebate
thousand £ per week thousand £ per week thousand £ per week
Lowest 3.0 2.5 107 7.15 2.3 161 7.21 2.1 224 7.90
2 3.7 3.6 32 3.89 3.6 87 4.00 3.4 190 4.91
3 4.8 4.8 15 3.43 4.8 50 3.88 4.6 152 4.29
4 4.9 4.9 7 2.54 4.9 32 3.45 4.8 130 3.75
5 5.0 5.0 2 1.66 5.0 16 2.33 4.9 102 3.32
6 5.0 5.0 0 0.00 5.0 9 2.50 5.0 72 3.22
7 4.6 4.6 0 0.00 4.6 3 2.77 4.6 26 3.86
8 4.5 4.5 0 0.00 4.5 0 0.00 4.5 10 1.73
9 4.0 4.0 0 0.00 4.0 0 0.00 4.0 0 2.19
Highest 3.0 3.0 0 0.00 3.0 0 0.00 3.0 0 0.00
Overall 4.3 4.2 163 5.90 4.2 358 5.25 4.1 907 5.00
12% circuit breaker 10% circuit breaker 8% circuit breaker

BACKGROUND TO SUPPORT CHAPTER 7 C
Lyons Inquiry into Local Government - Final Report 63
Impact on households by household type
Table C22: Impact of a circuit-breaker rebate, by household type
Source: Lyons Inquiry
C.120 Table C22 shows that pensioner households – and particularly pensioners living alone - would receive the most help from a circuit breaker. Single non-pensioners would also receive significant help. Typical high-earning households and one-parent families would receive the least help. The latter type of household tends to be receiving other benefits, such as housing benefit to cover rent. The very small number of one-parent families qualifying for the rebate may be because these households would tend already to be receiving conventional CTB.
C.121 The most generous circuit breaker (the 8 per cent option) would pay a lower average rebate for most household groups, although it would be paying many more households in each group. The high average rebate for one-parent families is due partly to the low number of households receiving the payment, who will have failed to qualify for conventional benefit, but have a high tax burden.
No circuit breaker
Decile
Council tax as % of net
income
Council tax as % of net
income
Number of households
assisted
Average rebate Council tax
as % of net income
Number of households
assisted
Average rebate Council tax
as % of net income
Number of households
assisted
Average rebate
thousand £ per week thousand £ per week thousand £ per week
Household type
Single non-pensioner 5.2 5.1 29 5.77 5.1 71 4.19 5.0 184 3.85
Couple without children 4.8 4.8 28 7.10 4.7 67 5.83 4.6 185 5.56
Couple with children 4.9 4.9 2 9.66 4.9 5 7.57 4.9 27 5.52
One-parent families 2.6 2.5 1 19.03 2.5 1 20.54 2.5 3 8.27
Single pensioners 3.5 3.4 66 4.89 3.3 122 4.99 3.2 263 4.81
Pensioner couples 4.6 4.5 32 5.26 4.5 80 5.23 4.4 213 5.39
Multiple tax units 3.2 3.2 6 12.20 3.2 11 8.97 3.1 32 6.60
Overall average 4.3 4.2 163 5.90 4.2 358 5.25 4.1 907 5.00
12% circuit breaker 10% circuit breaker 8% circuit breaker

C BACKGROUND TO SUPPORT CHAPTER 7
64 Lyons Inquiry into Local Government - Final Report
LOCAL INCOME TAX AS A REPLACEMENT FOR COUNCIL TAX
Summary of modelling
C.122 Modelling was conducted to examine the impact of replacing all or part of council tax with a local income tax (LIT). Two scenarios were modelled: full replacement of council tax with a LIT, and partial replacement at a level that raised half the required revenues from council tax and half from a LIT. In particular, this work focused on:
the LIT rate required to generate a given amount of revenue;
the impact of a LIT on households’ tax liability; and
the implications of a LIT for local government finance, including the impact on tax bases between areas and over time.
C.123 The model applies a LIT as a fixed increase in the basic rate of income tax. This reflects a judgement by the Inquiry that basic rate income tax is the most appropriate local tax base. The higher rate of income tax provides a less even tax base across the country, since higher rate taxpayers are not as evenly distributed as basic rate taxpayers. Applying a LIT to all rates of income tax also provides a less even tax base than basic rate alone. Revenues from the starting rate are modest and were judged too small to be a viable replacement for council tax.
C.124 A number of policy judgements were taken in designing the local income tax model, so the outputs described below should be considered illustrative rather than definitive. The Government would need to take its own decisions about elements of policy design in implementing any local income tax, and might choose to pursue a different model to this one.
C.125 For example, it was decided to model only the basic rate of income tax because that leads to greater evenness of tax bases between areas than the additional use of the higher and standard rates of tax. Judgements were also made, particularly in the partial replacement LIT option, about the respective roles of counties and districts in two-tier areas. For the sake of reducing complexity in the model, it was assumed that upper-tier authorities would set a single LIT rate across their area, with districts retaining control of council tax rates. This might also have some policy advantages in reducing complexity for taxpayers and employers, but this would be a matter of choice for government. Also in the partial replacement model, a set of assumptions were made about the balance between LIT and council tax – again these would be a matter of choice if such a partial replacement were to be implemented.

BACKGROUND TO SUPPORT CHAPTER 7 C
Lyons Inquiry into Local Government - Final Report 65
Data sources
C.126 Figures for the amounts raised from the basic rate of income tax for each local authority area were taken from the Survey of Personal Incomes (SPI) for 2003-04 from HMRC and uprated to 2006-07 in line with Budget 2006 assumptions. These figures do not include any behavioural response to the changes nor do they project any population changes due to migration. In addition, figures from BR returns for 2006-07 and the FRS data set were used for modelling.31
Main findings
C.127 A LIT rate of 7.7 pence on the basic rate of income tax would raise £22 billion in 2006-07 – approximately the amount necessary to replace council tax. If, however, the £3.15 billion saved in CTB (based on budgeted expenditure for 2006-07) were added to the national total of Formula Grant, the amount of yield required would drop to around £19 billion, implying a LIT rate of 6.6 pence on the basic rate of income tax.
C.128 A local income tax of this kind would be more progressive to income than council tax even with full take-up of CTB. A LIT on the basic rate would be progressive to income for all but the top ten per cent of earners, since the tax paid on earnings in the higher rate bracket would be unchanged.
C.129 A local income tax would be naturally ‘buoyant’. It is estimated that revenues would grow over time, but that this growth may be more modest than would have been expected from council tax. (The issue of buoyancy in income tax is explored in more detail in Annex E.)
C.130 A LIT rate of 3.9 pence on the basic rate of income tax would be sufficient to replace approximately half of council tax. Average band D council tax could be reduced in that case to £629 per year in 2006-07, before council tax benefit.
Assumptions
A LIT would be expected to raise £22 billion, approximately the amount that authorities budgeted to raise from council tax for 2006-07
Each local authority’s level of spending for 2006-07 – as measured by its budget requirement – is unchanged
Formula Grant is redistributed, to reflect the changed tax base, with the national total for 2006-07 remaining unchanged. Floor damping is not applied. Comparisons with the existing grant distribution for 2006-07 refer to grant before floor damping.32 Total Formula Grant is unchanged.
CTB is not payable. The resulting saving is not assumed to be recycled into Formula Grant; a local income tax would be expected to replace gross, not net council tax
31 Some differences between SPI and FRS figures for the yield from the basic rate of income tax were identified, with those from the SPI tending to be higher than those from the FRS. No definitive explanation for the differences was found, but they were likely to be due partly to differences resulting from different sampling errors in the SPI and the FRS, which in turn are affected by their different sample sizes: over 400,000 for the SPI compared with about 20,000 for the FRS. The differences are also likely to be due partly to the assumptions made when updating the SPI figures from 2003-04 and partly to the fact that the FRS is more focused on households receiving benefits and people at the lower end of the income scale than on taxpayers in general.
32 For an explanation of floor damping within the current grant system, see Annex A

C BACKGROUND TO SUPPORT CHAPTER 7
66 Lyons Inquiry into Local Government - Final Report
LIT rates vary across billing authority areas so that the correct LIT yield can be raised, taking account of each authority’s budget requirement and level of redistributed Formula Grant.33
LIT is levied through a fixed amount on the basic rate based on earnings income. The other elements of the tax system, such as personal allowances, are the same as under the national income tax system.
Description of the methodology
C.131 The Inquiry team modelled a full replacement LIT as an increase in the basic rate of income tax in 2006-07. Formula Grant figures were recalculated to take account of changes in tax base, and the resulting local tax yield and average bills were calculated for each billing authority area.
C.132 The impact at a household level was modelled, with the tax rate calculated at a local authority level being applied to the earned income associated with each household. The bills calculated at a household level by using FRS data on household income that would be subject to a LIT.34
Detailed findings
C.133 Under LIT, bills would be significantly reduced for very low-income households, making a local income tax progressive overall, except in the top income decile. Average bills for households in the top income decile would, however, be around twice those paid by that group under council tax.
C.134 LIT is, as might be expected, is more progressive with income than council tax, as shown in Table C23. Under a council tax system, higher earners pay proportionally less tax than the middle-income families, but LIT is regressive only at the very top band in the modelling results. This is because earnings in the higher rate tax bracket are not subject to LIT, due to the LIT model being based on only the basic rate of income tax.
33 This differs from the treatment of two-tier areas in modelling of the partial replacement LIT, where it is assumed that a standard LIT rate would be applicable across each county area, with the resulting variation in local tax requirement being taken into account in the setting of council tax levels.
34 For the purposes of the model, figures on taxable income were scaled back as survey data tends to overestimate yield from LIT compared with data from HMRC.
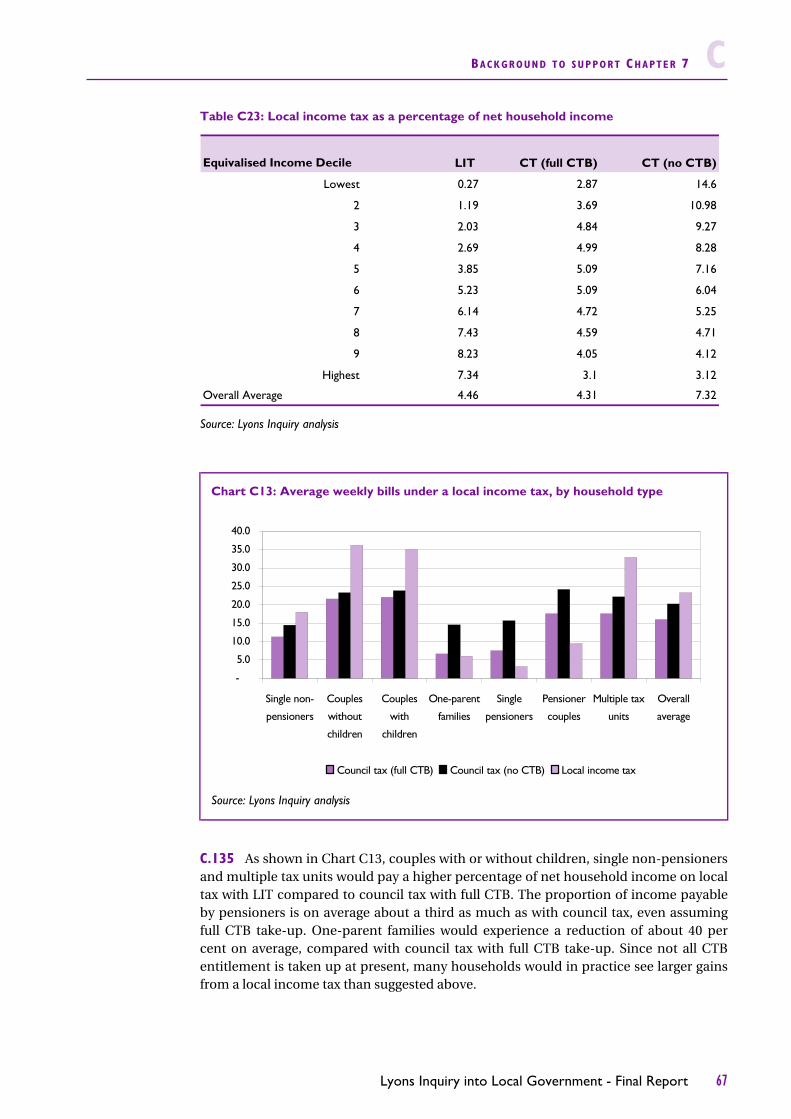
BACKGROUND TO SUPPORT CHAPTER 7 C
Lyons Inquiry into Local Government - Final Report 67
Table C23: Local income tax as a percentage of net household income
Source: Lyons Inquiry analysis
C.135 As shown in Chart C13, couples with or without children, single non-pensioners and multiple tax units would pay a higher percentage of net household income on local tax with LIT compared to council tax with full CTB. The proportion of income payable by pensioners is on average about a third as much as with council tax, even assuming full CTB take-up. One-parent families would experience a reduction of about 40 per cent on average, compared with council tax with full CTB take-up. Since not all CTB entitlement is taken up at present, many households would in practice see larger gains from a local income tax than suggested above.
Chart C13: Average weekly bills under a local income tax, by household type
Source: Lyons Inquiry analysis
5.0
10.0
15.0
20.0
25.0
30.0
35.0
40.0
Single non-
pensioners
Couples
without
children
Couples
with
children
One-parent
families
Single
pensioners
Pensioner
couples
Multiple tax
units
Overall
average
Council tax (full CTB) Council tax (no CTB) Local income tax
Equivalised Income Decile LIT CT (full CTB) CT (no CTB)
Lowest 0.27 2.87 14.6
2 1.19 3.69 10.98
3 2.03 4.84 9.27
4 2.69 4.99 8.28
5 3.85 5.09 7.16
6 5.23 5.09 6.04
7 6.14 4.72 5.25
8 7.43 4.59 4.71
9 8.23 4.05 4.12
Highest 7.34 3.1 3.12
Overall Average 4.46 4.31 7.32
-

C BACKGROUND TO SUPPORT CHAPTER 7
68 Lyons Inquiry into Local Government - Final Report
Regional impact on local taxes
C.136 Chart C15 compares the regional distribution of yields from council tax and LIT. The yields in the North East, the East of England, London and the South East would be greater under LIT than under council tax. It also shows how the average LIT rate by region would vary around the 7.8p average, from 7.6p in the East Midlands and West Midlands to 8.8p for the North East if the local tax requirement for each local authority area had been held constant.35 This reflects the fact that income tax bases are more variable at the regional level than council tax bases (under the existing bands).
35 The average LIT rate for a region has been calculated as the income tax yield for the region divided by the total yield from 1p on the basic rate of income tax for the region. The LIT yields have been scaled to sum exactly to the total council tax yield of £22.453 billion.
Chart C14: Local income tax as a percentage of net household income, by household type
Source: Lyons Inquiry analysis
0
2
4
6
8
10
12
Single
pensioners
Pensioner
couples
One-parent
families
Multiple tax
units
Single non-
pensioner
Couples
without
children
Couples with
children
Overall
Average
Wee
kly
bills
, £LIT CT (full CTB) CT (no CTB)
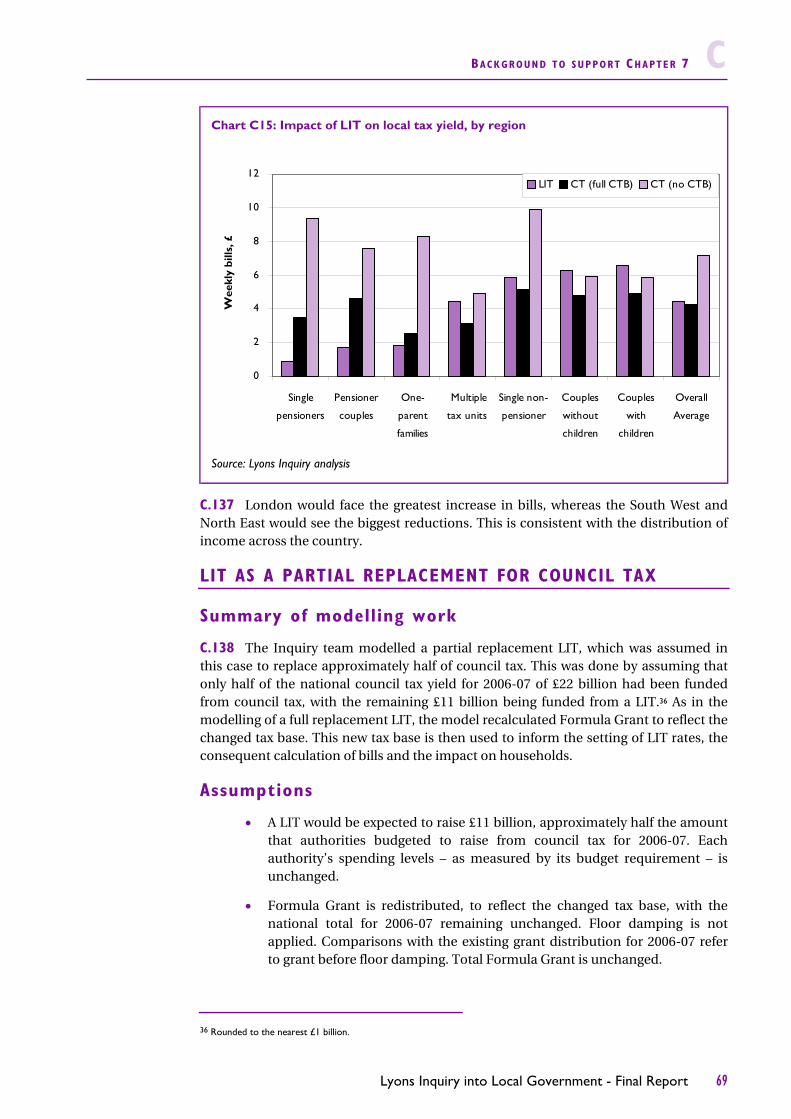
BACKGROUND TO SUPPORT CHAPTER 7 C
Lyons Inquiry into Local Government - Final Report 69
C.137 London would face the greatest increase in bills, whereas the South West and North East would see the biggest reductions. This is consistent with the distribution of income across the country.
LIT AS A PARTIAL REPLACEMENT FOR COUNCIL TAX
Summary of modelling work
C.138 The Inquiry team modelled a partial replacement LIT, which was assumed in this case to replace approximately half of council tax. This was done by assuming that only half of the national council tax yield for 2006-07 of £22 billion had been funded from council tax, with the remaining £11 billion being funded from a LIT.36 As in the modelling of a full replacement LIT, the model recalculated Formula Grant to reflect the changed tax base. This new tax base is then used to inform the setting of LIT rates, the consequent calculation of bills and the impact on households.
Assumptions
A LIT would be expected to raise £11 billion, approximately half the amount that authorities budgeted to raise from council tax for 2006-07. Each authority’s spending levels – as measured by its budget requirement – is unchanged.
Formula Grant is redistributed, to reflect the changed tax base, with the national total for 2006-07 remaining unchanged. Floor damping is not applied. Comparisons with the existing grant distribution for 2006-07 refer to grant before floor damping. Total Formula Grant is unchanged.
36 Rounded to the nearest £1 billion.
Chart C15: Impact of LIT on local tax yield, by region
Source: Lyons Inquiry analysis
0
2
4
6
8
10
12
Single
pensioners
Pensioner
couples
One-
parent
families
Multiple
tax units
Single non-
pensioner
Couples
without
children
Couples
with
children
Overall
Average
Wee
kly
bills
, £
LIT CT (full CTB) CT (no CTB)

C BACKGROUND TO SUPPORT CHAPTER 7
70 Lyons Inquiry into Local Government - Final Report
CTB is not payable against the LIT element of local taxes. Savings from reductions in council tax are not assumed to be recycled into Formula Grant; a LIT is assumed to replace half of gross, not net council tax.
There is one tier of LIT-raising authority in each area: county councils in two-tier areas; unitary councils in unitary areas; metropolitan districts in metropolitan areas; and London boroughs and the City of London in London.
Each LIT-raising authority would set its own LIT rate, rather than there being a single fixed rate applicable to all LIT-raising authorities. The LIT rate would therefore vary for each LIT-raising local authority instead of being fixed across them all.
Nationally, for authorities permitted to raise LIT, the gap between local authorities’ budget requirements and Formula Grant (the local tax requirement) would be funded 50 per cent from LIT and 50 per cent from council tax in the first year of operation.
Variants were modelled with and without the single person council tax discount. This reflects that the Government could choose to treat the remaining council tax as a pure property tax, with the LIT element implicitly taking account of the number of earners and service-users living in a property. In that case the single person discount might no longer apply.
Description of the methodology
C.139 The overall approach taken was to model local authority level figures for 2006-07, including the redistribution of Formula Grant, with resource equalisation taking account of both council tax and local income tax bases. For grant purposes a 50/50 council tax/LIT split was assumed at a national level, whilst allowing each LIT-raising authority some discretion over its relative level of revenue from each tax, in the light of the different relative strength of the two tax bases in different areas.
C.140 This was considered preferable to two possible alternative approaches:
imposing a 50/50 split at local authority level, when equalising for Formula Grant and when tax-setting;37 or
continuing to distribute grant according to resource equalisation for council tax only, leaving Formula Grant figures for 2006-07 unchanged. However this would imply a policy choice not to equalise for LIT resources, and so was not built into the model.
C.141 The model operates as follows:
the distribution of Formula Grant is recalculated, on the basis that, nationally, 50 per cent of revenue would be raised from council tax and 50 per cent from LIT.
in that context, applying an ‘assumed national council tax’ (ANCT) rate at such a level that, if adopted by all authorities, 50 per cent of the previous
37 This approach could constrain authorities’ ability to reach the optimum balance between LIT and council tax in their area, and might therefore distort the rates applied where one taxbase is particularly weak or strong compared with the other. An exact 50/50 split for each local authority (i.e. requiring exactly the same yield to be raised from council tax and LIT in an area) would, in any case, be almost impossible to achieve in practice because of the unpredictability of income tax revenue.

BACKGROUND TO SUPPORT CHAPTER 7 C
Lyons Inquiry into Local Government - Final Report 71
assumed national council tax revenue would be raised.38 Similarly, set an ‘assumed national local income tax’ (ANLIT) rate at a level that results in equal amounts of revenue raised nationally from LIT and council tax. It is therefore not assumed that each local authority would raise an equal amount in LIT and council tax in practice; local authorities with tax bases skewed towards one tax would be able to realise their potential to raise tax from one source whilst not raising as much revenue from the other;
calculate a local tax yield for each authority;
each major precepting authority then precepts its constituent billing authorities. This is done by requesting a cash amount equal to each billing authority’s share of the major precepting authority’s local tax requirement, apportioned in proportion to the tax bases of the billing authorities (e.g. a county council’s precept is apportioned between its district councils in line with their tax bases);
the collected revenue received by each billing authority is divided between the major preceptors in proportion to their precepted amounts;
billing authorities each set their own LIT and council tax rates independently of any other authority; 39
the setting of rates in two-tier shire areas follows this principle as closely as possible, but would be constrained by the requirement for there to be a common LIT rate across a county area; 40
each authority’s band D council tax is calculated by dividing its council tax yield by the tax base;
each local authority’s LIT requirement is expressed in terms of pence on the basic rate, by dividing the authority’s LIT requirement by the amount generated by 1 pence, using HMRC figures;
area council taxes for each billing authority area are calculated as described in Annex B; and
household level bills and the effects on CTB costs are modelled using IGOTM. Two scenarios were examined for their impact on households: one in which all existing discounts and exemptions are retained, and a second in which the single adult discount is abolished.
38 The use of an assumed national council tax is consistent with the method of carrying out resource equalisation in local government finance settlements before 2006-07.
39 In practice, these authorities might have significant freedom to set LIT and council tax rates which would result in a wide variation between the two rates, but the modelling assumed that authorities would stick as closely as possible to the assumed national rates. If the assumed national rates are not sufficient to raise the required revenue, then each rate is increased by the same proportion – that is, the ratio of LIT and council tax rates, for modelling purposes, will be equal to the ratio of the assumed rates for all authorities.
40 LIT rates for a county are set so that the average council tax rate across the county and the county-wide LIT rate are in the same ratio as the tax rates assumed in the Formula Grant calculation. For two-tier areas, LIT rates would be set before council tax rates, due to the requirement for county-wide consistency. This might constrain the districts’ choice of council tax rates.

C BACKGROUND TO SUPPORT CHAPTER 7
72 Lyons Inquiry into Local Government - Final Report
Detailed findings
C.142 Under a 50/50 LIT/council tax hybrid, bills before CTB would be significantly reduced for very low income families who would pay very little towards the LIT element of the tax.41 It would be much more progressive than council tax, both before and after CTB. Bills would be around 50 per cent higher for the top 20 per cent of earners.
C.143 The 50/50 LIT/council tax hybrid tax is more progressive than council tax. Under council tax, higher earners pay proportionally less tax than the middle income families, but LIT is modelled as being regressive to income only at the very top income group, because earnings in the higher rate tax bracket are not subject to LIT in the model.
C.144 The average percentage of net household income payable on local tax after CTB would be higher under a LIT, in general, due to the overall drop in CTB payments referred to above. Lower income families would therefore receive less CTB, but would have much lower LIT bills than higher earners.
C.145 Overall, bills after CTB would be higher than at present, because of the overall drop in CTB payments. Looking at particular household types, pensioners would tend to experience lower bills if full CTB take-up is assumed. Typical high-income households (such as couples with and without children and multiple tax units) would face higher average bills under a hybrid system. Single non-pensioners would also experience higher average bills, particularly if the single person discount were abolished.
41 The IGOTM model predicts higher LIT revenue than expected from the HMRC figures; the LIT element is therefore scaled down to match the expected total. This highlights the unpredictable element of income tax revenue at local authority level, which is one practical problem of the tax. Bills after CTB are higher under a LIT, in general, because of the overall drop in benefit payments as a result of these being payable only for the council tax element of the tax.
Chart C16: Partial replacement LIT (50/50) as a percentage of household income
Source: Lyons Inquiry analysis
0.0
2.0
4.0
6.0
8.0
10.0
12.0
14.0
16.0
Lowest 2 3 4 5 6 7 8 9 Highest
Equivalised income decile
Loca
l tax
as
a %
of i
ncom
e
CT no take up of CTB
CT full take up of CTB
50:50 LIT/CT no take up of CTB
50:50 LIT/CT full take up of CTB

BACKGROUND TO SUPPORT CHAPTER 7 C
Lyons Inquiry into Local Government - Final Report 73
C.146 Chart C17 shows how local tax, as a percentage of net household income, would vary by household type.
C.147 Couples with and without children, single non-pensioners and multiple tax units would tend to pay more local tax as a proportion of income under this option, compared with council tax (before or after CTB is taken into account). Pensioners would, on average, experience a reduction in their local tax as a proportion of income, of around 1 percentage point compared with council tax and full take-up of CTB. Since pensioner take-up of CTB is particularly low, it would be realistic to expect average real gains to be somewhat larger than this.
C.148 In general, local tax as a percentage of net household income would again increase under a hybrid system because of the reduction in CTB. The proportion of income paid would increase fairly consistently across the country, although London would face the greatest increase and the South West would face only a small increase.
Regional impact
C.149 Outer London, the East of England, the East Midlands and the South East would experience the biggest increases in local tax yield and hence the biggest decreases in Formula Grant. In London, tax-raising capacity would drop on average in the Inner London Boroughs, and rise in the Outer London boroughs, resulting in a shift in grant towards Inner London. The South West and the North West would also see significant increases in Formula Grant, reflecting their relatively low income tax bases. Chart C18 shows the regional changes in local tax requirement.
Chart C17: Partial replacement LIT (50/50) as a percentage of net household income by household type, with full take-up of CTB
Source: Lyons Inquiry analysis
0.0
2.0
4.0
6.0
8.0
10.0
12.0
14.0
16.0
Single non-pensioner
Couples wit houtchildren
Couples wit hchildren
One-parentf amilies
Singlepensioners
Pensionercouples
Mult iple t axunit s
Overall average
Loca
l tax
as
a %
of i
ncom
e
CT, no take-up of CTBCT/LIT, no take-up of CTBCT/LIT, no SPD, no take-up of CTBCT, full take-up of CTBCT/LIT, full take-up of CTBCT/LIT, no SPD, full take-up of CTB

C BACKGROUND TO SUPPORT CHAPTER 7
74 Lyons Inquiry into Local Government - Final Report
Impact at local authority level
C.150 LIT rates (expressed as pence in the £) would need to vary widely to raise 50 per cent of a local authority’s local tax revenue. The national average for 2006-07 would be 3.9p, but figures at local authority level would vary from 1.0p for the Isles of Scilly and 1.4p for Westminster to 4.7p for Richmond-upon-Thames and 5.5p for the City of London. Council tax levels would need to vary similarly to raise 50 per cent of an authority’s local tax revenue. The national Band D average for 2006-07 would be £629, but figures at local authority level would vary from £159 for the Isles of Scilly and £231 for Westminster to £773 for Sedgefield and £876 for the City of London.
C.151 Looked at another way:
75 per cent of authorities would have a LIT rate between 3.6p and 4.3p; and
around 95 per cent would be between 3.3p and 4.5p;
75 per cent of billing authorities would have a Band D council tax between £570 and £690; and
about 95 per cent would be between £525 and £750.
C.152 The extent to which these figures are realistic depends on the level of discretion offered to local authorities – if significant discretion were offered it would be impossible to predict the LIT/council tax mix in this way.
C.153 Holding budget requirements at their actual 2006-07 level would lead to authorities with decreased Formula Grant needing to set an increased local tax requirement. The pattern of changes in local tax yield is summarised in Table C24 below.
Chart C18: Changes in local tax requirement by region, under a partial replacement LIT
Source: Lyons Inquiry analysis
-7.0
-6.0
-5.0
-4.0
-3.0
-2.0
-1.0
0.0
1.0
2.0
3.0
4.0
EE SE OL EM NE YH WM IL NW SW
% c
hang
e in
loca
l tax
yie
ld a
cros
s re
gio

BACKGROUND TO SUPPORT CHAPTER 7 C
Lyons Inquiry into Local Government - Final Report 75
Table C24: Percentage changes in local tax requirement at local authority level under a LIT/council tax hybrid
Percentage change in tax requirement Number of authorities
Less than 5% 249
More than 5% but no more than 10% 123
More than 10% but no more than 15% 51
Over 15% 33
Total 456
C.154 The Isles of Scilly, Westminster and Kensington & Chelsea would see the biggest percentage decreases in tax requirement (67 per cent, 54 per cent and 26 per cent respectively), due largely to their large grant increases, whereas the City of London, Vale of White Horse and Tamworth would see the largest percentage increases in local tax requirement (47 per cent, 24 per cent and 23 per cent respectively).
C.155 Assuming that authorities set their council tax and LIT rates at the assumed national rates (so that nationally, 50 per cent of total revenue is raised from each tax) then 80 per cent of authorities would be closer than a 55:45 split, and 98 per cent would be closer than 60:40. This is because of the high degree of correlation between income tax yield and council tax base. The City of London would have the most bias towards income tax revenue with a ratio of 72:28. In practice, this balance would depend upon the extent to which rate-setting was left to individual authorities’ discretion.
C.156 Looked at another way, there would be widely-varying variations in the difference between the local tax requirement for a local authority area as set for 2006-07, and the total yield for that area from LIT and council tax if they were each set in line with the national average rate (of 3.9p and £629 per band D property respectively). The biggest percentage shortfall would be –28 per cent for the City of London, with a local tax yield for 2006-07 of £17.5 million but a yield from the national average LIT and council tax rates of £12.6 million. Other than for the City, figures would vary from a shortfall of –16 per cent for Rutland to surpluses of 53 per cent for Wandsworth, 172 per cent for Westminster and 297 per cent for the Isles of Scilly.
C.157 After equalising for each local authority’s ability to raise a combined LIT and council tax, the authorities which would experience a large reduction in Formula Grant are those which have a high income tax base relative to the council tax base (e.g. Wokingham at -64 per cent and Surrey at -37 per cent). Conversely, the authorities which would experience a large increase in Formula Grant are those which have a low income tax base relative to the council tax base, such as Dorset (32 per cent) and East Sussex (24 per cent).
C.158 Changes would be small for most authorities, however, because there is quite a high correlation between income tax base and council tax base. To give an idea of the scale of changes, 55 per cent of local authorities would experience grant changes within 5 per cent of the present level. The analysis ignores floor damping, however, and any transitional scheme could minimise these effects.
C BACKGROUND TO SUPPORT CHAPTER 7
76 Lyons Inquiry into Local Government - Final Report
Removing the single person discount
C.159 The analysis presented above has been based on the retention of the single person discount. It could be argued that it would no longer be needed if council tax related only to the property, with LIT taking account of the occupants. If the single person discount were abolished together with the introduction of a LIT, the picture at local authority level would be very similar to that already presented:
the vast majority of authorities would experience no more than a 5 per cent change in Formula Grant;
the regional shift of Formula Grant would be roughly the same as if the discount were retained;
the deviation from a 50:50 split would be roughly the same assuming that authorities showed no policy preference for either tax;
the average council tax would be 8 per cent lower than £629 at £577, since council tax bases would increase; and
the majority of differences would be seen at a household, rather than local authority, level. This is discussed further below.
CTB costs and local income tax
C.160 Because CTB would be payable only in respect of the 50 per cent of local tax that would remain as council tax, and no comparable benefit was assumed to be payable for the LIT element, total CTB costs would significantly decrease from current levels at both full and current take-up.
C.161 CTB costs, based on actual take-up, have been modelled to be:
Council tax only £3.1 billion
50/50 LIT/council tax £1.3 billion
50/50 LIT/council tax with no single person discount £1.4 billion
C.162 If there were full CTB take-up, CTB expenditure would drop by more than half under a hybrid system, from £4.7 billion to about £2 billion. Since the model is revenue neutral at a Formula Grant level, this additional saving to the government means that bills would, on average, be higher under the new system.
C.163 It is difficult to estimate the effect that the new system would have on take-up rates but, assuming current take-up, the size of the saving to central government from reduced benefit payments would be around £1.8 billion (or £1.7 billion with the abolition of the single person’s discount) of the current actual spend of £3.1 billion. This could be added to Formula Grant to make the system more truly revenue neutral. £1.7 billion is equivalent to the revenue raised from 0.6p on the basic rate of income tax.
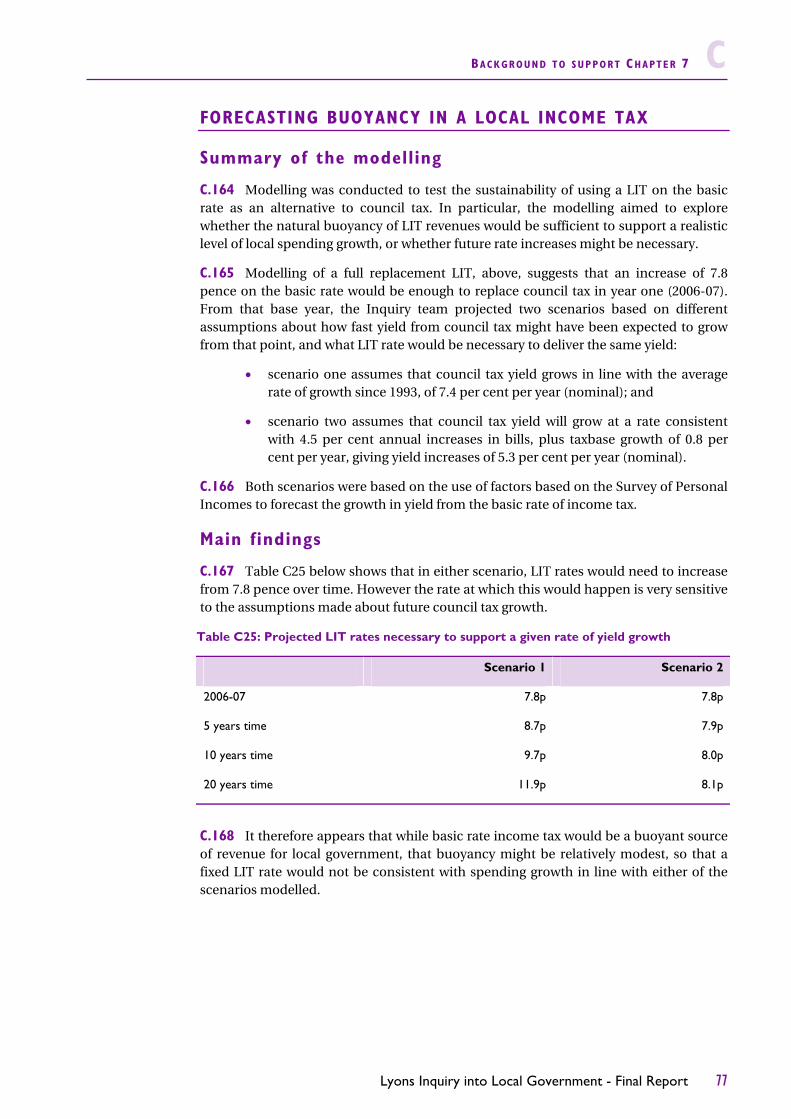
BACKGROUND TO SUPPORT CHAPTER 7 C
Lyons Inquiry into Local Government - Final Report 77
FORECASTING BUOYANCY IN A LOCAL INCOME TAX
Summary of the modelling
C.164 Modelling was conducted to test the sustainability of using a LIT on the basic rate as an alternative to council tax. In particular, the modelling aimed to explore whether the natural buoyancy of LIT revenues would be sufficient to support a realistic level of local spending growth, or whether future rate increases might be necessary.
C.165 Modelling of a full replacement LIT, above, suggests that an increase of 7.8 pence on the basic rate would be enough to replace council tax in year one (2006-07). From that base year, the Inquiry team projected two scenarios based on different assumptions about how fast yield from council tax might have been expected to grow from that point, and what LIT rate would be necessary to deliver the same yield:
scenario one assumes that council tax yield grows in line with the average rate of growth since 1993, of 7.4 per cent per year (nominal); and
scenario two assumes that council tax yield will grow at a rate consistent with 4.5 per cent annual increases in bills, plus taxbase growth of 0.8 per cent per year, giving yield increases of 5.3 per cent per year (nominal).
C.166 Both scenarios were based on the use of factors based on the Survey of Personal Incomes to forecast the growth in yield from the basic rate of income tax.
Main findings
C.167 Table C25 below shows that in either scenario, LIT rates would need to increase from 7.8 pence over time. However the rate at which this would happen is very sensitive to the assumptions made about future council tax growth.
Table C25: Projected LIT rates necessary to support a given rate of yield growth
Scenario 1 Scenario 2
2006-07 7.8p 7.8p
5 years time 8.7p 7.9p
10 years time 9.7p 8.0p
20 years time 11.9p 8.1p
C.168 It therefore appears that while basic rate income tax would be a buoyant source of revenue for local government, that buoyancy might be relatively modest, so that a fixed LIT rate would not be consistent with spending growth in line with either of the scenarios modelled.

Lyons Inquiry into Local Government - Final Report 79
INTRODUCTION
D.1 A general introduction to the technical annexes is given in Annex B. This particular technical annex reports on modelling work carried out on options relating to business taxation, as covered in Chapter 8 of the final report. It covers:
full relocalisation of business rates;
supplementary business rate;
the impact of rents on rateable values;
estimated yield from removing the business rates exemption for agricultural land and buildings; and
breakdown of the empty property relief.
FULL RELOCALISATION OF BUSINESS RATES
Summary of modelling work
D.2 Modelling was carried out to examine what level of spending a local authority would have been able to undertake on the basis of local tax sources alone if they retained the business rates collected from local lists for their area for 2006-07, rather than paying them into the national pool and receiving an amount of redistributed business rates as part of Formula Grant. Revenues were distributed between the tiers and classes of authority within an area (e.g. counties, fire and police authorities).
Main findings D.3 The national yield of business rates for 2006-07 was estimated as £17.411 billion. After redistribution between tiers and classes, full relocalisation would have resulted in 65 local authorities raising more revenue from local taxation (council tax and business rates) than their net budget requirement in 2006-07, with the remaining authorities raising less than their budget requirement.
D.4 Continuing with the present level of equalisation under a system of local business rates would therefore require some revenues to be transferred between authorities. This modelling is intended to be illustrative and does not reflect on the different options for the redistribution and pooling of revenues, or the redistribution of the remaining government Revenue Support Grant.
D.5 Table D1 shows how the yield varies by Government Office region. It reflects the pattern of business rate yield which is currently collected by billing authorities and paid into the pool.
D BACKGROUND TO SUPPORT CHAPTER 8

D BACKGROUND TO SUPPORT CHAPTER 8
80 Lyons Inquiry into Local Government - Final Report
D.6 Table D2 shows the number of authorities in each Government Office region for which over 100 per cent of budget requirement would be funded locally under full relocalisation of business rates, and Table D3 gives a breakdown by class of authority. Such authorities are most common in London and elsewhere in the south of the country, with shire counties being much more likely than shire districts to be over 100% per cent funded in two-tier areas.
Table D1: Local business rates yield by Government Office region
Yield (£m) Percentage of England total
North East 648 4
North West 2,029 12
Yorkshire & the Humber 1,473 8
East Midlands 1,208 7
West Midlands 1,599 9
East of England 1,760 10
London 4,455 26
South East 2,866 16
South West 1,373 8
England 17,411 100
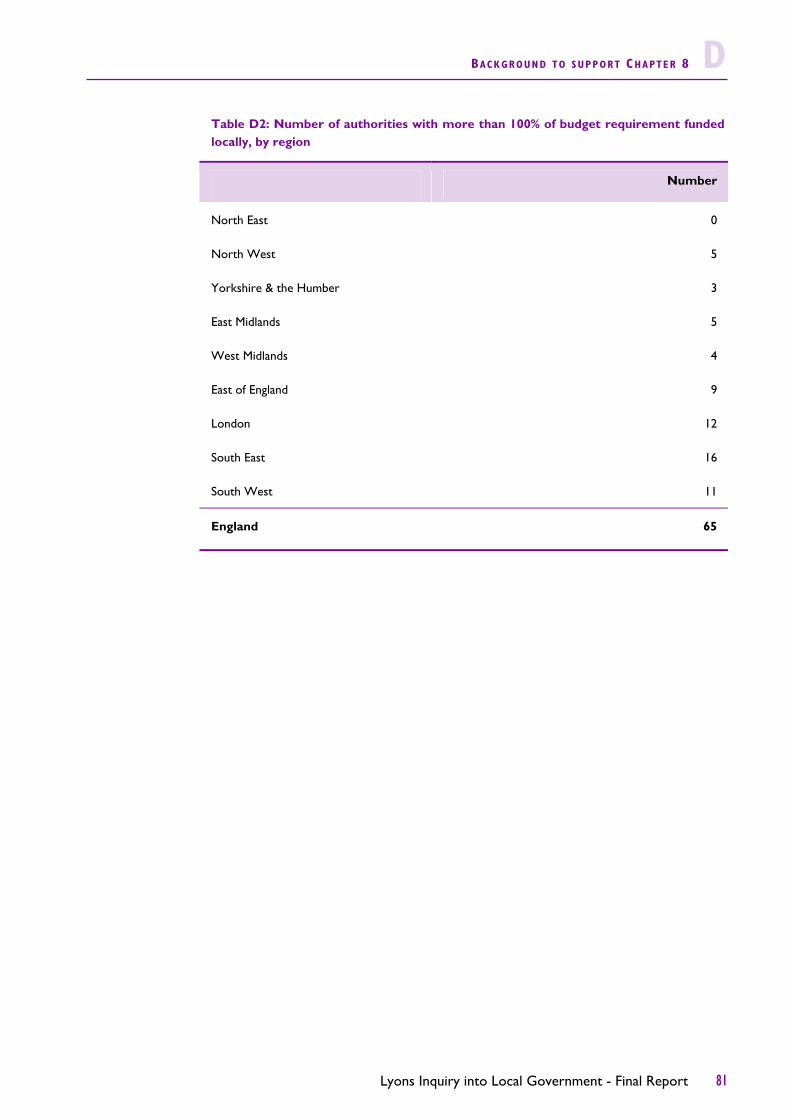
BACKGROUND TO SUPPORT CHAPTER 8 D
Lyons Inquiry into Local Government - Final Report 81
Table D2: Number of authorities with more than 100% of budget requirement funded locally, by region
Number
North East 0
North West 5
Yorkshire & the Humber 3
East Midlands 5
West Midlands 4
East of England 9
London 12
South East 16
South West 11
England 65

D BACKGROUND TO SUPPORT CHAPTER 8
82 Lyons Inquiry into Local Government - Final Report
D.7 Data from this modelling for all local authorities is available in supplementary tables and charts on the Lyons Inquiry website, and Chart 8.5 in the main report shows the level of surplus or deficit for all upper tier authorities.
Data sources D.8 The figures used for modelling were those submitted to Communities and Local Government (CLG) on NNDR1 returns for 2006-07 and Formula Grant figures as announced in the final 2006-07 Local Government Finance settlement. In addition, the model used data on mandatory and discretionary reliefs, collection costs and estimates of the take-up of small business rate relief provided by CLG. The Formula Grant figures were as announced in the 2006-07 local government finance settlement.1 Redistribution between tiers and classes was done on the basis of the redistributable amount shares for business rates from the 2005-06 settlement (such shares no longer form part of the grant distribution system, so 2006-07 figures are not available). The model also used data on reliefs, and costs and losses from collection, from 2005-06 provided from NNDR returns submitted by billing authorities to CLG.
1 Some figures were taken from the provisional, rather than the final, settlement, because they were the most up-to-date available figures at the time of carrying out the particular piece of modelling.
Table D3: Number of authorities with more than 100% of budget requirement funded locally, by class
Number
Inner London 5
Outer London 7
Greater London Authority 0
Metropolitan districts 3
Metropolitan fire authorities 0
Metropolitan police authorities 0
Shire counties 28
Shire districts 3
Unitary authorities 19
Shire police authorities 0
Shire fire authorities 0
England 65

BACKGROUND TO SUPPORT CHAPTER 8 D
Lyons Inquiry into Local Government - Final Report 83
Description of methodology
D.9 The gross business rates yield for each billing authority was calculated by multiplying the total rateable value for the authority’s area by the multiplier, and then scaling the amount downwards to reflect the effects of mandatory and discretionary reliefs, and costs and losses of collection, by means of a discounting factor for each billing authority, calculated using data from 2005-06.
D.10 The model then aggregated the local yield from business rates in each billing authority and distributed it between the different tiers and classes of authority using distributable amount shares, as used in the 2005-06 settlement.2
D.11 The resulting business rates yield for each local authority was added to its council tax requirement for 2006-07, to give a measure of its local revenues. This was then compared with the authority’s budget requirement for 2006-07 Formula Grant to assess what level of spending the authority would have been able to undertake on the basis of local tax sources alone, if full relocalisation were to be implemented. An authority was regarded as being ‘over-funded’ if its local revenue from business rates and council tax exceeded the whole of its budget requirement.
Assumptions
D.12 The 2006-07 transitional relief scheme is ignored.
D.13 The likelihood of qualifying for mandatory and discretionary reliefs within any authority is the same regardless of rateable value. This underlies the calculation of a discounting factor for each authority, as discussed below.
D.14 The reduction in the business rates yield due to reliefs, losses in collection and costs of collection, is the same proportion of total business rates revenue for each local authority in 2006-07 as it was in 2005-06 – the most recent year for which figures were available when the modelling work was done.
SUPPLEMENTARY BUSINESS RATE
Summary of modelling
D.15 Modelling was carried out to estimate the effect of allowing authorities to set a business rates supplement and for the amount raised as a result to be retained locally. A supplement of one penny was modelled using data for 2006-07. Results are provided below for two models:
each billing authority retaining its own yield; and
yields being passed to the upper tier areas in shire areas (i.e. to shire county councils where they exist) and to the Greater London Authority in London.
Main findings
D.16 A one penny supplement would result in an additional business rates yield of £415 million for 2006-07, assuming the supplement had no impact on rateable values. A breakdown of this total by Government Office region is given in Table D4.
2 The method used for more recent settlements could not be easily replicated, due to business rates being redistributed through the four-block model from 2006-07. More details are given in Annex A.

D BACKGROUND TO SUPPORT CHAPTER 8
84 Lyons Inquiry into Local Government - Final Report
D.17 Table D5 shows how the yield from a one penny supplement would be distributed across the classes of authority under each of the options modelled.
Table D4: Yield from 1p supplement by Government Office region
Yield (£m) Percentage of England total
North East 15 4
North West 48 12
Yorkshire & the Humber 35 8
East Midlands 29 7
West Midlands 38 9
East of England 41 10
London 109 26
South East 67 16
South West 33 8
England 415 100
Table D5: Yield from a 1p supplement by class of authority
Model 1: Retained by all billing authorities
Model 2: Upper tier authorities and GLA
£ million % England £ million % England
Inner London 72 17 0 0
Outer London 37 9 0 0
Greater London Authority 0 0 109 26
Metropolitan districts 78 19 78 19
Shire districts 159 38 0 0
Shire counties 0 0 159 38
Unitary authorities 69 17 69 17
England 415 100 415 100

BACKGROUND TO SUPPORT CHAPTER 8 D
Lyons Inquiry into Local Government - Final Report 85
D.18 Data from this modelling for all local authorities is available in supplementary charts and tables on the Lyons Inquiry website. Chart 8.6 in the main report shows the revenue from a one pence supplement for all upper tier local authorities (with revenue collected by London boroughs rather than the GLA).
Data sources
D.19 The figures used for modelling are those submitted to CLG on NNDR1 returns for 2006-07 and Formula Grant figures as announced in the final 2006-07 Local Government Finance settlement. Assumptions are as for the full relocalisation modelling described above.
Description of methodology
D.20 The supplement was calculated as the additional yield generated by increasing the national multiplier one penny and applying a factor to take account of reliefs, derived separately for each billing authority. No redistribution of Formula Grant was carried out.
THE IMPACT OF RENTS ON RATEABLE VALUE
D.21 In most cases it is the occupier of a property who is liable for paying business rates. However, economic theory suggests that the person who really ends up paying the tax is not necessarily the same as the person who hands over the money initially. In the case of property taxes, economic theory suggests that in the long run the owner is likely to bear the final burden, because he or she will receive lower rents if taxes on occupation are increased.
D.22 Various studies have assessed the degree to which the tax burden is shifted from tenants to landlords in reality, and concluded that it is possible that the adjustment in rents may fully offset the impact on tenants of higher rates over the long run. In the short and medium run, that effect is likely to be reduced by a series of rigidities such as long term leases and upward only rent reviews.
D.23 The Inquiry team modelled the potential effect of higher business rates on property values in order to assess the impact of changes in the business rate on businesses, and on the size of the business rates tax base. A model was constructed which calculated the likely impact on rateable values of a given change in the tax rate, depending on a given assumption about the degree to which an increase in taxation was passed through to lower rateable values.
D.24 The equation which forms the heart of this model is:
Where:
RV = rateable value
P = the degree to which changes in rates are passed through to rents (where 0 is no impact and –1 is complete offset)
M = business rates multiplier
M)(PinitialM)(P1initialRVMPRV
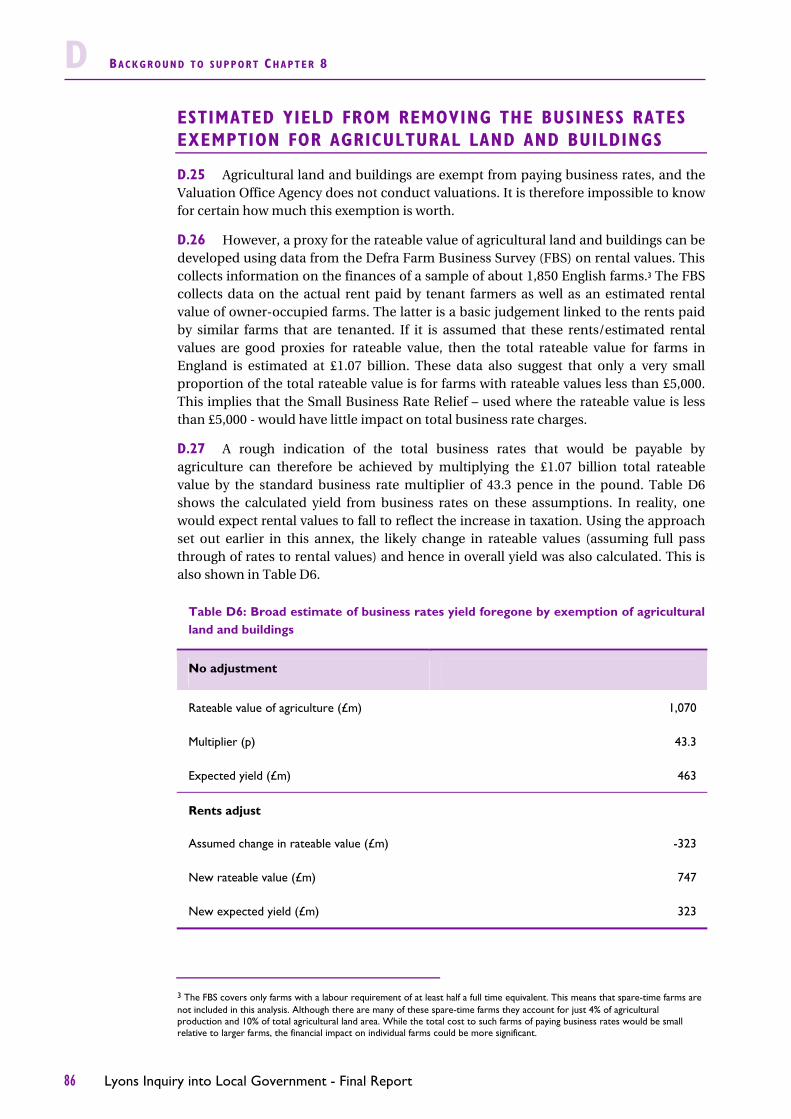
D BACKGROUND TO SUPPORT CHAPTER 8
86 Lyons Inquiry into Local Government - Final Report
ESTIMATED YIELD FROM REMOVING THE BUSINESS RATES EXEMPTION FOR AGRICULTURAL LAND AND BUILDINGS
D.25 Agricultural land and buildings are exempt from paying business rates, and the Valuation Office Agency does not conduct valuations. It is therefore impossible to know for certain how much this exemption is worth.
D.26 However, a proxy for the rateable value of agricultural land and buildings can be developed using data from the Defra Farm Business Survey (FBS) on rental values. This collects information on the finances of a sample of about 1,850 English farms.3 The FBS collects data on the actual rent paid by tenant farmers as well as an estimated rental value of owner-occupied farms. The latter is a basic judgement linked to the rents paid by similar farms that are tenanted. If it is assumed that these rents/estimated rental values are good proxies for rateable value, then the total rateable value for farms in England is estimated at £1.07 billion. These data also suggest that only a very small proportion of the total rateable value is for farms with rateable values less than £5,000. This implies that the Small Business Rate Relief – used where the rateable value is less than £5,000 - would have little impact on total business rate charges.
D.27 A rough indication of the total business rates that would be payable by agriculture can therefore be achieved by multiplying the £1.07 billion total rateable value by the standard business rate multiplier of 43.3 pence in the pound. Table D6 shows the calculated yield from business rates on these assumptions. In reality, one would expect rental values to fall to reflect the increase in taxation. Using the approach set out earlier in this annex, the likely change in rateable values (assuming full pass through of rates to rental values) and hence in overall yield was also calculated. This is also shown in Table D6.
3 The FBS covers only farms with a labour requirement of at least half a full time equivalent. This means that spare-time farms are not included in this analysis. Although there are many of these spare-time farms they account for just 4% of agricultural production and 10% of total agricultural land area. While the total cost to such farms of paying business rates would be small relative to larger farms, the financial impact on individual farms could be more significant.
Table D6: Broad estimate of business rates yield foregone by exemption of agricultural land and buildings
No adjustment
Rateable value of agriculture (£m) 1,070
Multiplier (p) 43.3
Expected yield (£m) 463
Rents adjust
Assumed change in rateable value (£m) -323
New rateable value (£m) 747
New expected yield (£m) 323

BACKGROUND TO SUPPORT CHAPTER 8 D
Lyons Inquiry into Local Government - Final Report 87
D.28 This is a very broad estimate of the likely revenues and includes a number of simplifications and omissions. In particular, no assessment is made of the impact on other taxes, such as income tax and national insurance.
BREAKDOWN OF THE EMPTY PROPERTY RELIEF
D.29 National level data is collected from billing authorities on the total cost of empty property relief. However, no national breakdown exists of the contribution to that overall cost made by the different aspects of that relief – how much, for example the 100% relief for industrial hereditaments is worth. A small sample of billing authorities was approached by the Inquiry and they were able to provide details of the cost of empty property reliefs in their areas for 2005-06. These figures were used to provide broadly indicative figures of the national breakdown of the types of empty property relief.
D.30 Table D7 gives the overall figures for the six billing authorities included in the sample (Birmingham, Bury, Manchester, Oldham, Rochdale and Stockton-on-Tees). The billing authorities included in the sample together accounted for £89 million, or 6.7 per cent of the national total of £1,322 million. Table D8 gives equivalent national totals if the breakdown across the six billing authority areas was representative nationally.
D.31 According to the scaled-up estimates, about 80 per cent of the relief was accounted for by either the industrial exemptions, or the 50 per cent relief on longer term empty property. The very small size of the sample and its lack of geographical balance mean, however, that these findings should be treated with great caution. On that basis no attempt has been made to develop a breakdown of these figures by region or by individual authority.
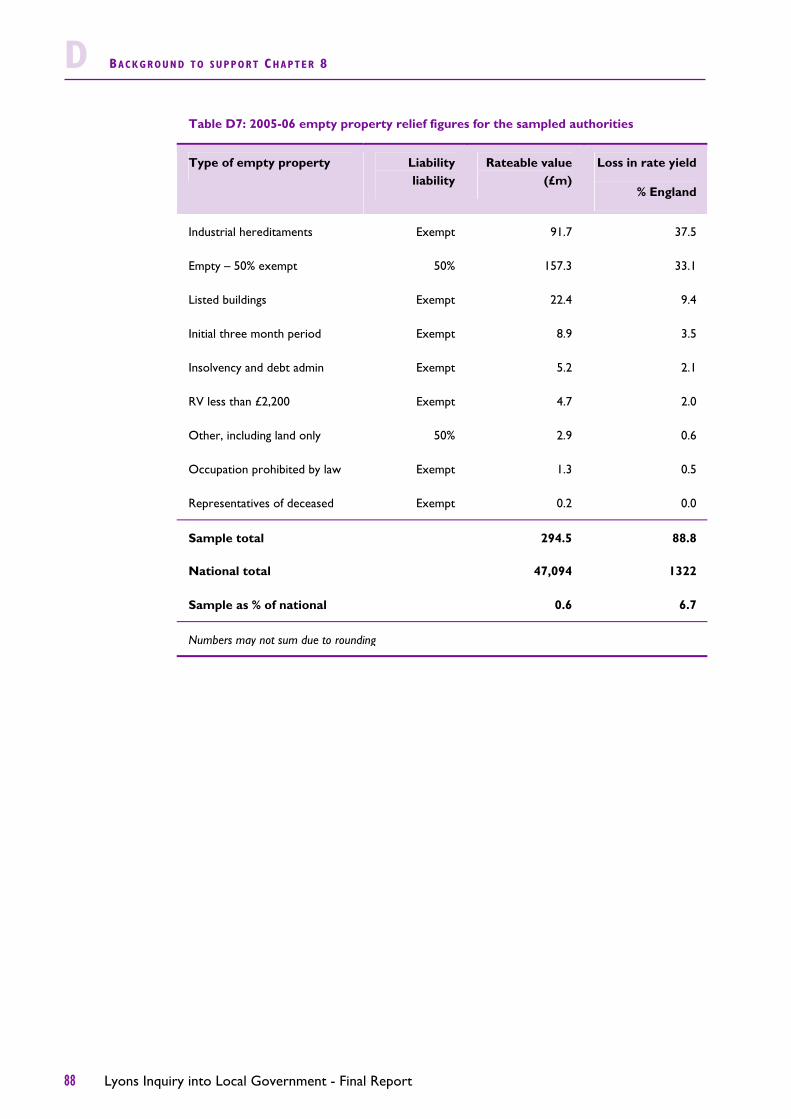
D BACKGROUND TO SUPPORT CHAPTER 8
88 Lyons Inquiry into Local Government - Final Report
Table D7: 2005-06 empty property relief figures for the sampled authorities
Type of empty property Liability liability
Rateable value (£m)
Loss in rate yield
% England
Industrial hereditaments Exempt 91.7 37.5
Empty – 50% exempt 50% 157.3 33.1
Listed buildings Exempt 22.4 9.4
Initial three month period Exempt 8.9 3.5
Insolvency and debt admin Exempt 5.2 2.1
RV less than £2,200 Exempt 4.7 2.0
Other, including land only 50% 2.9 0.6
Occupation prohibited by law Exempt 1.3 0.5
Representatives of deceased Exempt 0.2 0.0
Sample total 294.5 88.8
National total 47,094 1322
Sample as % of national 0.6 6.7
Numbers may not sum due to rounding
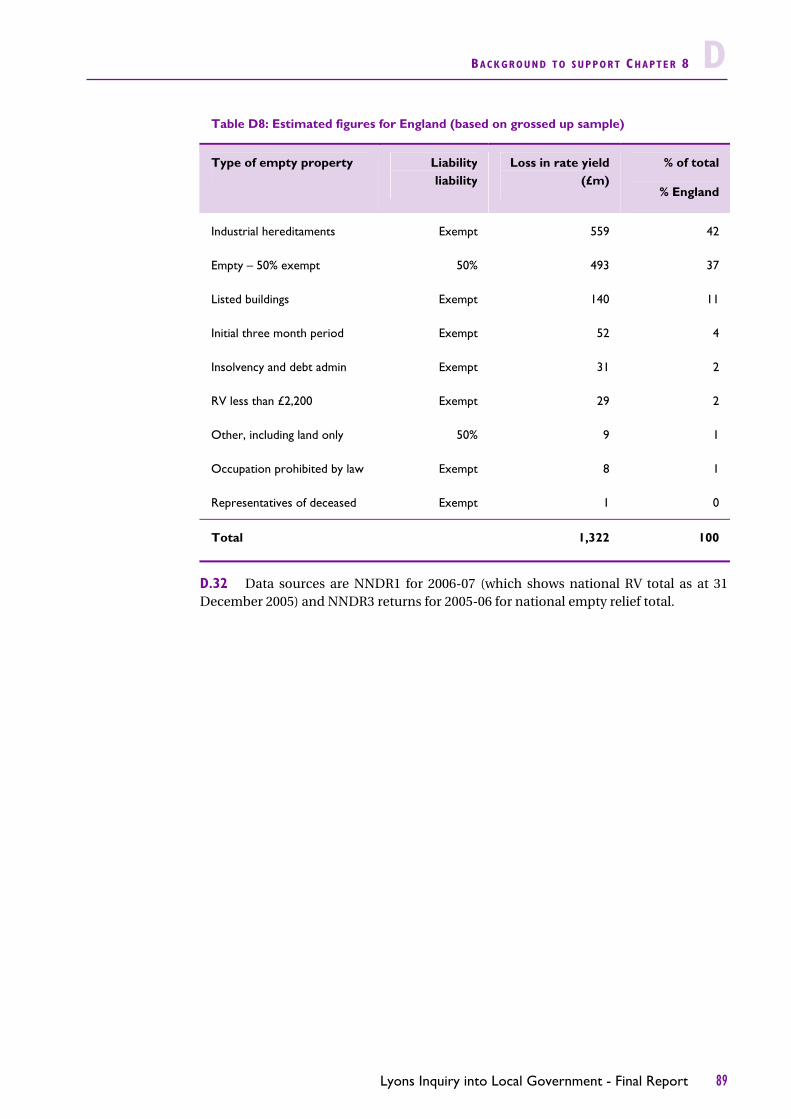
BACKGROUND TO SUPPORT CHAPTER 8 D
Lyons Inquiry into Local Government - Final Report 89
D.32 Data sources are NNDR1 for 2006-07 (which shows national RV total as at 31 December 2005) and NNDR3 returns for 2005-06 for national empty relief total.
Table D8: Estimated figures for England (based on grossed up sample)
Type of empty property Liability liability
Loss in rate yield (£m)
% of total
% England
Industrial hereditaments Exempt 559 42
Empty – 50% exempt 50% 493 37
Listed buildings Exempt 140 11
Initial three month period Exempt 52 4
Insolvency and debt admin Exempt 31 2
RV less than £2,200 Exempt 29 2
Other, including land only 50% 9 1
Occupation prohibited by law Exempt 8 1
Representatives of deceased Exempt 1 0
Total 1,322 100

Lyons Inquiry into Local Government - Final Report 91
INTRODUCTION
E.1 This annex sets out detailed analysis and a description of the methods used to support the Inquiry’s conclusions on incentives and assignment reported in Chapter 9 of the main report.
E.2 The first two sections of the annex cover incentives for growth in the council tax base and the business rates tax base. The aim is the same in relation to both these tax bases – to incentivise growth by rewarding growth in the tax base with additional funding through the grant system – but the way that they interact with the local government finance system is different, which means that different approaches are required. The final section sets out in detail the analysis underlying some of the options for assignment of income tax.
COUNCIL TAX INCENTIVES
Types of council tax base incentive
E.3 Chapter 9 reports on three potential methods of designing incentives based on the council tax base. These are: partial equalisation; differential equalisation; and equalising for lagged tax bases. The aim in each case would be to reward those who grew their council tax bases by ensuring that growth in tax base was not entirely equalised away through the grant distribution system.
E.4 It is important to note that none of the modelling work was designed to replicate likely local authority responses to the incentives. The results presented here, therefore, show the impact of different incentive options on the tax base and their effect on Formula Grant. In the event of an introduction of an incentive one would expect local authorities’ behaviour to change and that in itself could impact on the distribution of incentives and grant between authorities.
Partial equalisation
E.5 Two attempts were made to model the effects of introducing partial equalisation into the current grant system. The aim of partial equalisation would be to enable local authorities to keep some of the gain from growth in tax base, rather than having it fully taken into account in the calculation of grant.
E.6 The first option scaled down the national Relative Resource Amount (RRA) total so that it took account of only a fixed percentage of authorities’ tax bases (e.g. 90%). However, this had a distributional impact only to the extent that the national total for the block decreased relative to the Central Allocation block. This is an unintended consequence caused by the design of the ‘four-block’ system and while affecting the distribution of grant, it would not provide a clear incentive to grow the tax base.
E.7 Within the RRA total, every authority’s tax base would be scaled down by the same proportion, having no effect on individual RRAs. Halving every authority’s tax base, for example, would have no effect on how the growth in tax base is taken into account for any authority through the RRA, and therefore no incentive effect.
E BACKGROUND TO SUPPORT CHAPTER 9

E BACKGROUND TO SUPPORT CHAPTER 9
92 Lyons Inquiry into Local Government - Final Report
E.8 The second option involved leaving tax bases unchanged, but equalising to a particular tax capacity, for example to less than 100 per cent of what was assumed national council tax (ANCT) under the previous system, or to a higher than normal minimum tax capacity (such as 115 per cent) as in Sweden. However altering the share of what was previously known as ANCT used in the RRA calculation also simply results in RRA figures for all authorities being scaled to the same extent, thus affecting grant only to the extent that the national RRA total is changed in relation to the other blocks.
E.9 This demonstrates that the inter-relationships between the blocks in the ‘four-block’ model make it very difficult to alter the RRA without it impacting on other parts of the system in an unintended way. The ‘four-block’ model therefore provides limited scope for varying different aspects of resource equalisation to introduce incentives to local authorities to grow the tax base.
Differential equalisation
E.10 To go beyond the consistent scaling down of every authority’s tax base (which was the effect of the ‘partial equalisation’ approach set out above) would require individual authority tax bases to be differentially scaled in some way, so that the extent of variation between authorities was changed. There is, however, technically no single correct way of doing this – the approach would require the Government to make a policy choice about which authorities to advantage, for example seeking to provide additional resources in growth areas or in deprived areas, and adjusting the scaling of tax bases on that basis.
E.11 However, any further work on such an incentive option would also need to take into account the impact of grant damping. Chapter 9 discussed those authorities that benefit from damping. The 15 local authorities that benefited the most in the 2006-07 settlement were: Surrey, Wokingham, Bromley, Richmond upon Thames, Windsor and Maidenhead, South Bucks, Chiltern, Buckinghamshire, West Sussex, Chichester, Hampshire, Brentwood, Three Rivers, Hertsmere and Hertfordshire.
E.12 The impact of damping is shown in the following results, which for the purposes of illustration are based on a simple adjustment of each authority’s tax base so that the difference between its tax base per head of population and the national average is half what it was for the 2006-07 settlement. This has the effect of narrowing the extremes of tax base per head across authorities, for example, from 0.257 (Forest Heath) to 0.629 (City of London) to 0.307 to 0.492 respectively.
E.13 Table E1 shows the impact of this adjustment and shows, before damping, the authorities that would have had the largest increases and decreases in Formula Grant. It then shows that damping would have major impacts on these increases and decreases.

BACKGROUND TO SUPPORT CHAPTER 9 E
Lyons Inquiry into Local Government - Final Report 93
Equalising for lagged tax bases
E.14 A model was developed to test the impact on the distribution of the 2006-07 Formula Grant of replacing the tax base used in that settlement with one dating from three years earlier, leaving all else constant. This would reward authorities who had grown their tax base, as that growth in tax base (and hence in council tax revenues) would not be taken into account in allocating grant, and they would therefore receive a higher level of grant that they do under the current system. This model shows only what would happen if this model was applied on the basis of historical data – it does not attempt to estimate how local authorities might have changed their behaviour if the incentive had been in place. This model does not increase the total amount of resources in the system, rather, it redistributes the current revenues in a different way.
E.15 The data sets used were the 2006-07 CLG local government finance settlement, and figures for tax bases for Formula Grant purposes from October 2003. In the model there was no change to the total amount of Formula Grant for 2006-07 and the effects
Table E1: Authorities with the biggest increases and decreases in Formula Grant prior to damping and after damping
Difference between actual grant before damping and
modelled grant with scaled tax base (%)
Difference between actual grant after damping and
modelled grant with scaled tax base (%)
Top 5 prior to damping
Surrey 74.6 9.9
Windsor and Maidenhead 70.5 26.1
Richmond upon Thames 69.5 21.2
Wokingham 42.5 0.4
Buckinghamshire 43.5 13.9
Bottom 5 prior to damping
Leicester -8.0 -4.3
Derby -8.0 -4.5
Coventry -8.2 -6.3
Southampton -8.3 -10.2
Forest Heath -11.8 -14.8
Introduction
Data sets and assumptions

E BACKGROUND TO SUPPORT CHAPTER 9
94 Lyons Inquiry into Local Government - Final Report
were measured without damping.
E.16 In terms of class of authority the average gains and losses were not large. Inner London boroughs and authorities in shire areas tend to gain as a result of this change, reflecting the faster level of growth in their tax bases, with other metropolitan areas tending to lose overall.
Impacts on Formula Grant
Table E2: Impact by authority class of lagged equalisation of council tax base
Formula Grant for 2006-07 before
damping with 3 year tax base lag
£ million
Gain from moving to 3
year tax base lag
£ million
Gain from moving to 3 year tax
base lag
%
London area 9,330 8 0.1
Inner London 2,034 22 1.1
Outer London 1,622 -18 -1.1
Greater London Authority 2,019 0 0.0
Metropolitan areas 7,109 -25 -0.4
Metropolitan districts 4,930 -22 -0.4
Metropolitan police authorities 1,870 -2 -0.1
Metropolitan fire authorities 309 -1 -0.3
Shire areas 12,029 21 0.2
Shire counties 3,632 5 0.2
Unitaries 2,869 13 0.4
Shire districts 1,765 1 0.1
Shire police authorities 3,339 2 0.1
Shire fire authorities 424 0 0.1
Total England 24,814 0 0.0
Total Growth Areas 6,299 12 0.2
Total New Growth points (estimated allocation to local authority areas)
6,846 9 0.1

BACKGROUND TO SUPPORT CHAPTER 9 E
Lyons Inquiry into Local Government - Final Report 95
E.17 At the individual local authority level, before any damping is applied, areas such as Windsor and Maidenhead and Chiltern would lose the most Formula Grant and Rutland and Richmond upon Thames would gain the most Formula Grant. Table E3 below sets out the biggest percentage increases and decreases in Formula Grant which resulted from lagging the council tax base by three years, and the scale of the gains and losses created by this incentive.
BUSINESS RATE INCENTIVES
E.18 Chapter 9 discusses two models for introducing business rates incentives into the taxation and grant system – a system of lagged contributions to the national business rates pool; and a system of partial local assignment of business rates to the authority in which they are collected. Both would enable local authorities with a growing business rate base to gain extra resources. However, as with previous models, neither tried to predict likely local authority responses to the incentives.
Table E3: Authorities affected most significantly by lagged equalisation
Sorted by gain as % of Formula Grant
2006-07 grant before damping with 3 year tax
base lag
£ million
Gain from moving to 3
year tax base lag
£ million
Gain from moving to 3
year tax base lag
%
Top 5
Rutland 6.7 0.6 9.6
Hart 3.3 0.2 5.8
North Dorset 4.3 0.2 4.9
Wandsworth 121.6 5.5 4.7
Richmond upon Thames 18.3 1.3 7.3
Bottom 5
Croydon 98.3 -3.4 -3.4
Havering 42.2 -1.6 -3.6
Bath & North East Somerset 33.6 -1.7 -4.9
Chiltern 2.8 -0.2 -5.2
Windsor and Maidenhead 10.9 -0.7 -6.0

E BACKGROUND TO SUPPORT CHAPTER 9
96 Lyons Inquiry into Local Government - Final Report
Lagged contributions to the business rates pool
E.19 At present, local authorities collect business rate revenues from properties on the local list and pay them into a central pool for redistribution. Under this incentives model, they would continue to do so, but their contributions would be based not on the revenues actually collected in the current year, but on the revenues they had collected in a previous year. Where the tax base had grown in the intervening period, they would therefore receive a financial benefit, and where it had shrunk they would need to find resources from elsewhere to meet the gap.
E.20 Two variants of lagging billing authorities’ contributions to the pool were modelled:
a 1 year lagged model, with billing authorities making a lagged contribution to the pool, by making 2005-06 contributions in 2006-07; and
a 5 year lagged model, making 2001-02 contributions in 2006-07.1
E.21 Overall business rates revenues have increased between the years, in both models. The modelling assumes that the collective gain to billing authorities resulting from making lower contributions than they otherwise would have done, is paid for from the national total of Formula Grant for 2006-07, so the model redistributes resources between authorities rather than providing new resources.
E.22 This work made use of the dataset used by CLG in carrying out the calculations for the 2006-07 local government finance settlement. It also used figures for each billing authority’s contribution to the national business rates pool for 2001-02 and 2005-06, as reported to CLG on NNDR3 returns.
E.23 For two-tier shire areas, gains (and losses) were split 50:50 between districts and counties in the modelling. In London and metropolitan areas, all the gains (and losses) were modelled as being kept by the billing authorities.
E.24 Fire and police authorities, and the Greater London Authority, would receive no share of the revenues. Since the model reduced Formula Grant by the amount of business rates retained locally, so that overall it had no additional cost for the Government (unlike the partial assignment model discussed later), there would be a fall in grant to those authorities who have to pay for the incentives scheme without being able to gain from it. In practice this might not be a desirable outcome and could be altered through making other adjustments to the grant system. This model should be seen as an illustration of a possible scheme rather than a detailed design.
E.25 The overall national ‘gain’ resulting from the lagging of business rates contributions was found to total £1.7 billion between 2005-06 and 2006-07, and £3.2 billion between 2001-02 and 2006-07, with these amounts being top-sliced from the 2006-07 Formula Grant total.2 This top-slicing was modelled by sharing the reduction
1 The second variant compares figures across a revaluation, because the 2001-02 contributions were based on 2000 rateable values, whereas the 2006-07 figures were based on those from 2005. As noted in Chapter 9, this has implications for the degree to which this approach would actually provide transparent incentives. For each local authority, the lag is the difference between the contribution to the pool derived from rateable values for 31 December 2000 and the contribution to the pool derived from rateable values at 31 December 2005.
2 The large gain of £1.7bn between 2005-06 and 2006-07 – compared with one of £3.2bn over the whole period from 2001-02 to 2006-07 – is due in part to a definitional point, because the 2005-06 figures are on an outturn basis. This, unlike the 2006-07 estimates, includes amounts in respect of earlier years, which tend to be negative overall, due to the net effect of downward rateable value changes resulting from appeals.
Assumptions and
methodology
Impacts

BACKGROUND TO SUPPORT CHAPTER 9 E
Lyons Inquiry into Local Government - Final Report 97
between Revenue Support Grant and redistributed business rates totals on a pro-rata basis, leaving principal formula Police Grant unchanged.3
E.26 Growing authorities would tend to gain by an incentive of this kind not being required to contribute all their 2006-07 net business rates yield to the pool. Declining authorities – of which there are very few in absolute terms – would in contrast need to have financed part of their contribution from other resources. However, because of the top-slicing of Formula Grant, some authorities lost in relative terms – they would receive less from this model than they would have done had the Formula Grant system continued as normal.
E.27 Regionally, there would have been large net gains for London and the South East over both the periods modelled and large net losses for the northern regions, as shown in the tables below.
3 In practice, any method of allocating reductions between Revenue Support Grant and redistributed business rates totals would result in the same distribution in the current system, because they are both distributed in exactly the same way using the four-block model. Only if the amount were distributed partly through principal formula Police Grant would the distribution of grant be substantively different. In reality, ministerial judgements on floor levels under a system of lagged business rates may well have differed from what were under the current system.
Table E4: Effect at regional level of one year model
All figures £m Gain from business rates
Reduction in Formula Grant
Overall effect
North East 66 -122 -56
North West 213 -256 -43
Yorkshire & the Humber 140 -189 -48
East Midlands 81 -131 -49
West Midlands 103 -199 -96
East of England 174 -130 45
London 507 -390 118
South East 315 -180 135
South West 124 -129 -4
Total England 1,724 -1,724 0

E BACKGROUND TO SUPPORT CHAPTER 9
98 Lyons Inquiry into Local Government - Final Report
E.28 For both one- and five-year models, the greatest net gains by authority class were for Inner London boroughs and shire districts, with some of the biggest losses occurring for metropolitan districts.4
4 Police and fire authorities, including the Greater London Authority, were also shown to be large net losers. This is consistent with their not being able to benefit from the scheme as modelled, whilst still being required to contribute towards it through a reduction in grant.
Table E5: Effect at regional level from five year model
All figures £m Gain from business rates
Reduction in Formula Grant
Overall effect
North East 119 -224 -104
North West 340 -469 -129
Yorkshire & the Humber 228 -346 -118
East Midlands 198 -239 -41
West Midlands 238 -364 -126
East of England 301 -237 64
London 1,017 -713 304
South East 511 -329 182
South West 204 -235 -32
Total England 3,156 -3,156 0

BACKGROUND TO SUPPORT CHAPTER 9 E
Lyons Inquiry into Local Government - Final Report 99
Table E6: Effect by class of one year model
All figures £m Gain from business rates
Reduction in Formula Grant
Overall effect
London 507 -383 124
Inner London 337 -164 173
Outer London 170 -135 35
Greater London Authority 0 -84 -84
Metropolitan areas 308 -511 -203
Metropolitan districts 308 -409 -101
Metropolitan police authorities 0 -76 -76
Metropolitan fire authorities 0 -26 -26
Shire areas 909 -830 79
Shire counties 305 -299 6
Unitaries 299 -236 63
Shire districts 305 -146 159
Shire police authorities 0 -114 -114
Shire fire authorities 0 -35 -35
Total England 1,724 -1,724 0

E BACKGROUND TO SUPPORT CHAPTER 9
100 Lyons Inquiry into Local Government - Final Report
E.29 At local authority level, the net effects of lagging contributions between 2001-02 and 2006-07 varied in absolute amounts from a loss of £38 million for Birmingham to a gain of £182 million for Westminster. The following table (Table E8) shows the top and bottom five authorities (ranked by the percentage of their grant that the incentive represents). As this demonstrates, the effects of an unmodified version of this scheme would be very significant for some authorities, who might gain or lose a sum equivalent to more than 100% of their current grant allocation.
Table E7: Effect by class of five year model
All figures £m Gain from business rates
Reduction in Formula Grant
Overall effect
London 1,017 -703 314
Inner London 787 -301 486
Outer London 230 -248 -18
Greater London Authority 0 -154 -154
Metropolitan areas 586 -933 -347
Metropolitan districts 586 -748 -162
Metropolitan police authorities 0 -138 -138
Metropolitan fire authorities 0 -47 -47
Shire areas 1,553 -1,520 33
Shire counties 563 -548 15
Unitary authorities 428 -431 -3
Shire districts 562 -267 295
Shire police authorities 0 -209 -209
Shire fire authorities 0 -65 -65
Total England 3,156 -3,156 0

BACKGROUND TO SUPPORT CHAPTER 9 E
Lyons Inquiry into Local Government - Final Report 101
Partial local assignment of business rates
E.30 The second illustrative incentives model the Inquiry considered was a variant of the assignment work set out in Chapter 9. This model involved assigning a proportion of locally collected business rates to the local authority in which they were collected, rather than (as happens at present) having all of those revenues paid into the central pool. In the model, forecast future grant allocations did not take into account this local revenue, meaning that a local authority’s total revenues would increase or decrease with growth or decline in local business rates revenues.
E.31 This work made use of the dataset used by CLG in carrying out the calculations for the 2006-07 local government finance settlement. It also used figures for each billing authority’s business rates revenues for 2003-04 to 2005-06, as reported to CLG on NNDR3 returns, and on the NNDR1 (provisional) forms for 2006-07.
E.32 The most significant assumption made in the model is that it uses actual historical data on changes in business rate revenues between 2003-04 and 2005-06 as the basis for its forecasts of changes in revenues for the future. This forecasting means the results of the model are highly dependent on what happened to revenues in those years. As such, the results of the model are intended to be illustrative, rather than a prediction of the future.
Table E8: Most significantly affected authorities under one year model
Sorted by % impact on Formula Grant (before damping)
Net effect (£m) % of grant
Top 5
City of London 95.6 133.7
Horsham 3.6 76.7
Dartford 4.3 68.2
Crawley 5.8 66.5
South Bucks 1.3 64.4
Bottom 5
Wear Valley -0.7 -10.3
Shepway -0.9 -10.4
Waltham Forest -11.5 -11.6
South Holland -1.9 -26.2
West Somerset -0.9 -32.2
Assumptions and
methodology

E BACKGROUND TO SUPPORT CHAPTER 9
102 Lyons Inquiry into Local Government - Final Report
E.33 Another important assumption is that under this model the total resources available to local government grow over time. This is because the model assumes that the grant provided by central government continues to grow at the same rate in the future, despite the fact that local authorities now have a new revenue source from which they can also benefit, namely buoyancy in local business rates. This means that over time total resources (locally assigned business rates and central government grant) grow more quickly than they otherwise would have done (assuming a fixed Spending Review allocation for local government grant).
E.34 For the purposes of the modelling, the Inquiry team assumed that business rates revenues would grow in the exactly the same way as they have done in the most recent five years and that the remaining grant from central government would continue to growth at about 3 per cent per annum in real terms. From 2006-07 to 2009-10 Formula Grant is therefore forecast to grow by about 9 per cent and locally assigned business rates by about 14 per cent. Growth of business rates in 2010-11 is lower than forecast growth in Formula Grant by about one per cent. Over the period 2006-07 to 2010-11, this model would have required the Government to find additional resources totalling around £426 million in order to maintain Formula Grant increases as well as allowing local authorities to retain some of business rates growth. This model therefore differs from the lagged contributions model discussed earlier, which redistributes within a fixed pot of resources.
E.35 For two tier authorities half of business rates revenue was assumed to remain with the shire district, and the other half went to the relevant shire county. In London and metropolitan areas, all the gains (and losses) were modelled as being kept by the billing authorities. Police and fire authorities were not included. The City of London was also excluded because of its exceptionally high business rates tax base.
E.36 All figures are adjusted to 2006-07 prices, in line with the rest of the Inquiry’s forecast work on assignment of taxes.
E.37 The model was designed so that in the first year (2006-07) no local authority received more from the combination of government grant and locally assigned business rates than they would do from the normal 2006-07 settlement (before damping). It therefore assumed that, in the first year of the scheme, government grant is reduced by the amount of locally assigned business rates.
E.38 The ‘tipping point’ at which one authority’s grant is entirely replaced by locally assigned business rates would first be reached for South Bucks District Council which becomes fully locally funded if 16 per cent of business rates are retained locally (in this case, being shared between the county and the district). The model was therefore set to assign all local authorities 16 per cent of local business rates revenues, which totals £2.8 billion. This percentage is assumed to remain fixed into the future so that an authority can benefit from growth in business rate revenues.
E.39 The incentives created by this option are likely to differ between authorities depending on both the size of the local business rates base in absolute terms (how much money is collected each year) and what proportion of their total funding comes from locally assigned revenues. Areas with high tax bases would stand to gain significant additional revenue from even low growth rates. Areas where locally assigned revenues are a substantial proportion of total funding would face the strongest incentives to act; whereas the incentive is dampened for those authorities who have a small tax base and high needs, because they are guaranteed most of their income from central government regardless of how much the business rates tax base grows.
Calculating the ‘tipping
point’
Proportion of funding from
assigned revenues

BACKGROUND TO SUPPORT CHAPTER 9 E
Lyons Inquiry into Local Government - Final Report 103
E.40 The proportion of funding represented by locally assigned revenues would differ between areas. In the model, authorities in Yorkshire and Humber and the North East receive, on average, over 80 per cent of funding from central government grants, with 20 per cent coming from locally assigned business rates, due to authorities in those regions generally having high grant allocations and a lower tax base than other regions, while local assignment represented a higher proportion of resources in the East of England and the South East.
E.41 By authority class, shire districts and unitary authorities could see the most substantial shift from central grant to funding from locally assigned revenues. This is partly because they have lower grant on average, and so even a low level of locally assigned business rates replaces a higher proportion of grant.
E.42 At the local authority level, there is significant variation in the amount of funding that assignment of 16 per cent of local business rates represents. For example, in South Bucks 100 per cent of revenues would come from grant and assigned business rates combined, whereas in Lewisham they would only represent only four per cent. The proportion of each authority received from the 16 per cent assignment is shown in the chart below.
E.43 The tables below show the additional or reduced revenues that authorities would receive in each of the years of the model, compared to a situation in which existing arrangements for the distribution of grant and business rates continue to operate, on the assumptions detailed earlier in the chapter.
E.44 London and the South East would have seen the largest increase in funding under assignment of this kind, if previous growth was projected forward. These areas have larger tax bases and have seen relatively better growth in their business rates tax bases. Local authorities in the South East on average have the highest funding from locally assigned revenues.
Chart E1: Proportion of local and central funding after 16% local assignment of business rates
Source: Lyons Inquiry
Impacts
0%
20%
40%
60%
80%
100%
Ranked local authorities
% g
rant
+ a
ssig
ned
reve
nues
Locally assigned business rates Centrally allocated grant

E BACKGROUND TO SUPPORT CHAPTER 9
104 Lyons Inquiry into Local Government - Final Report
E.45 By authority class, shire districts, metropolitan districts and unitary authorities see the largest increase in funding.
E.46 The tables below illustrate the local authorities most affected – both positively and negatively – in this model of partial local assignment of business rates by showing the model’s results for 2007-08 and 2010-11. The authorities who gain vary, and gains and losses can be quite significant as a proportion of their current grant (partly this reflects the decision to split revenues 50:50 between districts and counties, given the
Table E9: Additional resources by region from 16% assigned business rates
All figures £ 2007-08 2008-09 2009-10 2010-11
North East 6,226,198 7,676,805 6,071,457 955,676
North West 21,081,413 22,741,573 16,387,876 - 15,039,743
Yorkshire & Humber 11,316,271 9,588,302 4,288,653 - 12,878,316
East Midlands 1,946,847 14,127,019 4,284,377 - 8,880,614
West Midlands 6,623,557 8,504,327 3,003,840 - 15,000,016
East of England 14,955,095 20,851,434 13,265,270 - 3,542,601
London 42,506,702 45,578,412 40,569,456 9,191,975
South East 35,050,591 58,507,549 36,145,164 - 6,662,634
South West 9,629,936 16,554,499 11,606,140 - 11,111,208
Total England 149,336,611 204,129,919 135,622,234 - 62,967,481
Table E10: Additional resources by class from 16% assigned business rates
All figures £ 2007-08 2008-09 2009-10 2010-11
Inner London 23,592,421 26,524,550 22,676,433 12,918,026
Outer London 18,914,280 19,053,863 17,893,024 - 3,726,051
Metropolitan districts 30,903,229 41,968,011 26,777,692 - 11,970,636
Shire counties 26,679,695 33,314,760 14,704,445 - 33,321,047
Shire districts 21,121,666 43,751,900 38,635,233 323,500
Unitary authorities 28,125,318 39,516,835 14,935,408 - 27,191,273
Total England 149,336,611 204,129,919 135,622,234 - 62,967,481

BACKGROUND TO SUPPORT CHAPTER 9 E
Lyons Inquiry into Local Government - Final Report 105
much smaller size of district budgets). This is also extremely sensitive to assumptions about growth in business rates.
ASSIGNMENT OF INCOME TAX
E.47 This section of the annex reports on national and local assignment, both of which are fixed over time rather than variable. It focuses solely on the assignment of income tax, given the potential advantages of this form of taxation for assignment as discussed in Chapter 9.
A national fixed assignment
E.48 This model tested the impact of assigning a proportion of income tax over a ten year time series of changes in income tax yield, starting in 1996-97 and running to 2006-07. The impact of the changes in income tax yield were then compared against what
Table E11: Illustration of authority level impacts from 16% assigned business rates
2007-08 2010-11
Sorted by change as % of Formula Grant
Change in resources
(£)
As % grant +
NDR
Change in resources
(£)
As % grant +
NDR
Top 5
Wokingham 1,276,613 10.0 Dartford 1,707,489 18.9
Horsham 575,194 9.8 Spelthorne 876,401 14.2
Tewkesbury 448,640 7.9 Harlow 830,983 9.3
Dartford 607,360 7.9 Fareham 613,653 9.1
Windsor & Maidenhead
960,053 7.6 Watford 654,906 8.4
Bottom 5
Vale of White Horse
123,340 -1.8 West Somerset
335,985 -10.9
Selby 119,049 -1.9 Elmbridge 871,929 -13.6
Harborough 98,244 -1.9 Selby 1,00,5704 -17.6
South Holland 289,666 -3.6 Hart 677,604 -21.1
West Somerset 152,882 -4.9 Windsor & Maidenhead
2,706,754 -24.7
Assumptions and
methodology
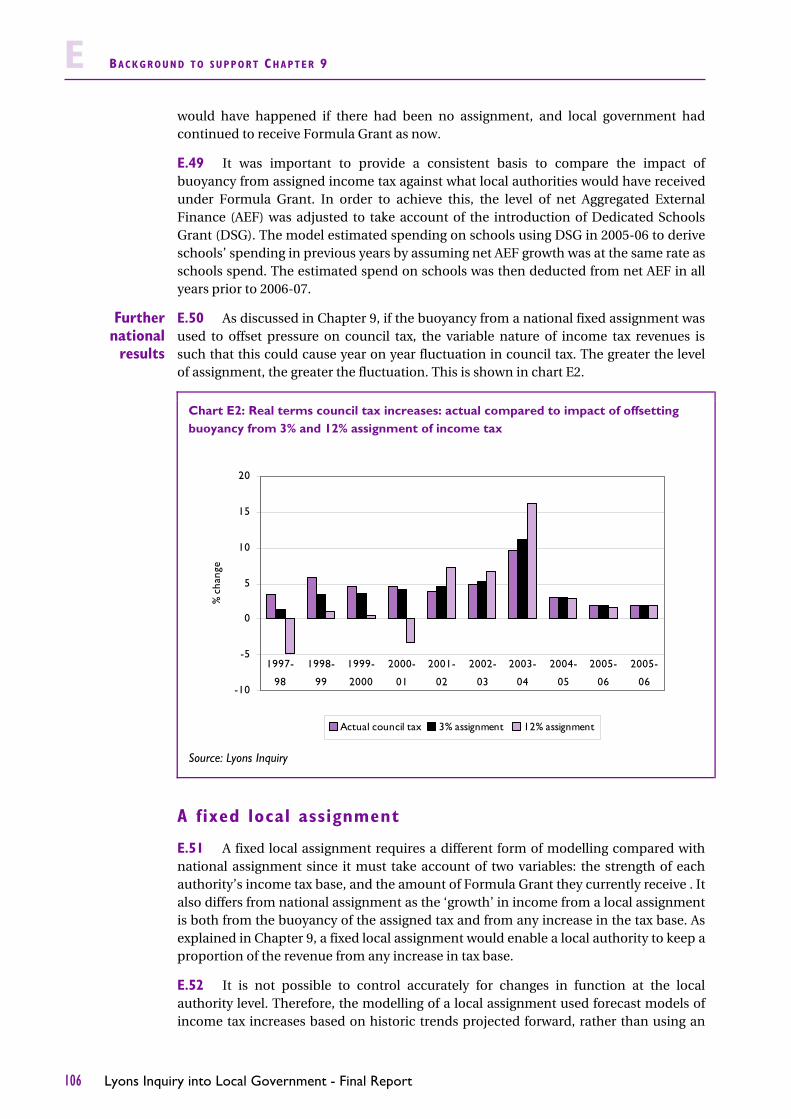
E BACKGROUND TO SUPPORT CHAPTER 9
106 Lyons Inquiry into Local Government - Final Report
would have happened if there had been no assignment, and local government had continued to receive Formula Grant as now.
E.49 It was important to provide a consistent basis to compare the impact of buoyancy from assigned income tax against what local authorities would have received under Formula Grant. In order to achieve this, the level of net Aggregated External Finance (AEF) was adjusted to take account of the introduction of Dedicated Schools Grant (DSG). The model estimated spending on schools using DSG in 2005-06 to derive schools’ spending in previous years by assuming net AEF growth was at the same rate as schools spend. The estimated spend on schools was then deducted from net AEF in all years prior to 2006-07.
E.50 As discussed in Chapter 9, if the buoyancy from a national fixed assignment was used to offset pressure on council tax, the variable nature of income tax revenues is such that this could cause year on year fluctuation in council tax. The greater the level of assignment, the greater the fluctuation. This is shown in chart E2.
A fixed local assignment
E.51 A fixed local assignment requires a different form of modelling compared with national assignment since it must take account of two variables: the strength of each authority’s income tax base, and the amount of Formula Grant they currently receive . It also differs from national assignment as the ‘growth’ in income from a local assignment is both from the buoyancy of the assigned tax and from any increase in the tax base. As explained in Chapter 9, a fixed local assignment would enable a local authority to keep a proportion of the revenue from any increase in tax base.
E.52 It is not possible to control accurately for changes in function at the local authority level. Therefore, the modelling of a local assignment used forecast models of income tax increases based on historic trends projected forward, rather than using an
Further national results
Chart E2: Real terms council tax increases: actual compared to impact of offsetting buoyancy from 3% and 12% assignment of income tax
Source: Lyons Inquiry
-10
-5
0
5
10
15
20
1997-
98
1998-
99
1999-
2000
2000-
01
2001-
02
2002-
03
2003-
04
2004-
05
2005-
06
2005-
06
% c
hang
e
Actual council tax 3% assignment 12% assignment

BACKGROUND TO SUPPORT CHAPTER 9 E
Lyons Inquiry into Local Government - Final Report 107
historic time series, as in the modelling of a national assignment. Any buoyancy from a local assignment is compared against the grant levels from 2006-07, and all forecasts are presented in 2006-07 terms.
E.53 As described in Chapter 9, the amounts that were used in the modelling of a local assignment were £3.4 billion and £13.1 billion, reflecting the amounts used in the modelling of national assignment. The first represents the 2006-07 amount of Revenue Support Grant, that is the element of Formula Grant that is paid from general national taxation rather than business rates. The second is based on a re-working of Revenue Support Grant as if Dedicated Schools’ Grant had been financed from both business rates and Revenue Support Grant, rather than just RSG.
E.54 As stated in Chapter 9, it was decided that starting rate income tax was the best form of income tax to use, due to its lack of variability between areas and its relative buoyancy.
E.55 It should be noted that any positive buoyancy in this tax band is a result both of policy changes and any growth in yield. The policy changes that have affected income tax include the up-rating of taxable bands in line with annual indexation increases. From 2005-06 to 2006-07 the taxable amount of income from the starting rate and basic rate increased by £60 and £840 respectively. It is not possible to disaggregate these effects. However, although the taxable amount of income under the basic rate increased by 14 times as much as the starting rate, the buoyancy of the two for that period were very similar. This suggests that growth in tax base, rather than policy changes in taxable bands, was the main driver in the buoyancy of starting rate tax. Table E12 enables a comparison between buoyancy in all income tax, starting rate, basic rate and higher rate income tax bands from 2000-01 to 2006-07.
E.56 As set out in Chapter 9, one of the criteria that was applied to the design of a local assignment was that no authority should, in the first year, receive more support than they would have done from Formula Grant in that year. Once this ‘tipping point’ had been reached this set the level of local assignment for all local authorities. This is a major constraint on the impact of local assignment but one which was considered necessary to control, at least initially, divergence between local authorities.
Benefits of the starting rate
of income tax
Table E12: Comparisons of buoyancy of all, starting, basic and higher rate income tax, real increases indexed (2000-01= 100)
Starting rate Basic rate Higher rate All income tax
2000-01 100 100 100 100
2001-02 118 100 101 101
2002-03 117 99 96 99
2003-04 113 93 90 89
2004-05 116 97 99 99
2005-06 119 100 103 102
2006-07 121 102 107 105
Establishing the point at which to set
the local level of assignment

E BACKGROUND TO SUPPORT CHAPTER 9
108 Lyons Inquiry into Local Government - Final Report
E.57 Chart E3 below is a graphical representation of this tipping point for £3.4 billion. This point is reached by comparing the levels of starting rate income tax for each authority against their level of Formula Grant. As is shown in this chart, Surrey is the first authority for which the lowest proportion of starting rate income tax ‘covers’ their Formula Grant. This reflects both that they have a high income tax base and a low level of Formula Grant before damping. The tipping point for an assignment of starting rate income tax equivalent to £3.4 billion is 7 per cent of starting rate income tax and the point for an assignment of starting rate income tax equivalent to £13.1 billion is 28 per cent of starting rate income tax.
E.58 As stated above, a forecast model was chosen because replacing an element of Formula Grant at a local authority level historically is not possible as year on year functional changes in Formula Grant makes the data incomparable over time. Forecasting, however, leaves the model highly sensitive to alterations in forecasting methods applied. The results are therefore susceptible to changes accordingly.
E.59 Two forecast models were developed: first, a ‘classic’ model which developed starting rate forecast projections by mirroring historical real percentage changes in income tax for individual local authorities; and second, an ‘optimistic’ model which projected by mirroring forwards the historical real percentage changes of the local authority with the highest average annual growth in each region from 2003 to 2005 to all local authorities in its region.
E.60 Further national results of a local assignment are given below based on both the ‘classic’ and ‘optimistic’ model, and the size of the local assignment. This is set out by two date points and discussed in terms of the impact on council tax bills. It shows the extent of variation in impact, both for those authorities which saw an increase in bills on average, and for those which saw a decrease in bills.
Chart E3: Deriving the ‘tipping point’ for an assignment of 7% of starting rate income tax
Source: Lyons Inquiry
Forecast models
Surrey
-
10
20
30
40
50
60
70
80
90
Local authorities
£m
RSG
Assignment of 7% of starting rateIT

BACKGROUND TO SUPPORT CHAPTER 9 E
Lyons Inquiry into Local Government - Final Report 109
Table E13: Impact of 7 % and 28% starting rate assignment, 2007-08 and 2010 -11
Classic forecast model Optimistic forecast model
2007-08 2010-11 2007-08 2010-11
7% starting rate assignment
Range of changes -0.14% to 0.20%
-0.13% to 0.90%
-0.37% to 0.21%
-0.57% to 0.29%
34% 6% 38% 89%
Decrease in band D bills:
- proportion of local authorities affected
- average decrease in band D bill 0.03% 0.06% 0.13% 0.19%
66% 94% 62% 11%
Increase in band D bills:
- proportion of local authorities affected
- average increase in band D bill
0.05% 0.20% 0.09% 0.07%
28% starting rate assignment
Range of changes -0.55% to 0.76%
-0.51% to 3.53%
-1.45% to 0.82%
-2.21% to 1.13%
34% 6% 38% 89%
Decrease in band D bills:
- proportion of local authorities affected
- average decrease in band D bill 0.11% 0.22% 0.50% 0.72%
66% 94% 62% 11%
Increase in band D bills:
- proportion of local authorities affected
- average increase in band D bill 0.21% 0.77% 0.33% 0.27%

Lyons Inquiry into Local Government - Final Report 111
INTRODUCTION
F.1 A key aim in carrying out this Inquiry has been to engage fully with as many people as possible who use, pay for, and work in or with local government. This includes public bodies, businesses; and the third sector whose activities influence local communities, economic prosperity and well-being. As well as inviting stakeholders to submit their views to me in writing, I have met and discussed these issues personally with a wide range of people and organisations from all parts of the country. I am grateful to all of those who have taken time to contribute to the Inquiry by submitting evidence and views, both in person and in writing. All of the responses that I have received have helped to inform my conclusions and to shape the recommendations set out in the final report.
OVERVIEW OF THE INQUIRY’S CONSULTATION PROCESSES
F.2 During the first phase of my Inquiry I held nine evidence gathering events, one in each of the nine English regions, and an additional one in Wales to learn from the Welsh experience of revaluation and other relevant issues. At these events, attended by 235 people, I met representatives of local government, businesses, local Chambers of Commerce, tenant management bodies, Citizens Advice Bureaux and groups representing older people. The main findings from this period of engagement can be found in Annex C to my Consultation Paper and Interim report published in December 2005. In this Annex I will focus on the submissions I have received during the past year. For further details of wider stakeholder engagement and research undertaken by the Inquiry, please see Annex H.
F.3 There have been three main consultation periods for this Inquiry: first, covering the original remit of the Inquiry, focused on local government funding; second, covering my extended remit on both the role and function of local government and finally, following the Chancellor’s request in December 2006, consideration of the implications for local government of the Barker Review of Land Use Planning, the Eddington Transport Study and the Leitch Review of Skills.1 For further details on the third part of my consultation, see Annex G.
F.4 In January 2006, I invited council leaders and chief executives to use an interactive questionnaire, initially posted on my website, to stimulate debate with their citizens and to send me their views. The way this request was interpreted by councils was, in itself, indicative of the innovative and diverse approach to citizen engagement taken by local authorities. Methods included:
bespoke or tailored surveys using the questionnaire posted on my website;
in depth focus groups (Chester, Chesterfield, Derwentside, County Durham, Exeter, Staffordshire Moorlands, Southwark, Taunton Deane and Telford & Wrekin);
citizens or residents panels (Arun, Chorley, Easington, Devon, Stratford upon Avon and Worcestershire);
1 Summarised in my Interim Report Lyons Inquiry into Local Government – Consultation Paper and interim Report, 2005.
F SUMMARY OF SUBMISSIONS
Regional events
Open consultation
Citizen interaction

F SUMMARY OF SUBMISS IONS
112 Lyons Inquiry into Local Government - Final Report
conferences and workshops (Walsall, Cornwall);
an e-survey (Forest Heath);
a citizen’s jury (Wolverhampton);
a ‘Question Time’ event (South Holland); and
an interactive video survey (Mansfield).
F.5 Several other councils, including Canterbury, West Lancashire and Windsor & Maidenhead sent me details of their own consultation exercises, which were relevant to the Inquiry. In all, well over 6,500 people took part in these surveys, and I am grateful to all the councils involved in gathering together this information on my behalf.
F.6 I also invited councils to provide me with evidence of innovative good practice and examples of where they felt they had been placed under undue pressure by the demands of central government. I received over 100 examples of such evidence, some of which have been used as case studies in this report.
F.7 During the Inquiry, I have held smaller meetings with over 200 organisations and individuals wishing to make their views known.
F.8 I have also had contact with a number of different countries, including France, Norway, Korea, Australia and New Zealand, who were either in the process of reviewing their governance or taxation arrangements or have recently finished such a review. Additionally I received a variety of international examples of differing taxation systems many of which had some resonance and relevance to the English finance system.
F.9 Since December 2004, I have held a total of 37 information-gathering events, which have been attended by 1,405 people.
F.10 Around 2,500 items of correspondence have been received over the length of my Inquiry (including through the interactive response function on my website); more than half of which 1,653 have been formal submissions responding to the issues raised by my Inquiry. Fifty three per cent (873 submissions) were from members of the public, including 392 who stated that they were pensioners.
F.11 Apart from members of the public, the largest number of submissions came from local government itself. Over the course of the Inquiry, I received formal responses from 27 counties, 60 unitaries and metropolitan authorities, 25 London boroughs, and 93 districts. I received a number of submissions from the Greater London Authority (GLA) and Transport for London (TfL) as well as 25 from other types of authority, such as police and fire authorities. I also received responses from 20 parish councils and parish associations. Both Eastbourne Borough Council and Surrey County council, in joint submissions with their local chambers of commerce, made particularly interesting comments on the balance of control between central and local government.
F.12 I also received submissions from 25 local government organisations. The Local Government Association (LGA) and many of its subgroups including the Special Interest Group of Metropolitan Authorities (SIGOMA) and the County Councils Network (CCN), have provided a consistent and wide ranging input over the length of my Inquiry as have the Chartered Institute of Public Finance & Accountancy (CIPFA) and London Councils (formerly the Association of London Government).
F.13 Thirty-one business organisations sent submissions into the Inquiry, including the CBI and the British Chambers of Commerce (BCC). In addition to the hundreds of
International visits
Core facts and figures

SUMMARY OF SUBMISS IONS F
Lyons Inquiry into Local Government - Final Report 113
petitions received from individual hotels and B&Bs, I also received more detailed comments from 20 individual businesses including Boots, B&Q and PM Group. London First provided me with a particularly cogent case in favour of partial relocalisation and both the CBI and BCC, in particular, have provided continuous and considered input to the debate throughout the Inquiry.
F.14 I also received comments and submissions from a diverse range of stakeholders including academics, international organisations such as the OECD, third sector bodies including the Citizens Advice Bureau, Age Concern/Help the Aged, and other governance bodies such as the National Audit Office and the Audit Commission, who provided – amongst other things – some very useful insight into charging.
F.15 I am grateful for the wide range of views and opinions I received from respected practitioners and organisations and a list of all those who have responded to my Inquiry is appended to the main report.
KEY ISSUES RAISED
Role and function
F.16 Around one third (27 per cent) of respondents to my Inquiry since December 2005 commented on the balance of control between central and local government and the respective roles they should play. Views were divided on which services should be national and which local. However, education, policing and health were regularly suggested as national services, with waste, environmental and library services often suggested as having a more local flavour – reflecting respondents’ current understanding, and the findings of my research which is summarised in Annex H.
F.17 Local authorities in particular, welcomed my emphasis on their unique, place-shaping role, although it was recognised by other respondents – including businesses. Many comments centred around place-shaping behaviours such as negotiating, convening, community representation and empowerment. Councils were keen to emphasise their democratic representational mandate and the accountability and transparency this lent to their voice in partnership with others. However, there was also a call for councils to make more of consultation opportunities, providing important feedback to contributors following such exercises, particularly to demonstrate where their priorities had changed to take account of views received.
F.18 Many councils sent in examples of particular pressures on services - these were backed up by comments from the third sector and members of the public who mentioned ‘postcode lotteries’. Commonly identified themes related to new planning and licensing burdens; concessionary bus fare schemes, and pressures created by demographic changes – such as increasing immigration or an ageing population.
F.19 I received more comments on this role and function issue than on any other topic. Views were varied. Many members of the public felt strongly that there should be central funding for services such as police, fire and education:
Central Government should pay for public services for hospitals, police and emergency services. Allowing the local council to do their job with hardly any constraints. (Mrs E Bird)
Many people who have a strong sense of local identity still pine for the old boroughs and counties, whereas I strongly suspect that an increasing number of
Overview
The role of central and local
government

F SUMMARY OF SUBMISS IONS
114 Lyons Inquiry into Local Government - Final Report
people no longer define their identity in terms of locality……why not fund all these services out of the national taxes we all pay? (R Knight)
F.20 The business community and some members of the public shared the view that there was too much prescription on local authorities from the centre and that councils were generally better placed to decide on how money should be spent locally.
Even where Whitehall succeeds in devolving formal responsibility for decision making down from central government, it still often finds difficulty in letting go and allowing real autonomy at a local level. Business finds Whitehall micro-management in many areas both confusing and counter productive. (CBI)
The BCC believes that the organisation of public administration and service delivery in the UK is over-centralised in many areas and this situation has become increasingly pronounced over recent years. Overly detailed, burdensome prescription from the centre constrains councils’ responses to local circumstances. (British Chambers of Commerce)
Creating good places to live, quality public services and strong communities needs good managers who focus on the needs of the people who are regarded as individuals with valid needs that should be satisfied. Good managers can only function if given authority to act. (A Coulthurst)
F.21 In general, views both from academics and think tanks challenged current arrangements and some voiced cynicism about the desire for change in Whitehall.
…a complex and intransparent set of governance mechanisms which lack democratic accountability; and of confusion, duplication and inefficiency as new regional level bodies cut across long established relationships in policy delivery linking Whitehall and local government. The recent revival of the city-regions debate seems set only to add further complexity while also running the danger of marginalizing rural concerns. An overall assessment would be one of a policy agenda scuppered by the voters of the North East and now, in the absence of a coherent Plan B, beset by a restless, and ultimately directionless ‘initiativitis.’ (Tavistock Institute research paper)
We will get the degree of local autonomy we deserve. It is necessary always to ask how sincere is the underlying commitment to localism, versus the traditional British unitary state assumptions which emphasises national (government-in-parliament) sovereignty. I would observe that there is an instinctive centralism in much of the way British politics works, e.g. the constituency role of MPs. The emphasis on equalisation, common standards and the frequent concerns about ‘postcode lotteries’ are another aspect. (G Bramley, Heriot Watt University)
F.22 It was clear from the evidence received that many members of the public were confused about both the system of local government and local government funding
I don't understand why we have both a County Council and a City Council, and to be honest, it seems surprising and somewhat ridiculous that there are over (I believe) 150 councillors in the City Council and on top of that over 80 at the County Council. The whole structure of local and county government needs to be reformed. (Web comment )
On the issue of funding of local government this is perennially confusing for people. This year out of a net revenue budget of £11.38 million the council

SUMMARY OF SUBMISS IONS F
Lyons Inquiry into Local Government - Final Report 115
taxpayer raises only £4.61million. If you compound this with the application of different precepts (police, fire, county council and parishes) then the council taxpayer needs to be particularly studious to work out who is responsible for which element of the annual rise but also who is providing value for money. We go some way to this by a joint council tax leaflet with other partners and other clear external communications sharing where the money goes. (Wychavon District Council)
F.23 Most responses from local authorities identified tensions between central and local government. Many spoke of the frustration felt by councils at the different and often contradictory goals pursued by individual government departments. This extended to the performance regime, often seen as burdensome and over prescriptive. Local authorities were in agreement over this issue, irrespective of political orientation, region or type of council. To some (though not all) Local Area Agreements were seen as a potential solution.
Members were very critical of the one size fits all approach from central government. As an example the number of car park spaces for new housing was quoted, which fails to accommodate the needs of new developments in rural locations which have little or no public transport provision (Suffolk Coastal District Council)
To some degree this role [as broker] means that local authorities are translating different forms of national targets…into locally specific targets and local programmes of services. To make this work better, the broker role requires one single agreement between central and local government rather than several different departments pursuing their own programmes of work. In this sense, local area agreements are a helpful model, but currently cover only part of the national and local agenda. (SIGOMA)
F.24 The CBI welcomed national minimum standards as necessary to ensure that poorly performing councils did not fail their communities, it was not however thought necessary to prescribe how those standards were achieved.
The CBI would support a reduction in the number of national targets but only provided the correct incentives existed for local authorities to continue to set service standards that did more than guarantee minimum outcomes.
F.25 Many businesses debated, not so much the various levels of governance, but the lack of ‘joined up’ communication between tiers:
A major issue to be addressed in any review of local government is how the different tiers of local government are arranged and structured. Retailers often experience poor levels of co-operation between different areas of local government, particularly in planning and development. (British Retail Consortium)
The lack of delineation, in terms of what local government is responsible for and what things other levels of government or public bodies are responsible for undoubtedly contributes to pressures on local government. (British Chambers of Commerce)
F.26 Most council submissions discussed aspects where they felt centralisation had particularly impacted upon their role, this included: the removal or diminution of local powers; the limiting of local discretion, the subordination of local to national priorities;
Central/local relations

F SUMMARY OF SUBMISS IONS
116 Lyons Inquiry into Local Government - Final Report
and the increasing central prescription of how local services should be delivered. These concerns were also reflected to a lesser extent by businesses, academics and other bodies.
There is only a limited extent to which we can develop our role, reform our local structures or make decisions about our delivery commissioning and public involvement arrangements before we have a clear steer on the extent to which central government is prepared to reform its own structures. (Wolverhampton City Council)
We are strong proponents of the principle of subsidiarity and believe that local democratic accountability is an important driver to reversing the increasing sense of powerlessness that flows from decision making concerning many local public services being increasingly in the hands of national agencies and public bodies which do not have a local mandate. ( Kent County Council)
F.27 A number of council responses felt that they had experienced increasing disempowerment which they suggested was best exemplified by the new or additional ‘regional’ layers of government such as the regional bodies and government offices. Surrey County Council’s view, which was from suggested that they were “An added supervisory layer rather than an added value layer.”
F.28 However, there was a marked difference in perception between the elected Greater London Authority and other regional assemblies, perhaps due to its unique powers and funding flexibility. The GLA and Transport for London in particular identified areas where they felt they were ‘adding value’ across London due to their clear role, budgets and extended powers. Other regional bodies did not express such views, although they did provide some good examples of innovative partnership arrangements originating from within these bodies.
F.29 Many councils commented on their relationship with the centre, often feeling their role had been increasingly relegated to a ‘delivery agent’ for national priorities.
Given a simplification of national controls, the Council would be much better placed to take ownership of local choices and manage expectations. (Harrogate District Council)
F.30 Several respondents suggested areas for reform to address issues raised on central/local relations. A number of commentators supported the idea of a contractual approach between central and local government. It was suggested by the Local Government Information Unit (LGIU), amongst others, that the principles within the European Charter for local government might be used as a basis for such a contract.
We believe that a contractual approach is the only way to guarantee the level of autonomy and flexibility that councils require to deliver key elements of their place shaping role, such as the prioritisation of resources, managing economic change, and addressing local needs and preferences. (Institute of Public Policy Research)
It would demonstrably improve local governance if there were a clear statement of powers in the form of a written settlement between central and local government specifying the power, responsibilities, duties and freedoms of each of the signatories. (Greater London Authority)

SUMMARY OF SUBMISS IONS F
Lyons Inquiry into Local Government - Final Report 117
F.31 Devolution to the most appropriate level was felt by many to be a key concept in any solution.
An important issue is critical mass. For some services regional groupings or responsibility are more appropriate. Some balance is needed in having sufficient responsibilities to exercise leverage and achieve economies of scale while not being so large that local democracy is undermined. (National Audit Office)
F.32 I also heard a great deal on general ‘governance’ issues especially extolling the value of formal or informal neighbourhood arrangements from bodies such as the New Local Government Network and the Young Foundation. Above all, what struck me in these arguments was that they clearly demonstrated that ‘one size fits all’ was not an option that could reasonably be pursued.
F.33 Some businesses, including the CBI (quoted below) supported the formal recognition of local government as a convenor of local services to enable it to fulfil its place shaping responsibilities:
…[its effectiveness] as a convenor would be enhanced by a formal duty on all local public services to co-operate with the local authority…Using their local knowledge and ability to bring all local partners together, local government has a strong role to play as a commissioner of services.
F.34 Submissions highlighted two key aspects of the convenor role, firstly, in terms of strategic leadership underpinned by democratic accountability, bringing various partners and stakeholders together; and secondly, in terms of local scrutiny, whereby local councillors can hold to account the actions of other agencies in delivering services to their citizens. It is noteworthy that respondents overwhelmingly saw the Councils’ convening role as embracing all partners who contribute to public service outcomes - without distinguishing between public, private or third sector organisations.
Members must lead, shape and develop and then take things forward on behalf of communities…. enabling, empowering and working with local communities to make change happen. (Association of North East Councils)
We … support the principle of elected representatives monitoring and scrutinising the local delivery of public services in addition to strengthening and redefining the role of backbenchers and opposition members as reflecting the voice of the local community. (Hertfordshire Council Council)
F.35 Anticipating the Local Government White Paper Strong and Prosperous Communities published on 26th October by the department for Communities and Local Government, a number of submissions, such as the following by the LGA, suggested that a statutory duty to cooperate would be helpful.
In the wider role as outlined by LGA it would be helpful to have the duty to co-operate to ensure a co-ordinating, planning and scrutineering role across a variety of relevant agencies.
F.36 However, this was not a view reflected by everyone - other respondents suggested that a call for a statutory duty would be an admission of failure and might be counter-productive in practical terms.
Greater responsibility for local services could be engendered by more freedom to deliver outcomes, rather than focus on inputs and output measures. A contractual
Partnership working

F SUMMARY OF SUBMISS IONS
118 Lyons Inquiry into Local Government - Final Report
approach would be potentially restrictive, and act against engaging the community on local priorities. (Basingstoke & Deane District Council)
F.37 Others, called for the convening role to be devolved to the most appropriate level of governance;
To build more constructive relationships between representative and participatory democracy and between strategic and local community governance, for instance by encouraging frontline councillors to join neighbourhood bodies, starting conversations about the devolution of council budgets and services and connecting local plans into larger strategies in a context where subsidiarity is not always easy to define. (Young Foundation, Transforming Neighbourhoods)
F.38 Some councils expressed the view that steps towards more meaningful devolution had been taken with the decision to back Local Area Agreements, although they expressed some concerns over progress currently being made, calling for further action to address effective partnership working and pooling of budgets.
A system of devolution would need ……checks, because public pressure can be created by the media and the disproportionate influence of vociferous minorities. (Bournemouth Borough Council)
It seems to us that the theory of balancing local and national requirements and targets has been developed in LAAs. The problem is that LAAs have not been implemented yet according to that theory. An analogy can be drawn with staff or community empowerment: if there is no true devolution of power, then there is no real empowerment. The principle of ‘earned autonomy’ again is a sound one that is yet to be put into practice. (Darlington Council)
F.39 There was support, for setting wider priorities in certain areas, especially where they were felt to lead to more effective collaboration between authorities:
There are some functions which have clearly benefited from a strategic perspective across Local Authority borders, such as housing allocations and transport infrastructure. (Southampton City Council)
There will never be sufficient funding for all economic development schemes to be realised and therefore collaboration across boundaries and prioritisation is crucial. (England’s Regional Development Agencies)
F.40 Some wrote to me extolling the role parish councils had to play in partnership working and service delivery although others emphasised that training and other support would be needed to enable town and parish councils to take on this role.
I hope the Inquiry does not overlook the work of the town and parish councils in supporting delivery. A general power of well-being for quality status town and parish councils can only aid delivery of services. I would recommend the restriction to quality status parishes so that there is a level of comfort and accountability in this extension. (Web comment)
I would suggest that if power is to be devolved downwards, that before such action is taken town and parish councils are required to have in place the infrastructure, training and necessary personnel to undertake the new status. (M. Retallick)

SUMMARY OF SUBMISS IONS F
Lyons Inquiry into Local Government - Final Report 119
Place-shaping – a wider role for local government
F.41 Since I first discussed place-shaping in my May report, this term has had resonance with many respondents including local authorities themselves and I am particularly pleased that councils have found this a useful way of articulating their key, but not always acknowledged, strategic role. Members of the public have also acknowledged the effective role often played by local government in its place-shaping function of representation and engagement with its communities, together with its wider role of maintaining, and in some cases regenerating, communities through planning, infrastructure and long-term strategy.
The definition of ‘place-shaping’ set out in the Report is particularly useful in its approach to identifying the more ‘intangible’ or difficult to quantify roles of local government. This is especially important in urban areas, where economic, social and environmental prosperity is overseen and facilitated by local authorities. (Bradford Metropolitan Borough Council)
F.42 Many businesses have also told me that they welcome the opportunity to work closely with local authorities in developing the place- shaping role.
Local authorities and businesses are vital to each others’ success and have a common interest in the formation and realization of any local vision and place shaping . (British Chambers of Commerce).
F.43 Many councils commented on their capacity to harness an understanding of local needs with their strategic ‘influencing’ abilities and to catalyse sustainable economic development. Others identified the need to develop skills for place-shaping and to support capacity building amongst local authority members and officers in addition to LSP chairs and leading players;
We believe that the place-shaping role of local government must include three additional characteristics: the power to tailor funding streams to local circumstances; a commitment to asymmetric devolution; recognition that place is not constrained by local authority boundaries. (Institute of Public Policy Research)
Local authorities and their key stakeholders at city region, sub regional and regional level need to be supported to ensure we have enough people with the skills and knowledge to deliver the ambitious place shaping role for local government. This place-shaping role is an integral part of building and maintaining sustainable development. (Academy for Sustainable Communities)
F.44 The important role of locally-elected councillors, including non-executive or frontline councillors, in helping to shape the communities they represent was highlighted in a number of submissions. Several council respondents spoke of the important if difficult place-shaping role of balancing – and arbitrating – competing priorities and demands.
Accountability
F.45 Many respondents recognised the unique position held by local authorities in terms of their democratic mandate and expressed the need for councils to reconnect and re-engage with citizens to improve that mandate. Some expressed concern about the increasing numbers of unrepresentative bodies carrying out public functions without any public scrutiny:
F SUMMARY OF SUBMISS IONS
120 Lyons Inquiry into Local Government - Final Report
More value has to be placed on the richness that elected Members can bring. They can represent interests better than most other mechanisms, they can interpret opinion, they can lead opinion. They add character, personality and vigour to the act of governance. We have to use the richness that the political process brings; not try to sanitise it or sideline it. (Crewe & Nantwich Borough Council)
Councils have the only direct local mandate in relation to decision-making and service delivery within their communities…..The ballot box brings accountability and, just as important, the ability for local people themselves to take part in the place shaping by becoming councillors. (St. Edmundsbury Council)
More frequent elections would be important: the governing party ought not to be able to sit back and think it is safe for four years, and all councils should have elections each year for a third or a quarter of the seats. Proportional representation would be important too. (Web comment)
In recent years, housing investment has increasingly moved away from local authority stewardship towards sub-regional and regional allocation, and administration processes. This has achieved some notable delivery improvements but at the expense, in some instances, of robust local authority involvement. (London Councils)
F.46 Improving the skills, role, and accountability of frontline councillors was emphasised by many commentators as vital in enabling local authorities to achieve a real understanding of the ‘place’ they represent.
Today’s Cabinet system creates a few ‘super councillors’ but leaves the remainder serving on, perhaps, just one committee. They cannot gain experience or wisdom – except in one tiny area. (N. Fisher)
There is a widely recognised issue around the willingness and capacity of locally elected councillors, especially those with other jobs, being able to fulfil increasingly demanding and complex roles. (East Sussex County Council)
Strategic leadership exercised through democratic institutions must be underpinned by thriving democracy…..The council of the future needs to be, and perceived, as having sufficient influence to attract high calibre candidates who want to and are committed to making a contribution. (Association of North East Councils)
Engagement
F.47 Despite receiving several good examples of public engagement, many submissions felt local councils did not currently make best use of their consultation opportunities. Some particularly commented on the lack of feedback, and were often unable to demonstrate the results of consultation exercises, which would provide the benefit of making decisions more transparent and perhaps more acceptable to local citizens. While many I spoke to called for a greater involvement by ordinary citizens with their council, the inability of many authorities to accurately reflect back the outcomes of participatory exercises seems to have affected trust in the process and perhaps even led to an increase in public apathy. Other responses stressed the need to clarify who was responsible for which service in order to improve local understanding – which some felt may also improve perceived fairness.

SUMMARY OF SUBMISS IONS F
Lyons Inquiry into Local Government - Final Report 121
We believe there is scope for better communication and engagement with residents to demonstrate the local choices on offer. (Age Concern)
My reason for writing is to reinforce….the need to involve ordinary citizens far more in service, design, planning, delivery and review (Better Government for Older People)
Participatory processes at the level of individual parishes & communities, such as local Landscape Character Assessments, Parish Plans, Village Design Statements and Village Appraisals should be given more encouragement in national planning policy. (Council for the Protection of Rural England)
F.48 Many councils identified important steps that they were making in this area and I received various examples of innovation such as role playing exercises, regular e-surveys and youth parliaments.
F.49 Submissions from most third sector bodies reflected on the uneven nature of their partnership with local government feeling a lack of engagement; affected the vital part they felt they could play if given the opportunity:
Voluntary and community organisations play three very important roles: they provide information and give advice; they enable people’s voices to be heard and they provide activities or services. (National Council for Voluntary Organisations)
F.50 Submissions and comments received indicated that business would also welcome the opportunity for more meaningful engagement;
Although businesses do engage locally – and would welcome further opportunities, the present system discourages participation – business sees local consultation as being little more than a ‘talking shop’ with little real power to turn aspirations into reality. (Boots Plc)
We are convinced that the right engagement between businesses and elected members is the vital ingredient of an effective balancing of the needs of business and economic growth on the one hand and those of the community benefit on the other. (South Bank Employers Group)
Business is keen to see far more constructive links between local authorities and local businesses and believes that consultation is insufficient when, in practice, there is no leverage or redress. Also, most mechanisms/partnership structures used to engage business in London are not ‘business friendly’. Informal structures may often be more effective if there is a genuine desire to consult. (London First).
F.51 I received a wide variety of comments on ‘neighbourhoods’ and ‘community engagement’. John May at the Metropolitan Police Authority suggested that, as demands on our communities to engage intensify the numbers of people able to demonstrate that commitment decrease thus leading to an increasing devaluation of the views received from ‘the faithful few’. Other commentators suggested effective engagement was a continuous process – a two-way conversation – and should involve not only geographical communities but ‘communities of interest’. Thought also needed to be given to time, place and level of engagement, dependent on the outcome required.
During the reorganisation of local government in the 1990s, efforts were made to assess local identity. Driving factors were found to be the characteristics of people themselves – such as the length of stay in the area – rather than characteristics of

F SUMMARY OF SUBMISS IONS
122 Lyons Inquiry into Local Government - Final Report
the spatial areas, such as whether it had a culturally and historically distinct identity. (Joseph Rowntree Foundation)
Co-production
F.52 The idea of ‘active citizenship’ where people become more dynamically involved in their communities is an issue in which increasing interest is being shownas one way in which citizens can become more empowered and engaged with their communities and where local government has a role to play.
The responsibility is not just to ‘lead’ but to actively co-create with its communities the objectives to which that leadership must be applied. (Clive Grace, SOLACE Imprint Article)
F.53 Co-production was not an issue commented on directly in many responses to my Inquiry. However it was recognised, particularly by third sector bodies, that much more needed to be done to engage service users in the design and delivery of services.
Communities should be involved from the outset, they should be given the opportunity to identify their concerns and priorities, and be given opportunities to help design solutions. (National Council for Voluntary Organisations)
Managing pressures
F.54 There was recognition from many quarters of the multiple pressures that local government faces today and the fact that these often result in the ‘crowding out’ of local priorities. Three sets of pressures were most frequently identified by local government respondents these were; rising public expectations, increasing regulatory burden particularly through performance management, and demography. Many councils expressed the view that whilst they set great store by meeting the high standards expected of them, they were consistently restricted by external pressures – funding levels; tighter regulation; higher standards; and national priorities having to take precedence over local preferences. Many commented that these pressures often impede progress and stifle innovation and ambition. Unison also commented on the impact of these pressures on the lives of front-line workers.
Local government can listen to local people but it is hamstrung in its ability to respond to those views. This makes people feel local government does not listen or care: the truth is it does not have the combination of freedoms and powers to do as many of the significant things as people would like or need. (Eastbourne Borough Council)
We recognise that local authorities are facing significant pressures – from users of services, from targets and performance systems and in some cases from central government in terms of funding commitments made nationally. (CBI)
Day-to day pressure comes from constant change and user expectation on the one side and limited resources, lack of investment and uncertainty on the other…. [there is] evidence of the stress this causes members, on top of the violence and abuse faced by members on the front line. (UNISON)
F.55 Councils frequently cited the pressures created by the rising numbers of people aged over 85, at a time of low annual increases in central financial support for social care services, coupled with a desire for greater investment in preventative services.

SUMMARY OF SUBMISS IONS F
Lyons Inquiry into Local Government - Final Report 123
There was also concern that the use of inaccurate or outdated population data could result in under-reported demand for services.:
Take for example the demographic pressures we have in Shropshire. We have a rapidly growing population of elderly and very elderly people and falling pupil numbers in our schools. The recent Settlement gave a rise of 6.7 per cent to schools and 2.1 per cent to all other services. From an economic perspective, we are not getting the same utility from that last £1 million spent on schools as we would if we were free to make the choice to spend it on services for older people that can keep them at home and out of expensive hospital places. (Shropshire County Council)
F.56 Other significant pressures mentioned included the huge investment expended by council staff to prepare and respond to heavy performance regime requirements, which were felt to distort council priorities.
We need a joined up government agenda that effectively rewards high performance, incentivises ongoing improvement, and addresses the massive costs to councils of monitoring and inspection, to enable a step change in service delivery. We need a risk based inspection regime based on local agendas, increasing capacity in local government to focus on improvement activity; with the removal of micromanagement of local services from the centre. (West Midlands Local Government Association)
F.57 Members of the public tended to see pressures on services in terms of a ‘postcode lottery’, whereas councils provided examples of what they considered to be partially or crudely funded mandates. Councils also argued that the heavy regulatory assessment burden placed on them and the length of time spent preparing for various specific grant bids, resulted in less resources available for longer term strategic issues such as place-shaping and services that people and communities really want.
Much of this pressure on resources comes from detailed prescription from external sources. Such detailed prescription over targets and service provision and grant conditions continue to be an unnecessary diversion. (Association of Police Authorities)
F.58 There was some acceptance across the range of submissions, especially from councils, that it was unrealistic to expect unlimited funds for every service to be provided equally, especially when communities’ needs differed. Indeed, many councils felt that allocation of funds in the most effective way for their community - including making some difficult choices - was part of their place shaping role.
Emphasis on the distinctive identity of localities is an enormously welcome counterweight to daily ‘postcode lottery’ stories. It is not possible for everything to be as good as the average and it is certainly not affordable.(Royal Borough of Kensington & Chelsea)

F SUMMARY OF SUBMISS IONS
124 Lyons Inquiry into Local Government - Final Report
FUNDING AND FINANCE ISSUES
Overview
F.59 Most submissions from councils and other organisations received after December 2005 related to the role and function of local government, although some respondents continued to stress the importance of funding reforms. Overall, there was a greater emphasis on the fairness of council tax from the perspectives of those who pay it, rather than more technical issues around bandings and ratios, although those issues were still emphasised by some as being necessary to ensure that council tax remained ‘fit for purpose’. In the absence of better alternatives, many respondents seemed to consider the critical task be to mitigate those aspects of council tax that continue to contribute to its unpopularity.
F.60 The most frequently raised issue by members of the public was council tax, commented on by 426 (70 per cent) of respondents, many of whom were pensioners. The majority were keen to highlight what they perceived as the unfairness of council tax on those who were asset rich but cash poor. Overall, 75 per cent of people who commented on council tax wanted to see it amended while 24 per cent wanted to see it abolished and replaced by a system of national income tax. Just one per cent wanted to see it retained in its current form.
F.61 Many other respondents, including councils and voluntary organisations as well as individuals, felt that the way in which eligibility for council tax benefit was calculated – and especially the savings limit of £16,000 was no longer equitable and contributed to the perceived unfairness of the tax.
F.62 Most council responses remained broadly in favour of some form of relocalisation of business rates. National business organisations remained formally opposed, however there appeared to be increasing calls by business for local government to be engaged in a meaningful dialogue with them and better able to respond to business needs. Some individual business submissions suggested that – providing suitable safeguards were in place – a percentage of the business rate could usefully be returned to local government in the pursuit of investing in infrastructure, economic prosperity at the local level.
F.63 Many suggestions from stakeholders were received on how local government might raise funds, ranging from charging for waste, extensions to congestion charging schemes, introducing local tourism and sales tax, land value taxes or workplace parking charges, exploiting S106 and planning gain more effectively, to rationalising council tax exemptions and discounts.
F.64 The question of how to ‘rebalance’ funding between central and local government was also raised primarily by local authorities, policy organisations and businesses. No simple solutions were proposed, although issues around trust between central and local government to use funding appropriately by abolishing capping and reducing the number of ring fenced grants were common themes.
F.65 There was however, increasing acceptance across the range of submissions that it was unrealistic to expect unlimited funds to be provided to ensure the same high standards across every service, especially when communities’ needs differed. Indeed comments from many councils over the course of this Inquiry stressed that the effective allocation of funds within their communities - including making some difficult choices -

SUMMARY OF SUBMISS IONS F
Lyons Inquiry into Local Government - Final Report 125
was part of their place-shaping role, which was being constrained both by central government targets and limited flexibility in how money was both raised and spent.
Council tax
F.66 As discussed above, most comments from individual members of the public expressed concerns relating to the fairness of council tax particularly in terms of ability to pay. This group comprised many pensioners and carers, a number of whom had been encouraged to write by organisations, wishing to see council tax abolished and replaced by a system of national taxation. Others struggled to find comparisons between property value and service use and suggested that a return to the community charge or ‘poll tax’ would be more equitable.
I pay out 20 per cent of my income in council tax, and that’s even with the 25% reduction for sole occupancy (P Neale)
Council tax is…a selective poll tax. The better off you are, the less you pay proportionally and the less significant the tax becomes. It is a tax deliberately designed to increase the gap between the rich and poor. (CL Morris)
I think it is grossly unfair that council tax should be based on the…. value of a persons house. For example I have a quite a valuable house locally, yet my income is quite low. People living close by in exactly the same house with more people living in their houses pay the same council tax as I. (P Martin)
Council tax must be reformed before any thought can be given to the reform of local government as a whole. It must be based on ability to pay and fairness. (M Glass)
F.67 Citizens Advice Bureau (CAB) made a telling comment that eight per cent of their total debt enquiries related to council tax debts. They suggested that the harsh penalties used for recouping such arrears were out of step with other repayment mechanisms and suggested a number of reforms to council tax legislation on enforcement and collection. These included: a requirement for local authorities to check there were no outstanding claims for council tax benefit; not to let years of arrears build up before starting action; to allow deductions from income support and/or jobseekers allowance to pay council tax arrears and that councils should not use multiple forms of enforcement to recover council tax debts.
Council tax benefit
F.68 Submissions on the subject of Council Tax Benefit focused on the need to reform the system to avoid council tax falling into irrevocable disrepute. Many, including councils and voluntary organisations argued that that the way in which eligibility for council tax benefit was calculated – and especially the savings limit of £16,000 - was no longer equitable and contributed to the perceived unfairness of the tax.
A bequest last year took my savings over the £16,000 limit, the income from which is deemed to cover comfortably average living expenses. …. depleting ones savings to meet the tax reduces future income, which calls for more depletion, which further reduces income and so on until one is so impoverished that an appeal must be made for housing benefit and council tax relief. (H Ferguson)

F SUMMARY OF SUBMISS IONS
126 Lyons Inquiry into Local Government - Final Report
F.69 A number of older people’s organisations stressed the urgent need to review the current system of exemptions, discounts and disability reductions. Their view – shared by the Citizens Advice Bureau - was that it was essential to improve take-up of council tax benefit by making council tax reductions more automatic.
The latest figures from the Department for Work and Pensions show that up to as many as two million pensioners are not receiving their entitlements to council tax benefit, amounting to £1.1 billion in unclaimed benefit (National Pensioners Convention)
F.70 However, pensioners were not the only individuals who wrote to me voicing their concerns about the council tax benefit system. I received a number of submissions from carers implying that, whilst they had chosen to become a carer, some of the benefits they received seemed to cancel out other potential. I also heard similar views from disabled people;
Since starting to look after my mother…I lost my single occupier’s reduction and although I have an underlying entitlement to carers allowance, my caring for my mother has cost me my job, my council tax reduction benefit and my freedom…..My mother does get the lower rate attendance allowance, but this is hers, not mine. (Ms H Hook)
If I had a room dedicated to me because of my disability and used only by me then I would get 25 per cent discount. If I was to divorce my wife and live [separately] I would get 25 per cent discount.…There must be many thousands of us who are in this position we can’t work due to disability…the whole benefit system needs to be simple and not discriminate against the disabled. (M Faccini)
F.71 There was no clear consensus, but options to improve benefit take-up proposed to the Inquiry included: rebranding it as a rebate or discount; standard pensioner household discounts; changes to capital thresholds, and streamlining and simplifying the process by which council tax benefit was claimed, perhaps by linking it to other benefits or discounts.
A high priority needs to be given to improving the take up of council tax benefit, including examining ways in which the benefit system could be translated into a rebate, which does not require individuals to submit claims. Consideration should also be given to raising the savings limit for pensioners as the current system discourages individuals with relatively low retirement incomes from saving for their old age and seeking to maintain their independence. An alternative approach would be to introduce a flat rate council tax discount for all pensioners. (Hampshire County Council)
A significant step in increasing equity in council tax is to rework the council tax benefit system so as to improve the take-up of qualifying taxpayers. Reducing the complexity of the application process is key, and small improvements such as changing its name may also assist. It would be more appropriate to automatically give the benefit to those who are deemed eligible. (London Borough of Camden)
F.72 A significant majority of councils, endorsed the findings from my earlier research and modelling, regarding improvements to the structure and operation of council tax benefit as being key components in a package of measures to improve the perceived fairness of council tax and to reduce hardship.
SUMMARY OF SUBMISS IONS F
Lyons Inquiry into Local Government - Final Report 127
Council tax discounts and exemptions
F.73 A number of students and student bodies wrote in favour of retaining the student exemption for council tax – particularly citing the introduction of student loans and course fee charges as reasons. However, a significant number of non-student respondents felt that, as relatively heavy service users, students or their landlords should make some contribution.
We have a substantial student population, many of whom are housed in private accommodation where the landlords are exempt from paying council tax, these students have access to all the amenities provided by those of us who pay and I feel it is high time these properties were taxed. (J Gater)
[People like me]….are in effect subsidising people who are quite capable of paying council tax from income and profit from letting. (K Grindel)
F.74 Some members of the public commented on the disparity between the treatment of empty properties and second homes and it was suggested that if this were changed it might act as a catalyst to encourage more empty homes to be brought back into use.
F.75 Others wrote to say that second home owners should not receive a discount on their council tax as they were driving up prices and preventing local people from buying properties in desirable areas. However, a few submissions from the tourism industry suggested that care needed to be taken to differentiate between private holiday homes and bespoke holiday centres.
Revaluation
F.76 Many members of the public wrote expressing concern about the impact of revaluation, although it is true to say that there was some degree of confusion about how this would work. Many people had unfounded fears that the rise in property values since 1991 would mean that all properties would move up council tax bands (in fact the band margins would have to move themselves to reflect changes in the property market since 1991). However these are complex issues and it is understandable that people were uncertain about what revaluation would mean for them. There was also general recognition that any form of revaluation would inevitably provoke a great deal of adverse publicity.
F.77 However, most of the comments I received from councils and other organisations recommended regular revaluations to maintain the integrity of the system.
Periodic revaluation is probably necessary to maintain the credibility of the council tax base, and we would prefer to see a regionally based system to address horizontal equity for taxpayers living in similar properties. (London Borough of Havering)
Whatever system of local taxation is used, it is important that the local tax base is updated at periodic intervals so, the longer the delay in updating the council tax base the more difficult it will be to manage the outcome (Cumbria County Council)
F SUMMARY OF SUBMISS IONS
128 Lyons Inquiry into Local Government - Final Report
Revenue equalisation
F.78 Many respondents to my Inquiry recognised the importance of equalisation - the process by which central government takes account of the different needs, resources and costs of providing services in different areas - to enable each local authority to provide acceptable levels of services. Many of the more recent submissions continued to underline the point that changes were needed to make the system fairer and easier to understand.
A basic principle needs to be established that equalisation should be linked to spending levels that the Government is willing to support. It is reasonable to expect additional spending determined by the local authority in excess of the levels supported by Government to be financed by local taxation. (Hampshire County Council)
Some form of equalisation is important but the way and the extent to which this is achieved should be revisited. The system is complicated, primarily because of the complexity of the relative needs formulae. A grant without a needs element would be simpler but would also lead to large disparities between authorities and unacceptable increases in local taxes….The dependency which full equalisation creates needs to be redressed. It is acknowledged that in moving from the current to the new position the appropriate transitional scheme would be required. (Local Government Association)
Local income tax
F.79 My original remit asked me to explore the option of a local income tax (LIT) more closely and many members of the public have continued to comment on this issue, suggesting that LIT would offer a more equitable way of raising money than council tax.
I am personally against local government being funded by the council tax based on the value of one’s home …..HMRC has details of the addresses of all UK taxpayers, so I suggest that a local tax is deducted from an individual’s income, which is then automatically transferred to the local authority responsible. (Dr R Williamson)
F.80 However, the vast majority of Councils who have written to me remained opposed to a local income tax. Reasons given ranged from the complexity and additional transactional costs arising from collection, to serious doubts about acceptability amongst those who would be liable to pay it. Very few businesses made any comment about personal taxation systems although both B&Q and Boots highlighted the administrative difficulties of implementing a LIT.
A local income tax would only be local if local authorities set tax rates, bands and allowances. If this were to occur the tax would become enormously difficult to manage and administer for both the Inland Revenue and employers via the PAYE system. (Boots Plc)

SUMMARY OF SUBMISS IONS F
Lyons Inquiry into Local Government - Final Report 129
Business use of local services and business rates
F.81 Much of the debate about who should pay for services continued to focus on whether to relocalise business rates. Most business organisations and businesses’ submissions remained formally opposed to relocalisation, although there was an increasing acceptance that local government needed to be engaged in a meaningful dialogue with business. Local chambers of commerce and businesses were more ambivalent, with some in favour of some form of localisation;
We consider that there would be no significant ‘re-engagement’ of major national businesses with individual local authorities from re-localisation. Although property may be a local asset, the majority of value represented by this asset is occupied by businesses that are competing in a national or global marketplace. (B&Q)
We would wish to see the return to Surrey County Council control of the business rates. This would give the business community a stake in the county and enable it to express its views about the balance between tax raising and investment. For example, businesses would be empowered to argue for an increase in the business rate on the understanding that the proceeds would be invested in measures to reduce congestion (Surrey Chamber of Commerce)
In the event that a supplementary business rate be introduced it is vital that such a levy be clearly labelled as additional funding, ring fenced to be spent only on agreed initiatives of benefit to business, and measured against clearly defined evaluation criteria. (British Retail Consortium)
F.82 Over half of the councils who responded to my Inquiry said that they were in favour of relocalisation. However there was no consensus on how this should be achieved. Most spoke in favour of it being linked to closer partnerships with the business community and many suggested some degree of ring-fencing of income raised from local business rates to local economic development activities. Others suggested local additions to the business rate commensurate with their business purpose, for example, based on turnover or use, and linked to the impact on local services, such as a waste surcharge for businesses generating large amounts of refuse.
The council considers the business rate should revert to a local tax in order to restore the linkages between local councils and business ratepayers. This would enable councils to engage businesses in meaningful dialogue about how their rate payments would best contribute to local investment that supports continued economic growth. (Surrey County Council)
We believe that local business rates should be returned to local control with a mechanism for business to hold local government to account. (London Borough of Havering)
F.83 I also received a submission from the GLA arguing for the total return of business rates raised in London to the Authority, in exchange for cessation of grant funding, which they felt indicated a more transparent and equitable ‘balancing of the books’ for the area. It was suggested that a percentage of this sum could be returned, through equalisation, to each borough.
[This would] increase local flexibility over financing of infrastructure to enable the capital to meet the high level of investment required to support its economic and demographic growth. (Greater London Authority)

F SUMMARY OF SUBMISS IONS
130 Lyons Inquiry into Local Government - Final Report
F.84 Other authorities however, many of which currently benefit most from the equalisation process, were less keen to see total relocalisation unless some checks and balances were put in place.
Whilst the idea of having local control of business rates leads to improved visibility in taxation there is a need for stability. Redbridge does not have a high business rate tax base and therefore collects less in business rates than it receives from the Government via the redistribution mechanism. ….Any new system of controlling business rates locally in Redbridge would require that rates are kept up to date with cost pressures. Should local control of business rates be subject to equalisation then Redbridge should in principle be in favour. (London Borough of Redbridge)
Business Improvement Districts (BIDs) and Local Authority Business Growth Incentive (LABGI)
F.85 I received mixed views about Business Improvement Districts and Local Authority Business Growth Incentive mechanisms. These were regarded by many local authorities as offering a potentially useful incentive for developing partnerships. However, their complexity, and limited scope and timescales for operation had created uncertainty about their overall effectiveness and many considered the benefits to be unpredictable. Business respondents tended to agree that these offered a new working relationship with their local authority but also considered that short-term thinking, limited scale and constrained and complex processes had limited their effectiveness.
BIDs and LABGI are welcome relaxations of restrictions but are too marginal and hard to forecast to be effective in changing behaviours and budgets. (Royal Borough of Kensington & Chelsea)
We welcome the scope to raise additional monies through schemes like BIDs and LABGI, and believe they are a step in the right direction but are complex and only provide relatively small amounts of funding…However our overall view is that that the scheme has been a success. (Leeds City Council)
Other potential local taxes and charges
F.86 Many stakeholders presented options for alternative sources of finance for local authorities although there was little consensus about what form these should take and which services they should fund. Surrey County Council, in a joint submission with the Surrey Chamber of Commerce, made a case for a local sales tax on fuel. Other councils, whilst acknowledging that they were constrained by diminishing revenues and rising expectations, felt that trying to increase income from fees and charges would provoke public and media hostility without necessarily providing any additional flexibility or freedom of spend.
Notably our three year Local Public Service agreement ended in March 2006 without the promised freedom to use parking income ever materializing. (Royal Borough of Kensington & Chelsea)
Other sources of income should be developed where possible: congestion charging (linked to improvements in public transport), taxes for non-domestic off-street parking spaces (which would also be a tax on out of town retailing, and an encouragement for more local shops), and possibly local [bed/night] or sales taxes. (Andrew Coulson, INLOGOV).
SUMMARY OF SUBMISS IONS F
Lyons Inquiry into Local Government - Final Report 131
….additional sources of income to fund public infrastructure including, retention of a proportion of business rates, local additional levy on business rates; tourist taxes (for example a hotel bed tax) to support specific tourist related capital investments such as a new arena or a concert hall. (Leeds City Council)
F.87 During the course of my Inquiry, the increase in representations on issues such on council tax and waste charging following widespread media coverage was striking. This illustrates the power of the media in raising awareness and initiating public debate. One or two respondents have also commented on this and suggested that greater use should be made of the local media to improve local accountability.
The media is by far the most important conduit for communication beyond the level of personal networks. A lively, informative and engaging local media-both press and broadcast- is critical to stimulating an informed debate about local politics…the media is powerful-any consideration of how the accountability of local government might be improved could usefully consider its role. (member of public )
F.88 I received a great deal of correspondence on the possible introduction of a blanket tax on tourism. Over 500 individual businesses sent proformas to my Inquiry opposing this and ‘Caterer and Hotelkeeper’ organised a ‘say no to bed tax’ petition with 4028 signatures. I also received correspondence from larger organisations such as Butlins, Travelodge and Pontins as well as tourism representative bodies.
F.89 Some who wrote to me were opposed to a blanket tourist tax, believing that the impact would generally be felt by those least able to afford it.
A bed and breakfast levy….could only be achieved by excluding the smaller (say under 30 beds) establishments, because lower income guests would be prohibited from taking holidays in this country…and any increase in UK holidays would mean some pensioners would have no holidays at all. (Mrs T Amphlett)
Tourism in the UK is already a highly competitive and highly priced business with tourists to the UK already paying a higher level of VAT than other countries, more than three times than in France and twice the European average of 8.5%. The introduction of further taxation would have a significant effect, resulting in a decline in the number of visitors to the UK. (Christchurch Borough Council)
A more amicable and fair approach would be to ensure that a proper proportion of the existing tax take and, in particular, business rates generated by all businesses benefiting from the visitor, was paid to, and retained by, the local authority. (British Resorts and Destinations Association)
F.90 Opinion amongst councils was more divided – some areas which attract visitors, favoured the introduction of some form of tourist tax whilst others opposed it.
F.91 I also heard mixed views about sales tax; some organisations believed that it would lead to distortions in the market, whereas others felt that, given flexibility, it could be a viable option.
It would create huge distortions in local markets, driving consumers seeking lower prices across local authority boundaries. (British Retail Consortium)
Local authorities have responsibility for too small a geographical area to be able to set a sales tax without distorting the market. A sales tax would also present a further compliance cost, one that varied across 350 areas. (Boots Plc)
Tourism tax
Sales tax

F SUMMARY OF SUBMISS IONS
132 Lyons Inquiry into Local Government - Final Report
We propose a new power to levy a small local tax on petrol from all forecourts in the County…A tax of 1p per litre of fuel would raise approximately £7.5M, which could be invested in measures to reduce congestion. (Surrey County Council)
F.92 There was some support from the public for a sales tax to replace council tax as it was felt that fairness would be improved because those who ‘consumed more’ would pay more.
A tax [of]….maybe three or four per cent on all goods at the till… has several attractions …everyone pays… It would be simple and cheap to collect. It would not affect the shopkeepers’ profit or turnover. The rate need not go up at all, once it had been decided. Each council could set its own rate, and would have to be careful not to pitch too high, as this would drive the public to another area to shop where the tax was lower. This would lead to competition between councils to keep costs down. (C. Scriven)
F.93 Waste charging was a matter of concern for many who commented, especially following media reports about ‘bin tax’ and other attempts to improve recycling over the course of my Inquiry;
… European countries who already have this charge in place, …do not pay as much tax one way and another as the British taxpayers do. We are one of the highest charged taxpayers in the West and it is totally unfair and intolerable that we be subject to yet another tax . (S Threadgold)
…central government should fund all local council domestic waste and recycling services from the taxation that already exists on nearly everything we buy, i.e. VAT etc, not the council tax payer. Nearly everything we buy is taxed, and nearly everything we buy eventually needs to be recycled or disposed of. (N Hardiman)
A key issue for waste management, and the introduction of variable charging, is how to make waste matter to people living in flats, and also frequent movers. Could it be possible to tackle landlords as well as residents? (Cllr T Page, Reading Borough Council, waste seminar)
F.94 Another view expressed several times was that the cost of waste disposal and recycling should be passed on to manufacturers, as this would encourage them to reduce packaging and so also benefit the environment.
F.95 I also received a range of alternative suggestions for meeting the costs of waste; these included adoption of the system operating in some American states, where the householder buys special bin bags which go towards operating the waste collection service, to the system operating in Japan, where the sale of desirable recyclable materials pays for the cost of disposing of non recyclables.
F.96 I received many representations about charging for adult social care, many of which raised concerns about the appropriateness of authorities being able to charge for such and ‘life and death’ services but being restricted from charging for less vital services. It was suggested that whether services were liable to charging or not was almost an accident of history and that the whole system should be overhauled, some people were concerned that charging would limit the availability of services to those on low incomes:
Many services have to be statutorily provided and so, even if people don’t have the means to pay, authorities still need to provide the service to them…there are some
Waste charging
Adult social care
SUMMARY OF SUBMISS IONS F
Lyons Inquiry into Local Government - Final Report 133
services whereby charging would be impossible because the benefit cannot be limited to those who have paid.. .it could lead to situations where only the more wealthy members of the community access services… (Staffordshire County Council).
Incentives
F.97 Some submissions suggested that taxation could be used as an incentive to influence behaviour:
Discounts could be granted on council tax…for households that utilize renewable energy or make their properties more energy efficient. Powers already exist for individual local authorities to vary and reduce the amount of tax chargeable for individuals and/or classes of tax payers. However we believe that a nationally co-ordinated incentivisation towards investing in higher energy efficiency measures should be introduced. (Restormel Borough Council)
Charges are easier to justify if local residents accept that they are getting something back in return. For example, congestion charges would be much harder to sell if receipts were pooled nationally rather than being reinvested in local transport improvements. (Derby City)
F.98 Around 15 submissions to my Inquiry commented on the basis of the modelling work set out in my December 2005 report. Details of the modelling parameters and figures used in the final report can be found in Annexes A to E.
F.99 All those who have provided formal submissions to my Inquiry are listed in my final report’s Terms of Reference and Acknowledgements. All submissions from organisations are also available to view on the Lyons Inquiry website and in hard copy in the department for Communities and Local Government main library.

Lyons Inquiry into Local Government - Final Report 135
BACKGROUND
G.1 Efforts to promote the long-term sustainable economic prosperity of this country – properly balanced with environmental and social concerns – are a key part of the place-shaping role of local government. I identified that in both my Interim Report and Consultation Paper in December 2005, and in National prosperity, local choice and civic engagement in May 2006. In order to pursue my interest in the issue I have undertaken various pieces of internal analysis and research, and in addition I held a major conference in September 2006, and explored economic development issues in a series of case studies around the country. All of those pieces of work identified transport, planning and skills issues as significant influences on local economic prosperity, and issues on which local authorities have an important contribution to make.
G.2 As a result, it was always clear that the work and conclusions of three contemporaneous reviews on those subjects – Kate Barker’s Review of Land Use Planning, Sir Rod Eddington’s Transport Study, and Lord Leitch’s Review of Skills – were going to be of great relevance, and I met all three to discuss their work during the course of 2006. The request from the Chancellor and Secretary of State for Communities and Local Government to take a short additional period to consider the implications of those three pieces of work for local government, and to make appropriate recommendations, was therefore welcome, and has allowed me to build on my original thinking on the subject.
G.3 To supplement my own work, and the reports published by Barker, Eddington and Leitch, I held a short period of discussion with stakeholders, to which I received over 130 responses. I am most grateful to all those who responded. As might be expected, the majority were from local authorities and associated organisations, but I also received a significant number from individual businesses and representative organisations, professional groups and experts. All those who responded are listed as part of the acknowledgements in the main report. I also convened three expert seminars for more detailed discussions, all of which also proved extremely useful. I would like to thank all those who attended for their input.
G.4 As a result of this work, the main body of this report sets out my conclusions on:
the role of local government in relation to land use planning, transport and skills, and the changes that Government can make to ensure that local government can play its full part, either through its direct responsibilities and power, or through its wider convening role;
the wider issue, relevant to all three pieces of work, of how we can enable our system of government to respond flexibly to the complex and fluid patterns of economic activity. As set out there, I have concluded that flexible, locally developed, arrangements – tested by the Government to ensure their robustness and credibility – are the best way to proceed; and
how changes to the finance system – principally new flexibilities to raise revenue for investment at the local level, in partnership with the business community, and better incentives to foster prosperity and support growth – can contribute to the economic growth agenda.
G STAKEHOLDER VIEWS ON BARKER, EDDINGTON AND LEITCH

G STAKEHOLDER V IEWS ON BARKER, EDDINGTON AND LE ITCH
136 Lyons Inquiry into Local Government - Final Report
G.5 This annex is intended to briefly summarise the key issues – across the breadth of the three reviews – that were raised in submissions and in discussions, and which contributed to my conclusions.
THE BARKER REVIEW OF LAND USE PLANNING
Background and recommendations
G.6 The Barker Review was set up in 2005 to consider how, in the context of globalisation, planning policy and procedures could better deliver economic growth and prosperity alongside other sustainable development goals. The Review’s interim report was published in July 2006.
G.7 The Review’s final report, published on 5 December 2006, aims to create planning policy and processes that give appropriate weight to economic benefits, are more responsive to changing circumstances (including environmental pressures), and deliver decisions in a more transparent and timely manner.
G.8 It recommends:
ensuring the planning system and plan-making takes better account of the benefits of economic development and job creation ;
streamlining policy and processes through reducing policy guidance, unifying consent regimes and reforming plan-making at the local level;
greater certainty, by reducing ministerial call-ins by 50 per cent, speeding up the appeals processes and introducing individually tailored delivery agreements between planning authorities and developers;
encouraging local authorities to work together, and in the medium term considering how strategic planning powers can be operated at a level which better aligns spillovers with administrative boundaries;
encouraging planning bodies to review their green belt boundaries;
considering how fiscal incentives can be provided to local authorities to support appropriate development;
introducing a new system for dealing with major infrastructure projects, based around national statements of strategic objectives and an Independent Planning Commission to determine applications; and
considering enhancing fiscal incentives to ensure an efficient use of urban land, in particular by reforming business rate relief for empty property and exploring the options for a charge on vacant and derelict previously developed.
Summary of views
G.9 The most significant issues raised in the discussions I undertook around the Barker Review centred on the role of the planning system, and possible changes to it; the tensions between local, regional and national decision-making and flexibility; and funding issues, particularly the use of Section 106 and the proposed Planning-gain Supplement.
STAKEHOLDER V IEWS ON BARKER, EDDINGTON AND LE ITCH G
Lyons Inquiry into Local Government - Final Report 137
G.10 Stakeholders were generally supportive of the principles and objectives of the planning system, and its focus on ‘plan-led’ development. It was clear from discussions in the seminar that there are many complex issues which planning authorities have to test, balance and resolve in developing plans, and making individual planning decisions. A host of sometimes conflicting views and interests have to be balanced – between the environment and the economy, the interests of existing investors and those of future investors, and between the interests of local communities and wider regional and national interests.
In supporting economic growth a clear recognition of environmental and social issues needs to be fully understood and managed... The aim should be for an integrated approach that takes forward economic, social and environmental objectives in a coordinated manner to further sustainable development. (Basingstoke and Deane Borough Council)
G.11 There is not necessarily a ‘right’ answer here – the ability to take a balanced approach, and to recognise the validity of different views within and between communities is essential. Some emphasised the potential role the local authority could play in taking a longer term perspective.
We have a 20 – 30 year timescale in place for economic development but many authorities do not plan ahead as well as this. The market knows what is needed in a short timescale. Having a shorter vision means short delays can be fatal to development opportunities. (Local authority, Barker seminar)
G.12 The need for trust in the planning system was highlighted as important to its sustainability and efficacy. Some stakeholders emphasised that there must not be a simple emphasis on the speed with which applications are accepted or rejected. Instead the focus should be on ensuring an ability to distinguish between contributions which strengthen a locality, and those which do not. There was agreement that a presumption in favour of development, as has applied at various times in the past, would represent too simplistic an approach.
G.13 The current planning system was however seen as needing reform, or improved performance, in a number of areas. Local authorities agreed that the system could be enhanced by reducing and simplifying guidance, and clarifying and aligning the respective roles of local, regional and central government.
A clear national spatial strategy is required to provide a policy framework across the country and to provide a clear basis for investment decisions. Below that there is a clear need for the decentralisation of planning policy from the national and regional level to the sub-regional and local level. (South East County Leaders)
We strongly support the recommendations for reducing Ministerial call-ins and speeding up the appeals processes. In London, this is even more important given the Mayor’s role in strategic planning. Issues of wider than local significance are addressed by the Mayor and should therefore not trigger a call-in. A call-in should only be for matters genuinely of national significance. (London First)
G.14 Some felt that, although the reforms introduced in 2004 had been intended to increase flexibility and speed, in practice they had made things more complex and onerous.
Whilst the revisions to the planning system introduced in 2004 were intended to increase flexibility and reduce timescales, this has not been achieved in practice. A
Role of the planning system
Improving the system
G STAKEHOLDER V IEWS ON BARKER, EDDINGTON AND LE ITCH
138 Lyons Inquiry into Local Government - Final Report
particular challenge for smaller local planning authorities has been securing the necessary staff resources and the increasingly onerous requirements for a robust evidence base. (West Midlands Shire Councils)
The “new” planning system has failed to deliver what it promised. There should be a complete revision/overhaul of the current legislation and it should be streamlined to remove red tape, central control and inflexibility. (Braintree District Council)
G.15 Business organisations felt that local authorities could be better at providing businesses with certainty and speed in decision-making, and, more generally, in paying attention to issues of economic growth and development and taking a joined-up approach across issues.
We also believe that the culture within planning departments should become more positive in the long term if reforms are to be truly effective. It is worth noting that in a recent CBI survey on public services CBI members were most dissatisfied with local government’s record on improving planning services. (CBI)
G.16 Some local authorities also identified concerns about the status of planning within local authorities, which they felt undermined its ability to contribute fully to place-shaping.
Planning in local authorities usually sits with dealing with the garden shed. It needs to be given more importance, as resources are devoted to the small-scale issues but we’re actually desperate to get on with the big planning issues. (Local authority, Barker seminar)
G.17 The role of the Government Offices was highlighted by a number of stakeholders, particularly at the seminar. Contributors felt that, in order to add value to the current system, the role of the Government Office should be to test the spatial impact of national policies, and to reflect those back to the centre, rather than to second-guess legitimate local decisions.
Government Offices should be there to test the spatial impact of government policy. If they cannot, then there’s no point in having them. (Local authority, Barker seminar)
G.18 Planning decisions provide clear examples of issues where local, regional and national interests can differ and be in conflict with one another, and where the impacts of decisions can affect more than one local authority area. The need for authorities to work in partnership at the local level in order to address such spillover effects was clearly identified.
In the South West of England, there are many examples of local authorities working effectively in voluntary partnerships both at sub-regional and regional levels… There may be scope to expand existing sub-regional and regional governance arrangements beyond plan-making to taking decisions on strategic infrastructure and approving or rejecting proposals. (South West Local Government Association)
G.19 Some argued that more must be made of existing powers to develop joint Local Development Frameworks, and others that current administrative boundaries at regional level could hamper local authority efforts to join work together.
Planning in local
authorities
Government Offices
Scale of decision-making

STAKEHOLDER V IEWS ON BARKER, EDDINGTON AND LE ITCH G
Lyons Inquiry into Local Government - Final Report 139
There should be encouragement to work across existing boundaries, facilitated by regional agencies working together. For Wiltshire, this is as much about the inter-regional boundary South West/South East as across county boundaries. (North Wiltshire District Council)
G.20 Many stakeholders, particularly in urban areas, discussed proposals for city- or sub-regional arrangements as a way of making some of the more strategic decisions closer to the local level than is currently possible. There was a range of views over whether new institutions were necessary to wield such powers, or whether local authorities could use existing collaborative arrangements perhaps with new executive arrangements to do so.
The sub-regional level has most value, which in the context of Manchester, means the “city region” as this is the scale at which relationships are meaningful and where sensible strategic choices and priorities can be identified. (Manchester City Council)
Local government can work and in some areas such as the Black Country is working effectively in partnership to take strategic decisions at the right spatial level. A key challenge appears to be to diagnose and generalise this emerging good practice, rather than to invent a further round of new institutions. (Royal Town and Planning Institute)
G.21 In London, though there were some differences of view about the Government’s plans to extend the Mayor’s powers, some stakeholders found the current arrangements for strategic planning adequate.
London already has a single coherent strategic planning authority – the Mayor and GLA… New or reformed institutions are considered unnecessary except some minor reforms of the spatial sub regional boundaries (which are the subject of review in the Mayor’s London Plan in any event). (London Borough of Barnet)
G.22 Kate Barker’s proposal for reforms to improve the process of planning and decision-making for major infrastructure projects and decisions of national importance were the subject of much discussion. Some contributors felt that moves in this direction would involve an undesirable diminution of democratic, particularly local democratic, influence and control.
Not happy about proposals to move decision-making away from local people – we should take the decisions. (Staffordshire Moorlands District Council)
The proposal for an independent Planning Commission may provide greater certainty... However, the proposal for a Planning Commission will still lead to decisions being made centrally, away from the accountability of democratically elected members. (SIGOMA)
G.23 Others could see some advantages in the proposal as a way of clarifying responsibilities and processes for decisions of national importance.
The establishment of an Independent Planning Commission (IPC) could streamline the consideration of projects of national significance provided the strategic objectives are clear. However, it needs to be linked to the process of policy making and we would want reassurance that the Commission focus on proposals of national importance and that counties and their communities have a role and input to the commission. (County Councils Network)
Independent Planning
Commission

G STAKEHOLDER V IEWS ON BARKER, EDDINGTON AND LE ITCH
140 Lyons Inquiry into Local Government - Final Report
G.24 Many thought that it would require a more consistent national approach to spatial planning, whether through the Statements of Strategic Objectives proposed by Barker or perhaps through a National Spatial Plan.
We need a debate on where things go, and a national spatial framework (Local authority, Barker seminar)
We see benefit in an Independent Planning Commission (IPC) to consider developments of national importance as long as this is carried out transparently. It is difficult however, to envisage how an IPC could operate without a national spatial framework to provide context (Association of Greater Manchester Authorities)
G.25 Some authorities felt that, in the absence of a clear view on how local authorities might contribute to the development of such a strategic approach, the drawbacks of the Independent Planning Commission proposal outweighed its advantages.
There is a clear risk that local authorities will feel completely disenfranchised unless there are clear opportunities to be consulted on national guidelines and the proposed Statements of Strategic Objectives… As such, the Independent Planning Commission, as currently configured, is something Essex County Council opposes. (Essex County Council)
G.26 A number of the other issues raised in Kate Barker’s report were also discussed. Some were concerned about the potential implications of reviewing green belt boundaries.
Reviews of green belt boundaries could have negative impacts on National Parks if they resulted in a significant loss of green belt land close by. There could, for example, be greater car volumes, more emissions, decreased tranquillity, an adverse visual impact, and habitat loss affecting species within Parks. (Council for National Parks)
Development on green belt land should be discouraged. (Cullompton Town Council)
G.27 However, on balance many felt that planning authorities should take a strategic approach to green belt land, although a number added a note of caution, highlighting its ability to promote urban regeneration.
The Core Cities welcome the need to look at the green belt as a strategic policy tool… However, this must be placed with the context of Barker’s continued support for the prioritisation of development within urban areas and on brownfield land, and it is important that any reviews of the green belt have strong regard to this central construct. (Core Cities)
G.28 A number of local authorities made it clear both that they agreed with the need to adopt a strategic approach to green belt, and that they had demonstrated an ability to do so in the past.
Shire county planning authorities like Kent can already demonstrate the confidence and clout a strategic authority can deploy in making such potentially difficult decisions – e.g. in 3 of the last 4 Development Plan reviews KCC chose to release former Green Belt land to help expedite the development of the Thames Gateway without detriment to our “green” track record and reputation. (Kent County Council)
Green belt

STAKEHOLDER V IEWS ON BARKER, EDDINGTON AND LE ITCH G
Lyons Inquiry into Local Government - Final Report 141
G.29 Town centre development, and the weakening of the “town centre first” policy that Kate Barker’s recommendations were perceived to call for, were another area identified in many submissions. A number of stakeholders were concerned that the changes proposed would damage town centres and the ability of local authorities to effectively plan for them.
There are concerns over the proposal to relax the current requirement for off-centre retail schemes to demonstrate “need”. This will inevitably lead to additional pressure for out of centre retail and eventually to adverse impact on town centres. It is very difficult for local authorities to prove that out of centre proposals will not have an adverse impact, particularly as the effects are often cumulative and occur over a long period of time. (Derby City Council)
Although the Barker report favours the “town centre first” policy, the suggestions for removing the needs test, as part of the planning application process, and for allowing greater competition could, potentially, lead to more out of town or edge of town development. This could have a particularly damaging effect on small market towns. (Commission for Rural Communities)
G.30 Meeting the increasing demand for space for both commercial and residential development was identified by many stakeholders as a key issue. Many supported reforms to the finance system so that there was a clear revenue stream to support infrastructure and enable communities to benefit financially. These included calls for the extension and simplification of the Local Authority Business Growth Incentives (LABGI), or the full relocalisation of business rates.
We welcomed [LABGI] and the fact that it enabled local authorities to retain part of the growth in their business rates base. We believe this kind of positive initiative, encouraging economic growth and locally retained revenue through partnership, should be encouraged. However, we do think the scheme is too complex and the revenue gains too low to make a difference to local authority priorities. For LABGI to genuinely incentivise, it would need to have greater resource devoted to it, and provide a simple mechanism for predicting local revenue. (Tesco)
G.31 There was also considerable discussion of the relative merits of Section 106 payments and of the Government’s proposed Planning-gain Supplement (PGS). Many authorities and business groups pointed to the advantages of the current arrangements. Section 106 was seen as being understood by businesses and authorities, and providing a clear link between development and infrastructure and other community benefits. There were therefore concerns that reducing the scope of S106 could undermine those advantages, or impose additional burdens on businesses, but others supported the introduction of the Planning-gain Supplement.
Section 106 has a place and it is of local benefit. It got a bad reputation in the 90s by local authorities going too far, but PGS must not be at the expense of Section 106. I’m not against the Planning-gain Supplement, as it would be a regular way of getting money from developments. However, I think there is some over-expectation of how much it will raise. (Local authority, Barker seminar)
Section 106 does get businesses involved. The Government should be careful about getting rid of it. (Business, Barker seminar)
There is no support for a Planning-gain Supplement amongst the business community. It would be an extra tax on businesses and an added burden at a
Town centres
Incentives and infrastructure

G STAKEHOLDER V IEWS ON BARKER, EDDINGTON AND LE ITCH
142 Lyons Inquiry into Local Government - Final Report
time when the Government is purportedly looking to reduce burdens on business. (British Chambers of Commerce)
G.32 However, some limitations to the current operation of S106 were identified, including concerns that some local authorities were not making full use of their current powers, and that some were failing to collect contributions from developers once those had been agreed. One contributor also made the point that S106 contributions alone were unlikely to completely fund new infrastructure and a number of authorities argued that the Government had a responsibility to provide additional funds to meet the infrastructure needs of new growth.
Section 106 is at best going to provide between 20 and 40 per cent of the funding needed for new infrastructure. Funding will be needed from central government as well. (Local authority, Barker seminar)
G.33 There were other concerns that such measures would be insufficient without new mechanisms and resources to enable early funding of infrastructure investment.
There needs to be a far more effective method of ensuring that infrastructure can be provided up front, perhaps underwritten by central government, with income from the development being used to repay the investment over time. (Hertfordshire County Council)
G.34 In discussion at the seminar the proposals for Regional Infrastructure Funds being developed in the South West and South East were raised as potentially important contributions to this process.
G.35 There was considerable discussion in submissions regarding the Barker proposals for improving the incentives for making full use of land through reforms to the empty property relief in business rates, and the extension of rates to previously developed land. Opinions varied considerably. Many local authorities and some business groups felt there would be advantages to such moves.
Empty properties should pay full business rates as an incentive to encourage local business growth, with exceptions allowable for any property owner who can prove that they are doing all they can to fill the property and are delayed by means beyond their control. (Federation of Small Businesses)
Leeds supports the case for the reform of empty property relief…and agrees that reform could be used to encourage early redevelopment and re-use particularly in urban areas (Leeds City Council)
G.36 However, there was more scepticism shown by rating organisations and other business groups, some of whom recalled problems with punitive empty property rates in the 1970s and difficulties in valuing derelict land.
We consider that the concept behind the proposals… to be fundamentally flawed… Redundant brown field sites, particularly those with heavy contamination are either valueless or of very little value and the cost to the owner (person entitled to possession) of empty property rate is unlikely to provide a significant incentive for redevelopment. (Royal Institution of Chartered Surveyors)
G.37 One contributor at the seminar also noted that many of the issues under discussion in the Barker report and in other work focused very heavily on the supply side of the equation, and suggested that more general reforms to property taxation, for
Incentives for full use of
land

STAKEHOLDER V IEWS ON BARKER, EDDINGTON AND LE ITCH G
Lyons Inquiry into Local Government - Final Report 143
example through impact on council tax, could provide helpful changes to the demand for property as well.
THE EDDINGTON TRANSPORT STUDY
Background and recommendations
G.38 The Eddington Study was commissioned to examine the long-term links between transport and the UK's economic productivity, growth and stability, within the context of the Government's broader commitment to sustainable development.
G.39 The Study’s final report, published on 1 December 2006, makes the following recommendations across its remit:
to meet the changing needs of the UK economy, Government should focus policy and sustained investment on improving the performance of existing transport networks, in those places that are important for the UK’s economic success;
over the next 20 years, the three strategic economic priorities for transport policy should be: congested and growing city catchments; key inter-urban corridors; and the key international gateways that are showing signs of increasing congestion and unreliability;
Government should adopt a sophisticated policy mix to meet both economic and environmental goals. Policy should get the prices right (especially congestion pricing on the roads and environmental pricing across all modes) and make best use of existing networks;
the Government, together with the private sector, should deliver sustained and targeted infrastructure investment in those schemes which demonstrate high returns, including smaller schemes tackling pinch points;
the policy process needs to be rigorous and systematic, to consider the full range of modal options and to ensure that spending is focused on the best policies; and
Government needs to ensure the delivery system is ready to meet future challenges, including through reform of sub-national governance arrangements, new arrangements for the regulation of the bus sector, and reforming the planning process for major transport projects by introducing a new Independent Planning Commission to take decisions on projects of strategic importance.
Summary of views
G.40 In submissions, and in the seminar, the main areas of discussions were the need for additional transport investment; how that might be funded and where it should be targeted; the best governance arrangements for making decisions on those transport systems and investments; and where local authorities might need additional powers or flexibilities to be able to take the best decisions. A number of other issues were also raised on specific aspects of the current system and the powers of local authorities, and road pricing was also discussed.

G STAKEHOLDER V IEWS ON BARKER, EDDINGTON AND LE ITCH
144 Lyons Inquiry into Local Government - Final Report
G.41 There was a clear view that additional investment in transport infrastructure – as identified by Eddington – was needed to support economic growth, and that many projects could be identified with benefits which substantially outweighed their costs.
There is a strong case for greater investment in transport infrastructure, partly because of the need to make up for past under-investment. Cost benefit analysis of potential transport projects shows that there are a large number of projects with very high returns. (Academic, Eddington seminar)
G.42 However, opinions differed as to where investment should best be focused. Stakeholders were divided on the merits of the three priority areas identified by Eddington (congested and growing city catchments; key inter-urban corridors; and the key international gateways). Whilst cities and growing areas welcomed the emphasis on their transport investment needs, others were concerned at the implications for rural areas, or areas in need of regeneration and economic revitalisation. Some stakeholders felt that discussions about transport in the context of Eddington neglected proper consideration of the impacts of climate change.
Our main concern with Eddington is that he insists that transport investment should only follow demand… If we had a more strategic regional policy, at least as much effort would be put into diverting demand away from congested regions like the South East as is currently put into relieving clogged transport arteries. (Local Government Information Unit)
We need to engage with Sir Nicholas Stern’s arguments on climate change. Eddington says we need to keep cheap long distance travel to maintain standard of living, but I am not sure we can afford to do that. (Regional body, Eddington seminar)
G.43 There were also differences in opinion on the best way to decide on which projects were the most important to take forward, with some criticisms of traditional cost benefit appraisal methodologies as the sole way of making such decisions.
You need to be careful with option generation and cost benefit analysis – developers and businesses in city centres want good mass transit, and schemes that contribute to attractive city centres, not just roads which bring people in (Local authority, Eddington seminar)
We should also recognise that cost benefit appraisal isn’t the same as a local view about what people want to be done with their own money, and what they value (Local authority, Eddington seminar)
G.44 This was also identified as a problem for some areas with current methodologies for prioritising spending.
The dilemma with much transport funding is that it is provided nationally and is subject to national evaluation criteria which do not account for local prioritisation and responsibility for outcomes. The regeneration and economic benefits of transport expenditure are undercounted. (Bradford Metropolitan District Council)
G.45 There was a considerable degree of support for Eddington’s conclusions that transport decisions and funding arrangements could be improved by an approach which gave flexibility for decision making across all transport modes at a sub-national level. The current governance arrangements were not seen as ideal for a number of reasons.
Priorities for further
investment
Governance

STAKEHOLDER V IEWS ON BARKER, EDDINGTON AND LE ITCH G
Lyons Inquiry into Local Government - Final Report 145
G.46 In some areas, this was seen as due to narrowly drawn authority boundaries.
…some cities in England are very underbounded, meaning they have to work with two tier areas covering the rest of the conurbation. This can be difficult. Expanding boundaries to a sensible level would be a solution. (Local authority, Eddington seminar)
G.47 In the metropolitan areas, which have a specific governance model in the form of Passenger Transport Authorities and Executives, there were a number of concerns about the current arrangements.
Passenger Transport Authority structures involve too many authorities and councillors in making decisions, which makes them unwieldy bodies (Local authority, Eddington seminar)
The [current system] is a constraint as it creates an artificial boundary – there is a lot of commuting into major cities from shire areas who are not in the PTA structure (Local authority, Eddington seminar)
G.48 There were also general concerns that current arrangements failed to focus attention and decision-making at the level of the functional economy. This was seen as a problem in relation to regional boundaries as well as to local ones.
The South East Region does not operate as a coherent area either in terms of transport or its economy – the solutions to the problems we face are nearly always sub-regional. (West Sussex County Council)
G.49 However, opinions varied significantly on the most appropriate solutions. Many local authorities felt that partnership arrangements were the most effective and transparent way to deal with the challenges.
The addition of new institutions could fragment current arrangements and potentially add… bureaucracy (South East County Leaders)
G.50 Others felt that some new institutional or formal arrangements would be required to address the situation, though there were many different opinions.
…we support the creation of strategic transport authorities along the lines of the Transport for London model in major cities like Manchester and Birmingham (Centre for Cities)
A strategic authority positioned above the local authorities won’t work – we need a governance arrangement which captures the decisions already being made locally but goes beyond a purely voluntarist approach. (Local authority, Eddington seminar)
G.51 However, discussion at the seminar urged caution before the Government embarked on a full-scale formal reorganisation. There was also a clear view that arrangements imposed from the centre would be much less effective than arrangements developed at the local level, perhaps with some degree of challenge and support from the Government.
We need local flexibility to organise multi-authority models… A nationally imposed solution will fail – but equally we need people to be engaged in whatever models are developed, so a statutory duty to collaborate in those arrangements is needed. (Local authority, Eddington seminar)

G STAKEHOLDER V IEWS ON BARKER, EDDINGTON AND LE ITCH
146 Lyons Inquiry into Local Government - Final Report
G.52 Business organisations were concerned that reform should be pragmatic, undertaken only where partnership approaches were not working
Where partnerships are not working effectively, reforms should be implemented. Only if this cannot be done effectively, should new institutions be established (British Chambers of Commerce)
G.53 In order to be able to make decisions effectively across modes, many contributors suggested that there would need to be changes to funding arrangements, and to the level of power and influence that local transport bodies have.
G.54 A perceived ‘silo’ approach to funding transport was seen as a problem, and one which acted against the objectives set out in the Eddington Study. There was general support for the system of Local Transport Plans. However, some authorities called for their scope to be expanded to include other important transport issues such as rail.
At the regional level, rail investment should be brought into the RFA process. The absence of funding for rail, as part of the first round of RFA, was regarded as a missed opportunity in helping the region to adopt a more holistic approach to improving transport and connectivity (Association of North East Councils)
G.55 The Regional Funding Allocation process was also seen as having a number of advantages, by enabling local authorities and regions to provide advice to the Government on transport projects. However, a number of authorities felt that they had not received a fair share of the resources available. There was also a general call for more resources to be devolved from the national and regional level to the sub-regional level, in order to allow for faster decision-making better linked to local needs and priorities, and for some revenues to be pooled upwards by local authorities.
Regional Funding Allocation money should be spent at the sub-regional level, passing control down from the Government. Local authorities should pool some of their current resources. (Eddington seminar)
G.56 The split between capital and revenue was identified as a problem by a number of stakeholders, who felt that it drew them towards capital-intensive projects that there not necessarily the best use of resources.
The current LTP system appears to work well. However, it is restricted by the fact that it is built solely around capital as opposed to revenue funds; revenue funding for measures such as bus services, ticketing solutions, marketing, and travel awareness campaigns are often able to deliver major benefits and complement capital investment. (Greater Merseyside)
G.57 Providing revenue funding through the Formula Grant to support local borrowing for investment was seen as causing some difficulties by a number of stakeholders, as it was less transparent than capital grants, and could be affected by other aspects of the Formula Grant system, such as grant floors. Passenger Transport Authorities/Executives, who receive their resources from a levy on the metropolitan district councils in their area, felt this was also a problem, as it could sometimes be difficult to agree the allocation that had been provided to support the PTA’s borrowing.
G.58 Local authorities felt that in some areas their powers and influence were restricted. For example, some argued that it is difficult to influence the decisions being made by national bodies responsible for the management of, and investment in, major transport aspects. Others noted the absence of rail funding from the Regional Funding
Cross-modal decisions

STAKEHOLDER V IEWS ON BARKER, EDDINGTON AND LE ITCH G
Lyons Inquiry into Local Government - Final Report 147
Allocation process as an important omission when seeking to take a comprehensive view across transport modes.
The major difficulties often come through working in partnership with the government agencies… effective engagement is hindered by the narrow focus of [the Highways Agency and Network Rail] on a relatively limited range of nationally driven priorities. (Norfolk County Council)
G.59 Most of those who responded, including business organisations, highlighted problems with the current lack of powers to influence bus provision at local level and supported the Government’s proposals to strengthen local regulatory powers.
The ability for local authorities to be able to plan and secure new bus services to a level it considers necessary to secure broader objectives, including economic regeneration, free from the constraints of the current legislation, would be invaluable. This does not mean a return to prescriptive regulation but empowerment to local authorities to work more flexibly to meet local needs. (Essex County Council)
G.60 The CBI, however, felt that the continuation of a partnership approach offered the best way forward.
The CBI believes that a more effective way forward would be to encourage more voluntary partnerships between bus operators and local authorities. Such partnerships are already in operation in some parts of the country and achieve benefits without the need to legislate to allow re-franchising. (CBI)
G.61 Local flexibility to raise and invest resources, and to benefit from the economic growth created by successful transport investments, was seen as important. Identifying tools that would allow local authorities to capture some of the value from growth and infrastructure investments was also seen as desirable.
If local authorities are to deliver better places, they urgently require mechanisms that more closely link their financial resource base to local development and economic growth. Centrally-driven schemes like the Local Authority Business Growth Incentive (LABGI) are not sufficient. Local authorities need a more substantive resource base of local taxes and charges, if they are to promote economic prosperity effectively. (Centre for Cities)
G.62 Some authorities raised concerns during discussions that the current Minimum Revenue Provision requirements, which require authorities to set aside 4% of net outstanding debt out of their revenue resources to redeem their debts, are too complex and rigid and reduce their ability to use borrowing powers to best effect.
G.63 Road pricing and congestion charging sparked considerable interest. At the seminar there was a general view that road pricing would inevitably be required in the future. Opinions from submissions varied on whether a national scheme was necessary or whether authorities, or groups of authorities, could take action independently. Submissions identified a number of factors that would be important in influencing local decisions to introduce road-pricing schemes, including the need for adequate up-front investment in public transport.
G.64 Authorities also generally called for all, or a substantial part, of the revenues to be retained locally for investment in transport. A number argued that this could make
Local flexibility and
incentives
Road pricing

G STAKEHOLDER V IEWS ON BARKER, EDDINGTON AND LE ITCH
148 Lyons Inquiry into Local Government - Final Report
an important contribution to securing public acceptance of road charging schemes, as it would provide a link between charging and improved local transport provision.
Any revenues raised from local road pricing schemes should be locked in to achieving benefits at a local level, this is particularly vital for the public acceptance of such schemes and the ability to deliver schemes to provide alternatives to the car. Likewise the revenues from any national scheme should be hypothecated to local transport improvements. (Devon County Council)
G.65 Some also noted the potential for changes in behaviour, for example flexible working by individuals and businesses, to address some of the problems with congestion, and suggested that local authorities are well-placed to encourage and facilitate such changes.
THE LEITCH REVIEW OF SKILLS
Background and recommendations
G.66 The Leitch Review was tasked in 2004 with identifying the UK’s optimal skills mix in 2020 to maximise economic growth, productivity and social justice, and to consider the policy implications of achieving the level of change required. It published its interim report in 2005.
G.67 The Review's final report, Prosperity for all in the global economy – world class skills, published on 5 December 2006, recommends that:
attainment in adult skills across all levels should be increased, measuring success on outcomes not outputs;
Train to Gain and Learner Accounts should be used to fund adult skills development in a demand-led fashion, making the Learning and Skills Council (LSC) responsible for managing funding and ensuring effective competition;
the collective voice of employers in the skills system needs to be strengthened by rationalising existing bodies and creating a new Commission for Employment and Skills;
employer engagement and investment in skills should be increased through reform of the Sector Skills Councils;
a new ‘Pledge’ should be launched for employers to voluntarily commit to train all eligible employees up to Level 2;
people’s aspirations and awareness of the value of skills should be increased through sustained awareness programmes and a new universal adult careers service; and
a new integrated employment and skills service should be created to increase sustainable employment and progression, and develop a network of employer-led Employment and Skills Boards to influence delivery (ideally at the level of the functional economy).

STAKEHOLDER V IEWS ON BARKER, EDDINGTON AND LE ITCH G
Lyons Inquiry into Local Government - Final Report 149
Summary of views
G.68 The key issues identified in submissions and in the Leitch seminar were: the merits of different ways of ensuring that skills provision is responsive to the needs of the economy, of employers and of learners; the role of local authorities in addressing issues of worklessness and social exclusion; and the links between the LSC and local authorities on 14-19 education and training issues.
G.69 Stakeholders agreed with Leitch’s conclusions about the importance of enhancing and expanding the UK’s skills base in order to remain competitive in the modern world economy, and to deal with the challenges posed by emerging economies. They supported his calls for increased investment in skills.
G.70 One of the Leitch Review’s most significant conclusions was that, in order to ensure that resources were used effectively and on the sorts of skills that would provide the greatest benefit to the economy, the current system for planning adult skills provision through the Learning and Skills Council (LSC) should be replaced by a demand-led system. Under such a system the choices that employers and learners make between different courses and different providers would drive the sorts of courses available, because providers would have to respond to these signals to ensure continued funding. Leitch also recommended that the discipline created by enhanced choice for employers and learners through such a system should be enhanced by ensuring a stronger employer voice through a new National Commission for Employment and Skills and local/sub-regional level Employment and Skills Boards.
G.71 Many respondents supported this approach as a way of making the skills system more responsive to the needs of the economy, as expressed by the decisions of individual employers and learners, rather than expecting government agencies to be able to predict and provide for future needs.
The Leitch system puts money in the hands of the consumer, rather than in a failed supply-driven plans system. (Local authority, Leitch seminar)
This would put purchasing power in the hands of employers and individuals. In many ways this is the ‘ultimate devolution’, removing the need for central planning and prioritisation of training provision. (Centre for Cities)
G.72 However, a number of contributors added some caveats. Some were unsure that the ‘voice’ of employers in such a system would be sufficiently strategic, or whether all employers necessarily appreciate fully the importance of skills provision.
It is not just about what employers say they need, but also scenarios for the future. (Academic, Leitch seminar)
We need an informed demand to avoid market failure... Some new sectors are coming up which existing businesses will not see, so there is a need to look upstream and be anticipatory (Business, Leitch seminar)
Without co-ordination and collaboration, there could be a danger of over-investment in traditional technologies & skills, and a time delay on the supply line (Telford & Wrekin)
G.73 Another general concern was for individuals who face multiple barriers to work, who might find it difficult to access a system primarily run in the interests of employers.
Responsive skills
provision

G STAKEHOLDER V IEWS ON BARKER, EDDINGTON AND LE ITCH
150 Lyons Inquiry into Local Government - Final Report
Many adults in London are out of work. They won’t be articulating demand, and there are a lot of different reasons for that. There is the potential to accentuate that, so we need to intervene (Government body, Leitch seminar)
G.74 As a result, many called for some continuing role for influence, intervention and commissioning by public sector agencies. There was some debate on how far the current system was actually able to provide a sufficiently responsive approach. For example, there was criticism of the existing arrangements as being too centrally driven and over prescriptive, particularly with the strong emphasis on Level 2 qualifications.
There exists a potential paradox, whereby it is an employer-led system with national targets. (Academic, Leitch seminar)
The present set-up is a nationally-prescribed system, riven with perverse incentives, in a post-16 funding strategy with very little relevance to local needs. This national prescription, if followed through locally by FE colleges and other providers, would see the virtual abandonment of Level 1 (Kent County Council)
G.75 There were also differing views on the most appropriate way for the system to be designed. Some supported a sectoral approach, others focused on the geographical dimension and the local labour market.
The agenda is moving to sectors. Successful economies focus sectorally on skills, demand-led. We are now starting to get good data sector by sector. (Industry body, Leitch seminar)
Responding to skills issues needs to take place at differing spatial levels. There is a need for sufficient local flexibility to target communities where we know skill levels are lowest, but also, a need for strategic capacity to plan and deliver occupational skills at city regional level that best reflects the natural labour market. (Manchester City Council)
G.76 Business organisations argued against major structural change and in favour of a system which is easily understood and is responsive to business needs.
CBI members are not wedded to a particular system and do not want to see another revolution in the skills infrastructure, with all the upheaval that would cause. The priority for business is a comprehensive and coherent system that ensures limited public money is allocated effectively, and that the needs of employers can be accommodated, whether through an individual, sectoral, local, regional or national approach. (CBI)
G.77 In addition, the ability of the Learning and Skills Council to respond flexibly to different local circumstances was questioned. A recent reorganisation was supported by some as increasing its local links, but felt by others to be part of a regionalisation of skills planning which would mean less ability to tailor provision to local needs and conditions, and less resource available to engage at the local level.
The LSC has recently undergone a restructure along regional and sub-regional lines to allow it to become significantly more responsive to local needs. Local economic development advisors are being placed within cities, providing a flexible resource for planning provision within the City. (Leeds City Council)
It is unlikely that the proposed reform of the LSC will leave it with sufficient resources to deliver local flexibilities, and we are concerned that many local
Problems with the current
system

STAKEHOLDER V IEWS ON BARKER, EDDINGTON AND LE ITCH G
Lyons Inquiry into Local Government - Final Report 151
authorities will, in effect, lose a valuable partner from their strategic forums (Local Government Information Unit)
G.78 Leitch’s proposals for new Employment and Skills Boards (ESBs) were generally supported as a proposition, but there was a wide variety of views on just what the scope, role and geographical coverage of Employment and Skills Boards should be, and the place that local authorities might have within them. While Leitch was seen to be strong on the vertical reporting structures for such arrangements, it was felt that further consideration needed to be given to the horizontal and parallel architecture of, for example, relations with Regional Development Agencies, local authorities and other bodies.
G.79 A regional approach was felt by many to be too wide for ESBs, and there were a number of suggestions that they should operate at a sub-regional level. It was acknowledged that this would require cross-boundary working between public agencies such as local authorities.
The strategy needs to be place centred and work around existing boundaries where partnerships address a common region at the right level of integration. (Business organisation, Leitch round table)
G.80 A variety of potential roles for local authorities were highlighted: some thought that local authorities should only have a limited role in their status as local employers; some thought that local authorities should be responsible for leading the activities of such boards; while others thought they should play a supporting role. In many cases, the provision of information and intelligence was identified as a key contribution that they could make to local discussions about skills needs.
Local authorities are also well positioned to collate, interpret and share the findings of the large quantities of data and other management information which is held on local people. (Hull City Council)
One thing that is certain is that no-one would know the local learning and skill needs, and the factors that militate against achievement and employment, better than the local authority and local providers. It is, after all, at local level that the problems associated with poverty of aspiration, underachievement and youth unemployment are most felt. (City and Guilds)
G.81 In a number of areas, it was felt that existing arrangements between employers and local authorities could form the basis of Employment and Skills Boards, and that new arrangements should not replace or duplicate existing successful partnerships. Some business organisations emphasised the need to ensure that businesses could clearly see how to access support and provision.
In setting up a new interaction between employment and skills, it is crucial that there are demarcated lines of responsibility so it is clear who employers need to approach and to avoid duplication or gaps in the system (Forum of Private Business)
G.82 The challenge of addressing long-term unemployment and social exclusion was seen as an area where local authorities had a great deal to add in their convening role. Many felt that they were well placed to respond to the holistic needs of their communities and should have a significant role in linking skills and employment initiatives within their overall remit for community planning and well-being.
Employment and Skills
Boards
Tackling worklessness and exclusion

G STAKEHOLDER V IEWS ON BARKER, EDDINGTON AND LE ITCH
152 Lyons Inquiry into Local Government - Final Report
It is sensible to link employment and skills issues together in a way that enables more effective planning and delivery arrangements to reduce worklessness. The creation of clear progression routes from unemployment into work that involves a range of local service providers is a key challenge for City Strategy. In addition to formal learning and training, greater links need to be made with other public services… This includes health services, housing providers, adult learning and adult social care services etc. (Manchester City Council)
The council has an important role in tackling entrenched deprivation through early years education, childcare provision, working with colleges and so on. We need to avoid a separate horizontal architecture for skills. (Local authority, Leitch seminar)
G.83 Local Strategic Partnerships (LSP) and Local Area Agreements (LAAs) were seen to offer the potential vehicles for local authorities to take on their convening role and join-up skills and training provision, making clear priorities within an area.
The role that local authorities play in enabling partnership working through the framework of Local Area Agreements is vital (East Sussex County Council)
The local authority, through its Economic Development Service and its schools provision, should be exercising its strategic leadership. This is linked into its commitment to its enterprise strategy; as a major employer itself; and as a key player in the realisation of the Community Strategy and of the Local Strategic Partnership (Rotherham Metropolitan Borough Council)
G.84 Although many respondents supported the Train to Gain and Learner Accounts, some warned of potential problems, which they felt may arise if there were over reliance on these initiatives, particularly related to social exclusion issues.
We do have some concerns that the approach to route all public funding for adult vocational skills through Train to Gain and Learner accounts by 2010 will have the effect of further isolating workless individuals who are not Job Seekers Allowance claimants from receiving assistance with ESOL and basic skills training (London Borough of Tower Hamlets)
G.85 Local authorities are significant employers in their own right. This was seen as an opportunity for local authorities to contribute to the wider agenda of enhancing skills by providing training opportunities for their own staff, and as a reason for local authorities to be involved in local Employment and Skills Boards. However, there was also a feeling that local authorities were not necessarily all performing well in this area.
There is agreement for the convening role, but concern over the fragmentation and casualisation of the public sector workforce, with over £500m spent annually in London alone on agency workers. This raises questions of the employer or sectoral approach. Inward migration is an issue, with some highly skilled workers doing low-skilled work, often with language being the barrier. LG doesn’t adequately train its staff, with too much emphasis on management, not skills for life. (Trade union, Leitch seminar)
Local authorities, particularly County Councils, are major employers in their own right. They will accordingly generate demands as well as facilitating provision. (West Midlands Shire Councils)
Local authorities as
employers

STAKEHOLDER V IEWS ON BARKER, EDDINGTON AND LE ITCH G
Lyons Inquiry into Local Government - Final Report 153
G.86 The increasingly mixed economy of provision for local services, including commissioning from private and voluntary sector providers as well as direct provision by authorities themselves, was identified as having important implications in this regard. This was described as the challenge of developing skills “for public service, not just for public provision”. This will be a key issue for local authorities and for independent service providers to address.
G.87 There was support for the closer integration of 14-19 education and training, responsibility for which is divided between local authorities and the LSC. Some of those who made submissions argued that this division created real problems for effective provision and needed to be removed.
If strategic responsibilities relating to 14-19 are truly to be discharged for the benefit of local people, the funding streams for 14-19 education should be restored to local authorities, with appropriate conditions attached regarding the partnerships to be formed with providers and businesses, and the regional framework for transport, land and skills (County Surveyors’ Society)
If the LSC is changed fundamentally and streamlined in response to the Review’s proposals, we suggest that the local authority should hold unified and ultimate responsibility for 14-19 education with that part of the LSC’s current work on 14-19 education issues being transferred to local authorities. (Essex County Council)
G.88 Others focused more on the need to provide closer partnership working between local authorities and the LSCs, and a clear strategic leadership role for local authorities, as set out in the Government’s White Paper on further education.
The effective joint working of local authority directors of children’s services and LSC partnership directors has been identified as a critical factor in successful 14-19 improvement. (Learning and Skills Council)
At a local level the local authority should have the predominant leadership role to which the LSC then has to respond. Local authorities should be able to significantly influence how the LSC deploys its funding in securing its 16-19 entitlement. (London Councils)
G.89 The need to link 14-19 provision to adult skills were also identified. In London where the Mayor is taking on a new role in adult skills, some were concerned about the risks of taking too local an approach.
A joint strategy for 14-19 with the LSC is being developed in Devon to build local area school/college partnerships and develop the capacity for the new diplomas in 14 skills areas. Our aspiration is for the diploma to align to adult training, to ensure progression on to higher and intermediate skill levels. (Devon County Council)
If local authorities are to have a strategic leadership role for 14-19, then 32 boroughs with different structures trying to link in with a London-wide adult skills network, is a recipe for disaster. (Local authority, Leitch seminar)
G.90 Discussions with Lord Leitch also highlighted the need to consider how future developments might affect the current arrangements for 14-19 education, particularly were the Government to decide to require all young people to remain in full or part time education or workplace training up to the age of 18, as he noted in his Review.
14-19 education and
skills

Lyons Inquiry into Local Government - Final Report 155
INTRODUCTION
H.1 During my Inquiry, I have undertaken and commissioned a wide-ranging programme of research and stakeholder engagement in order to provide a substantial evidence base, which has informed my thinking and analysis throughout my work.
H.2 During the first phase of my Inquiry, focused on local government finance, I commissioned five pieces of analytical work to explore my interest in other countries' approaches to local finance arrangements, public attitudes to local government finance and taxation options. This included:
a team at the University of Cardiff, led by Professor John Loughlin, who built on their work for the Balance of Funding Review to explore international models of local government finance, and their advantages and disadvantages in terms of greater fiscal decentralisation;
Professor Tony Travers from the London School of Economics, who used the Cardiff work, and other pieces of international research, to produce a think piece on the key challenges of applying international models to the English system; and
NERA Economic Consulting, who were commissioned to do a comprehensive literature review of actual and suggested local tax options. This inevitably encompassed international examples of local taxes as well as more theoretical suggestions for change.
H.3 Two pieces of public attitudes work were also commissioned:
focus group work commissioned from GfK NOP Social Research gathered in-depth attitudes to the principles behind local taxation, including understanding who was responsible for services, and potential changes to local taxation; and
a national survey commissioned from BMG Research that aimed to quantify people’s attitudes to local taxation, as well as explore views on who should control local services and taxes. This survey was carried out in three separate waves.
H.4 Further details of the work outlined above, including a description of the findings up to the end of 2005, was provided in Annex D of my Consultation Paper and Interim Report, published in December 2005.
H.5 Following the extension to my Inquiry in September 2005, which enabled me to consider issues related to function before finalising my conclusions on funding, I commissioned a further phase of work to explore the current and future role and function of local government and the implications this may have for funding and finance. This programme of work included:
a consortium of researchers from the University of Cardiff, University of West of England, Leeds Metropolitan University and Manchester Metropolitan University, who conducted interviews with senior members, council officials and stakeholder organisations within nine case study areas
H RESEARCH AND STAKEHOLDER
ENGAGEMENT

H RESEARCH AND STAKEHOLDER ENGAGEMENT
156 Lyons Inquiry into Local Government - Final Report
to explore both the strategic role of local government and to focus more closely on six service areas - undertaking problem analysis through the delivery chain and identifying examples of good practice;
the Office for Public Management used the same nine case study areas and the same six services to undertake a series of public engagement events, working closely with the selected councils. These events were designed to engage citizens in debate in each area, providing a detailed picture of the issues councils are facing on the ground. The work focused particularly on questions such as; what local people wanted from local government, what the most appropriate role for local government in delivering national priorities and services may be; and how should local government be paid for?;
following this work, I held a series of expert seminars focused on the specific service areas to road test and explore further the findings arising from my case study work; and
a third wave of a national attitudes survey of the general public was commissioned from BMG Research to cover my extended remit - quantifying people’s attitudes to the role and function of local government, as well as providing further information on issues related to finance.
H.6 I also undertook a range of activities to understand the views and advice of experts and other stakeholders. In particular:
I held three periods of consultation and discussion during my Inquiry, generating more than 2,500 responses. A summary of the stakeholder views I received on my original funding remit were published in Annex C of my Consultation Paper and Interim Report. My May 2006 report, National prosperity, local choice and civic engagement, invited comment on a range of questions related to the role and function of local government. A summary of the key messages from responses since December 2005, are presented in Annex F. Finally, in December 2006, I published a discussion document inviting views on the implications for local government of the Leitch Review on Skills, the Eddington Transport Study and the Barker Review of Land Use Planning. A summary of these responses is provided in Annex G;
bespoke engagement events were conducted, including a series of round-table events with members of the business community in four areas across England (Leeds, Newbury, London and Coventry), and a series of workshops with a range of councillors held in Warwick, Liverpool and London. Findings from this work were published in October 2006;
a national conference, supported by Neil Stewart Associates, on Promoting Economic Prosperity was held in London in September 2006, with contributions from Rt. Hon. Ruth Kelly MP, Secretary of State for Communities and Local Government; John Healey MP, Financial Secretary to the Treasury; Sir Digby Jones, former Director General of CBI; and David Frost, Director General of British Chamber of Commerce, among others; and
other events brought together academics and other experts from across the public, private and voluntary sectors to discuss and critically assess key themes within my Inquiry including the role of public engagement and driving efficiencies in local government.

RESEARCH AND STAKEHOLDER ENGAGEMENT H
Lyons Inquiry into Local Government - Final Report 157
H.7 This annex brings together the key findings from my wide-ranging programme of research and stakeholder engagement. The full research reports and related work have been published by the Inquiry and are available from the Inquiry's website.1 A copy of the website, complete with reports, research and selected submissions, is also available from the National Archives and UK Web Archiving Consortium.2
KEY FINDINGS FROM MY CASE STUDY WORK
H.8 Nine case study areas were selected using a range of sampling criteria including political control, government region, population, authority type and performance to ensure a wide range of characteristics. Two areas included two tier authorities and the researchers worked with both county and district representatives. The areas selected were: Barnet, Bristol, Essex (including Braintree, Brentwood Chelmsford, Colchester and Tendring), Hartlepool, Nottingham, Sheffield, Shropshire (including Oswestry, Shrewsbury and South Shropshire), Southampton and Trafford.
H.9 This summary draws on all three strands of the case study work:
interviews with a range of senior members, local government officers and partner organisations;
public engagement events; and
expert seminars.
The strategic role of local government
H.10 The strategic or place-shaping role of local government was explored within all nine case study areas. Senior members and officials were interviewed in each area focusing on:
the strategic role of the authority and the challenges of place-shaping;
central-local relations and the case for devolution;
options for streamlining and clarifying accountability; and
options for managing the pressures of increasing demand and constrained resources.
H.11 The public engagement events in all nine areas included sessions focused on exploring citizens views of local government’s current and future strategic role, particularly in place-shaping. This included debating:
positive and negative views of the area in which people lived;
priorities for improvement; and
the current and future role of local councils in place-shaping.
H.12 The term 'place-shaping' was reassuringly interpreted fairly broadly among local authority councillors and officers across a range of service areas. Examples varied from large-scale regeneration projects to relatively local instances of community engagement. All were seen as important features of place-shaping and included:
1 The Lyons Inquiry website: http://www.lyonsinquiry.org.uk
2 Archived copies of the Lyons Inquiry website: http://www.webarchive.org.uk/tep/15454.html
Place-shaping

H RESEARCH AND STAKEHOLDER ENGAGEMENT
158 Lyons Inquiry into Local Government - Final Report
Southampton – where the City Council has taken a lead in re-positioning the city as a hub for knowledge based industries. They have facilitated major physical developments as well as promoted partnership working with the city’s two universities, developing Chilworth Science Park as a base for high-technology businesses;
Essex – where the council has led a partnership – firstsite:newsite - promoting the economic and urban renewal of Colchester through the development of a new arts centre;
We want to show what art means to people and the wider community. The partnership is delivering something distinct and innovative. (Kate Wood, Director, Firstsite).
Barnet – who have developed their ‘Three Strands Approach - Protect, Enhance and Grow’, a focussed, sustainable vision for development and planning in Barnet. The council are developing the area through design and construction planning based on sustainable and environmentally responsible development.
H.13 There was strong support for local government taking on a greater role in place-shaping across the board – in all areas and from the public as well as local authorities. From local authority officers, there was greatest support for this enhanced role in urban areas.
H.14 All respondents agreed that place-shaping should enable local government to focus on the key strategic issues facing their area.
I think there has been a major turn around in the last seven to ten years, local authorities actually thinking about the community leadership role and their involvement in the community a lot more than it has in the past. And I think they are realising it isn’t just about delivering a service to people. (Senior local government councillor)
H.15 The concept of place-shaping was seen by some local authority interviewees as summarising or formalising a role which historically has been undertaken by local government; these local government councillors or officers were usually working within strategic roles. Other interviewees saw place-shaping as a relatively new agenda; this group were often working in more traditional or hierarchical service areas such as adult social care or children’s services.
H.16 Although not always familiar with the term place-shaping, members of the public at the engagement events talked about a role for local authorities which went much wider than providing services. This included valuing the characteristics of a place, protecting what is good about an area and addressing things in need of improvement. Participants clearly highlighted the very important local dimensions to the issues they raised, which they felt needed a local, rather than national, solution suggesting a lead role for local government:
in Bristol, the council was seen as having a role in curtailing the number of bars that opened, in the interests of community safety within the area;
in Trafford, a similar issue arose around the number of fast food outlets which were felt not only to be out of keeping with the local environment, but also encouraged poor diets and led to obesity; and
Support for place-shaping
role

RESEARCH AND STAKEHOLDER ENGAGEMENT H
Lyons Inquiry into Local Government - Final Report 159
in Essex, there was considerable discussion about the need for the council to be more proactive in developing links with the local and national businesses as a way of funding activities and facilities for local communities. Participants gave the example of partnership working between B&Q and the local fire service to provide activities for children in the holidays.
H.17 When asked about place-shaping, many participants at the public engagement events suggested that local councils - who had been elected to represent their citizens and make public choices - were well placed to carry out a lead role in place-shaping their area, suggesting this should include:
representing the public’s interests;
protection of what was good about an area and addressing things in need of improvement in addition to their role as service provider; and
facilitating improvements through negotiation across the different interests and priorities within their area.
H.18 They also felt that local government was the tier of government which best understood the needs of a local area and was most likely to put those needs first. Although many warned that local councils were not without fault, they suggested that local government was the best alternative to central government.
I don’t trust local government, but I trust central government even less. (Public engagement participant).
H.19 Although the concept of place-shaping was widely supported, several respondents mentioned constraints which they currently faced in carrying out place-shaping effectively. These constraints were highlighted both by participants at the public engagement events and by local authorities themselves.
H.20 Three issues were particularly identified by local authorities, which they felt inhibited them carrying out the most effective place-shaping role within their area:
partnership working – particularly the complex and changing map of partner organisations. For example in Barnet, interviewees commented that the planning and delivery of large-scale infrastructure (transport, utilities, health and educational provision) were spread across a range of different agencies.
If you want to get your transport strategy approved you have to go through three layers of government, and that takes a lot of investment. (senior local government officer)
central government ‘crowding out’ – through exercising strong vertical control, particularly through targets, inspection and specific initiatives. Interviewees felt central government current crowds out space for local government to carry out place-shaping effectively at a local level.
You can’t have these national and regional silos operating vertically and then when you get down to our level say ‘by the way we want horizontal integration’. It just doesn’t work. (Local government councillor).
lack of flexibility in funding – in particular, respondents identified ring-fenced grants and capped council tax acting as barriers to allocating resources effectively at a local level.
Barriers to place-shaping

H RESEARCH AND STAKEHOLDER ENGAGEMENT
160 Lyons Inquiry into Local Government - Final Report
Capping means that the extent to which the council can address some key place-shaping issues identified by the public is very limited. (Senior local government officer).
H.21 Interviewees also identified a lack of ability to invest in infrastructure such as roads and trams as an inhibitor:
Money … for infrastructure development is absolutely key for us and the freedom to raise that … The constraint is not having the freedom to properly invest. We will support that investment ourselves. We’re not asking for more money from the government. We’re saying we can raise that from the markets and pay for it out of the development. (Senior local government officer)
H.22 Members of the public who attended the public engagement events provided illustrations of the above barriers. They discussed central government ‘crowding out’ local choice or flexibility as a key issue, and some felt that central government were ‘over bearing’ and didn’t provide space for local government to act in the local interest.
If they [central government] pay for it, they feel they can play the tune – it should allow local government to breathe. (Public engagement participant)
H.23 Many also expressed lack of trust in local government to take on this agenda at present. Some suggested councillors ‘lived it up’ on expenses and others saw officers as disengaged, particularly because of lack of communication and dialogue with citizens.
H.24 A majority of the suggested solutions from councillors and local government corporate staff focused on creating more space at a local level to determine and act upon local priorities. Interviewees called for fewer targets, less inspection, fewer central government initiatives and clearer and more joined up thinking in those that remain. Facilitating partnership working by simplifying the system and boosting local authorities legitimate convening role were also suggested. In terms of funding, most emphasised the need for more flexibility within their budget. They criticised ring-fenced grants, passporting of resources to schools particularly, and argued for additional, more buoyant sources of local government finance.
H.25 Participants at the public engagement events also suggested that changes could be brought in to make local government’s role in place shaping more effective. Many called for greater dialogue between the council and local residents, giving them more of a voice in decisions about their neighbourhoods:
Even if you’re a service user you should have some influence – I still want to have a say. (Public engagement participant)
H.26 Several participants also discussed the role of planning in place-shaping. People felt that effective planning was core to local government's place-shaping role and believed that currently too many of the decisions were taken out of their hands. They called for more planning powers to help local authorities shape an area. Participants also recognised that it wasn’t all about changing the system. They believed that their local councils should be more visibly proactive in planning, and ensure that they undertake strategic planning across their whole area. They also saw a key part of this role as representing local people’s interests and appropriately engaging citizens in the planning process.
Making place-shaping more
effective

RESEARCH AND STAKEHOLDER ENGAGEMENT H
Lyons Inquiry into Local Government - Final Report 161
Local government and service provision
H.27 The case studies explored six services or functions in detail (two in each case study area). Interviews were carried out in each area with councillors, local government officers and appropriate partner organisations such as Primary Care Trusts and the police. Interviews particularly focused on:
the issues and barriers facing the service;
methods of funding;
central-local relations; and
local stakeholder relations.
H.28 Service specific discussions were also held in each of the public engagement events. The services were selected to represent a range of ‘types’, each being a significant area of work for local government, facing different pressures and with different central-local relations. They included: economic development; children’s services; adult social care; waste and recycling; health and well-being; and community Safety. The services were explored in each area as follows:
Study councils Service areas
Barnet Waste and recycling
Health and well-being
Bristol Economic development
Community safety
Essex, plus Braintree, Brentwood, Chelmsford, Colchester and Tendring
Waste and recycling
Children's services
Hartlepool Health and well-being
Children’s services
Nottingham Economic development
Community safety
Sheffield Economic development
Adult social care
Shropshire, plus Oswestry, Shrewsbury and South Shropshire
Waste and recycling
Adult social care
Southampton Community safety
Children’s services
Trafford Health and well-being
Adult social care

H RESEARCH AND STAKEHOLDER ENGAGEMENT
162 Lyons Inquiry into Local Government - Final Report
H.29 An expert seminar was held on each of the service areas following this research to discuss the case study findings and add to the evidence base. These seminars brought together a range of specialists from across the public, private and voluntary sectors, and from academia and think tanks. A diverse range of views was heard and a range of evidence drawn upon which have informed my final conclusions and recommendations.
H.30 There are some general messages that can be drawn out across all six service areas, these are outlined below.
H.31 Councillors, officers and stakeholder organisations all spoke of the significant pressures faced in all six services. These pressures can be categorised into three broad themes:
changing demographics, which interviewees across a number of service areas argued were increasing both the number and scale of need of service users. In social care, for example, the growing and ageing population, and in community safety the increase in instances of anti-social behaviour and fear of crime, were cited as pressures on service delivery;
new and additional legislation and initiatives. For example, in children’s services most interviewees were concerned primarily with the implementation of the Every Child Matters and the Working Together agendas, and in waste and recycling the EU targets to reduce dependence on landfill; and
an increase in public expectations of what was being delivered. Across all service areas interviewees reported a perceived increase in the expectations of the quality and quantity of services being delivered to the public.
H.32 Participants at the public engagement events recognised the increased pressures that many service areas were facing. In particular, participants identified the increased demand on different services due to changing demographics or behaviour, or higher expectations on that service area. Those services particularly highlighted included adult social care, community safety, health and well-being, and waste and recycling.
H.33 All interviewees, whether working in service areas with a strong national framework such as adult social care, children’s services or waste, or in a more cross-cutting role in services such as economic development, health and well-being or community safety, felt that the current system relied too heavily on top down instruments such as prescriptive guidance, performance targets and inspection.
The performance agenda [for adult social care] is driven by numbers and not necessarily by quality and not necessarily of things that the social workers on the ground can actually see are the most appropriate numbers to be counting. (local government officer)
Another example of the kind of preoccupation with inspecting and checking [for children's services] and the onerous requirements, and that is the children’s JAR, Joint Area Review … I was amazed with the number of inspection teams … the amount of time and preparation and information that’s got to be collected to me it’s crazy, absolutely crazy. (local government officer)
Issues and pressures
Central-local relations

RESEARCH AND STAKEHOLDER ENGAGEMENT H
Lyons Inquiry into Local Government - Final Report 163
H.34 Effective partnership working was seen as key to addressing issues and pressures in all service areas – where partnerships were working well, services were seen as being delivered efficiently; where partnerships were problematic they were identified as being key barriers to effective delivery. Interviewees from all service areas recognised that both horizontal and vertical partnership working was important in achieving effective service delivery. Several good examples of partnership working were identified and discussed by interviewees. In economic development there were often strong partnerships working across local authority boundaries.
So we all work and share information and collaborate on a variety of projects and initiatives because there’s nothing more silly than not selling the whole of the area to businesses and appearing ridiculous if we stopped providing the service if a firm was interested in locating beyond our boundaries. If it’s good for the sub-region it will be good for the four authorities. (Senior local government officer)
H.35 However, not all partnership working was successful and there were considerable frustrations expressed by both council officers and stakeholders across a range of service areas. In particular, the vertical accountability of national organisations like the NHS, Job Centre Plus and Learning and Skills Council was viewed as a barrier, with different boundaries, targets, priorities and eligibility criteria.
The council is a major agent in economic development but so are Job Centre Plus and the Learning and Skills Council. Both of those organisations work to a central government agenda entirely and have very little discretion and now because of cuts even less discretion to actually address local priorities. (Local government officer)
H.36 Participants at the public engagement events also discussed local councils' role in partnership working and recognised the need for councils to work in partnership with others in successful delivery seeing a lead co-ordinating role for local government:
They should be a body that bangs heads together (Public engagement participant)
H.37 There was some call for increases in overall funding coming to an authority; however, most interviewees emphasised the need for greater flexibility within their budget and less short-term funding. They criticised capping of council tax, ring-fenced grants, passporting of resources to schools and the introduction of new and expensive service standards. For example:
At the moment government is far too prescriptive in terms of what it expects of local government and there is too little freedom and flexibility. The key is first of all finance, so long as 75 per cent of our spend comes direct from government grant, we are inevitably heavily dependent on government. Some of it is ring-fenced grant, other’s not, but then there is a capping level … plus of course the gearing effect on the council tax, which is a strong disincentive … So I mean I’m a firm believer that local government needs to raise more of its own money. (Senior local government member)
H.38 Calls for greater flexibility in funding came mainly from corporate local government officials who made comments such as:
There is very little flexibility in reality and that’s part of the problem. When you come to budget, 90 per cent is spoken for before you start … And you think, what money have we got to play with? And the answer usually is precious little because
Partnership working
Funding/ delivery

H RESEARCH AND STAKEHOLDER ENGAGEMENT
164 Lyons Inquiry into Local Government - Final Report
it's committed. There is very little room to play with. (Corporate local government officer)
H.39 Short-term funding pots were a greater cause for concern for those from cross-cutting services such as community safety and health and well-being.
Short-term funding is always a difficulty with communities because if they think this is just short-term fix they don’t buy into it. They get quite upset in fact … What’s going to happen at the end of the year then? Don’t know – Well what’s the point of us committing if you’re going to pull them out? You need the longer-term strategic approach to this kind of subject if you’re going to get communities really engaged and supported because they will see through it. (Senior police officer)
Suggestions for reform
H.40 There were some very different perspectives on what needs to change in each service area from local government councillors and officers depending on where the interviewee sat in the current structure and where their current levers or areas of influence were. Views could be categorised into three different groups.
H.41 Interviewees focusing on the strategic or place-shaping role of local government had a wider perspective of the role of local government than those working in specific service areas, who generally held more of a narrow perspective. This group called for less use of hierarchical policy instruments, simplification of the complex web of institutions involved in governance and sought additional, more buoyant forms of local government finance, more local control and setting of local priorities.
I think ring-fencing brings bureaucracy and I think we’ve got enough of that and we’re trying to get rid of that. It also gives a message of a lack of trust sadly (Senior strategic local government officer)
H.42 Officers in cross-cutting service areas held a similar view to the corporate perspective. Their work involved significant partnership working including economic development, health and well-being and community safety. This group were often frustrated by the difficulties of working alongside and across traditional service silos. They were used to relying on influence and finding room in a crowded agenda.
H.43 This group called for more space to work at the local level on local priorities and several argued for less central prescription and more autonomy at a local level:
Is there an answer that actually allows local discretion on spending on things that matter, that doesn’t leave the Government feeling embarrassed to account for public sector spending that’s not in their control? Because it feels like everything’s about trying to give them the reassurance that they can show that they’re being prudent (Senior strategic local government officer)
H.44 Officers and councillors currently working within typically traditional service areas for local government, with significant spend and resources attached, such as adult social care, waste and children’s services (particularly child protection), saw the benefits of strong hierarchical management – centrally driven targets, performance management and ring-fenced budgets – and believed that they enjoyed a higher profile in their council because of these tools.
Corporate perspective
Cross-cutting
Hierarchicalperspective
RESEARCH AND STAKEHOLDER ENGAGEMENT H
Lyons Inquiry into Local Government - Final Report 165
H.45 However, they did also report that often there was too much centrally driven performance management and excessive regulation, and believed a reduction in this would improve efficiency.
H.46 Across all officers and members there were four key areas where interviewees called for change:
firstly, calling for less central prescription (this was to different extents, and on different aspects depending on which service area they worked on);
secondly, a general call for more engagement with service users and policy makers within central government departments;
thirdly, a need for clarity over functions and responsibilities, and accountability between their role and the role of central government departments; and
fourthly, an end to short-term funding regimes.
H.47 Attendees at the public engagement events supported national minimum standards across most service areas, with a call for more local choice and flexibility. Participants felt that this would lead to more innovation, ambition and ownership of local solutions for local problems, whilst providing reassurance of a basic level of service.
H.48 However, there were two service areas where participants called for national standards, which all areas should follow, and greater accountability at the centre. For adult social care, and in particular, the supply of residential care, people felt that everyone deserved the same access to social care at the same level of quality and cost. They also saw that changing demographics meant that a higher need in certain areas should be seen as a national problem, not a problem for that area. Children’s services was the other service area where people felt strongly that there was a role for national determination in the protection of vulnerable children.
BMG SURVEY
Overview
H.49 I commissioned BMG Research to conduct a survey to explore public attitudes towards local government.3 The fieldwork was conducted in three waves. These covered attitudes to funding local government and the role and function of local government. Conducting three waves provided the following benefits: first, it allowed further exploration of issues arising from each wave; second, it allowed analysis of the extent to which public perceptions varied over time; and third it provided an opportunity to consider the impact of external factors such as media reports. This final report from the survey combines the results from all waves of research.4
3 Qualitative work was undertaken by NOP World and the Office of Public Management. The findings from these were considered in detail when designing the quantitative survey.
4 BMG research, Lyons Inquiry Survey 2007.

H RESEARCH AND STAKEHOLDER ENGAGEMENT
166 Lyons Inquiry into Local Government - Final Report
Role and function H.50 Respondents were asked about the balance between national standards laid down by central government and local councils freedom to decide on the level of service provided. Views tended to reflect respondents current understanding of who was responsible for each service area. A majority believed;
local councils should be free to decide the level of service they provided in relation to issues such as leisure services (76 per cent); refuse collection (74 per cent); and social housing (68 per cent);
central government should set national standards for the NHS (80 per cent); education (69 per cent); police (67 per cent); and fire and rescue services (60 per cent).
H.51 Local councils were regarded as being better at ‘seeing the bigger picture’ (53 per cent), having ‘more money’ (26 per cent) and ‘more power’ (23 per cent). Whilst central government was judged to have ‘a better understanding of the local picture’ (65 per cent), they were ‘better able to target resources to needs’ (46 per cent), and ‘better able to reflect local needs’ (31 per cent).
H.52 A majority of respondents felt local councils should be responsible for setting standards and priorities for many of the services they are responsible for however, few (13 per cent) believed they should be entirely free to provide the standard of service they felt reflected what the community wanted and needed.
H.53 At waves one and three respondents were asked whether they thought it mattered if local levels of service were not the same in different parts of the country. Considering the combined data from both waves, around half (55 per cent) of all respondents believed it did matter if local levels of service were not the same. Interestingly, once the concept of successful public consultation was introduced; two thirds (67 per cent) agreed that it did not matter if local councils provided a different level of service as long as people were consulted and were happy with the service they receive, and only 14 per cent disagreed.
H.54 Over half (54 per cent) of respondents in wave three mentioned at least one service that they would like to have a say in the standards of – the most often mentioned were police and community safety (25 per cent), and the NHS (19 per cent).
H.55 Those who felt council tax in their area provided poor value for money were more likely than those who felt it provided good value for money to report a desire to have a say in at least one of the services asked about.
H.56 Of the 45 per cent who expressed an interest in getting involved themselves, a half (50 per cent) reported that they would prefer to do so via public meetings, two fifths (41 per cent) via surveys, focus groups and related research mechanisms, and around a quarter via petitions (28 per cent), meetings with councillors (27 per cent), meetings of groups to which they belonged (24 per cent), at a meeting with council staff (24 per cent), and written communication (22 per cent). Few mentioned standing for council elections (6 per cent).
Setting standards of
delivery
Variation in service
provision
Public engagement

RESEARCH AND STAKEHOLDER ENGAGEMENT H
Lyons Inquiry into Local Government - Final Report 167
Funding H.57 In wave one it was local councils that respondents felt should have the greatest control over setting council tax levels (41 per cent), and over half (53 per cent) felt central government should have the least say. Views were balanced as to the role of local residents, with just over a third (35 per cent) feeling they should have the most say, and an equal proportion (35 per cent) feeling they should have the least say.
H.58 Despite the fact that around three quarters (78 per cent) of all respondents reported that their household paid all of their council tax, it is clear that many people did not know which council tax band their house was in, regardless of whether they paid all/some council tax themselves, or whether council tax benefit paid it all. Over a third simply did not know (34 per cent), and around a further quarter (23 per cent) provided the incorrect band.
H.59 There was also low awareness of the proportion of the money that a local council spent every year came from council tax. Over a third (35 per cent) of respondents did not offer a response, and around two fifths (44 per cent) provided the incorrect balance of funding for their local council.
H.60 There was a strong sense from the three surveys’ that a household’s ability to pay, rather than the size of the property, the size of the household, use of services or the value of the property is the most important factor.
H.61 A fifth (20 per cent) of all respondents mentioned property value, and a third (32 per cent) mention property size. Income was seen as the more equitable basis on which to calculate local tax, mentioned by over two fifths (42 per cent) of people.
H.62 When respondents were asked the extent to which they agreed or disagreed that if a person’s house went up in value more than others in that area they should pay more council tax. While a quarter (25 per cent) did agree that this should be the case, over half (55%) disagreed to some extent.
H.63 In wave one, over two in five (43 per cent) respondents agreed that there should be regular revaluations to take into account changes in house prices, while just over a third (34 per cent) disagreed with the concept.
H.64 It should be noted that this section is largely based on a set of hypothetical questions that tended both to be difficult for respondents to answer (hence some questions had high levels of ‘don’t knows’/’not provided’), and that were also more difficult to analyse definitively.
H.65 Consequently some caution should be shown when considering the results of this section of the report.
H.66 When asked about which group, if any, respondents felt should be subsidised they were most likely to say pensioners, and to support an automatic payment to pensioners to allow them to pay less council tax, even if they owned a property without a mortgage. This proportion fell to half (51 per cent) when savings, pensions and investments were introduced.
H.67 Respondents identified high earners as the primary group to pay more to compensate for pensioners paying less (46 per cent). A much smaller proportion (17 per cent) mentioned that all working people should pay more. Over a quarter (27 per cent) could not or refused to provide an answer to this question.
Responsibility for setting council tax
levels
Awareness of council tax
banding
Proportion of spending that
comes from council tax
Fairness-setting local
taxes
Attitudes towards
revaluation
Attitudes towards
subsidising others
Pensioners

H RESEARCH AND STAKEHOLDER ENGAGEMENT
168 Lyons Inquiry into Local Government - Final Report
H.68 Of those who mentioned that they would be prepared to pay more to subsidies pensioners, around a quarter (27 per cent) were not prepared to specify an amount, a similar proportion (25 per cent) reported that they would be prepared to pay an extra one per cent, a fifth (20 per cent) that they would be prepared to pay an extra two per cent, and a further fifth (18 per cent) an extra five per cent.
H.69 Overall, half (49 per cent) felt there should be a move away from council tax being entirely based on property values, comprised of a third (33 per cent) saying that council tax should be entirely replaced with a local income tax and 16 per cent saying that it should be partly replaced. Just over one in ten (14 per cent) thought that council tax should continue to be based solely on property values.
H.70 Half (50 per cent) of all respondents believed that pensioners would pay less tax if there were to be a move to local income tax, however only just over one in ten (13 per cent) thought that the amount their own household would pay would go up. This suggests that respondents did not link pensioners paying less tax to a possible rise in the amount of tax their own household would have to pay.
H.71 At all waves respondents were asked whether they thought local councils should be allowed to offer better quality services to those households that choose to pay more for them.
H.72 In waves one and three, opinions were very much balanced, with close to half (48 per cent and 46 per cent respectively) saying that local councils should, and similar proportions (48 per cent in both waves) that they should not be allowed to offer better quality services to those who choose to pay more for them.5
H.73 At wave three respondents were also asked whether their household would be prepared to pay extra in order to receive a new or better service from their council. Whereas around half (46 per cent) felt that councils should be allowed to offer new or better services to those who chose to pay for them, only 29 per cent reported that their household would actually take advantage of such an opportunity. Of these, one in ten (9 per cent) reported that their household would consider this option for all services, and one in five (20 per cent) that their household would consider this option for some services.
H.74 When those who reported that they would be prepared to pay more for some services were asked for which services they would be prepared to pay more, the key areas identified were the police (44 per cent) and the NHS (30 per cent).
H.75 Around a fifth mentioned: public transport (21 per cent); roads (21 per cent); refuse collection (20 per cent); education (18 per cent); social services (18 per cent); and leisure services (17 per cent).
H.76 In terms of level of service usage, it was those who were high or medium users of services who were more likely to report that their household would not be prepared to pay extra to receive a new or better service from their local council (65 per cent and 71 per cent respectively compared to 43 per cent of low users of services).
H.77 In contrast, close to a third (32 per cent) of low users of services reported that their household would be prepared to pay extra for all services. This points to a dichotomy, whereby those who are most likely to use services are least likely to wish to pay for them, and vice versa.
5 This question was not asked in Wave 2 of the Survey.
Local income tax
Charges for services

RESEARCH AND STAKEHOLDER ENGAGEMENT H
Lyons Inquiry into Local Government - Final Report 169
Bespoke engagement events with councillors
H.78 I held a series of councillor-focused events in July 2006 to seek the views of, and engage directly with, a range of councillors from across England. This important group of stakeholders – usually the public face of local government, elected to represent and make public choices – play a key local leadership role. Input from councillors has therefore been essential to my Inquiry. I am very grateful for all those who gave up their time to attend these events, and to Councillor Sir Simon Milton (Leader of Westminster City Council) in London, Councillor Bryony Rudkin (Suffolk County Council) in Warwickshire and Councillor Richard Kemp (Liverpool City Council) in Liverpool who supported me in co-facilitating these events.
H.79 I published a report of the events on the Inquiry website in October 2006. Some very clear messages emerged from across the three meetings, which are summarised below.
H.80 Firstly, there was a strong appetite among councillors for greater local responsibility. There was regret and frustration that local priorities were often crowded out by national pressures. Some councillors also expressed the view that moves towards further centralisation by successive governments had led to councillors often feeling disempowered. Councillors felt especially strongly about planning decisions, which they believed were often closest to the hearts of their constituents but where, too frequently, they felt that their councils were overruled by centrally determined priorities.
H.81 Secondly, there was a clear desire among the councillors to improve their communication with residents. Many felt that a more transparent and devolved system would assist this. Many saw communication as part of the process of public engagement. However, from what councillors said it was evident that councils vary in the extent to which they see proactive citizen engagement as part of their core business.
H.82 Across the three meetings councillors suggested a range of interesting ideas for change:
a more specific role description for councillors with a clearer indication of the time commitment required. Some councillors particularly commended the model used by the NHS for its non-executive directors;
there was enthusiasm for widening the pool of councillors, through providing appropriate training opportunities for people to develop necessary skills to become a councillor, and widening recruitment, going beyond political parties. However, several councillors stressed the need for political parties to also take on a greater role in improving the calibre of councillors; and
there was also a keen interest from councillors at all tiers to have responsibility for individual ward budgets.
Bespoke engagement events with businesses
H.83 During August 2006 I held four events across the country to consult with businesses on specific issues related to my Inquiry. I am very grateful to the 150 delegates from businesses who gave up their time to attend the events and contribute so fully to this debate. I would also like to extend my thanks to the Chambers of Commerce in Leeds, Thames Valley and Coventry and Warwickshire, together with

H RESEARCH AND STAKEHOLDER ENGAGEMENT
170 Lyons Inquiry into Local Government - Final Report
London First, British Chambers of Commerce, the CBI and the Small Business Service who successfully recruited a range of business representatives to each of the events. These events built upon the many meetings I have held throughout the life of my Inquiry with national, regional and sectoral business groups.
H.84 The events provided an opportunity for me to debate many issues with the business community including: the role for local government in ‘place-shaping’, exploring what this means for businesses; and their views and experience of the need for local choice and priority setting to reflect the different needs and aspirations of the communities within which they work.
H.85 Three key themes emerged across the four events:
firstly, businesses’ desire for economic prosperity to be raised higher up the local government agenda;
secondly, a clear call to see stronger leadership from local government across the area, championing the promotion of economic prosperity; and
thirdly, businesses identified a real need for local government officials and elected members to develop the appropriate skills, expertise and confidence to carry out this role successfully.
H.86 Overall, businesses supported local government developing a stronger place-shaping role, thus promoting prosperity in their area. Several attendees identified some examples of where local government are already taking on this role including Coventry, Manchester, Birmingham and Leeds, as well as some smaller areas such as Rugby. There was also wider recognition among attendees that place-shaping was important for both urban and rural areas. However, many attendees pointed out that these examples should be seen as exceptions rather than the norm and called for local government to raise its game to meet the challenges of this new role. In particular, they argued that local government needed to overcome two main barriers:
firstly, economic development needed to be raised up the agenda and be seen as a priority within local government; and
secondly, businesses questioned the skills base of some officers and councillors. Many felt that there was room for both officers and councillors to improve their knowledge and skills in relation to understanding and working with businesses, particularly in increasing their knowledge of the planning process and legislation.
H.87 Several businesses suggested that the debate around funding would be more fruitful and constructive if re-cast – not to be seen as about taxation or the funding of services – but about investment. They agreed that this debate should not be focused on taxing more, but about exploring what the right system was to ensure the best stewardship of public resources.
H.88 There was some appetite among businesses to raise money for economic development and increase investment at a local level based on three key principles:
that the money is spent locally;
it is transparent what the money is spent on; and
there is appropriate engagement of the business sector in how it is used.

RESEARCH AND STAKEHOLDER ENGAGEMENT H
Lyons Inquiry into Local Government - Final Report 171
H.89 Business Improvement Districts (BIDs) were seen to meet the criteria, set out above, by those who had experienced them. However, they were often seen as too small scale, time limited and overly bureaucratic. A majority of businesses recognised that big challenges around infrastructure could not be solved in the current system and showed an interest in developing the right funding mechanisms for achieving this.
Economic prosperity – the local contribution
H.90 I held a conference, supported by Neil Stewart Associates, in September 2006 to explore the role of local authorities and other agencies in promoting economic prosperity which was well received by both the public and private sector. I published a report from the conference on the Lyons Inquiry website in October 2006; a brief summary of the common themes that emerged on the day is provided below.
H.91 The conference heard from a range of speakers from across the public and private sector including central, regional and local government. Three common themes emerged from the event.
H.92 Firstly, there was a clear view from both speakers and delegates that local wealth creation should be far higher up local civic agendas and at the centre of a shared vision of economic prosperity between local authorities and local business.
H.93 The conference offered clear support for the concept of place-shaping, identifying good examples from across the UK. Speakers also compared the current British situation to the local civic dynamism that they argued could be found abroad in the USA and in European cities such as Turin and Barcelona, where public and private sectors share a common vision and have the freedom to pursue flexible local strategies.
Local government and local business work far more closely together through such institutions as Mayor’s offices and civic government [in the USA]. (Elisabeth Reynolds, Massachusetts Institute of Technology)
You see a wealth of pride in German cites, a pride in themselves, and everyone shares that both in business and in the public sector. They are all on the same side. (David Frost, Director General, British Chambers of Commerce)
H.94 The second theme called for a decentralised framework where the public and private sectors are able to move fast and flexibly without being held back by central constraints and performance targets.
Further devolved decision making and freedoms are required for regions and local areas, first; to respond to rapidly changing economic circumstances, second; to deal with persistent pockets of deprivation or sluggish economic performance and third to develop to their fullest possible potential. (John Healey MP, Financial Secretary to the Treasury)
We have to think and act long term but also have fewer but more strategic interventions. The government has a role in providing clarity but it must trust local government more. (Michael Parkinson, Director, European Institute of Urban Affairs)
H.95 Finally, both public and private sector speakers and delegates called for local government to develop a clear vision and strengthen their expertise, skills, leadership and understanding of enterprise so that they were more able to form effective partnerships with the business sector.

H RESEARCH AND STAKEHOLDER ENGAGEMENT
172 Lyons Inquiry into Local Government - Final Report
We need a far better quality of leadership at both councillor and officer level. (Sir Digby Jones, former Director General of the CBI)
As a property developer … I want to see strong leadership from local government. We want vision and someone who can see the future and who knows where they are going. (Tom Bloxham, Urban Splash)
H.96 The conference highlighted a shared view across the public and private sector that promoting economic prosperity was an issue that affected the entire country and was therefore everyone’s responsibility. There was a call for action, for the public and private sector to work together at both local and regional levels to promote economic development.