The Next Evolution of Library Cataloging: Finding Our Place in the 21st Century Information Ecology

“Study of all place-based interactions between living beings
and their environment”
Place-based Ecology
Adapted from Callenbach, 2008

Task (10:00 min/2 Groups)
Draw a diagram that shows the major components (boxes) and interactions (arrows) of a terrestrial ecosystem

Conceptual model
Source: Knight, 1994


Task (20:00 min/each individual)
Go outside and look for examples of laws of ecology on campus. Note them in your notebook.

Energy in the System
Source: www.reuters.com

Source: blogs.saschina.org/ http://www.brightsideofnews.com/news/2010/9/13/solar-tech-carbon-nanotubes-one-up-photovoltaic-cells.aspx
Energy (heat) transfer
Convection
Radiation

Evaporation 25%
Convection 5%
Thermal Rad. 17%
Net solar energy absorbed by the surface
48% Photosynthesis
< 1%
Earth-atmosphere energy balance

Latent heat flux
Latent heat flux

Source: http://www.srh.noaa.gov/jetstream/atmos/hydrocycle_max.htm
Latent heat transfer
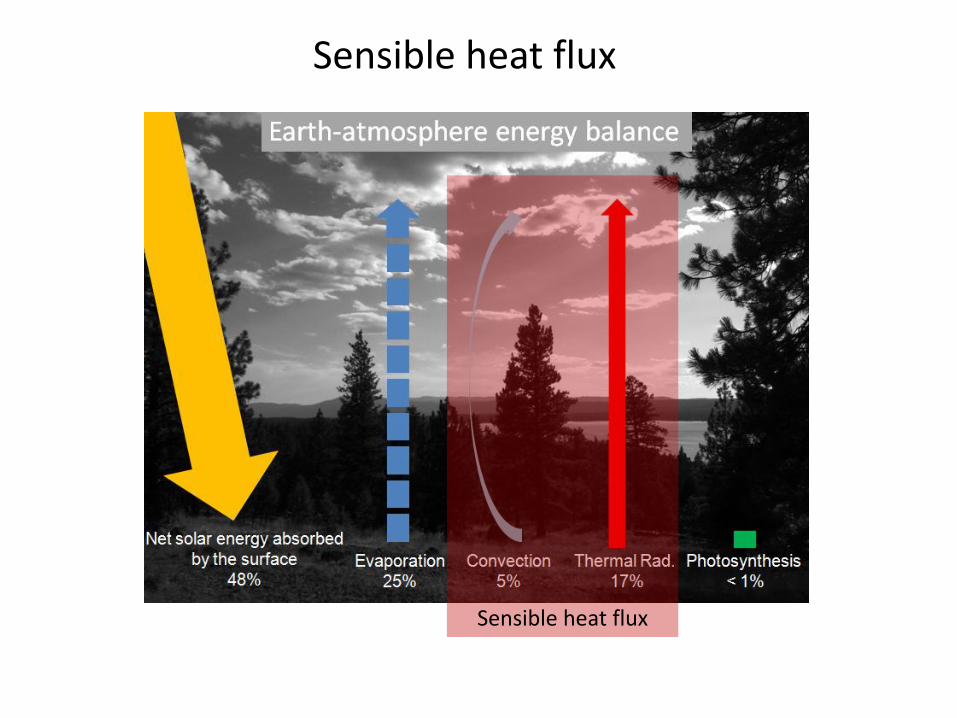
Sensible heat flux
Sensible heat flux

Sensible heat flux
Temperature (°C)
Rea
ctio
n r
ate
of
enzy
mat
ical
ly c
atal
yzed
rea
ctio
ns
(mm
ol P
rod
uct
per
un
it o
f ti
me)

Task (30:00 min/two groups)
Does respiration of yeast increase with increasing temperature?
100 ml
0.5 g of yeast 1 g of sugar
100 ml 100 ml 100 ml
Increasing temp
Measure CO2 and Temperature after 1 minute and record data
Make a scatter plot of the data by using R Commander
Important: Set gas sensor to 0-10 000 ppm

Growing degree days (or heat units)
Tbase = minimum temperature required for plants to grow (McCall area 5°C)
Using growing degree days to predict phenology
http://ian.umces.edu/discforum/index.php?topic=615.0

Task (10:00 min/two groups)
Record the air temperature above:
- Lake surface
- Parking lot
- Above grass canopy
- Within grass canopy
Make sure all locations you measure are sun lit

Source: Deren, 2010
Climate in the McCall area

Data source for plot: Western Regional Climate Center (http://www.wrcc.dri.edu/cgi-bin/cliMAIN.pl?id5708)
Climate in the McCall area (cont.)

Source: http://www.wrcc.dri.edu/cgi-bin/cliMAIN.pl?id5708
Climate in the McCall area (cont.)

Task (30:00 min/two groups)
How many growing degree days did we get over the last 5 days at Bear Basin?

Evaporation 25%
Convection 5%
Thermal Rad. 17%
Net solar energy absorbed by the surface
48% Photosynthesis
< 1%
Earth-atmosphere energy balance

Temperature sensors
Logtag manual
Logtag tutorial

Temperature sensors (cont.)
Which temperature line (red or blue) is associated with the treated and untreated forest?

Task (Groups of 2)
Configure temperature dataloggers so they record temperature data every 5 minutes. Set record readings to 1 day:
Place your data logger somewhere on campus for the next few hours. To have a wide variety of different locations on campus that potentially show temperature differences (such as MOSS beach, parking lot, dense tree canopy etc.) talk to the other groups.

Environmental gradients/life zones
Source: Matthew Deren, 2010

Photosynthesis
Photosynthesis

Photosynthesis

Nature article
First evidence for photosynthesis in insects

Photosynthesis
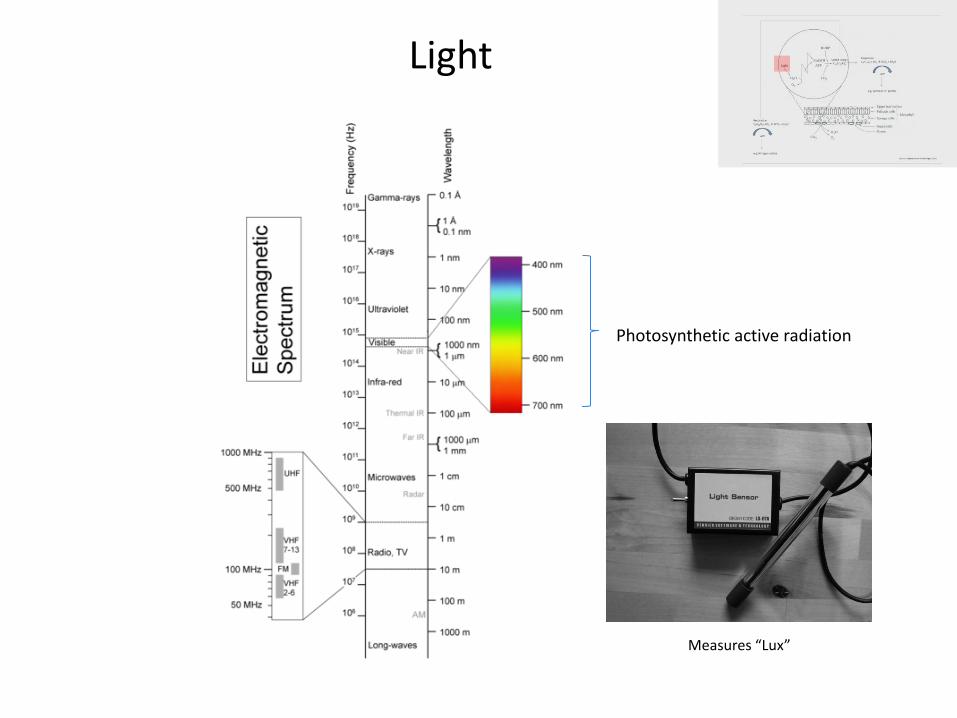
Photosynthetic active radiation
Measures “Lux”
Light

Task(10:00 min/two groups)
How does light availability change within a plant canopy?
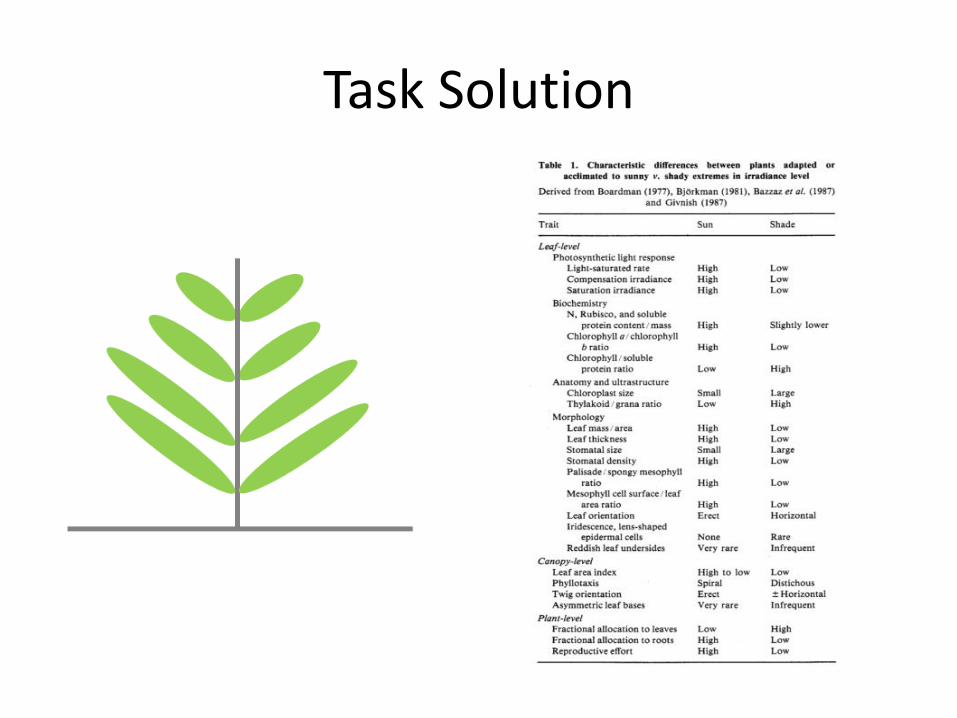
Task Solution

Photosynthesis

Figure 1. Relationship between chlorophyll content and rate of photosynthesis in soybean leaves. Chlorophyll mutants as open circles; cultivars as solid black circles (Buttery and Buzzell, 1977).
Figure 2. Relationship between chlorophyll per area and maximum Photosynthesis in sugar beat (Taylor and Terry, 1984)
Chlorophyll

Task(10:00 min/two groups)
Leaf chlorophyll analysis with a flatbed color scanner
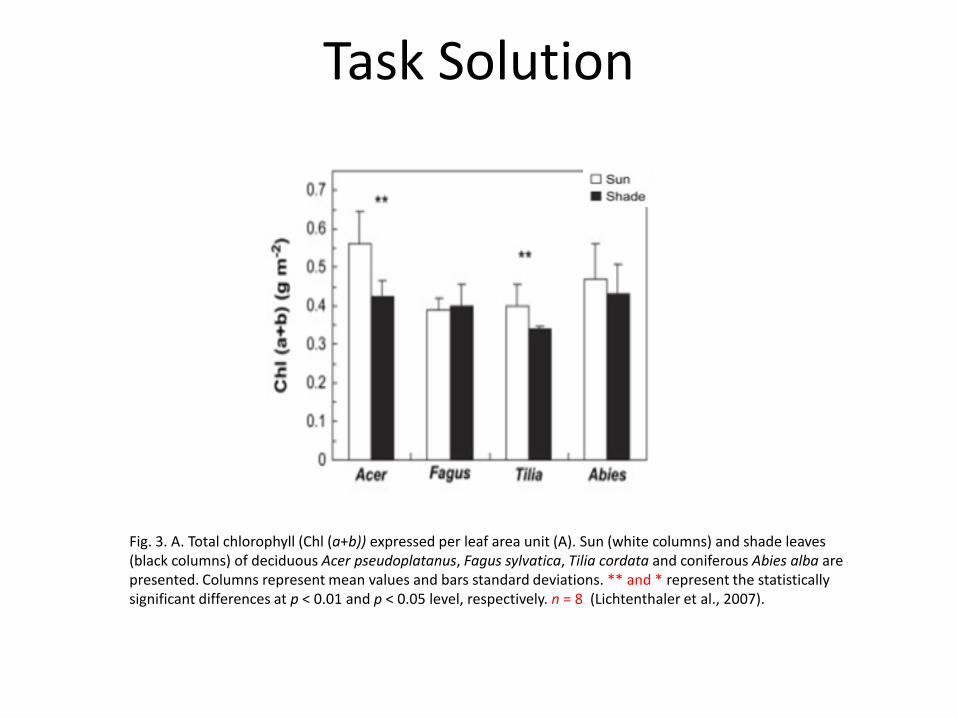
Fig. 3. A. Total chlorophyll (Chl (a+b)) expressed per leaf area unit (A). Sun (white columns) and shade leaves (black columns) of deciduous Acer pseudoplatanus, Fagus sylvatica, Tilia cordata and coniferous Abies alba are presented. Columns represent mean values and bars standard deviations. ** and * represent the statistically significant differences at p < 0.01 and p < 0.05 level, respectively. n = 8 (Lichtenthaler et al., 2007).
Task Solution

Photosynthesis

Water-use efficiency
Water-use efficiency
Source: Raven et al. 2000

Task (30:00 min/2 groups)
Let’s bag some leaves …

Photosynthesis
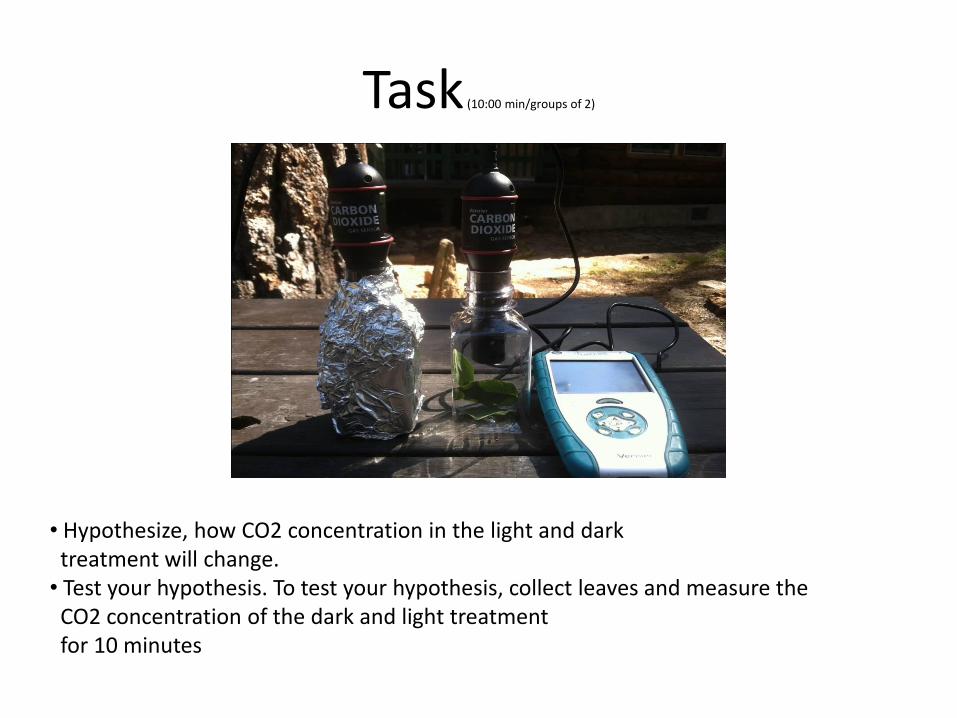
• Hypothesize, how CO2 concentration in the light and dark treatment will change. • Test your hypothesis. To test your hypothesis, collect leaves and measure the CO2 concentration of the dark and light treatment for 10 minutes
Task (10:00 min/groups of 2)

Task (5:00 min/each)
How do you think increased CO2 concentration will affect plant growth and soil moisture?

Task Solution
Water cycle Biomass production

1 2
Stomata closed
Stomata open
Task (2:00 min/each)
Both leaves are exposed to the same environmental conditions (e.g., temperature etc.). Which leaf surface (1 or 2) do you think is warmer and why.
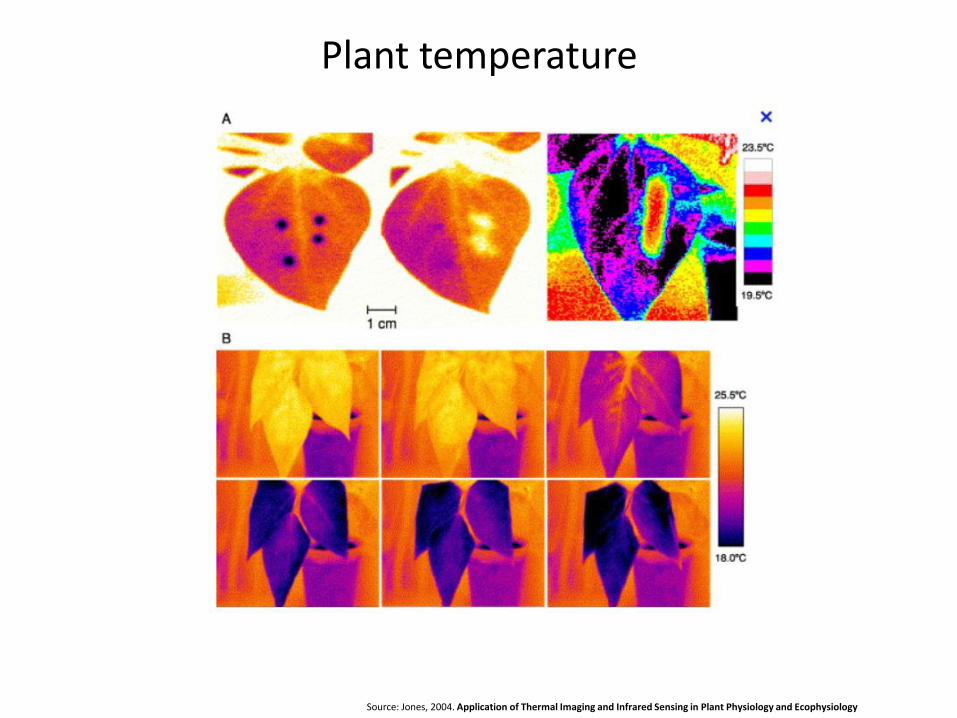
Source: Jones, 2004. Application of Thermal Imaging and Infrared Sensing in Plant Physiology and Ecophysiology
Plant temperature

Plant temperature (cont.)

Gross and net-primary production (NPP)
Net-primary production = Gross primary production – respiration Savings = Total income - spending

Carboxyl -Group Amino-Group
Nutrient update
NO3-
NH4+
NO3-
NH4+
Source: http://en.wikipedia.org/wiki/Pine_nut

Sun
Picture Sources: Raven et al., http://fishandgame.idaho.gov, http://www.kidcyber.com.au, http://www.jhaa.org/articles/tree-root-systems.htm Flow chart adapted from: http://www.marietta.edu/~biol/biomes/ecosystems.htm
Carnivores Herbivores
Sunlight drives … (cont.)
Energy Nutrients

All flesh is grass …