PitchBook Q1 Benchmarking for Private Equity and Venture Capital
19
VC DISTRIBUTIONS TO LPS SLOW TO BEGIN 2016 2007 VINTAGE PE FUNDS YET TO REALIZE DPI OF 1.0X HORIZON KS-PME BENCHMARKS FOR PE & VC 6 11 16 SPONSORED BY BENCHMARKING + FUND PERFORMANCE through 1Q 2016
-
Upload
jarrod-job-cpa-mba -
Category
Economy & Finance
-
view
127 -
download
2
Transcript of PitchBook Q1 Benchmarking for Private Equity and Venture Capital

ww
VC DIS T RIBU T IONS T O L PS SL OW T O BEGIN 20 16
200 7 V IN TAGE PE F UNDS Y E T T O RE AL IZE DPI OF 1 .0X
HORIZ ON KS-PME BENCHMARKS F OR PE & VC
6
11
16
SPONSORED BY
BENCHMARKING+ F UND P ERF ORM A NCE
through 1Q 2016

Credits & ContactPitchBook Data, Inc.
JOHN GABBERT Founder, CEO
ADLEY BOWDEN Vice President,
Market Development & Analysis
Content
NIZAR TARHUNI Senior Analyst
KYLE STANFORD Analyst
DYLAN COX Analyst
ELIZABETH ARMON Analyst
BRYAN HANSON Data Analyst
JENNIFER SAM Senior Graphic Designer
Contact PitchBook pitchbook.com
RESEARCH
EDITORIAL
SALES
COPYRIGHT © 2016 by PitchBook Data, Inc. All rights reserved. No part of this publication may be reproduced in any form or by any means—graphic, electronic, or mechanical, including photocopying, recording, taping, and information storage and retrieval systems—without the express written permission of PitchBook Data, Inc. Contents are based on information from sources believed to be reliable, but accuracy and completeness cannot be guaranteed. Nothing herein should be construed as any past, current or future recommendation to buy or sell any security or an offer to sell, or a solicitation of an offer to buy any security. This material does not purport to contain all of the information that a prospective investor may wish to consider and is not to be relied upon as such or used in substitution for the exercise of independent judgment.
Introduction 4
PE & VC KS-PME Benchmarks 5-6
KS-PME Case Study: IT 7
IRR by Fund Type 8
Quartiles & Benchmarks 9
PE IRRs 10
PE Fund Return Multiples 11
PE Fund Cash Flows 12-13
VC IRRs 14
VC Fund Return Multiples 15
VC Fund Cash Flows 16
Select Top Funds by IRR 17
Methodology 18
Contents
3 PITCHBOOK GLOBAL PE & VC BENCHMARKING & FUND PERFORMANCE REPORT
SPONSORED BY

Donnelley Financial Solutions (NYSE: DFIN) provides software and services that enable clients to communicate with confidence in a complex regulatory environment. With 3,500 employees in 61 locations across 18 countries,
we provide thousands of clients globally with innovative tools for content creation, management and distribution, as well as data analytics and multi-lingual localization services. Leveraging advanced technology, deep-domain expertise and 24/7 support, we deliver cost-effective solutions to meet the evolving needs of our clients. For more information about Donnelley Financial Solutions, visit dfsco.com.
Our Venue® secure online workspace provides a powerful set of features and an intuitive design that allows you to easily organize, manage, share and track all of your sensitive information. Venue® data rooms provide complete control, allowing you to manage who has access to your data
room, which documents they see, and how they can interact with those documents.
Venue® gives you access to hands-on, start-to-finish service that’s unique in the industry and that earns us a satisfaction rating of more than 97% from our demanding users. Get full Venue® room service or manage your room yourself, with our experienced in-house team ready 24/7/365. As part of Donnelley Financial Solutions, the global leader in managing time-sensitive, highly confidential documents, Venue provides the control you need with the security you demand.
IntroductionOver the long term, private equity horizon IRRS have outpaced most other asset
classes, yet on a short-term basis, the venture market has done better. Limited
partners continue to see positive inflows from PE vehicles, but fundraising
figures remain impressive and net cash flows have declined, an interesting trend
to note given the consistent quarterly drop we’ve seen in deal flow.
For venture, net cash flows to LPs were negative for the first time in three years.
While that has historically been the case, recent years have seen a series of
outsized exits support distributions. With liquidity remaining low as of late, the
pace and level at which late-stage private companies exit in the coming future
will be closely watched in terms of how they’ll affect the distribution of cash and
current fund IRRs—which today are certainly supported by hefty paper gains
they have yet to realize.
Throughout this report, we take a deeper look into private market IRRs, fund
cash flows and return multiples, across other metrics. We hope this report helps
inform your decision making process, and as always, feel free to reach us at
[email protected] with any comments or questions.
MAKE WAY FOR
SMARTER, ON-THE-FLY MEETING PREP
US +1 206.623.1986
UK +44 (0)207.190.9809
pitchbook.com
Introducing PitchBook
Mobile. The same
excellent data, technology
and service from the
PitchBook Platform, now
available on a mobile
device.
Search:
“PitchBook”
Available for
NIZAR TARHUNI
Senior Analyst
4 PITCHBOOK GLOBAL PE & VC BENCHMARKING & FUND PERFORMANCE REPORT
SPONSORED BY

0.7
0.8
0.9
1.0
1.1
1.2
1.3
1.4
1.5
2003 2004 2005 2006 2007 2008 2009 2010 2011 2012 2013
0.9
1.0
1.1
1.2
1.3
1.4
1.5
1.6
1.7
2003 2004 2005 2006 2007 2008 2009 2010 2011 2012 2013
KS-PME Benchmarks
IRR and cash multiples have been the gold standard of benchmarking for decades, but one of their main drawbacks is that they cannot be directly compared to indices that are used in mainstream asset classes. Public-market equivalent benchmarks (PMEs) effectively address this problem, making it possible to directly compare alternative asset fund performance to the performance of indexed asset classes by using fund-level cash flows.
As there are multiple ways to calculate a PME, PitchBook has employed the Kaplan-Schoar PME method.
Kaplan-Schoar (KS) Method:
A white paper detailing the calculations and methodology behind the PME benchmarks can be found at pitchbook.com. PitchBook News & Analysis also contains several articles with PME benchmarks and analysis. These can be read here.
To find out how the PME benchmarks can be utilized to gauge performance of a specific fund or your fund portfolio, please contact us at [email protected].
PMEKS—TVPI, T =S t=0
distribution
I t
T tNAVTIT
( )+
AN INTRODUCTION
TO PME BENCHMARKS
S t=0T contribution
I t
t( )
PE KS-PME Benchmark by vintage
VC KS-PME Benchmark by vintage
Source: PitchBook
The KS-PME charts on this page show the relative performance for a particular vintage of PE or VC funds against the specified index since the funds’ inception. Pre-2008 vintage PE funds outperformed the public markets consistently between 2003 and 2008, while recent VC vintages have definitely outperformed public indices as of late, doubtless benefiting from the recent venture boom that produced some notable winners.
When using a KS-PME, a value greater than 1.0 indicates outperformance of the public index (net of all fees). For example, the current 1.27 value for 2005 vintage PE funds means investors in a typical vehicle from that year are 27% better off having invested in PE than if they had invested in public equities over the same period.
When using a KS-PME, a value less than 1.0 indicates underperformance of the public index (net of all fees). For example, the 0.92 value for 2006 vintage VC funds means investors in a typical vehicle from that year would see only 92% of the value they would have in the public markets.
PME calculated using Russell 3000® Index
PME calculated using Russell 2000® Growth IndexSource: PitchBook
5 PITCHBOOK GLOBAL PE & VC BENCHMARKING & FUND PERFORMANCE REPORT
SPONSORED BY
0
500
1,000
1,500
2,000
2,500
3,000
3,500
1Q 2
000
3Q 2
000
1Q 2
001
3Q 2
001
1Q 2
002
3Q 2
002
1Q 2
003
3Q 2
003
1Q 2
004
3Q 2
004
1Q 2
005
3Q 2
005
1Q 2
006
3Q 2
006
1Q 2
007
3Q 2
007
1Q 2
008
3Q 2
008
1Q 2
009
3Q 2
009
1Q 2
010
3Q 2
010
1Q 2
011
3Q 2
011
1Q 2
012
3Q 2
012
1Q 2
013
3Q 2
013
1Q 2
014
3Q 2
014
1Q 2
015
3Q 2
015
1Q 2
016
Russell 3000 (R3K): AOP Russell 2000 Growth (R2K-Growth): AOP
0.90
0.95
1.00
1.05
1.10
1.15
1.20
1.25
1-Year 3-Year 5-Year 10-Year 15-Year
1.00
1.05
1.10
1.15
1.20
1.25
1-Year 3-Year 5-Year 10-Year 15-Year
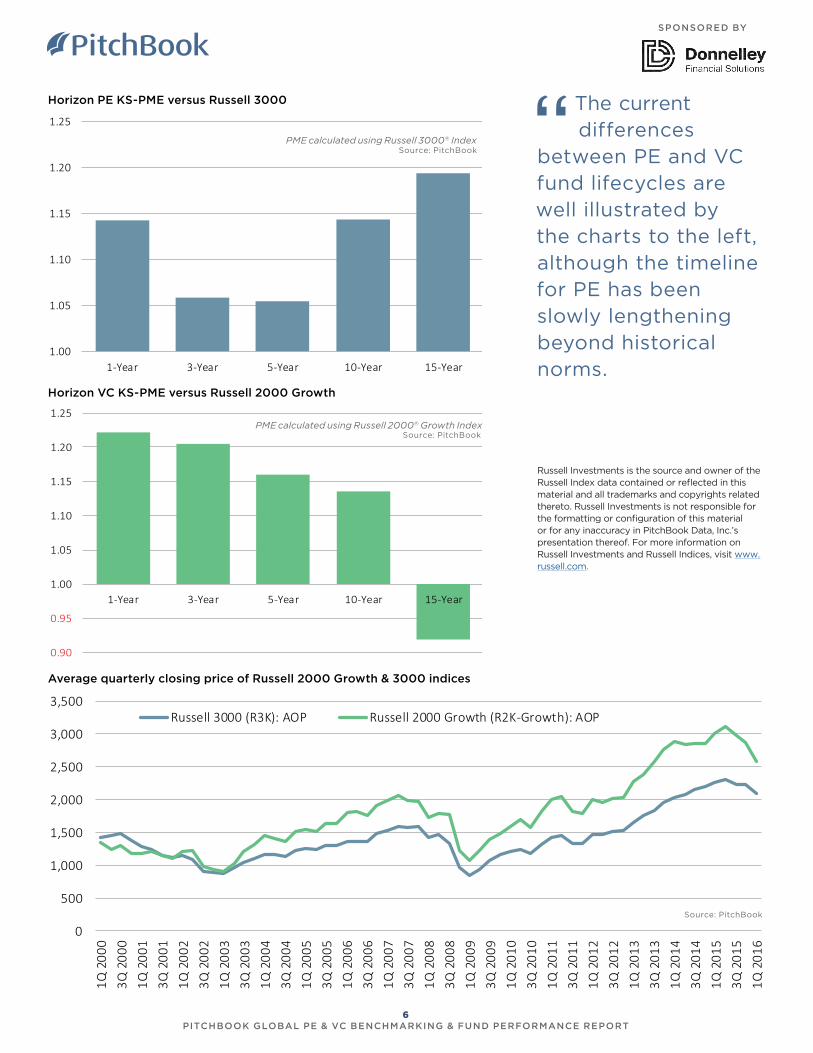
Horizon PE KS-PME versus Russell 3000
Source: PitchBookPME calculated using Russell 3000® Index
PME calculated using Russell 2000® Growth IndexSource: PitchBook
Horizon VC KS-PME versus Russell 2000 Growth
Average quarterly closing price of Russell 2000 Growth & 3000 indices
Source: PitchBook
Russell Investments is the source and owner of the Russell Index data contained or reflected in this material and all trademarks and copyrights related thereto. Russell Investments is not responsible for the formatting or configuration of this material or for any inaccuracy in PitchBook Data, Inc.’s presentation thereof. For more information on Russell Investments and Russell Indices, visit www.russell.com.
The current differences
between PE and VC fund lifecycles are well illustrated by the charts to the left, although the timeline for PE has been slowly lengthening beyond historical norms.
6 PITCHBOOK GLOBAL PE & VC BENCHMARKING & FUND PERFORMANCE REPORT
SPONSORED BY
0.27
x
0.27
x
0.32
x
0.84
x
0.44
x
0.63
x
0.42
x
0.65
x
0.38
x
0.24
x
0.49
x
0.12
x
0.20
x
0.19
x
0.44
x
0.66
x
0.83
x
0.92
x
0.98
x
1.30
x 1.13
x
1.13
x
1.19
x
1.02
x
0.59x
1.48x
0.88x
1.27x1.35x
1.45x
1.66x 1.71x
1.48x
1.32x1.23x
1.10x
2002 2003 2004 2005 2006 2007 2008 2009 2010 2011 2012 2013
Median of DPI Median of RVPI Median of TVPI
0.9
1.0
1.1
1.2
1.3
1-year 3-year 5-year 10-year 15-year
0.7
0.8
0.9
1.0
1.1
1.2
1.3
1.4
1.5
1.6
1.7
2003 2004 2005 2006 2007 2008 2009 2010 2011 2012 2013
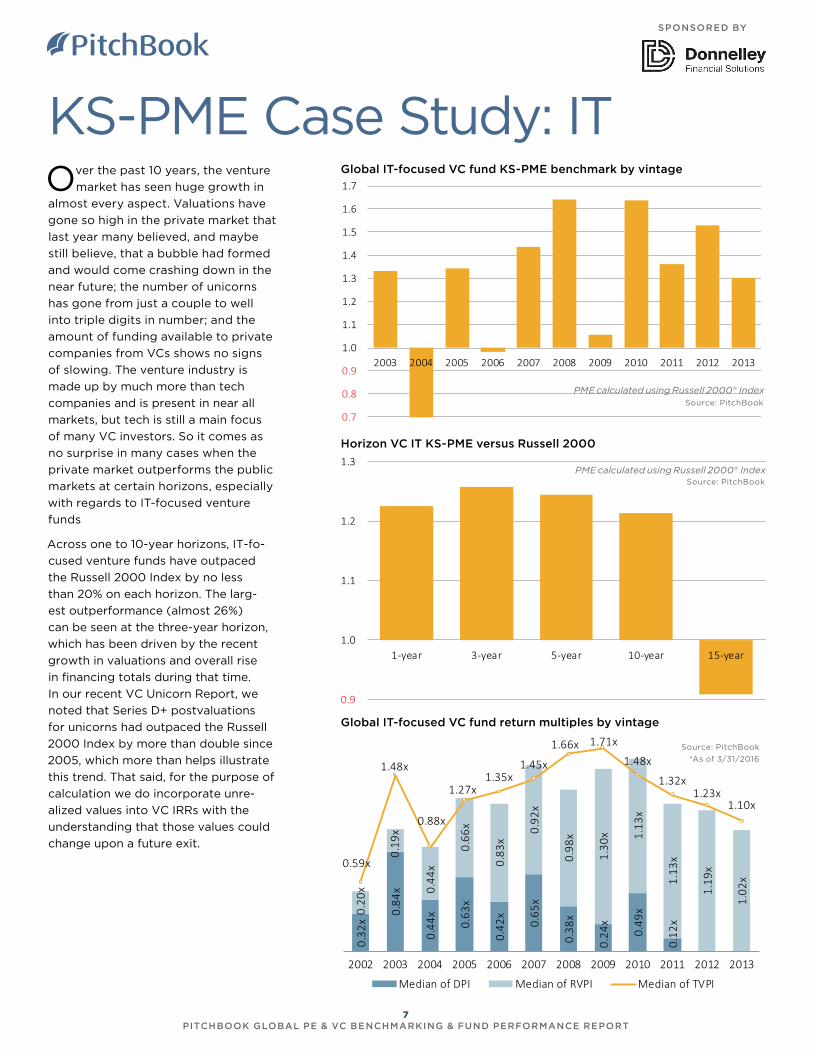
KS-PME Case Study: ITOver the past 10 years, the venture
market has seen huge growth in
almost every aspect. Valuations have
gone so high in the private market that
last year many believed, and maybe
still believe, that a bubble had formed
and would come crashing down in the
near future; the number of unicorns
has gone from just a couple to well
into triple digits in number; and the
amount of funding available to private
companies from VCs shows no signs
of slowing. The venture industry is
made up by much more than tech
companies and is present in near all
markets, but tech is still a main focus
of many VC investors. So it comes as
no surprise in many cases when the
private market outperforms the public
markets at certain horizons, especially
with regards to IT-focused venture
funds
Across one to 10-year horizons, IT-fo-
cused venture funds have outpaced
the Russell 2000 Index by no less
than 20% on each horizon. The larg-
est outperformance (almost 26%)
can be seen at the three-year horizon,
which has been driven by the recent
growth in valuations and overall rise
in financing totals during that time.
In our recent VC Unicorn Report, we
noted that Series D+ postvaluations
for unicorns had outpaced the Russell
2000 Index by more than double since
2005, which more than helps illustrate
this trend. That said, for the purpose of
calculation we do incorporate unre-
alized values into VC IRRs with the
understanding that those values could
change upon a future exit.
Global IT-focused VC fund KS-PME benchmark by vintage
Global IT-focused VC fund return multiples by vintage
PME calculated using Russell 2000® IndexSource: PitchBook
Source: PitchBook
*As of 3/31/2016
PME calculated using Russell 2000® IndexSource: PitchBook
Horizon VC IT KS-PME versus Russell 2000
7 PITCHBOOK GLOBAL PE & VC BENCHMARKING & FUND PERFORMANCE REPORT
SPONSORED BY
0%
5%
10%
15%
20%
1-Year 3-Year 5-Year 10-Year
PE Funds VC Funds Debt Funds Fund-of-Funds
0%
5%
10%
15%
20%
25%
2008 2009 2010 2011 2012
Fund-of-Funds
0%
5%
10%
15%
20%
25%
2002 2003 2004 2005 2006 2007 2008 2009 2010 2011 2012 2013
PE Funds VC Funds Debt Funds Fund-of-Funds
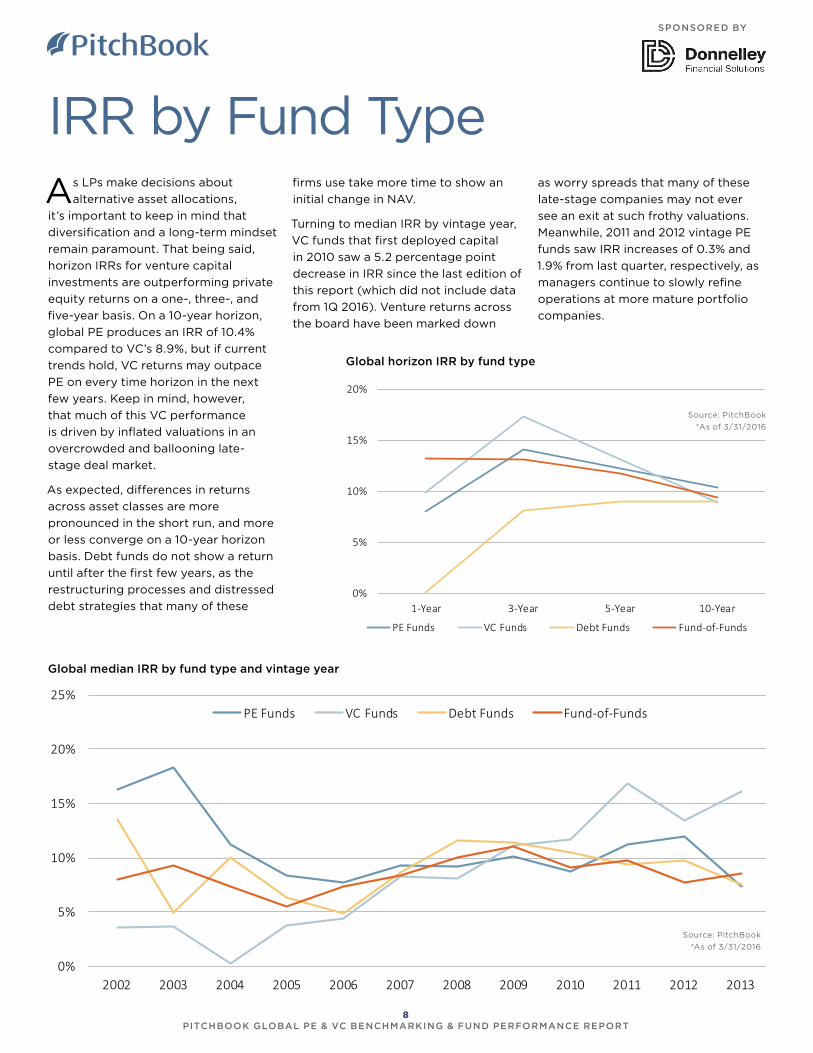
IRR by Fund Type
Global horizon IRR by fund type
Global median IRR by fund type and vintage year
As LPs make decisions about
alternative asset allocations,
it’s important to keep in mind that
diversification and a long-term mindset
remain paramount. That being said,
horizon IRRs for venture capital
investments are outperforming private
equity returns on a one-, three-, and
five-year basis. On a 10-year horizon,
global PE produces an IRR of 10.4%
compared to VC’s 8.9%, but if current
trends hold, VC returns may outpace
PE on every time horizon in the next
few years. Keep in mind, however,
that much of this VC performance
is driven by inflated valuations in an
overcrowded and ballooning late-
stage deal market.
As expected, differences in returns
across asset classes are more
pronounced in the short run, and more
or less converge on a 10-year horizon
basis. Debt funds do not show a return
until after the first few years, as the
restructuring processes and distressed
debt strategies that many of these
firms use take more time to show an
initial change in NAV.
Turning to median IRR by vintage year,
VC funds that first deployed capital
in 2010 saw a 5.2 percentage point
decrease in IRR since the last edition of
this report (which did not include data
from 1Q 2016). Venture returns across
the board have been marked down
as worry spreads that many of these
late-stage companies may not ever
see an exit at such frothy valuations.
Meanwhile, 2011 and 2012 vintage PE
funds saw IRR increases of 0.3% and
1.9% from last quarter, respectively, as
managers continue to slowly refine
operations at more mature portfolio
companies.
Source: PitchBook
*As of 3/31/2016
Source: PitchBook
*As of 3/31/2016
8 PITCHBOOK GLOBAL PE & VC BENCHMARKING & FUND PERFORMANCE REPORT
SPONSORED BY
Quartiles & Benchmarks Global PE IRR quartiles by vintage year
Source: PitchBook
*As of 3/31/2016
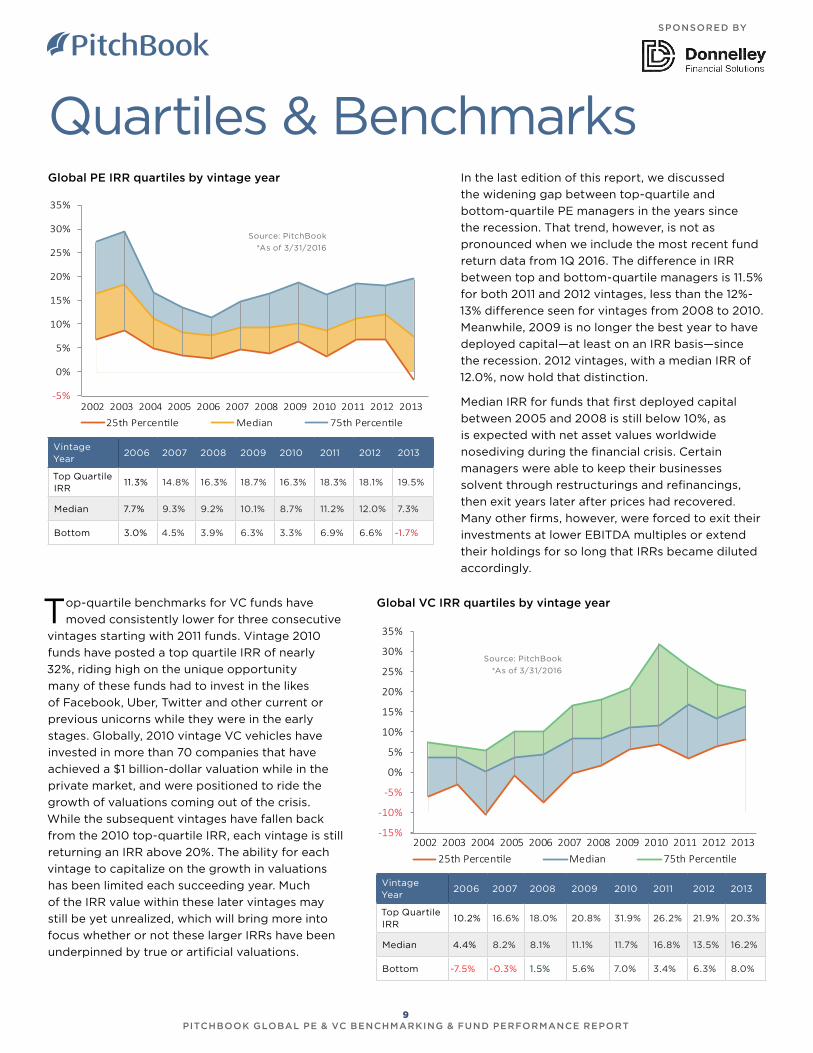
In the last edition of this report, we discussed
the widening gap between top-quartile and
bottom-quartile PE managers in the years since
the recession. That trend, however, is not as
pronounced when we include the most recent fund
return data from 1Q 2016. The difference in IRR
between top and bottom-quartile managers is 11.5%
for both 2011 and 2012 vintages, less than the 12%-
13% difference seen for vintages from 2008 to 2010.
Meanwhile, 2009 is no longer the best year to have
deployed capital—at least on an IRR basis—since
the recession. 2012 vintages, with a median IRR of
12.0%, now hold that distinction.
Median IRR for funds that first deployed capital
between 2005 and 2008 is still below 10%, as
is expected with net asset values worldwide
nosediving during the financial crisis. Certain
managers were able to keep their businesses
solvent through restructurings and refinancings,
then exit years later after prices had recovered.
Many other firms, however, were forced to exit their
investments at lower EBITDA multiples or extend
their holdings for so long that IRRs became diluted
accordingly.
Global VC IRR quartiles by vintage yearTop-quartile benchmarks for VC funds have
moved consistently lower for three consecutive
vintages starting with 2011 funds. Vintage 2010
funds have posted a top quartile IRR of nearly
32%, riding high on the unique opportunity
many of these funds had to invest in the likes
of Facebook, Uber, Twitter and other current or
previous unicorns while they were in the early
stages. Globally, 2010 vintage VC vehicles have
invested in more than 70 companies that have
achieved a $1 billion-dollar valuation while in the
private market, and were positioned to ride the
growth of valuations coming out of the crisis.
While the subsequent vintages have fallen back
from the 2010 top-quartile IRR, each vintage is still
returning an IRR above 20%. The ability for each
vintage to capitalize on the growth in valuations
has been limited each succeeding year. Much
of the IRR value within these later vintages may
still be yet unrealized, which will bring more into
focus whether or not these larger IRRs have been
underpinned by true or artificial valuations.
Source: PitchBook
*As of 3/31/2016
Vintage Year
2006 2007 2008 2009 2010 2011 2012 2013
Top Quartile IRR
11.3% 14.8% 16.3% 18.7% 16.3% 18.3% 18.1% 19.5%
Median 7.7% 9.3% 9.2% 10.1% 8.7% 11.2% 12.0% 7.3%
Bottom 3.0% 4.5% 3.9% 6.3% 3.3% 6.9% 6.6% -1.7%
Vintage Year
2006 2007 2008 2009 2010 2011 2012 2013
Top Quartile IRR
10.2% 16.6% 18.0% 20.8% 31.9% 26.2% 21.9% 20.3%
Median 4.4% 8.2% 8.1% 11.1% 11.7% 16.8% 13.5% 16.2%
Bottom -7.5% -0.3% 1.5% 5.6% 7.0% 3.4% 6.3% 8.0%
-5%
0%
5%
10%
15%
20%
25%
30%
35%
2002 2003 2004 2005 2006 2007 2008 2009 2010 2011 2012 201325th Percentile Median 75th Percentile
-15%
-10%
-5%
0%
5%
10%
15%
20%
25%
30%
35%
2002 2003 2004 2005 2006 2007 2008 2009 2010 2011 2012 201325th Percentile Median 75th Percentile
9 PITCHBOOK GLOBAL PE & VC BENCHMARKING & FUND PERFORMANCE REPORT
SPONSORED BY

Private Equity IRRsGlobal PE horizon IRR by size bucket
PE horizon IRR by region
Source: PitchBook
*As of 3/31/2016
When observing returns to
any asset class over time, it’s
important to remember the market
conditions that these investments have
weathered. For example, PE horizon
IRRs are lower on a 10-year time
frame than five, due to the stretched
hold periods and asset write-offs
that happened during the recession.
Meanwhile, the three-year horizon IRR
is the highest in our dataset, due to the
fact that these investments were made
before the recent run-up in valuations
and have been subsequently marked
as such—even though many of these
returns have yet to be fully realized
through an exit.
Interestingly, our data show that PE
funds sized between $250 million and
$500 million, and $1 billion+ largely
track each other in performance. The
horizon IRRs for these two buckets
are within one percentage point of
each other on a one, three, five, and
10-year basis. Funds under $250
million in size underperform the rest
of the asset class on a one and three-
year horizon—perhaps due to a more
pronounced J-curve effect in smaller,
more operationally focused funds—but
returns converge on a five and 10-year
basis. Globally, all fund sizes report
between a 10.3% and 10.9% 10-year
horizon IRR, with the smallest funds
producing the largest returns in that
range.
Focusing now on returns by
geographic region, US PE funds
perform better than both Europe and
the rest of the world on a three-, five-,
and 10-year basis. As with differences
in size of funds however, the disparity
in returns is less pronounced over the
longer-term. US PE funds have a 10.9%
10-year horizon IRR, compared to 8.7%
in Europe and 10.1% in the rest of the
world.
Source: PitchBook
*As of 3/31/2016
0%
5%
10%
15%
20%
1-Year 3-Year 5-Year 10-Year
U.S. PE Funds European PE Funds Rest of World PE Funds
0%
5%
10%
15%
1-Year 3-Year 5-Year 10-Year
Under $250M $250M-$500M $500M-$1B $1B+
10 PITCHBOOK GLOBAL PE & VC BENCHMARKING & FUND PERFORMANCE REPORT
SPONSORED BY
1.62
x
1.43
x
1.22
x
1.09
x
0.93
x
0.80
x
0.79
x
0.45
x
0.25
x
0.16
x
0.04
x
0.07
x
0.08
x
0.23
x
0.31
x
0.48
x
0.55
x
0.61
x
0.85
x
0.95
x
1.00
x
1.00
x
1.70x1.56x
1.48x 1.43x 1.48x 1.42x 1.38x1.28x 1.25x 1.24x
1.10x
2003 2004 2005 2006 2007 2008 2009 2010 2011 2012 2013Median of DPI Median of RVPI Median of TVPI
PE Fund Return Multiples
Global average PE DPI multiples over time by vintage
Global median PE fund return multiples by vintage
Source: PitchBook
*As of 3/31/2016
Source: PitchBook
*As of 3/31/2016
0.0x
0.2x
0.4x
0.6x
0.8x
1.0x
1.2x
1 2 3 4 5 6 7 8 9Years since inception
2005 2006 2007 2008 2009 2010 2011
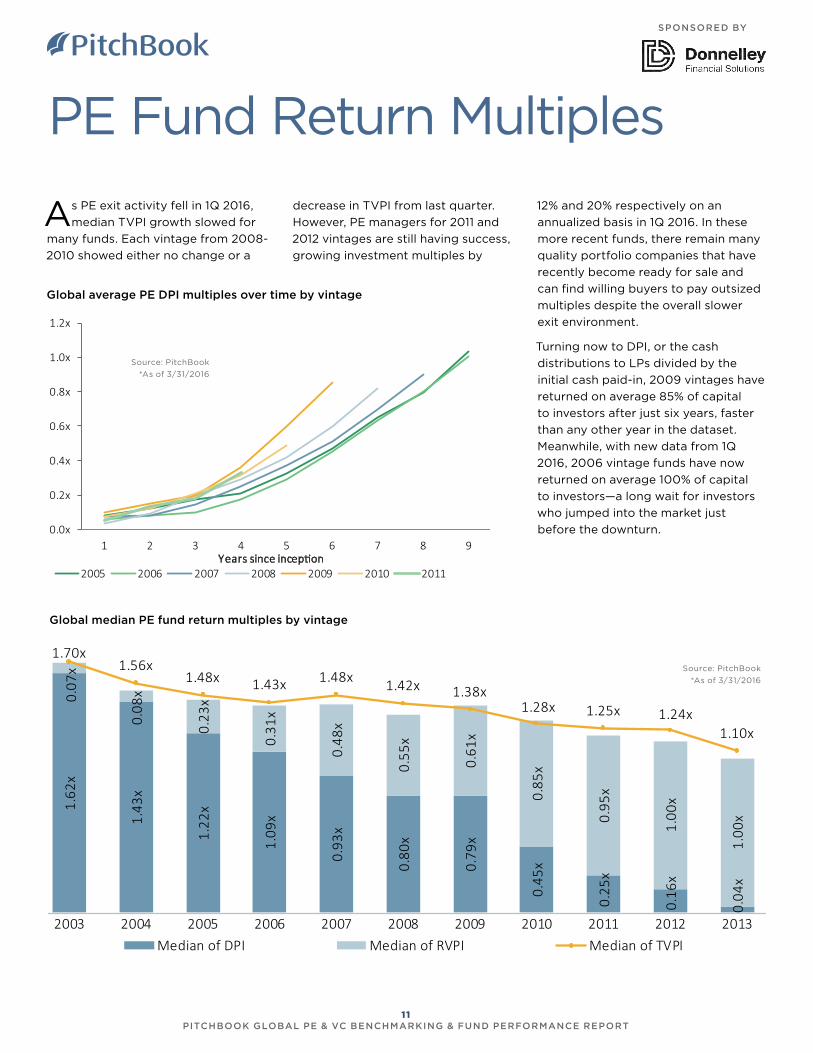
As PE exit activity fell in 1Q 2016,
median TVPI growth slowed for
many funds. Each vintage from 2008-
2010 showed either no change or a
decrease in TVPI from last quarter.
However, PE managers for 2011 and
2012 vintages are still having success,
growing investment multiples by
12% and 20% respectively on an
annualized basis in 1Q 2016. In these
more recent funds, there remain many
quality portfolio companies that have
recently become ready for sale and
can find willing buyers to pay outsized
multiples despite the overall slower
exit environment.
Turning now to DPI, or the cash
distributions to LPs divided by the
initial cash paid-in, 2009 vintages have
returned on average 85% of capital
to investors after just six years, faster
than any other year in the dataset.
Meanwhile, with new data from 1Q
2016, 2006 vintage funds have now
returned on average 100% of capital
to investors—a long wait for investors
who jumped into the market just
before the downturn.
11 PITCHBOOK GLOBAL PE & VC BENCHMARKING & FUND PERFORMANCE REPORT
SPONSORED BY
PE Fund Cash Flows
YEAR TOTAL CONTRIBUTIONS ($B)
TOTAL DISTRIBUTIONS ($B)
NET CASH FLOW ($B)
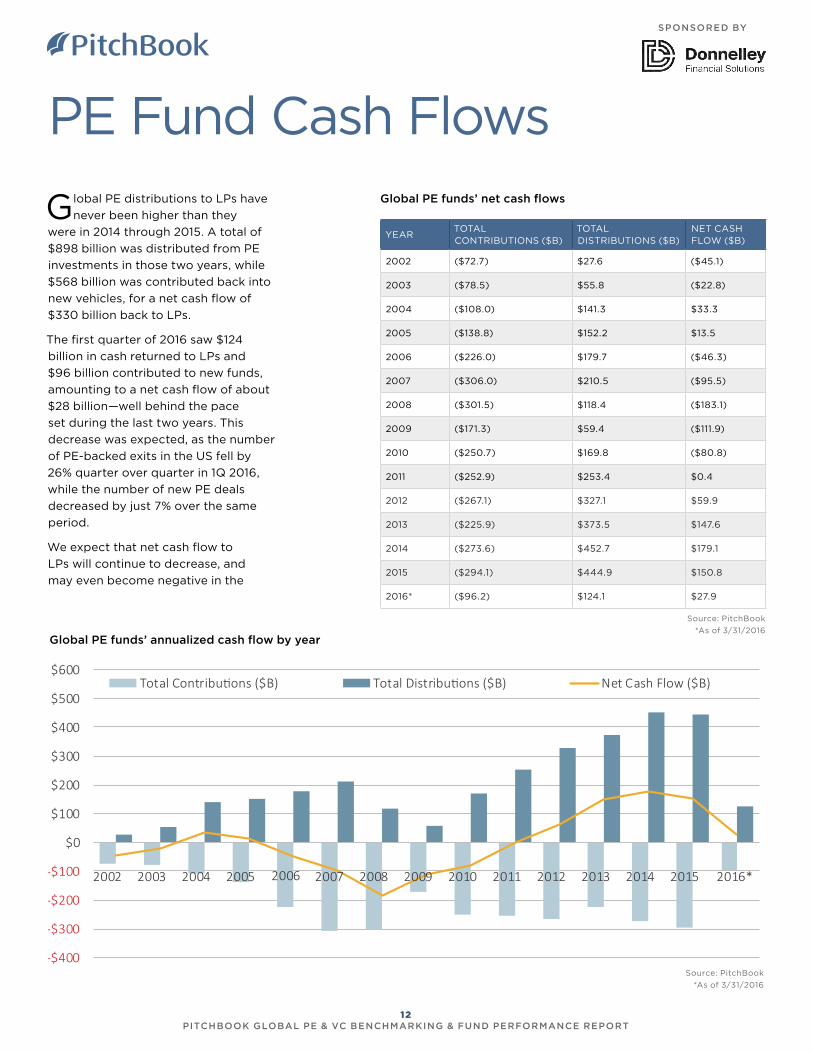
2002 ($72.7) $27.6 ($45.1)
2003 ($78.5) $55.8 ($22.8)
2004 ($108.0) $141.3 $33.3
2005 ($138.8) $152.2 $13.5
2006 ($226.0) $179.7 ($46.3)
2007 ($306.0) $210.5 ($95.5)
2008 ($301.5) $118.4 ($183.1)
2009 ($171.3) $59.4 ($111.9)
2010 ($250.7) $169.8 ($80.8)
2011 ($252.9) $253.4 $0.4
2012 ($267.1) $327.1 $59.9
2013 ($225.9) $373.5 $147.6
2014 ($273.6) $452.7 $179.1
2015 ($294.1) $444.9 $150.8
2016* ($96.2) $124.1 $27.9
Global PE funds’ annualized cash flow by year
Global PE distributions to LPs have
never been higher than they
were in 2014 through 2015. A total of
$898 billion was distributed from PE
investments in those two years, while
$568 billion was contributed back into
new vehicles, for a net cash flow of
$330 billion back to LPs.
The first quarter of 2016 saw $124
billion in cash returned to LPs and
$96 billion contributed to new funds,
amounting to a net cash flow of about
$28 billion—well behind the pace
set during the last two years. This
decrease was expected, as the number
of PE-backed exits in the US fell by
26% quarter over quarter in 1Q 2016,
while the number of new PE deals
decreased by just 7% over the same
period.
We expect that net cash flow to
LPs will continue to decrease, and
may even become negative in the
-$400
-$300
-$200
-$100
$0
$100
$200
$300
$400
$500
$600
2002 2003 2004 2005 2006 2007 2008 2009 2010 2011 2012 2013 2014 2015 2016*
Total Contributions ($B) Total Distributions ($B) Net Cash Flow ($B)
Global PE funds’ net cash flows
Source: PitchBook
*As of 3/31/2016
Source: PitchBook
*As of 3/31/2016
12 PITCHBOOK GLOBAL PE & VC BENCHMARKING & FUND PERFORMANCE REPORT
SPONSORED BY

YEAR TOTAL CONTRIBUTIONS ($B)
TOTAL DISTRIBUTIONS ($B)
NET CASH FLOW ($B)
2002 ($52.0) $17.7 ($34.3)
2003 ($54.3) $42.5 ($11.8)
2004 ($73.8) $104.5 $30.7
2005 (93.5) $106.5 $13.0
2006 ($146.0) $122.8 ($23.2)
2007 ($197.4) $141.6 ($55.8)
2008 ($191.9) $74.8 ($117.1)
2009 ($104.0) $45.5 ($58.5)
2010 ($147.8) $122.0 ($25.8)
2011 ($145.2) $157.3 $12.0
2012 ($151.3) $226.7 $75.4
2013 ($136.7) $240.3 $103.6
2014 ($166.2 $291.6 $125.4
2015 ($173.5) $264.3 $90.8
2016* ($57.8) $63.2 $5.4
US PE funds’ annualized cash flow by year
next few quarters due to the strong
fundraising numbers seen in the PE
marketplace lately. US PE fundraising
value through the first three quarters
of 2016 increased by 9% year over year.
Despite lagging deal flow numbers,
firms are still finding useful ways
to deploy capital, namely add-on
transactions and tech buyouts. This
newly committed capital will be called
down sooner rather than later, and a
large portion of deals completed in
2014-2015 are still some years away
from an exit. Thus, we expect capital
contributions to outpace distributions
in the near term.
US PE funds’ net cash flows
-$300
-$200
-$100
$0
$100
$200
$300
$400
2002 2003 2004 2005 2006 2007 2008 2009 2010 2011 2012 2013 2014 2015 2016*
Total Contributions ($B) Total Distributions ($B) Net Cash Flow ($B)
Source: PitchBook
*As of 3/31/2016
Source: PitchBook
*As of 3/31/2016
13 PITCHBOOK GLOBAL PE & VC BENCHMARKING & FUND PERFORMANCE REPORT
SPONSORED BY
Venture Capital IRRs
Source: PitchBook
*As of 3/31/2016
Global VC horizon IRR by size bucket
VC horizon IRR by region
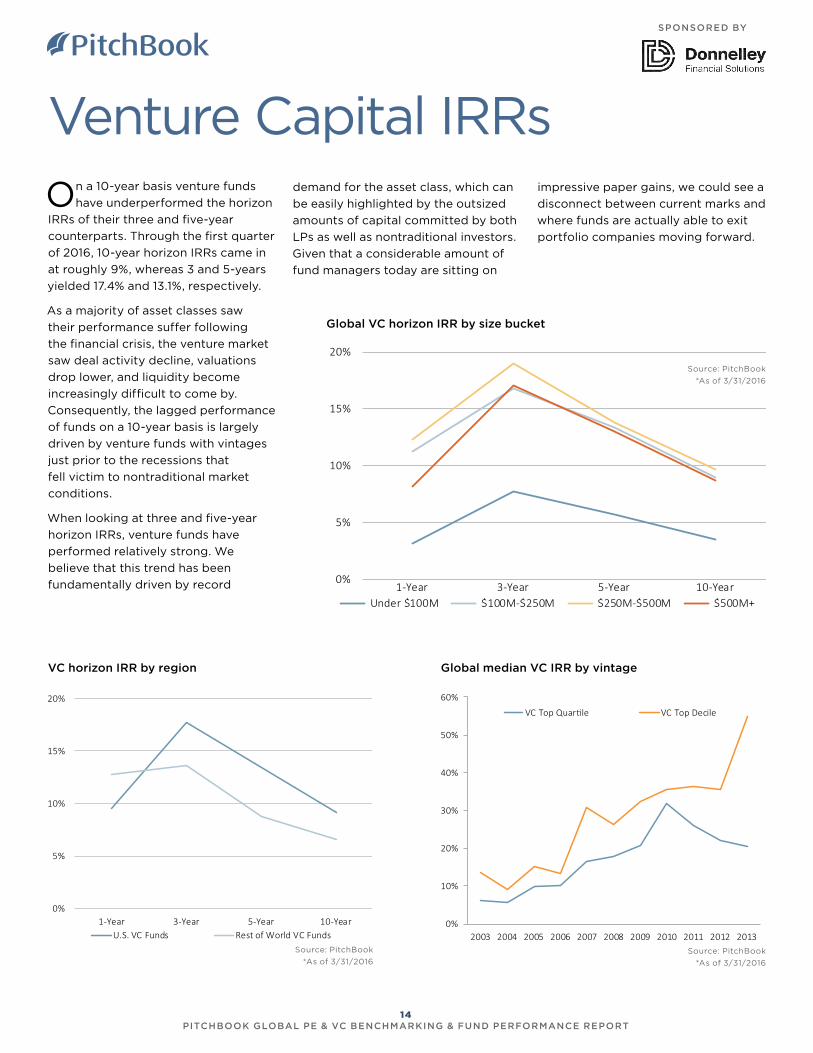
On a 10-year basis venture funds
have underperformed the horizon
IRRs of their three and five-year
counterparts. Through the first quarter
of 2016, 10-year horizon IRRs came in
at roughly 9%, whereas 3 and 5-years
yielded 17.4% and 13.1%, respectively.
As a majority of asset classes saw
their performance suffer following
the financial crisis, the venture market
saw deal activity decline, valuations
drop lower, and liquidity become
increasingly difficult to come by.
Consequently, the lagged performance
of funds on a 10-year basis is largely
driven by venture funds with vintages
just prior to the recessions that
fell victim to nontraditional market
conditions.
When looking at three and five-year
horizon IRRs, venture funds have
performed relatively strong. We
believe that this trend has been
fundamentally driven by record
0%
5%
10%
15%
20%
1-Year 3-Year 5-Year 10-YearU.S. VC Funds Rest of World VC Funds
Global median VC IRR by vintage
Source: PitchBook
*As of 3/31/2016
demand for the asset class, which can
be easily highlighted by the outsized
amounts of capital committed by both
LPs as well as nontraditional investors.
Given that a considerable amount of
fund managers today are sitting on
impressive paper gains, we could see a
disconnect between current marks and
where funds are actually able to exit
portfolio companies moving forward.
0%
5%
10%
15%
20%
1-Year 3-Year 5-Year 10-YearUnder $100M $100M-$250M $250M-$500M $500M+
Source: PitchBook
*As of 3/31/2016
0%
10%
20%
30%
40%
50%
60%
2003 2004 2005 2006 2007 2008 2009 2010 2011 2012 2013
VC Top Quartile VC Top Decile
14 PITCHBOOK GLOBAL PE & VC BENCHMARKING & FUND PERFORMANCE REPORT
SPONSORED BY
0.86
x
0.84
x
0.45
x 0.72
x
0.48
x 0.75
x
0.35
x
0.41
x
0.43
x
0.13
x
0.01
x
0.10
x
0.19
x
0.38
x
0.51
x
0.62
x
0.82
x
0.85
x 1.04
x
1.07
x
1.21
x
1.15
x
1.11
x1.16x
1.23x
0.97x
1.26x 1.26x1.40x
1.47x1.60x
1.48x 1.44x
1.25x1.20x
2002 2003 2004 2005 2006 2007 2008 2009 2010 2011 2012 2013Median of DPI Median of RVPI Median of TVPI
VC Fund Return Multiples
Global average VC DPI multiples over time by vintage
Global median VC fund return multiples by vintage
Source: PitchBook
*As of 3/31/2016
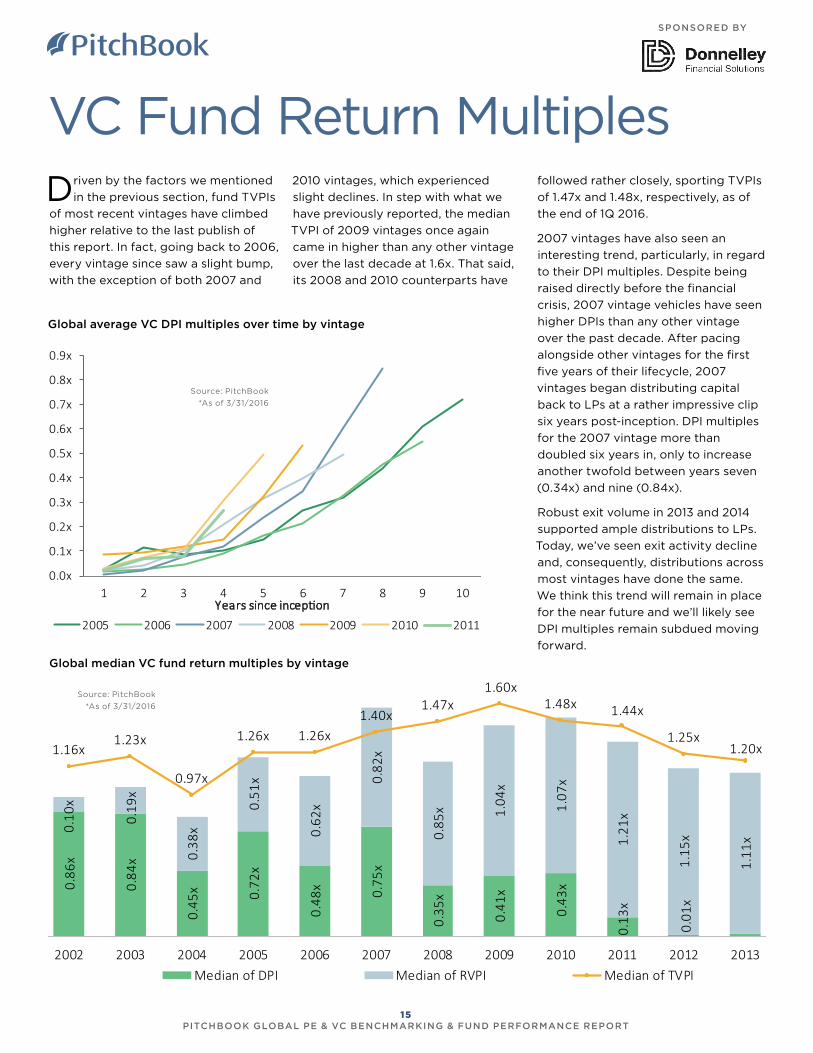
Driven by the factors we mentioned
in the previous section, fund TVPIs
of most recent vintages have climbed
higher relative to the last publish of
this report. In fact, going back to 2006,
every vintage since saw a slight bump,
with the exception of both 2007 and
2010 vintages, which experienced
slight declines. In step with what we
have previously reported, the median
TVPI of 2009 vintages once again
came in higher than any other vintage
over the last decade at 1.6x. That said,
its 2008 and 2010 counterparts have
followed rather closely, sporting TVPIs
of 1.47x and 1.48x, respectively, as of
the end of 1Q 2016.
2007 vintages have also seen an
interesting trend, particularly, in regard
to their DPI multiples. Despite being
raised directly before the financial
crisis, 2007 vintage vehicles have seen
higher DPIs than any other vintage
over the past decade. After pacing
alongside other vintages for the first
five years of their lifecycle, 2007
vintages began distributing capital
back to LPs at a rather impressive clip
six years post-inception. DPI multiples
for the 2007 vintage more than
doubled six years in, only to increase
another twofold between years seven
(0.34x) and nine (0.84x).
Robust exit volume in 2013 and 2014
supported ample distributions to LPs.
Today, we’ve seen exit activity decline
and, consequently, distributions across
most vintages have done the same.
We think this trend will remain in place
for the near future and we’ll likely see
DPI multiples remain subdued moving
forward.
0.0x
0.1x
0.2x
0.3x
0.4x
0.5x
0.6x
0.7x
0.8x
0.9x
1 2 3 4 5 6 7 8 9 10Years since inception
2005 2006 2007 2008 2009 2010 2011
Source: PitchBook
*As of 3/31/2016
15 PITCHBOOK GLOBAL PE & VC BENCHMARKING & FUND PERFORMANCE REPORT
SPONSORED BY

VC Fund Cash Flows
Global VC funds’ annualized cash flow by year
YEAR TOTAL CONTRIBUTIONS ($B)
TOTAL DISTRIBUTIONS ($B)
NET CASH FLOW ($B)
2004 ($27.1) $9.4 ($17.8)
2005 ($32.8) $13.5 ($19.3)
2006 ($39.6) $26.4 ($13.2)
2007 ($45.3) $33.2 ($12.0)
2008 ($42.5) $11.1 ($31.4)
2009 ($33.8) $14.5 ($19.3)
2010 ($40.5) $27.4 ($13.2)
2011 ($46.3) $33.0 ($13.4)
2012 ($44.6) $37.5 ($7.0)
2013 ($43.7) $38.1 ($5.6)
2014 ($36.3) $54.7 $18.4
2015 ($49.5) $65.6 $16.1
2016* ($16.4) $9.4 ($7.0)
For the first quarter of 2016, net cash
flow from investors to LPS came
in at -$7 billion, taking that metric
negative for the first time since 2013.
At face value, a negative cash flow
would seem a bad signal, which may fit
into the overall narrative that has been
painted throughout the year. But when
compared historically, the negative
cash flow is neither surprising nor is
it cause for concern, as just two years
have seen a positive overall cash flow
since 2003.
Diving into 1Q data, it’s easy to see
what happened to distributions to
LPs. Coming in at $9.4 billion, 1Q
distributions were well below the $15
billion+ average we had seen in 2014
and 2015. A sluggish exit market saw
zero IPOs during the first month of the
year, and just seven exits completed
of $500 million or higher to go along
with the lowest total VC-backed exit
count since 2Q 2013. But if $9.4 billion
were to finish 2016 as the quarterly
average, however, it would surpass any
quarterly distribution average for at
least 10 years prior to 2014.
At the same time as distributions
were down, LP contributions came
in at one of the highest levels we
have seen. The more than $16 billion
contributed by LPs is indicative of the
growth in deal sizes across the venture
landscape, as investors continue to
show their willingness to put large
amounts of capital to work in the right
opportunities.
-$60
-$40
-$20
$0
$20
$40
$60
$80
2002 2003 2004 2005 2006 2007 2008 2009 2010 2011 2012 2013 2014 2015 2016*
Total Contributions ($B) Total Distributions ($B) Net Cash Flow ($B)
Global VC funds’ net cash flows
Source: PitchBook
*As of 3/31/2016
Source: PitchBook
*As of 3/31/2016
16 PITCHBOOK GLOBAL PE & VC BENCHMARKING & FUND PERFORMANCE REPORT
SPONSORED BY

Fund name Vintage IRR DPI
Menlo Ventures XI 2010 64.22% 0.51x
TPG Biotechnology Partners IV
2012 47.38% 0.73x
Lightspeed Venture Partners IX
2012 43.11% 0.00x
Institutional Venture Partners XIV
2012 36.14% 0.24x
5AM Ventures III 2009 36.10% 1.35x
Sofinnova Ventures VIII 2011 30.04% 0.93x
Fund name Vintage IRR DPI
Northcreek Mezzanine Fund I
2010 26.70% 1.29x
VSS Structured Capital II 2009 25.99% 1.55x
Fortress Investment Fund III PIK Notes
2009 20.24% 1.53x
Monroe Capital Partners Fund
2011 18.39% 0.63x
Merion Investment Partners II
2010 17.50% 0.64x
Yukon Capital Partners 2009 16.20% 0.79x
Central Valley Fund II 2012 15.17% 0.07x
Select Top Funds by IRR 2009 to 2012 vintage mezzanine funds
Fund name Vintage IRR DPI
New Horizon Capital IV 2011 23.90% 0.22x
Valor Equity Partners II 2007 23.32% 0.85x
Trustbridge Partners IV 2011 19.52% 1.96x
Insight Venture Partners VI
2007 19.27% 1.96x
Spectrum Equity Investors VI
2010 18.31% 0.60x
Aurora Resurgence Fund 2008 17.00% 0.55x
FTV III 2007 16.60% 1.19x
2007 to 2011 vintage growth funds 250M+
Fund name Vintage IRR DPI
DN Capital- Global Venture Capital III
2012 165.40% 0.33x
DCM VII 2014 70.52% 0.00x
ARCH Venture Fund VIII 2014 53.47% 0.00x
DCM A-Fund 2011 29.30% 0.30x
Sante Health Ventures II 2011 27.45% 0.68x
Union Square Ventures 2012 Fund
2011 24.03% 0.13x
2010 to 2014 vintage early-stage VC funds 2009 to 2012 vintage US Bay Area VC funds
Fund name Vintage IRR DPI
Sun Capital Partners VI 2013 65.50% 0.20x
Cortec Group Fund V 2011 47.10% 0.00x
TowerBrook Investors V 2013 44.12% 0.07x
TSG6 2012 41.70% 0.38x
Acorn General Fund One 2010 39.40% 3.10%
Vestar Capital Partners VI
2013 34.01% 0.38%
2009 to 2013 vintage B2C funds
Fund name Vintage IRR DPI
Cortec Group Fund V 2011 47.10% 0.00x
Sentinel Capital Partners IV-A
2008 35.23% 1.35x
Odyssey Investment Partners Fund IV
2009 30.91% 1.76x
Altaris Health Partners II 2008 28.30% 2.15x
Clayton Dubilier & Rice Fund VIII
2009 27.00% 1.53x
Apollo Investment Fund VII
2008 27.00% 1.50x
2007 to 2011 vintage US New York Metro buyout funds
Source: PitchBookSource: PitchBook
Source: PitchBookSource: PitchBook
Source: PitchBook
Source: PitchBook
Note: The funds returns data on this page is as of 11/15/2016.
17 PITCHBOOK GLOBAL PE & VC BENCHMARKING & FUND PERFORMANCE REPORT
SPONSORED BY

PitchBook currently tracks over 34,000 funds
around the world and has returns data on close
to 8,300 vehicles. In this edition of the quarterly
Benchmarking Report, PitchBook examines
data from over 5,600 funds and 24,000 distinct
LP commitments. We are constantly adding
historical performance as it becomes available;
this explains many apparent discrepancies that
may appear between reports.
All returns data in this report is net of fees
through 1Q 2016, as reported by LPs.
DEFINITIONS
PE fund:
Unless otherwise noted, PE fund data includes
buyout, diversified PE, energy - alternative/
renewables, energy - oil & gas, mezzanine,
mezzanine captive, growth and restructuring/
turnaround.
Debt fund:
For this report, the debt fund classification
includes general debt, direct lending,
infrastructure debt, bridge financing, credit
special situations, distressed debt, real estate
debt and venture debt.
Vintage year:
The vintage year as reported by the fund GP and
LPs, or the year in which a fund holds its final
close.
Internal rate of return (IRR):
IRR represents the rate at which a series of
positive and negative cash flows are discounted
so that the net present value of cash flows equals
zero. The cash flows are calculated from the
entire value of a fund, so IRRs are also based
upon value that remains within the vehicle.
Horizon IRR:
Horizon IRR shows the IRR from a certain point
in time. For example, the one-year horizon IRR
figures in this report show the IRR performance
for the one-year period from 1Q 2015 to 1Q 2016,
while the three-year horizon IRR is for the period
from 1Q 2013 to 1Q 2016.
Distributions to paid-in (DPI):
A measurement of the capital that has been
distributed back to LPs as a proportion of the
total paid-in, or contributed, capital. DPI is
also known as the cash-on-cash multiple or the
realization multiple.
Remaining value to paid-in (RVPI):
A measurement of the unrealized return of a
fund as a proportion of the total paid-in, or
contributed, capital.
Total value to paid-in (TVPI):
A measurement of both the realized and
unrealized value of a fund as a proportion of
the total paid-in, or contributed, capital. Also
known as the investment multiple, TVPI can be
found by adding together the DPI and RVPI of
a fund. As the charts depict medians of fund
return multiples that are calculated based on
aggregated statistics, they may not necessarily
add up, whereas on an individual basis they
shall.
Methodology
Donnelley Financial Solutions is the sponsor of the PitchBook Global PE & VC Benchmarking Report. All information contained in this publication is for informational purposes only and should not be construed as legal, accounting, tax, or other professional advice of any kind, on any subject matter. Donnelley Financial Solutions expressly disclaims all liability in respect to actions taken or not taken based on any or all the content herein.
18 PITCHBOOK GLOBAL PE & VC BENCHMARKING & FUND PERFORMANCE REPORT
SPONSORED BY

See how the PitchBook Platform can
help your private equity firm close your
next deal.
We do contact information, LP investment preferences, custom benchmarking,mandates,fund performance data.
You focus on building relationships.