Pipeline Failure Investigation Report · A hydrostatic test of the pipeline was performed in 1955....
107
Pipeline Failure Investigation Report - 1 - Form 11 Pipeline Failure Investigation Report (Revised 03/07/08) Pipeline System: Houstonia 200 Line Operator: Panhandle Eastern Pipeline Company, LP Location: Mile Post 21.6 Date of Occurrence: 8/25/2008 Medium Released: Natural gas Quantity: 13,518,578 CF PHMSA Arrival Time & Date: 8/25/08 1:00 p.m. Total Damages $ 1,046,359 Investigation Responsibility: State PHMSA NTSB Other Company Reported Apparent Cause: Corrosion Excavation Natural Forces Incorrect Operation Other Outside Force Damage Material and/or Welds Equipment and Operations Other Rupture Yes No Leak Yes No Fire Yes No Explosion Yes No Evacuation Yes No Number of Persons Area Narrative Summary Short summary of the Incident/Accident which will give interested persons sufficient information to make them aware of the basic scenario and facts. Panhandle Eastern Pipeline Company (PEPL) experienced failure of the Houstonia 200 line near Mile Post 21.6. There were no evacuations, road closings, fires, injuries or fatalities as a result of the failure. The failure did not occur in a high consequence area (HCA). The failure occurred on August 25, 2008, at approximately 8:51 a.m. CDT. The failure is located on a rocky hillside in a rural area west of Pilot Grove, Missouri in Cooper County. The failure was identified by PEPL when Houston Gas Control detected a pressure drop in the Houstonia 200 Line. The failure was located at approximately 9:00 a.m. when a PEPL field technician reported gas blowing near Mile Post 21.6. PEPL isolated the segment at approximately 9:30 a.m., by manually closing mainline valves 2 Gate and 3 Gate. The distance between 2 Gate and 3 Gate is approximately 16 miles. The pipeline experienced a longitudinal rupture in the pipe body. The rupture created a 50 feet by 33 ft by 7 feet deep crater in the ground. Two pipeline segments totalling 28 feet in length and a coupling were ejected from the crater a distance up to 300 feet from the rupture site. The failure origin was a 16 inch long area of reduced wall thickness located at the 6:00 orientation. The portion of the pipeline containing the failure is comprised of 24-inch diameter by 0.281-inch wall thickness, API 5L-X48, manufactured by A.O. Smith and contains a longitudinal electric flash welded (EFW) seam. The reported maximum allowable operating pressure (MAOP) is 800 psig, which corresponds to 71% of the specified minimum yield strength (SMYS). The pressure at the time and location of failure was 795 psig, which corresponds to 70% of the SMYS (99% of MAOP). The MAOP was established in accordance with 192.619 ( c ), the highest actual operating pressure to which the segment was subjected during the five years preceding July 1, 1970. A hydrostatic test of the pipeline was performed in 1955. Details of the hydrostatic test are unknown. The pipeline, installed in 1937, is joined by circumferential girth welds and Dresser couplings. The pipeline external coating is coal tar. The pipeline has an impressed curent cathodic protection system that was reportedly energized in 1955. The findings of PEPL's investigation are as follows: 1) The failure occurred due to tensile overload at a region of wall thinning caused by external corrosion. 2) The maximum wall loss measured at the rupture surface was 0.21 inches depth (75% of wall thickness).
Transcript of Pipeline Failure Investigation Report · A hydrostatic test of the pipeline was performed in 1955....

Pipeline Failure Investigation Report
- 1 - Form 11 Pipeline Failure Investigation Report (Revised 03/07/08)
Pipeline System: Houstonia 200 Line Operator: Panhandle Eastern Pipeline Company, LP
Location: Mile Post 21.6 Date of Occurrence: 8/25/2008
Medium Released: Natural gas Quantity: 13,518,578 CF
PHMSA Arrival Time & Date: 8/25/08 1:00 p.m. Total Damages $ 1,046,359
Investigation Responsibility: State PHMSA NTSB Other
Company Reported Apparent Cause: Corrosion Excavation
Natural Forces Incorrect Operation Other Outside Force Damage
Material and/or Welds Equipment and Operations Other
Rupture Yes No
Leak Yes No
Fire Yes No
Explosion Yes No
Evacuation Yes No Number of Persons Area
Narrative Summary Short summary of the Incident/Accident which will give interested persons sufficient information to make them aware of the basic scenario and facts.
Panhandle Eastern Pipeline Company (PEPL) experienced failure of the Houstonia 200 line near Mile Post 21.6. There were no evacuations, road closings, fires, injuries or fatalities as a result of the failure. The failure did not occur in a high consequence area (HCA). The failure occurred on August 25, 2008, at approximately 8:51 a.m. CDT. The failure is located on a rocky hillside in a rural area west of Pilot Grove, Missouri in Cooper County. The failure was identified by PEPL when Houston Gas Control detected a pressure drop in the Houstonia 200 Line. The failure was located at approximately 9:00 a.m. when a PEPL field technician reported gas blowing near Mile Post 21.6. PEPL isolated the segment at approximately 9:30 a.m., by manually closing mainline valves 2 Gate and 3 Gate. The distance between 2 Gate and 3 Gate is approximately 16 miles. The pipeline experienced a longitudinal rupture in the pipe body. The rupture created a 50 feet by 33 ft by 7 feet deep crater in the ground. Two pipeline segments totalling 28 feet in length and a coupling were ejected from the crater a distance up to 300 feet from the rupture site. The failure origin was a 16 inch long area of reduced wall thickness located at the 6:00 orientation. The portion of the pipeline containing the failure is comprised of 24-inch diameter by 0.281-inch wall thickness, API 5L-X48, manufactured by A.O. Smith and contains a longitudinal electric flash welded (EFW) seam. The reported maximum allowable operating pressure (MAOP) is 800 psig, which corresponds to 71% of the specified minimum yield strength (SMYS). The pressure at the time and location of failure was 795 psig, which corresponds to 70% of the SMYS (99% of MAOP). The MAOP was established in accordance with 192.619 ( c ), the highest actual operating pressure to which the segment was subjected during the five years preceding July 1, 1970. A hydrostatic test of the pipeline was performed in 1955. Details of the hydrostatic test are unknown. The pipeline, installed in 1937, is joined by circumferential girth welds and Dresser couplings. The pipeline external coating is coal tar. The pipeline has an impressed curent cathodic protection system that was reportedly energized in 1955. The findings of PEPL's investigation are as follows: 1) The failure occurred due to tensile overload at a region of wall thinning caused by external corrosion. 2) The maximum wall loss measured at the rupture surface was 0.21 inches depth (75% of wall thickness).

Pipeline Failure Investigation Report
- 2 - Form 11 Pipeline Failure Investigation Report (Revised 03/07/08)
PEPL submitted a return to service plan to PHMSA that included a temporary 20% pressure reduction and remediation of anomalies found in a high resoultion MFL tool run. They subsequently remediated 30 anomalies with RPR less than 1.15 and replaced 912 feet of pipe. On 12/19/2009 the temporary pressure restriction was removed. ACTIVITY #: 122653 OPERATOR ID #: 15105 UNIT ID #: 4093 NRC REPORT #: 881717 INCIDENT REPORT # (FORM 7100.2): 20090030 -- 5319
Region/State __Central_______________________ Reviewed by: __David Barrett__original initialed_______
Principal Investigator: _Roger Sneegas________ Title: __Director – Central Region___________________
Date: _10/12/2010________________________ Date: __10/13/2010_________________________

Pipeline Failure Investigation Report
- 3 - Form 11 Pipeline Failure Investigation Report (Revised 03/07/08)
Failure Location & Response
Location (City, Township, Range, County/Parish): (Acquire Map)
Pilot Grove, Missouri
Address or M.P. on Pipeline: (1) Type of Area (Rural, City): (1)
21.6 Rural
Date: 8/25/2008 Time of Failure: 8:51 a.m.
Time Detected: 9:00 a.m. Time Located: 9:10 a.m.
How Located: A technician - Jerry Miller - heard the pipeline blowing from the nearest road at about 9:00 a.m. Gas control had previously noted a pressure drop at 8:51 a.m.
NRC Report #: (Attach Report) Time Reported to NRC: Reported by:
881717 10:15 a.m. on 8/25/2008 Liz Rutherford
Type of Pipeline:
Gas Distribution Gas Transmission Hazardous Liquid LNG
LP Interstate Gas Interstate Liquid LNG Facility
Municipal Intrastate Gas Intrastate Liquid
Public Utility Jurisdictional Gas Gathering Offshore Liquid
Master Meter Offshore Gas Jurisdictional Liquid Gathering
Offshore Gas - High H2S CO2
Pipeline Configuration (Regulator Station, Pump Station, Pipeline, etc.): Mainline Houstonia 200
Operator/Owner Information
Owner: Panhandle Eastern Pipeline Operator: Panhandle Eastern Pipeline
Address: Address: 5444 Westheimer Road Houston TX
5444 Westheimer Road Houston TX
Company Official: Eric Amundsen Company Official: Eric Amundsen
Phone No.: 713-989-7460 Fax No.: Phone No. 713-989-7460 Fax No.
Drug and Alcohol Testing Program Contacts N/A
Drug Program Contact & Phone: Brett Laaser
Alcohol Program Contact & Phone: 713-989-7549
Damages
Product/Gas Loss or Spill(2)
13,518,578 CF Estimated Property Damage $ 25,000
Amount Recovered 0 Associated Damages(3) $ 628,063
1 Photo documentation 2 Initial volume lost or spilled 3 Including cleanup cost

Pipeline Failure Investigation Report
- 4 - Form 11 Pipeline Failure Investigation Report (Revised 03/07/08)
Damages
Estimated Amount $ 393,296
Description of Property Damage: The failure caused a crater in the right-of-way measuring about 50 X 33 feet and 7 feet deep. Two segments of pipe (46 feet total) were ejected from the crater.
Customers out of Service: Yes No Number:
Suppliers out of Service: Yes No Number:
Fatalities and Injuries
Fatalities: Yes No Company: Contractor: Public:
Injuries - Hospitalization: Yes No Company: Contractor: Public:
Injuries - Non-Hospitalization: Yes No Company: Contractor: Public:
Total Injuries (including Non-Hospitalization): Company: Contractor: Public:
Yrs w/ Comp.
Yrs. Exp.
Name Job Function Type of Injury
Drug/Alcohol Testing N/A Were all employees that could have contributed to the incident, post-accident tested within the 2 hour time frame for alcohol or the 32 hour time frame for all other drugs?
Yes No
Job Function Test Date & Time Location Results
Type of Drug Pos Neg
Gas System Controller 8/25/2008 Houston TX

Pipeline Failure Investigation Report
- 5 - Form 11 Pipeline Failure Investigation Report (Revised 03/07/08)
System Description
Describe the Operator's System: The Houstonia 200 line runs from Liberal KS to Howell MI. It is 24-inch diameter 0.281-inch wall X48 pipe installed in 1937.
Pipe Failure Description N/A
Length of Failure (inches, feet, miles): 46 feet (1)
Position (Top, Bottom, include position on pipe, 6 O'clock): (1) Description of Failure (Corrosion Gouge, Seam Split): (1)
Bottom 6 O'clock External corrosion.
Laboratory Analysis: Yes No
Performed by: CC Technologies Inc.
Preservation of Failed Section or Component: Yes No
If Yes - Method: Wrapped
In Custody of: Panhandle Develop a sketch of the area including distances from roads, houses, stress inducing factors, pipe configurations, etc. Bar Hole Test Survey Plot should be outlined with concentrations at test points. Direction of Flow.
Component Failure Description N/A
Component Failed: (1)
Manufacturer: Model:
Pressure Rating: Size
Other (Breakout Tank, Underground Storage):
Pipe Data N/AMaterial: steel Wall Thickness/SDR: 0.281- inch
Diameter (O.D.): 24-inch Installation Date: 1937
SMYS: 48,000 Manufacturer: A. O. Smith
Longitudinal Seam: Electric Flash Weld Type of Coating: Coal Tar
Pipe Specifications (API 5L, ASTM A53, etc.): API 5L, X48
Joining N/A
Type: Girth weld with Coupling every other joint Procedure:
NDT Method: Unknown Inspected: Yes No

Pipeline Failure Investigation Report
- 6 - Form 11 Pipeline Failure Investigation Report (Revised 03/07/08)
Pressure @ Time of Failure @ Failure Site N/A
Pressure @ Failure Site: 795 psig at the Houstonia Station Elevation @ Failure Site: 660
Pressure Readings @ Various Locations: Direction from Failure Site
Location/M.P./Station # Pressure (psig) Elevation (ft msl) Upstream Downstream
N/A
Upstream Pump Station Data N/A
Type of Product: API Gravity:
Specific Gravity: Flow Rate:
Pressure @ Time of Failure (4) Distance to Failure Site:
High Pressure Set Point: Low Pressure Set Point:
Upstream Compressor Station Data N/A
Specific Gravity: .55 Flow Rate:
Pressure @ Time of Failure (4) 795 psig Distance to Failure Site: 21.6 miles
High Pressure Set Point: 830 psig Low Pressure Set Point:
Operating Pressure N/A
Max. Allowable Operating Pressure: 800 psig Determination of MAOP: 192.619 (c)
Actual Operating Pressure: 795 psig
Method of Over Pressure Protection: Engine safeties - first engine speed and torque, then shutdown. Relief Valve Set Point: 830 psig Capacity Adequate? Yes No
Integrity Test After Failure N/A
Pressure Test Conducted in place? (Conducted on Failed Components or Associated Piping): Yes No
If NO, Tested after removal? Yes No
Method: N/A
Describe any failures during the test.
Soil/water Conditions @ Failure Site N/ACondition of and Type of Soil around Failure Site (Color, Wet, Dry, Frost Depth): Dry and very rocky
Type of Backfill (Size and Description): Rock
4 Obtain event logs and pressure recording charts

Pipeline Failure Investigation Report
- 7 - Form 11 Pipeline Failure Investigation Report (Revised 03/07/08)
Soil/water Conditions @ Failure Site N/AType of Water (Salt, Brackish): N/A Water Analysis
(5) Yes No
External Pipe or Component Examination N/A
External Corrosion? Yes No
(1) Coating Condition (Disbonded, Non-existent): Coal tar - some disbonded
(1)
Description of Corrosion: The failed pipeline segments showed multiple areas of external corrosion with reduced wall thickness.
Description of Failure Surface (Gouges, Arc Burns, Wrinkle Bends, Cracks, Stress Cracks, Chevrons, Fracture Mode, Point of Origin): A 23 foot section of pipe was ejected and completely ruptured by the failure. Chevrons along the rupture pointed toward the origin in an area of external corrosion with reduced wall thickness.
Above Ground: Yes No (1)
Buried: Yes No (1)
Stress Inducing Factors: (1) Depth of Cover: 6 feet (1)
Cathodic Protection N/AP/S (Surface): Readings taken this Spring were adequate - > .85 V - Recent reading in the area -2.1 V 3/26/08
P/S (Interface): Not taken
Soil Resistivity: No soil - rock pH: Date of Installation: 1955
Method of Protection: Rectifiers
Did the Operator have knowledge of Corrosion before the Incident? Yes No
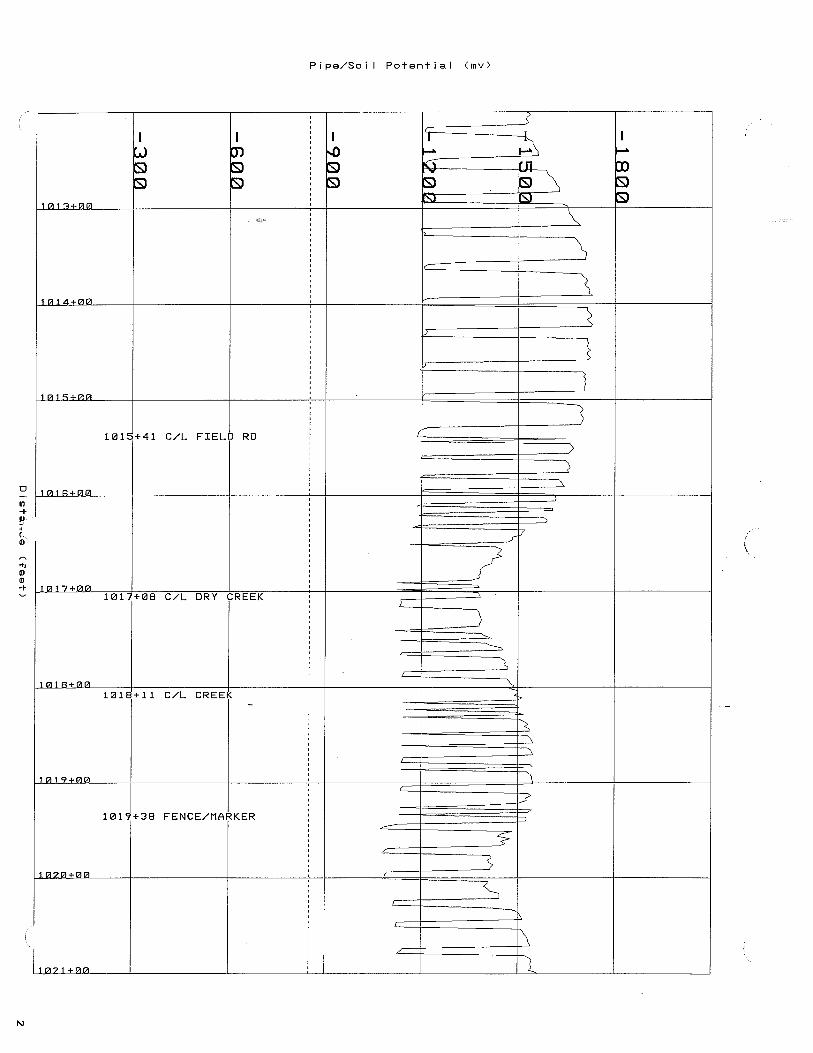
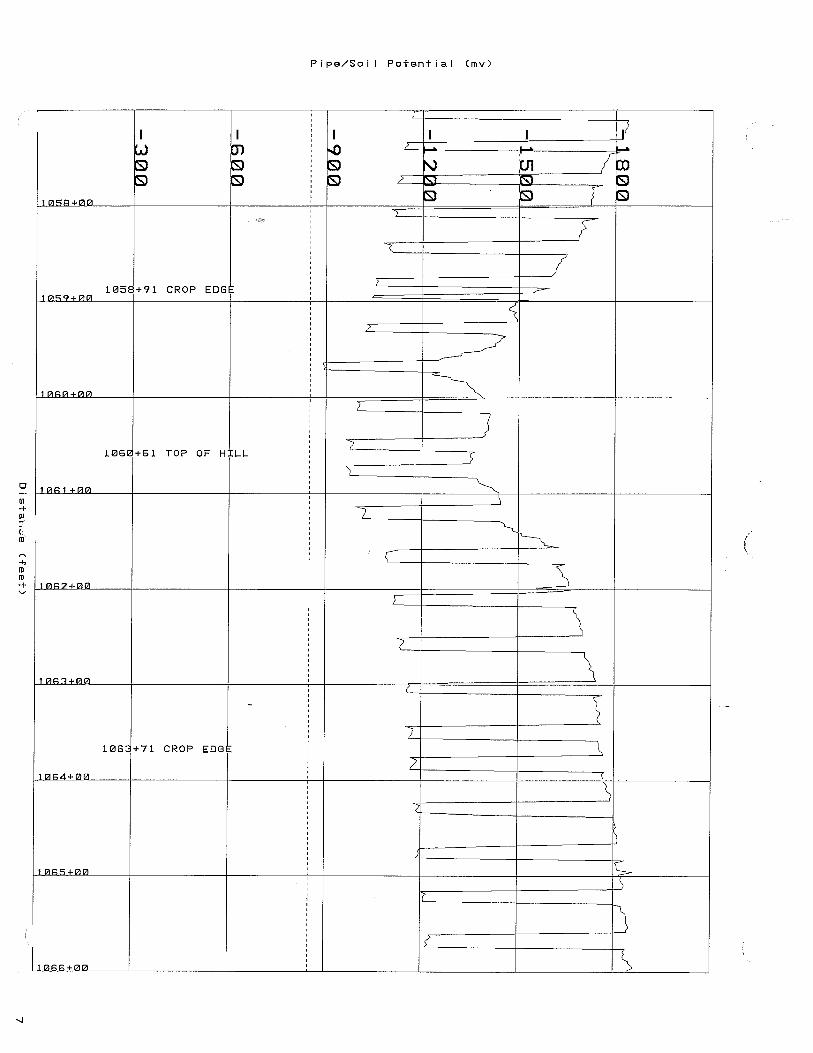
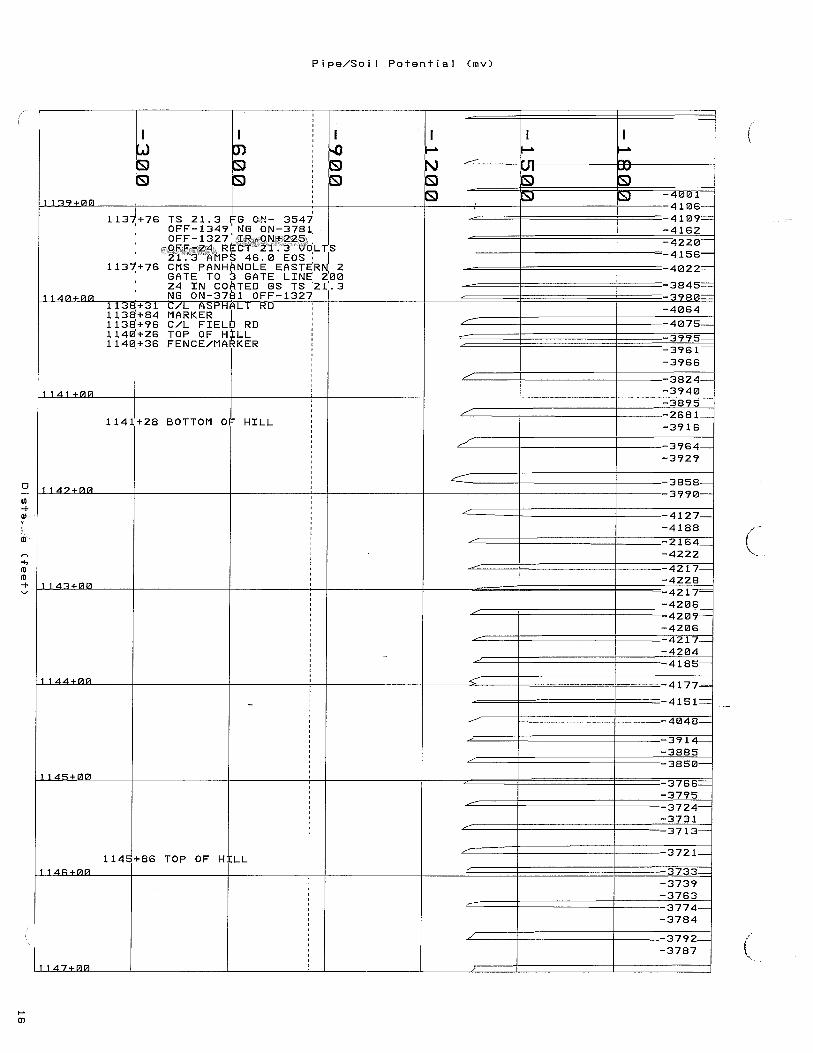
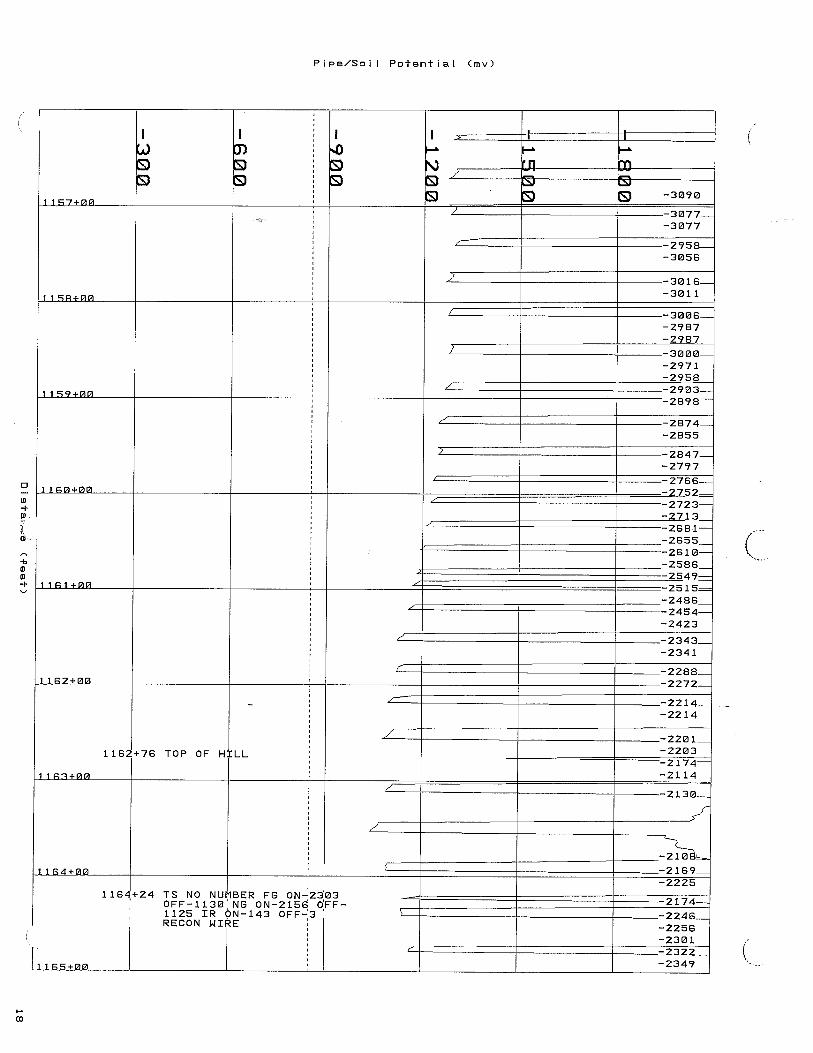
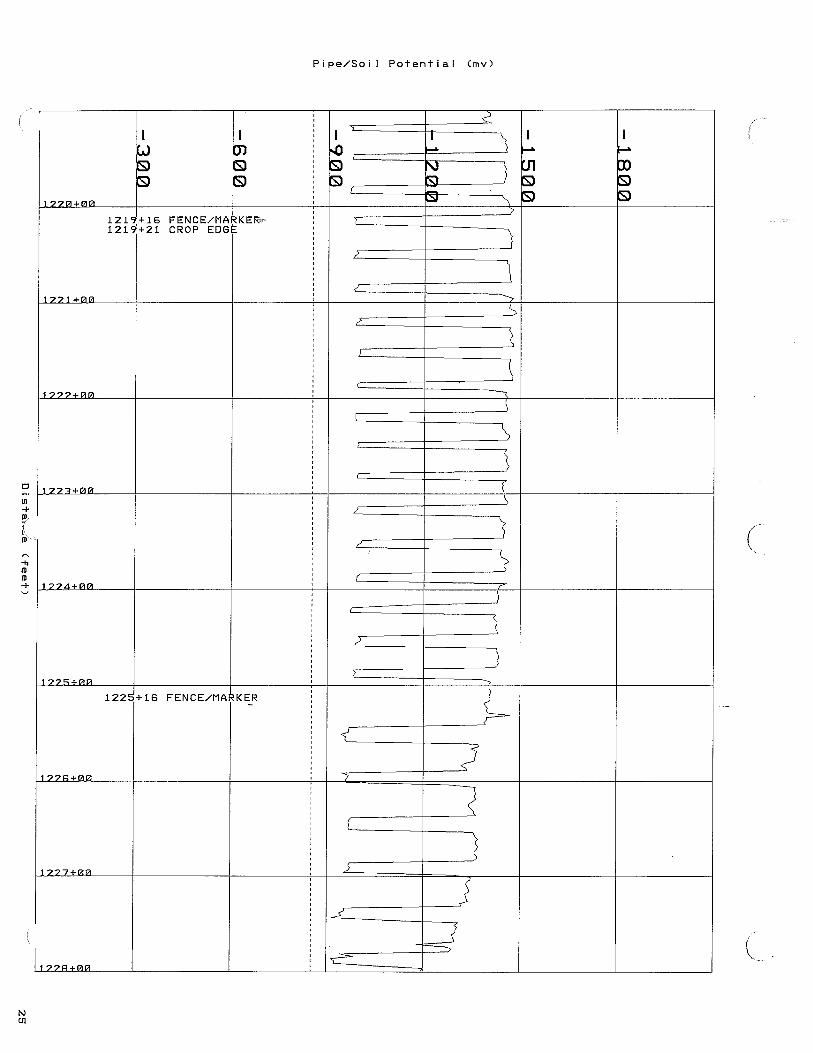
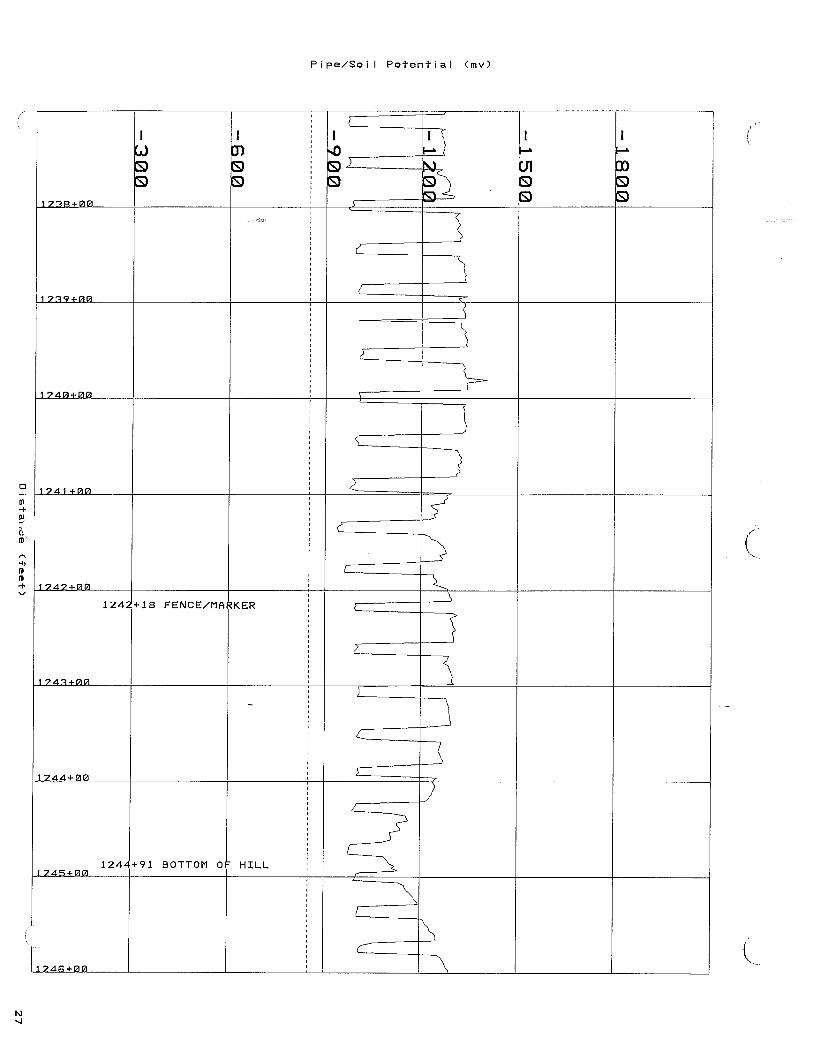
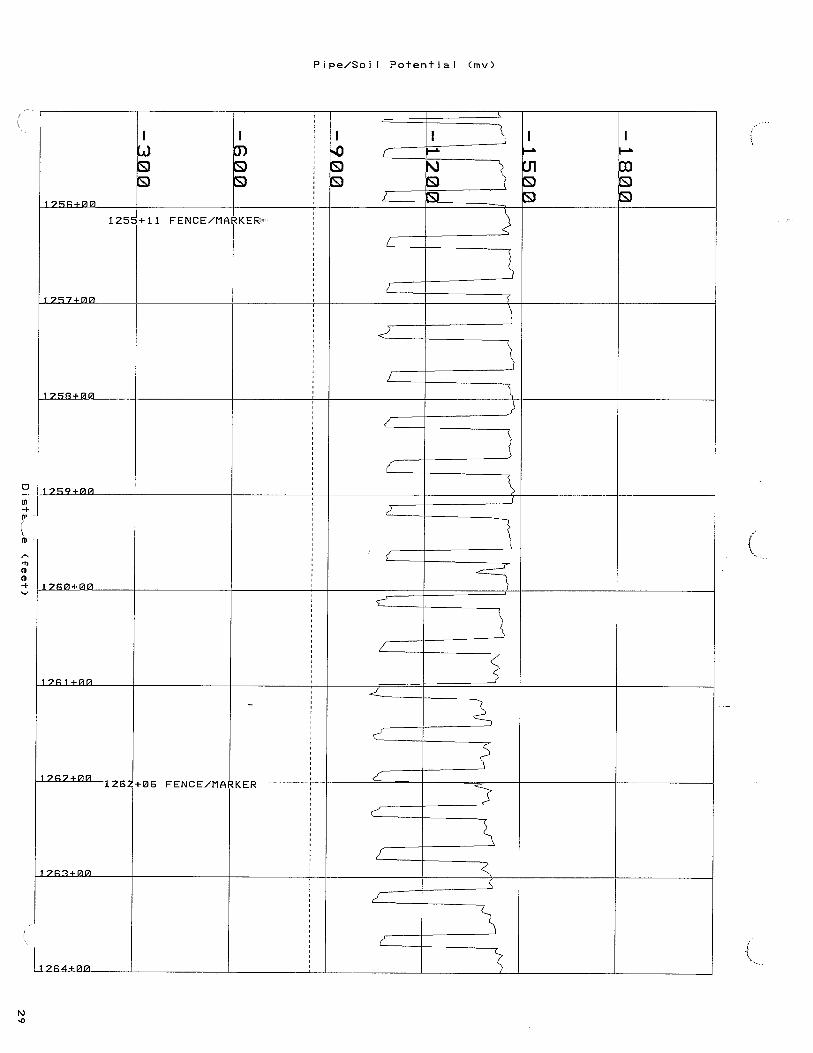
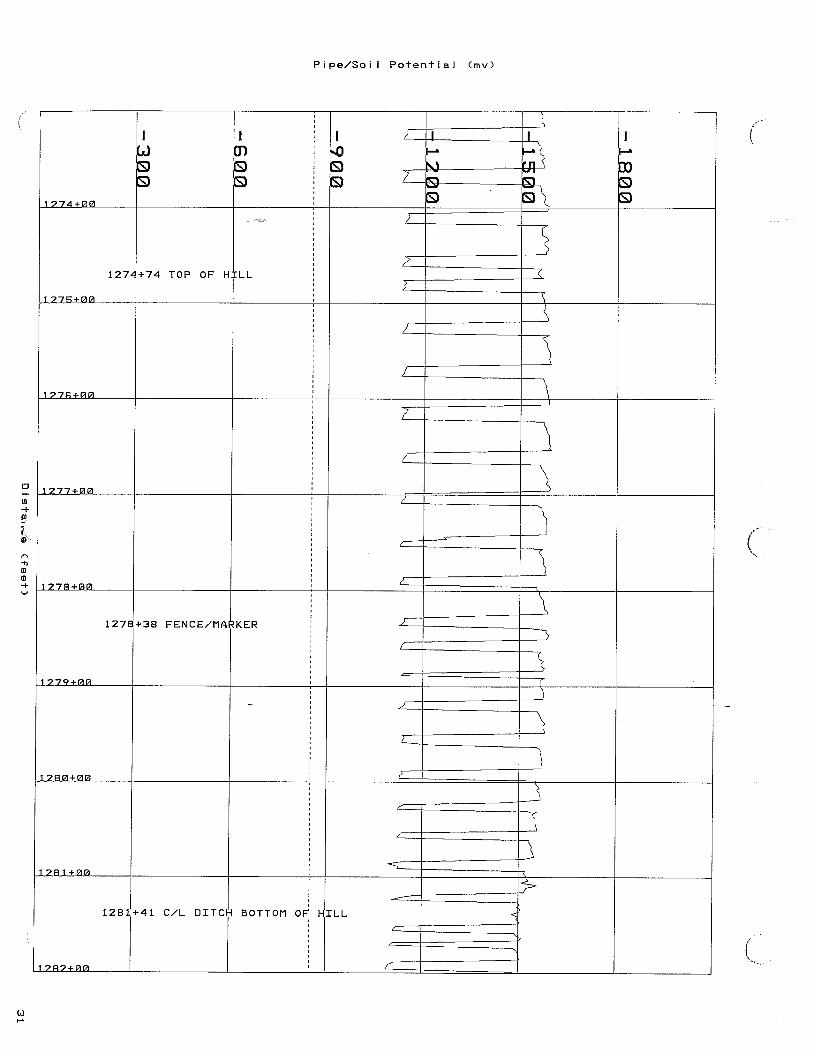
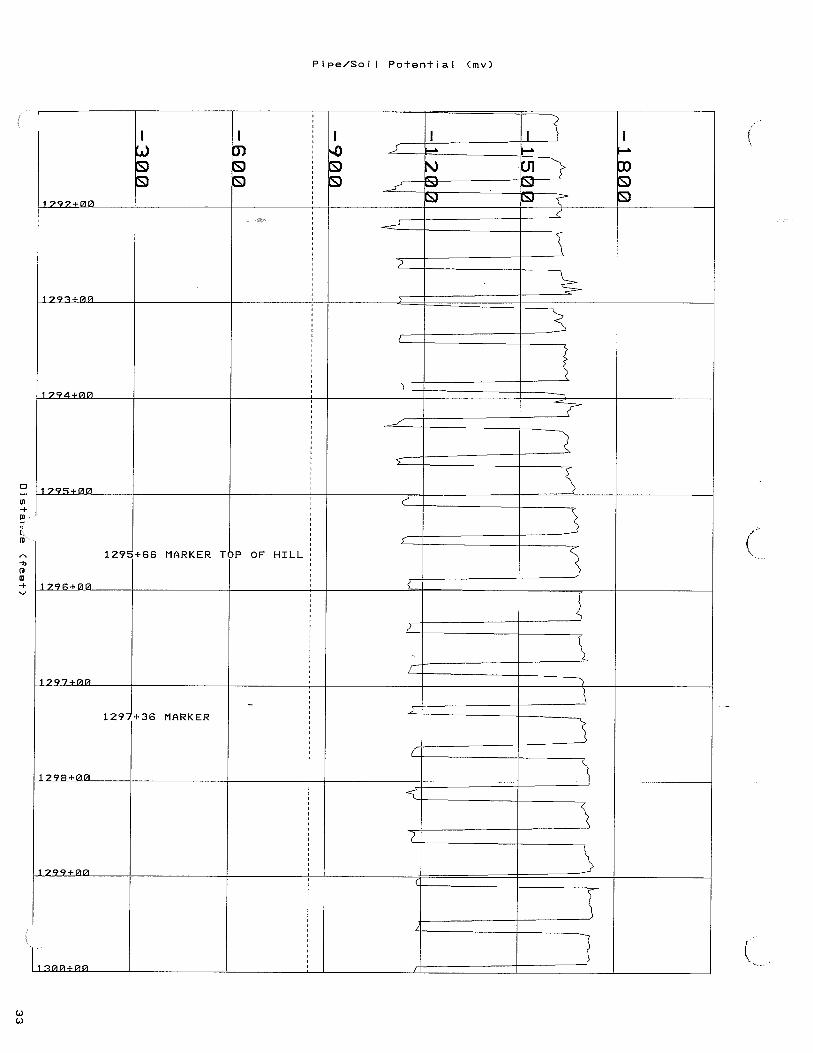
How Discovered? (Close Interval Survey, Instrumented Pig, Annual Survey, Rectifier Readings, ECDA, etc): A close interval survey was performed in 2000 from 2 Gate to 3 Gate. Some areas of low pipe to soil potential were found but not in the area of the failure. See Appendix D.
Internal Pipe or Component Examination N/A
Internal Corrosion: Yes No (1)
Injected Inhibitors: Yes No
Type of Inhibitors: N/A Testing: Yes No
Results (Coupon Test, Corrosion Resistance Probe): N/A
Description of Failure Surface (MIC, Pitting, Wall Thinning, Chevrons, Fracture Mode, Point of Origin):
The cause of the failure was external corrosion with reduced wall thickness.
Cleaning Pig Program: Yes No Gas and/or Liquid Analysis: Yes No
5 Attach copy of water analysis report
Pipeline Failure Investigation Report
- 8 - Form 11 Pipeline Failure Investigation Report (Revised 03/07/08)
Internal Pipe or Component Examination N/AResults of Gas and/or Liquid Analysis (6) N/A
Internal Inspection Survey: Yes No Results (7) ILI had been scheduled but not done.
Did the Operator have knowledge of Corrosion before the Incident? Yes No
How Discovered? (Instrumented Pig, Coupon Testing, ICDA, etc.): N/A
Outside Force Damage N/AResponsible Party: Telephone No.:
Address:
Work Being Performed: Equipment Involved: (1)
Called One Call System? Yes No
One Call Name: One Call Report # (8)
Notice Date: Time:
Response Date: Time:
Details of Response:
Was Location Marked According to Procedures? Yes No
Pipeline Marking Type: (1) Location: (1)
State Law Damage Prevention Program Followed? Yes No No State Law
Notice Required: Yes No Response Required: Yes No
Was Operator Member of State One Call? Yes No Was Operator on Site? Yes No
Did a deficiency in the Public Awareness Program contribute to the accident? Yes No
Is OSHA Notification Required? Yes No
6 Attach copy of gas and/or liquid analysis report 7 Attach copy of internal inspection survey report 8 Attach copy of one-call report

Pipeline Failure Investigation Report
- 9 - Form 11 Pipeline Failure Investigation Report (Revised 03/07/08)
Natural Forces N/ADescription (Earthquake, Tornado, Flooding, Erosion):
Failure Isolation N/ASqueeze Off/Stopple Location and Method: Panhandle isolated the failure by manually closing 2 Gate and 3 Gate.
(1)
Valve Closed - Upstream: 2 Gate I.D.:
Time: 9:38 AM M.P.: 12.97
Valve Closed - Downstream: 3 Gate I.D.:
Time: 9:23 M.P.: 28.43
Pipeline Shutdown Method: Manual Automatic SCADA Controller ESD Failed Section Bypassed or Isolated: Isolated
Performed By: Field Tech. Valve Spacing: 16 miles
Odorization N/A
Gas Odorized: Yes No Concentration of Odorant (Post Incident at Failure Site):
Method of Determination: Yes No % LEL: Yes No % Gas In Air: Yes No
Time Taken: Yes No
Was Odorizer Working Prior to the Incident? Type of Odorizer (Wick, By-Pass):
Yes No
Odorant Manufacturer: Type of Odorant:
Model:
Amount Injected: Monitoring Interval (Weekly):
Odorization History (Leaks Complaints, Low Odorant Levels, Monitoring Locations, Distances from Failure Site):

Pipeline Failure Investigation Report
- 10 - Form 11 Pipeline Failure Investigation Report (Revised 03/07/08)
Odorization N/A
Weather Conditions N/ATemperature: 85 F Wind (Direction & Speed): light
Climate (Snow, Rain): Sunny Humidity:
Was Incident preceded by a rapid weather change? Yes No
Weather Conditions Prior to Incident (Cloud Cover, Ceiling Heights, Snow, Rain, Fog): Clear
Gas Migration Survey N/A
Bar Hole Test of Area: Yes No Equipment Used:
Method of Survey (Foundations, Curbs, Manholes, Driveways, Mains, Services) (9)
(1)
Environment Sensitivity Impact N/ALocation (Nearest Rivers, Body of Water, Marshlands, Wildlife Refuge, City Water Supplies that could be or were affected by the medium loss):
(1)
OPA Contingency Plan Available? Yes No Followed? Yes No
Class Location/High Consequence Area N/A
Class Location: 1 2 3 4 Determination:
HCA Area? Yes No N/A Determination:
Odorization Required? Yes No N/A
Pressure Test History N/A(Expand List as Necessary)
9 Plot on site description page

Pipeline Failure Investigation Report
- 11 - Form 11 Pipeline Failure Investigation Report (Revised 03/07/08)
Pressure Test History N/A(Expand List as Necessary)
Req’d (10)Assessment
Deadline Date Test Date Test Medium
Pressure (psig)
Duration (hrs)
% SMYS
Installation N/A
Next N/A 1955 Water Unknown Unknown Unknown
Next
Most Recent
Describe any problems experienced during the pressure tests. Hydrostatic test done in 1955 - details unknown.
Internal Line Inspection/Other Assessment History N/A(Expand List as Necessary)
Req’d (10) Assessment
Deadline Date Assessment
Date Type of ILI
Tool (11) Other Assessment
Method (12) Indicated Anomaly
If yes, describe below
Initial 2012 Yes No
Next Yes No
Next Yes No
Most Recent Yes No
Describe any previously indicated anomalies at the failed pipe, and any subsequent pipe inspections (anomaly digs) and remedial actions. Not scheduled until 2012. Not in top 50%. Gauge tool run already.
Pre-Failure Conditions and Actions N/A
Was there a known pre-failure condition requiring (10) the operator to schedule evaluation and remediation?
Yes (describe below or on attachment) No
If there was such a known pre-failure condition, had the operator established and adhered to a required (10) evaluation and remediation schedule? Describe below or on attachment. Yes No N/A
Prior to the failure, had the operator performed the required (10) actions to address the threats that are now known to be related to the cause of this failure? Yes No N/A List below or on an attachment such operator-identified threats, and operator actions taken prior to the accident.
Describe any previously indicated anomalies at the failed pipe, and any subsequent pipe inspections (anomaly digs) and remedial actions. N/A
Maps & Records N/A
10 As required of Pipeline Integrity Management regulations in 49CFR Parts 192 and 195 11 MFL, geometry, crack, etc. 12 ECDA, ICDA, SCCDA, “other technology,” etc.

Pipeline Failure Investigation Report
- 12 - Form 11 Pipeline Failure Investigation Report (Revised 03/07/08)
Are Maps and Records Current? (13) Yes No Comments:
Leak Survey History N/ALeak Survey History (Trend Analysis, Leak Plots):
Leak survey on 6/25/2007. No leaks were found in the area of the failure.
Pipeline Operation History N/A
Description (Repair or Leak Reports, Exposed Pipe Reports):
N/A
Did a Safety Related Condition Exist Prior to Failure? Yes No Reported? Yes No
Unaccounted For Gas: None before the incident.
Over & Short/Line Balance (24 hr., Weekly, Monthly/Trend):
Operator/Contractor Error N/A
Name: Job Function:
Title: Years of Experience:
Training (Type of Training, Background):
Was the person “Operator Qualified” as applicable to a precursor abnormal operating condition? Yes No N/A
Was qualified individual suspended from performing covered task Yes No N/A
Type of Error (Inadvertent Operation of a Valve):
Procedures that are required:
Actions that were taken:
Pre-Job Meeting (Construction, Maintenance, Blow Down, Purging, Isolation):
Prevention of Accidental Ignition (Tag & Lock Out, Hot Weld Permit):
Procedures conducted for Accidental Ignition:
Was a Company Inspector on the Job? Yes No
Was an Inspection conducted on this portion of the job? Yes No
13 Obtain copies of maps and records

Pipeline Failure Investigation Report
- 13 - Form 11 Pipeline Failure Investigation Report (Revised 03/07/08)
Operator/Contractor Error N/A
Additional Actions (Contributing factors may include number of hours at work prior to failure or time of day work being conducted):
Training Procedures:
Operation Procedures:
Controller Activities:
Name Title Years Experience
Hours on Duty Prior to Failure
Shift
Alarm Parameters:
High/Low Pressure Shutdown:
Flow Rate:
Procedures for Clearing Alarms:
Type of Alarm:
Company Response Procedures for Abnormal Operations:
Over/Short Line Balance Procedures:
Frequency of Over/Short Line Balance:
Additional Actions:
Additional Actions Taken by the Operator N/AMake notes regarding the emergency and Failure Investigation Procedures (Pressure reduction, Reinforced Squeeze Off, Clean Up, Use of Evacuators, Line Purging, closing Additional Valves, Double Block and Bleed, Continue Operating downstream Pumps):

Pipeline Failure Investigation Report
- 14 - Form 11 Pipeline Failure Investigation Report (Revised 03/07/08)
Additional Actions Taken by the Operator N/AThe failure was detected by Gas Control in Houston at 8:51 a.m. on 8/25/2008. Field crews located the failure at 9:10 a.m. The failure was isolated by closing valves at about 9:30 a.m. Panhandle sent a team to investigate the failure on 8/26/08. After the initial investigation, the pipeline was repaired and returned to service at 80% of the pressure at the time of the incident (795 psi) pending the results of the investigation.

Pipeline Failure Investigation Report
- 15 - Form 11 Pipeline Failure Investigation Report (Revised 03/07/08)
Photo Documentation (1)
Overall Area from best possible view. Pictures from the four points of the compass. Failed Component, Operator Action, Damages in Area, Address Markings, etc.
Photo No.
Roll No.
Photo No.
Roll No. Description Description
1 View looking west at the crater 1
2 East view of exposed pipe in crater 2
3 West view of exposed pipe in crater 3
4 View of longer ejected pipe segment 4
5 Close view of longer segment 5
6 View of shorter ejected segment 6
7 Another view of shorter segment 7
8 Possible failure origin on shorter segment 8
9 Side view of possible failure. 9
10 View of coupling ejected into the woods 10
11 Close up of corrosion at possible failure origin. 11
12 View of another area of external corrosion near the failure origin 12
13 View of failure origin after the pipe was moved. 13
14 14
15 15
16 16
17 17
18 18
19 19
20 20
21 21
22 22
23 23
24 24
25 25
26 26
27 27
28 28
29 29
30 30
Type of Camera:

Pipeline Failure Investigation Report
- 16 - Form 11 Pipeline Failure Investigation Report (Revised 03/07/08)
Photo Documentation (1)
Film ASA:
Video Counter Log (Attach Copy):
Additional Information Sources
Agency Name Title Phone Number
Police: Cooper County Sheriff
Fire Dept.: Pilot Grove Fire Dept
State Fire Marshall:
State Agency: Missouri DOT Emergency Response Team
NTSB:
EPA:
FBI:
ATF:
OSHA:
Insurance Co.:
FRA:
MMS:
Television: No
Newspaper:
Other:

Pipeline Failure Investigation Report
- 17 - Form 11 Pipeline Failure Investigation Report (Revised 03/07/08)
Persons Interviewed
Name Title Phone Number
Brad Howard Operations Specialist 660-568-1221
Mike Dawson
Steve Atkinson Technical Specialist 913-906-1522
Jerry Rau Director Pipeline Integrity 713-989-7417
Rob Wesch
Liz Rutherford
Brian Kraft Measurement Tech
Dan Corpening Area Director
Ross Cummins CP Tech
Richard Gifford Corrosion Tech
Gerald Moore Environmental Coordinator

Pipeline Failure Investigation Report
- 18 - Form 11 Pipeline Failure Investigation Report (Revised 03/07/08)
Event Log
Sequence of events prior, during, and after the incident by time. (Consider the events of all parties involved in the incident, Fire Department and Police reports, Operator Logs and other government agencies.)
Time Event
8:51 a.m. 8/25/08 Gas Control detects a pressure drop on the Houstonia 200 line and asks field techs to check for a leak.
9:00 a.m. Filed techs hear blowing gas near mile post 21.6
9:10 a.m. Field techs locate the failure
9:23 a.m. 3 Gate at MP 28.43 is closed manually
9:38 a.m. 2 Gate at MP 12.97 is closed manually
9:00 -11:00 a.m. Panhandle, Fire and police check the area to see if evacuations are necessary
1:00 p.m. PHMSA investigator arrives on site.
1:00 - 8:00 p.m. Investigation by PHMSA and Panhandle
12:00 p.m. 8/26 Panhandle investigation team from Houston arrives
12:00 - 7:00 p.m. Investigation of the failure site by PHMSA and Panhandle.

Pipeline Failure Investigation Report
- 19 - Form 11 Pipeline Failure Investigation Report (Revised 03/07/08)
Investigation Contact Log
Time Date Name Description
1:00 p.m.
8/26/08 Brad Howard Operations Specialist
1:30 p.m.
8/26/08 Steve Atkinson Technical Specialist
12:00 p.m.
8/27/08 Jerry Rau Director Pipeline Integrity
1:00 p.m.
8/26-10/20
Brad Howard Follow up on various issues
10:00 a.m.
9/26/08 David McQuilling Principal Engineer - conference call on cathodic protection
10:00 a.m.
9/26/08 Steve Atkinson Same conference call.

Pipeline Failure Investigation Report
- 20 - Form 11 Pipeline Failure Investigation Report (Revised 03/07/08)
Failure Investigation Documentation Log
Operator: Unit #: CPF #: Date:
Appendix Documentation Description
Date FOIA
Number Received Yes No
A Investigation Pictures 8/25/08 X
B Panhandle Incident Report 9/18/08 X
C Panhandle Laboratory Failure Analysis 10/29/08 X
D Panhandle Close Interval Survey 9/18/08 X

Pipeline Failure Investigation Report
- 21 - Form 11 Pipeline Failure Investigation Report (Revised 03/07/08)
Site Description Provide a sketch of the area including distances from roads, houses, stress inducing factors, pipe configurations, etc. Bar Hole Test Survey Plot should be outlined with concentrations at test points. Photos should be taken from all angles with each photo documented. Additional areas may be needed in any area of this guideline.
The Failure location was about two miles northwest of Pilot Grove (Cooper County) Missouri near Highway HH. The location was near milepost 21.6 on the Houstonia 200 line on a rocky hillside in a rural area. No structures were close to the failure location. The following page shows a sketch of the location provided by Panhandle. The image below shows the Panhandle system map.
Panhandle Eastern Pipe Line Company, LP
Panhandle Eastern Pipe Line Company operates a 6,500-mile pipeline system with access to diverse supply sources and can deliver 2.8 Bcf/d of natural gas to Midwest and East Coast markets. Tie-ins to Chicago, Dayton and Cincinnati have added to a Midwest customer base that includes some of the nation's largest utility and industrial natural gas users. We lead the way in offering competitive rates and a constantly evolving array of customer-friendly service options.
Panhandle Eastern provides:
Access to diverse Midcontinent and Canadian supply sources and to major Midwest and Northeast markets.
Access to 74 Bcf of storage facilities.
To request a receipt and delivery point map, please contact Customer Service at 1-800-275-7375.

Pipeline Failure Investigation Report
- 22 - Form 11 Pipeline Failure Investigation Report (Revised 03/07/08)

Pipeline Failure Investigation Report
- 23 - Form 11 Pipeline Failure Investigation Report (Revised 03/07/08)
Appendix A
Houstonia 200 failure Pictures – 8/25/08 near Pilot Grove MO.

Pipeline Failure Investigation Report
- 24 - Form 11 Pipeline Failure Investigation Report (Revised 03/07/08)
8/25/08 – #1- views looking West at the crater caused by the Houstonia 200 failure.

Pipeline Failure Investigation Report
- 25 - Form 11 Pipeline Failure Investigation Report (Revised 03/07/08)
8/25/08 #2 - East view of the exposed pipe.
8/25/08 #3 -West close up.

Pipeline Failure Investigation Report
- 26 - Form 11 Pipeline Failure Investigation Report (Revised 03/07/08)
8/25/08 #4 - One of two pipe sections ejected – the longer one – about 30 feet.
8/25/08 #5 -Closer view of the longer ejected section.

Pipeline Failure Investigation Report
- 27 - Form 11 Pipeline Failure Investigation Report (Revised 03/07/08)
8/25/08 #6 -View of the shorter section ejected – about 23 feet – ruptured full length.
8/25/08 #7 -Another view of same looking north.

Pipeline Failure Investigation Report
- 28 - Form 11 Pipeline Failure Investigation Report (Revised 03/07/08)
#8 - Areas with external corrosion and reduced wall thickness – possible failure origin.
8/25/08 #9 -Side view of the failure origin site with reduced wall thickness.
Pipeline Failure Investigation Report
- 29 - Form 11 Pipeline Failure Investigation Report (Revised 03/07/08)
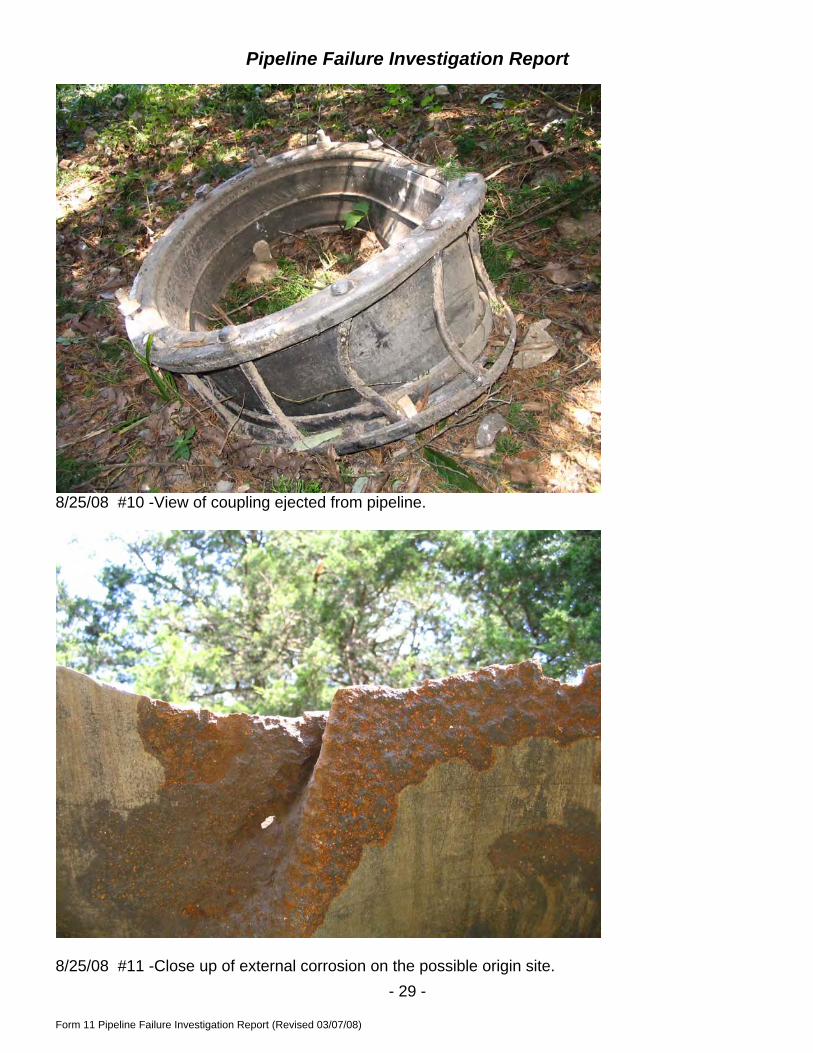
8/25/08 #10 -View of coupling ejected from pipeline.
8/25/08 #11 -Close up of external corrosion on the possible origin site.

Pipeline Failure Investigation Report
- 30 - Form 11 Pipeline Failure Investigation Report (Revised 03/07/08)
8/25/08 #12 - Another area of external corrosion on the shorter section near the possible failure.
8/26/08 #13 -Different view of the possible failure origin after the pipe was turned over.

Pipeline Failure Investigation Report
- 31 - Form 11 Pipeline Failure Investigation Report (Revised 03/07/08)
Appendix B
Panhandle Incident Report

NOTICE: This report is required by 49 CFR Part 191. Failure to report can result in a civil penalty not to exceed $25,000 for each violation Form Approved for each day that such violation persists except that the maximum civil penalty shall not exceed $500,000 as provided in 49 USC 1678. OMB No. 2137-0522
U.S. Department of Transportation Research and Special Programs Administration
INCIDENT REPORT - GAS TRANSMISSION AND
GATHERING SYSTEMS
Report Date No.
(DOT Use Only) INSTRUCTIONS Important: Please read the separate instructions for completing this form before you begin. They clarify the
information requested and provide specific examples. If you do not have a copy of the instructions, you can obtain one from the Office Of Pipeline Safety Web Page at http://ops.dot.gov .
PART A – GENERAL REPORT INFORMATION Original Report Supplemental Report Final Report Operator Name and Address
a. Operator's 5-digit Identification Number (when known) / /
b. If Operator does not own the pipeline, enter Owner’s 5-digit Identification Number (when known) / / c. Name of Operator ______________________________ _______________________________________________________ d. Operator street address ________________________________________________________________________________________
e. Operator address _______________________
City, County or Parrish, State and Zip Code
2. Time and date of the incident
/ / / / / / / / hr. month day year
3. Location of incident
a. Nearest street or road b. City and County or Parrish
c. State and Zip Code
d. Mile Post/Valve Station
e. Survey Station No.
f. Latitude: Longitude: (if not available, see instructions for how to provide specific location)
g. Class location description Onshore: Class 1 Class 2 Class 3 Class 4
Offshore: Class 1 (complete rest of this item)
Area ___________________ Block # ___________
State / / or Outer Continental Shelf
h. Incident on Federal Land other than Outer Continental Shelf Yes No i. Is pipeline Interstate Yes No
4. Type of leak or rupture
Leak: Pinhole Connection Failure (complete sec. F5)
Puncture, diameter (inches)
Rupture: Circumferential – Separation
Longitudinal – Tear/Crack, length (inches)
Propagation Length, total, both sides (feet)
N/A Other:
5. Consequences (check and complete all that apply) a. Fatality Total number of people: / /
Employees: / / General Public: / /
Non-employee Contractors: / /
b. Injury requiring inpatient hospitalization Total number of people: / /
Employees: / / General Public: / /
Non-employee Contractors: / /
c. Property damage/loss (estimated) Total $
Gas loss $ Operator damage $
Public/private property damage $
d. Release Occurred in a ‘High Consequence Area’
e. Gas ignited – No explosion f. Explosion
g. Evacuation (general public only) / / people
Reason for Evacuation: Emergency worker or public official ordered, precautionary Threat to the public Company policy
6. Elapsed time until area was made safe:
/ / hr. / / min.
7. Telephone Report
/ / / / / / / / NRC Report Number month day year
8. a. Estimated pressure at point and time of incident:
PSIG
b. Max. allowable operating pressure (MAOP): PSIG
c. MAOP established by 49 CFR section: 192.619 (a)(1) 192. 619 (a)(2) 192. 619 (a)(3)
192.619 (a)(4) 192. 619 (c)
d. Did an overpressurization occur relating to the incident? Yes No
PART B – PRE
(type or print) Pre Preparer's E-mail
Authorized Signat
Form RSPA F 7
PA
pare
Add
ure
10
RER AND AUTHORIZED SIGNATURE
r's Name and Title
Area Code and Telephone Number
ress
Area Code and Facsimile Number
(type or print) Name and Title
Date
Area Code and Telephone Number
0.2 ( 01-2002 ) OPS Data Facsimile Page 1 of 3
ed.chernosky
Text Box
Check one or more boxes as appropriate:

PART C - ORIGIN OF THE INCIDENT
1. Incident occurred on Transmission System
Gathering System
Transmission Line of Distribution System
2. Failure occurred on Body of pipe Pipe Seam
Joint
Component
Other:
3. Material involved (pipe, fitting, or other component) Steel
Plastic (If plastic, complete all items that apply in a-c)
Plastic failure was: a.ductile b.brittle c.joint failure Material other than plastic or steel: _________
4. Part of system involved in incident Pipeline Regulator/Metering System
Compressor Station Other:
5. Year the pipe or component which failed was installed: / /
PART D – MATERIAL SPECIFICATION (if applicable) PART E – ENVIRONMENT
1. Nominal pipe size (NPS) / / in.
2. Wall thickness / / in.
3. Specification SMYS / /
4. Seam type
1. Area of incident In open ditch Under pavement Above ground
Under ground Under water
Inside/under building Other:
2. Depth of cover: inches 5. Valve type
6. Pipe or valve manufactured by in year / /
PART F – APPARENT CAUSE Important: There are 25 numbered causes in this section. Check the box to the left of the primary cause of the incident. Check one circle in each of the supplemental items to the right of or below the cause you indicate. See the instructions for this form for guidance.
F1 – CORROSION If either F1 (1) External Corrosion, or F1 (2) Internal Corrosion is checked, complete all subparts a – e. 1. External Corrosion
a. Pipe Coating
Bare
Coated
b. Visual Examination
Localized Pitting
General Corrosion
Other: ____________________
c. Cause of Corrosion Galvanic Stray Current
Improper Cathodic Protection
Microbiological
Stress Corrosion Cracking
Other: ____________________
2. Internal Corrosion
d. Was corroded part of pipeline considered to be under cathodic protection prior to discovering incident? No Yes, Year Protection Started: / /
e. Was pipe previously damaged in the area of corrosion? No Yes, How long prior to incident: / / years / / months
F2 – NATURAL FORCES 3. Earth Movement => Earthquake Subsidence Landslide Other: 4. Lightning 5. Heavy Rains/Floods => Washouts Flotation Mudslide Scouring Other:
6. Temperature => Thermal stress Frost heave Frozen components Other:
7. High Winds F3 - EXCAVATION
8. Operator Excavation Damage (including their contractors) / Not Third Party
9. Third Party Excavation Damage (complete a-d)
a. Excavator group General Public Government Excavator other than Operator/subcontractor b. Type: Road Work Pipeline Water Electric Sewer Phone/Cable Landowner Railroad Other: c. Did operator get prior notification of excavation activity? No Yes: Date received: / / mo. / / day / / yr. Notification received from: One Call System Excavator Contractor Landowner d. Was pipeline marked? No Yes (If Yes, check applicable items i – iv) i. Temporary markings: Flags Stakes Paint ii. Permanent markings: Yes No iii. Marks were (check one) Accurate Not Accurate iv. Were marks made within required time? Yes No
F4 – OTHER OUTSIDE FORCE DAMAGE 10. Fire/Explosion as primary cause of failure => Fire/Explosion cause: Man made Natural
11. Car, truck or other vehicle not relating to excavation activity damaging pipe
12. Rupture of Previously Damaged Pipe 13. Vandalism
Form RSPA F 7100.2 ( 01-2002 ) Page 2 of 3
F5 – MATERIAL AND WELDS
Material 14. Body of Pipe => Dent Gouge Wrinkle Bend Arc Burn Other: 15. Component => Valve Fitting Vessel Extruded Outlet Other: 16. Joint => Gasket O-Ring Threads Other:
Weld 17. Butt => Pipe Fabrication Other: 18. Fillet => Branch Hot Tap Fitting Repair Sleeve Other: 19. Pipe Seam => LF ERW DSAW Seamless Flash Weld
HF ERW SAW Spiral Other:
Complete a-g if you indicate any cause in part F5.
a. Type of failure:
Construction Defect => Poor Workmanship Procedure not followed Poor Construction Procedures
Material Defect
b. Was failure due to pipe damage sustained in transportation to the construction or fabrication site? Yes No
c. Was part which leaked pressure tested before incident occurred? Yes, complete d-g No
d. Date of test: / / mo. / / day / / yr.
e. Test medium: Water Natural Gas Inert Gas Other:
f. Time held at test pressure: / / hr.
g. Estimated test pressure at point of incident: PSIG
F6 – EQUIPMENT AND OPERATIONS 20. Malfunction of Control/Relief Equipment => Valve Instrumentation Pressure Regulator Other:
21. Threads Stripped, Broken Pipe Coupling => Nipples Valve Threads Mechanical Couplings Other:
22. Ruptured or Leaking Seal/Pump Packing
23. Incorrect Operation a. Type: Inadequate Procedures Inadequate Safety Practices Failure to Follow Procedures Other:
b. Number of employees involved who failed post-incident drug test: / / Alcohol test: / /
c. Were most senior employee(s) involved qualified? Yes No d. Hours on duty: / /
F7 – OTHER 24. Miscellaneous, describe: 25. Unknown Investigation Complete Still Under Investigation (submit a supplemental report when investigation is complete)
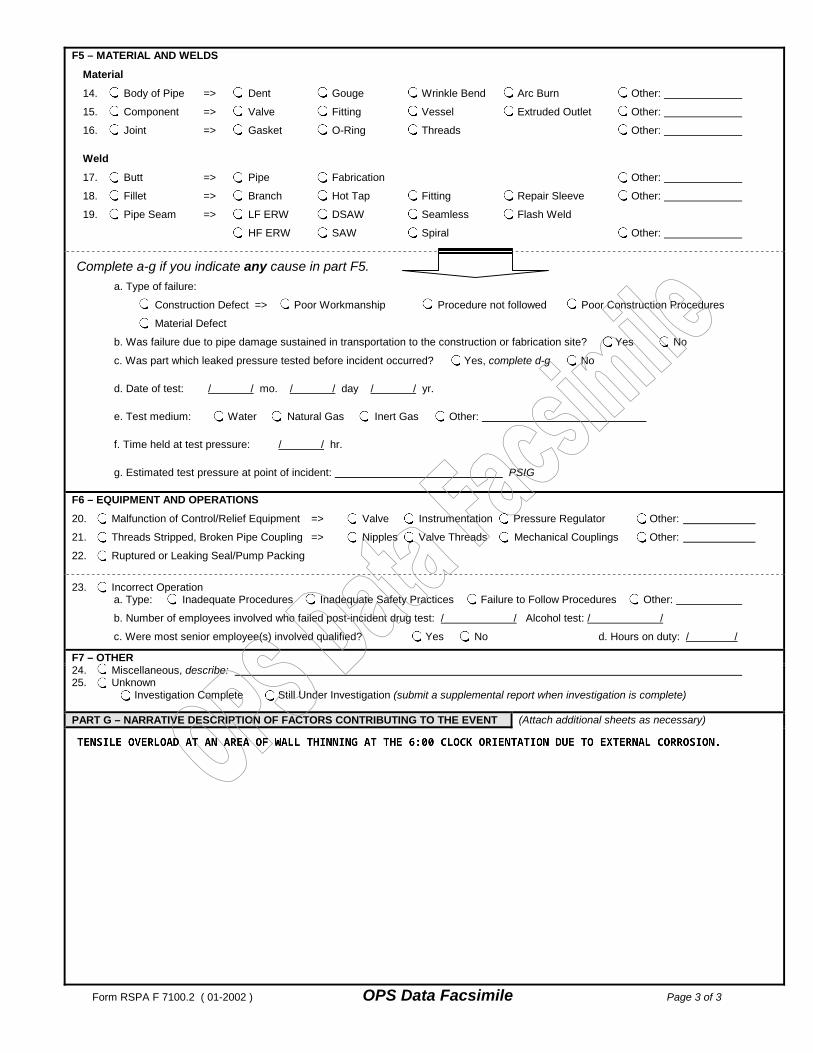
PART G – NARRATIVE DESCRIPTION OF FACTORS CONTRIBUTING TO THE EVENT (Attach additional sheets as necessary)
Form RSPA F 7100.2 ( 01-2002 ) OPS Data Facsimile Page 3 of 3

Pipeline Failure Investigation Report
- 32 - Form 11 Pipeline Failure Investigation Report (Revised 03/07/08)
Appendix C
Panhandle Failure Analysis
.
Metallurgical Analysis of 24-Inch Houstonia 200 Service Failure at MP 21.6 (8/25/08)
Panhandle Eastern Pipe Line Company, LP Final Report – 813 8385 1 October 29, 2008

CC TECHNOLOGIES, INC.
Reference to part of this report, which may lead to misinterpretation, is not permissible. Q:\EAWUS813\Anderson\2008\GREG QUICKEL\PANHANDLE EASTERN PIPE LINE CO (813 8385 1) October 22\Panhandle Final Report (813 8385 1) (October 29).doc
Metallurgical Analysis of 24-Inch Houstonia 200 Service Failure at MP 21.6 (8/25/08) for
Panhandle Eastern Pipe Line Company, L.P. 5444 Westheimer, Suite 432 Houston, TX 77056
5777 Frantz Road Dublin, Ohio 43017-1386
U.S.A.
Tel: (614) 761-1214 Fax: (614) 761-1633
www.dnv.com www.cctechnologies.com
Summary: Final Report
Prepared by: Gregory T. Quickel, M.S. Staff Engineer
Reviewed by: John Beavers, Ph.D., FNACE . Director – Failure Analysis Approved by: Patrick H. Vieth Senior VP – Integrity & Materials
Date of Issue: October 29, 2008
Project Number: 813 8385 1
No distribution without permission from the client or responsible organizational unit (however, free distribution for internal use within DNV after 3 years)
No distribution without permission from the client or responsible organizational unit
Strictly confidential
Unrestricted distribution
All copyrights reserved CC Technologies, Inc. This publication, or parts thereof, may not be reproduced or transmitted in any form or by any means, including photocopying or recording, without the prior written consent of CC Technologies, Inc.

Page ii
CC TECHNOLOGIES, INC.
Disclaimer
This report documents work performed by CC Technologies, Inc. (CC Technologies) Dublin, Ohio, for Panhandle Eastern Pipe Line Company, L.P. (Panhandle) Houston, Texas. Neither CC Technologies nor any person acting on behalf of CC Technologies:
• assumes any liability for consequences or damages resulting from the use, misuse, or reliance upon the information disclosed in this report.
• makes any warranty or representations that the use of any information, apparatus, method, or process disclosed in this report may not infringe on privately-owned rights.

Page iii
CC TECHNOLOGIES, INC.
Executive Summary
Panhandle Eastern Pipe Line Company, L.P (Panhandle) retained CC Technologies, Inc. (CC Technologies) to perform a metallurgical analysis on a section of pipe from the 24-inch diameter Houstonia 200 natural gas pipeline that failed during service. The failure occurred on August 25, 2008 near Pilot Grove (Cooper County), Missouri at milepost (MP) 21.6.
The portion of the pipeline containing the failure is comprised of 24-inch diameter by 0.281-inch wall thickness line pipe with an estimated yield strength (EYS) of 48.0 ksi that was manufactured by A.O. Smith and contains an electric flash welded (EFW) longitudinal seam. The maximum allowable operating pressure (MAOP) and normal operating pressure are 800 psig, which corresponds to 71.2% of the EYS. The operating pressure at the time and location of the failure was 790 psig, which corresponds to 70.3% of the EYS.
The pipeline was installed in 1937 and was reportedly externally coated with a bitumastic pipe wrap. The pipeline has an impressed current cathodic protection (CP) system that was installed between 1951 and 1953. CP readings taken on March 25th, 2008 in the vicinity of the failure were -4.162 V (on) and -1.320 V (off).
A hydrostatic pressure test was performed in 1955 on Segments 1031+39 to 1317+15, which encompasses the failure site.
Four segments of line pipe steel, one which contained the failure origin, were delivered to CC Technologies for analysis. The received segments consisted of: a segment that contained the upstream (U/S) girth weld and failure origin, a mating downstream (D/S) segment, the D/S arrest segment from the joint that failed, and a segment of pipe from the joint D/S of the joint that failed. The objective of the analysis was to document the factual metallurgical evidence.
The pipe segments were visually examined and photographed in the as-received condition. Scale samples were removed from the external pipe surface, at and away from a region of wall loss near the failure origin. The following was performed on the scale samples: elemental analysis using energy-dispersive spectroscopy (EDS) with a scanning electron microscope (SEM), bacteria culture inoculation using a serial dilution technique, and qualitative spot testing using 2N HCl for the presence of carbonates and/or sulfides. A grid with 1-inch by 1-inch divisions was drawn on the internal surface of the pipe near the failure origin where external wall loss was present. Wall thickness values were recorded every 1 inch (measured on the internal surface) with an ultrasonic testing (UT) gauge and/or with calipers. Calipers were used where the UT gauge could not be used, because of sharp bends in the pipe. The external surface at the wall loss region near the failure origin was cleaned with a soft bristle brush and inhibited acid. Magnetic particle inspection (MPI) was performed on the external surface at the wall loss region near the failure origin to identify any indications. Transverse cross-sections were removed from the failure origin and seam weld, mounted, polished, and etched. Light photomicrographs were taken to document the corrosion morphology and steel microstructure.

Page iv
CC TECHNOLOGIES, INC.
Executive Summary (continued)
A pipe sample for chemical analysis was removed from the joint that failed to determine the composition. Transverse pipe samples for mechanical (duplicate tensiles and Charpy V-notch impact) testing were removed from the base metal of the downstream joint.
The predicted burst pressure for the region of wall loss that contained the rupture was calculated using the RSTRENG effective area method embodied in CorLASTM. Two flaw profiles were obtained. The first flaw profile (profile 1) was obtained by using a modified river bottom method. A second flaw profile (profile 2) was constructed by measuring the wall thicknesses at the edge of the counter-clockwise fracture surface. A flow strength of the measured yield stress (MYS)+10 ksi was used for the calculation.
Below is a summary of our preliminary observations and conclusions:
• The failure occurred at a region of external wall loss from corrosion.
• The maximum depth of wall loss at the rupture surface was 0.210 inches (74.7% of wall thickness).
• Bacteria did not likely play a role in the external corrosion based on the morphology of the corrosion and the results of the bacteria culture testing.
• The morphology of the fracture surfaces suggests that the failure initiated in a ductile manner.
• The morphology of the seam weld is consistent with an EFW seam.
• The microstructure and steel composition are consistent with line pipe steel.
• The results of the tensile and Charpy testing are consistent with this vintage of line pipe steel.
• The estimated burst pressure ranged between 663 psig to 868 psig, compared to an actual failure pressure of 790 psig.

Page v
CC TECHNOLOGIES, INC.
Contents
1.0 BACKGROUND ................................................................................................................ 1
2.0 APPROACH ...................................................................................................................... 1
3.0 RESULTS AND DISCUSSION.......................................................................................... 2
3.1 Optical Examination ............................................................................................... 2
3.2 Magnetic Particle Inspection (MPI) ........................................................................ 3
3.3 Metallurgical Analysis............................................................................................. 3
3.4 Energy Dispersive Spectroscopy (EDS) ................................................................ 4
3.5 Qualitative Spot Test.............................................................................................. 4
3.6 Bacteria Culture Testing......................................................................................... 4
3.7 Mechanical Test Results ........................................................................................ 4
3.8 Chemical Analysis.................................................................................................. 5
3.9 Predicted Burst Pressure ....................................................................................... 5
4.0 CONCLUSIONS................................................................................................................ 5

Page vi
CC TECHNOLOGIES, INC.
Tables
Table 1. Summary of the results (in areas of minimal or no corrosion) of wall thickness measurements performed on the pipe segments....................................... 7
Table 2. Results of elemental analysis of scale samples removed from the external pipe surface using energy dispersive spectroscopy (EDS). ......................... 7
Table 3. Results of bacteria analysis performed on scale samples removed from the external surfaces, at and away from the region of external corrosion.................. 8
Table 4. Results of tensile tests performed on transverse samples from Pipe Segment C (D/S of failure joint). ................................................................................ 8
Table 5. Results of Charpy V-notch impact tests performed on samples removed from the base metal of Pipe Segment C. ................................................................... 9
Table 6. Results of analysis of the Charpy V-notch impact energy and percent shear plots.................................................................................................................. 9
Table 7. Results of chemical analysis of a pipe steel sample from Pipe Segment A2 (failure joint) by optical emission spectroscopy (OES) removed from the joint that ruptured. .............................................................................................. 10
Page vii
CC TECHNOLOGIES, INC.
Figures
Figure 1. Photograph of Pipe Segment A1 (internal surface) in the as-received condition................................................................................................................... 11
Figure 2. Photograph of Pipe Segment B1 in the as-received condition................................. 12
Figure 3. Photograph of Pipe Segment C in the as-received condition................................... 13
Figure 4. Photograph of Pipe Segment A2 (external surface) in the as-received condition................................................................................................................... 14
Figure 5. Photograph of the external surface of Pipe Segment A2 on the clockwise side of rupture.......................................................................................... 15
Figure 6. Photograph of the external surface of Pipe Segment A2 on the counter-clockwise side of rupture............................................................................. 16
Figure 7. Remaining wall in the region of the probable failure origin. ..................................... 17
Figure 8. Stereo light photomicrograph of a transverse cross-section removed from the rupture near the failure origin (Mount M1, 4% Nital Etchant). .................... 18
Figure 9. Stereo light photomicrograph of the rupture area indicated in Figure 8 (Mount M1, 4% Nital Etchant). ................................................................................. 19
Figure 10. Light photomicrograph of the external surface of the pipe in Mount M1 (4% Nital Etchant, area indicated in Figure 8).......................................................... 19
Figure 11. Stereo light photomicrograph of the seam weld cross-section (Mount M2, 4% Nital Etchant). ............................................................................................. 20
Figure 12. Light photomicrograph of the typical base metal microstructure from Mount M2 (4% Nital Etchant). .................................................................................. 20
Figure 13. EDS spectrum of scale that was removed from the external surface. ..................... 21
Figure 14. Plot of percent shear from Charpy V-notch tests as a function of temperature for samples removed from Pipe Segment C. ....................................... 22
Figure 15. Plot of Charpy V-notch impact energy as a function of temperature for samples removed from Pipe Segment C. ................................................................ 22
Figure 16. Flaw depth vs. length profile of the measured flaws. ............................................... 23

Final Report – 813 8385 1 Metallurgical Analysis of 24-Inch Houstonia 200 Service Failure at MP 21.6 (8/25/08)
Page 1
CC TECHNOLOGIES, INC.
1.0 BACKGROUND
Panhandle Eastern Pipe Line Company, L.P (Panhandle) retained CC Technologies, Inc. (CC Technologies) to perform a metallurgical analysis on a section of pipe from the 24-inch diameter Houstonia 200 natural gas pipeline that failed during service. The failure occurred on August 25th, 2008 near Pilot Grove (Cooper County), Missouri at milepost (MP) 21.6.
The portion of the pipeline containing the failure is comprised of 24-inch diameter by 0.281-inch wall thickness line pipe with an estimated yield strength (EYS) of 48.0 ksi that was manufactured by A.O. Smith and contains an electric flash welded (EFW) longitudinal seam. The maximum allowable operating pressure (MAOP) and normal operating pressure are 800 psig, which corresponds to 71.2% of the EYS. The operating pressure at the time and location of the failure was 790 psig, which corresponds to 70.3% of the EYS.
The pipeline was installed in 1937 and was reportedly externally coated with a bitumastic pipe wrap. The pipeline has an impressed current cathodic protection (CP) system that was installed between 1951 and 1953. CP readings taken on March 25th, 2008 in the vicinity of the failure were -4.162 V (on) and -1.320 V (off).
A hydrostatic pressure test was performed in 1955 on Segments 1031+39 to 1317+15, which encompasses the failure site.
Four segments of line pipe steel, one which contained the failure origin, were delivered to CC Technologies for analysis. The received segments consisted of a segment that contained the upstream (U/S) girth weld and failure origin, a mating downstream (D/S) segment, the D/S arrest segment from the joint that failed, and a segment of pipe from the joint D/S of the joint that failed. The objective of the analysis was to document the factual metallurgical evidence.
2.0 APPROACH
The procedures used in the analysis were in accordance with industry accepted standards. Six of the general standards governing terminology, chemical analysis, mechanical testing, and specific metallographic procedures used are as follows:
• ASTM E3, “Standard Methods of Preparation of Metallographic Specimens.”
• ASTM E7, “Standard Terminology Relating to Metallography.”
• ASTM E8, “Test Methods for Tension Testing of Metallic Materials.”
• ASTM E23, “Standard Test Methods for Notched Bar Impact Testing of Metallic Materials.”
• ASTM A751, “Standard Test Methods, Practices, and Terminology for Chemical Analysis of Steel Products.”
• ASTM G15, “Standard Terminology Relating to Corrosion and Corrosion Testing.”

Final Report – 813 8385 1 Metallurgical Analysis of 24-Inch Houstonia 200 Service Failure at MP 21.6 (8/25/08)
Page 2
CC TECHNOLOGIES, INC.
The pipe segments were visually examined and photographed in the as-received condition. Scale samples were removed from the external pipe surface, at and away from a region of wall loss near the failure origin. The following was performed on the scale samples: elemental analysis using energy-dispersive spectroscopy (EDS) with a scanning electron microscope (SEM), bacteria culture inoculation using a serial dilution technique, and qualitative spot testing using 2N HCl for the presence of carbonates and/or sulfides. A grid with 1-inch by 1-inch divisions was drawn on the internal surface of the pipe near the failure origin where external wall loss was present. Wall thickness values were recorded every 1 inch (measured on the internal surface) with an ultrasonic testing (UT) gauge and/or with calipers. Calipers were used where the UT gauge could not be used, because of sharp bends in the pipe. The external surface at the wall loss region near the failure origin was cleaned with a soft bristle brush and inhibited acid. Magnetic particle inspection (MPI) was performed on the external surface at the wall loss region near the failure origin to identify any indications. Transverse cross-sections were removed from the failure origin and seam weld, mounted, polished, and etched. Light photomicrographs were taken to document the corrosion morphology and steel microstructure. A pipe sample for chemical analysis was removed from the joint that failed to determine the composition. Transverse pipe samples for mechanical (duplicate tensiles and Charpy V-notch impact) testing were removed from the base metal of the downstream joint.
The predicted burst pressure for the region of wall loss that contained the rupture was calculated using the RSTRENG effective area method embodied in CorLASTM. Two flaw profiles were obtained. The first flaw profile (profile 1) was obtained by using a modified river bottom method. A second flaw profile (profile 2) was constructed by measuring the wall thicknesses at the edge of the counter-clockwise fracture surface. A flow strength of the measured yield stress (MYS)+10 ksi was used for the calculation.
3.0 RESULTS AND DISCUSSION
3.1 Optical Examination
Figure 1 through Figure 4 are photographs of the four as-received pipe segments. The pipe segments were designated as Pipe Segment A1, A2, B1, and C and by Panhandle personnel. Pipe Segments A1, B1, and A2 contained portions of the rupture paths. Pipe Segment C did not contain a rupture path and was used for mechanical testing. None of the pipe segments contained in-tact coating (in the as-received condition) and all segments, except for Segment C, contained localize regions of wall loss. Top-dead-center (TDC) was not indicated on the pipe segments. Flow direction was not identified on the pipe segments but is labeled on pipe segments that ruptured.
The wall thicknesses were measured at four equally spaced locations on the pipe segments. The wall thickness values for the segments are shown in Table 1. The wall thickness values were consistent with a nominal wall thickness of 0.281 inches.
Figure 1 is a photograph of the internal surface of Pipe Segment A1 is the as-received condition. The pipe segment was approximately 6.5 feet in length and was the D/S mating

Final Report – 813 8385 1 Metallurgical Analysis of 24-Inch Houstonia 200 Service Failure at MP 21.6 (8/25/08)
Page 3
CC TECHNOLOGIES, INC.
segment to Segment A2. The seam weld is located between the two rupture faces. The orientation of the chevron markings on the rupture surfaces indicated that the failure origin was U/S.
Figure 2 is a photograph of the external and internal surfaces of Pipe Segment B1 in the as-received condition. Pipe Segment B1 was approximately 11 feet in length from the joint that ruptured, and contained the D/S portion of rupture arrest. Again, the orientation of the chevron markings on the rupture surfaces indicated that the failure origin was U/S of this segment.
Figure 3 is a photograph of the external surface of Pipe Segment C in the as-received condition. The pipe segment was approximately 1.5 feet in length, was from the joint D/S of the joint that ruptured, and was intact. The diameter of the pipe segment was 23.9 inches, which is consistent with a nominal diameter of 24 inches.
Figure 4 is a photograph of Pipe Segment A2 in the as-received condition. The pipe segment was approximately 4.2 feet in length and U/S of Pipe Segment A1. Chevron markings that were located on the fracture surfaces pointed to a rupture origin in the segment. Figure 5 and Figure 6 are photographs of the external pipe surface on the clockwise and counter-clockwise side of the rupture path, respectively. Corrosion wall loss is located on the external pipe surface on adjacent surfaces. The corroded region extended 0.5 feet to 1.79 feet from the U/S girth weld and the fracture surface within the region was at a 45° angle, indicating a shear type of failure. Outside of the region, the fracture surface contained chevron marks and was predominantly perpendicular to the pipe surface.
Figure 7 shows remaining wall produced from wall thickness measurements obtained. The measurements were recorded from approximately 34 to 47 inches clockwise of the seam weld and from 6 to 25-inches D/S of the U/S girth weld. The rupture surface regions were located approximately 40 to 41 inches clockwise of the seam weld (looking D/S). This figure shows that the maximum depth of attack ranges from 0.05 to 0.1 inches and the deepest portions of the attack are at/near the fracture surface. Based on a wall thickness of 0.281 inches, the maximum depth of wall loss was 0.188 inches (66.9% of wall thickness).
3.2 Magnetic Particle Inspection (MPI)
MPI was performed on the external pipe surface in the region of wall loss associated with the failure origin. No evidence of linear indications was identified on the pipe body.
3.3 Metallurgical Analysis
Figure 8 is a photograph of the mounted transverse cross-section (Mount M1) removed near the rupture origin (see Figure 5 and Figure 6 for location). The cross-section shows significant wall loss. Figure 9 is a stereo light photomicrograph of the area indicated in Figure 8. The rupture surfaces are at approximately a 45° angle to each other and there is evidence of necking near the rupture surfaces. Both observations are indicative of a ductile overload failure. Figure 10 is a light photomicrograph showing the cross-section of Mount M1 near the external surface. The

Final Report – 813 8385 1 Metallurgical Analysis of 24-Inch Houstonia 200 Service Failure at MP 21.6 (8/25/08)
Page 4
CC TECHNOLOGIES, INC.
figure shows a banded microstructure and there was no evidence in the cross-section of morphology that is indicative of microbial influenced corrosion (MIC).
Figure 11 is a stereo light photomicrograph of the mounted cross-section that was removed from the seam weld. The morphology of the weld is consistent with an EFW seam.
Figure 12 is a light photomicrograph of the typical microstructure of the base metal from Mount M2. The microstructure consists of ferrite (white areas), pearlite (dark areas consisting of lamellae), and inclusions. This microstructure is typical for this vintage and grade of line pipe steel.
3.4 Energy Dispersive Spectroscopy (EDS)
Table 2 is a summary of the EDS results of the scale samples removed from the external pipe surface; see Figure 5 for the locations where the scale was removed. Sample A was removed from the region of wall loss and Sample B was removed away from the region of wall loss. Figure 13 shows a representative EDS spectrum. High amounts of oxygen (O) and iron (Fe), lesser amounts of sodium (Na), magnesium (Mg), aluminum (Al), silicon (Si), sulfur (S), potassium (K), calcium (Ca), manganese (Mn), and carbon (C) were found in the samples.
The Fe and O were likely in the form of an iron oxide and other elements are commonly found in soils.
3.5 Qualitative Spot Test
Spot tests for the presence of carbonates and/or sulfides were performed on scale at locations where samples were removed for elemental analysis. The deposits were positive for the presence of carbonates (bubbling) and negative for the presence of sulfides (no rotten egg odor). Carbonates are commonly associated with CP.
3.6 Bacteria Culture Testing
Scale samples were removed from the external surface, inoculated, and incubated for the presence of aerobic, anaerobic, sulfate-reducing (SRB), acid-producing (APB), and iron-related bacteria (IRB) in concentrations ranging from 1-99,999 bacteria per mL. The samples were removed from the same locations where samples were removed for elemental analysis. Table 3 shows the results of the bacteria testing for the scale samples. The scale samples removed from both locations were positive for the presence of aerobic bacteria, anaerobic bacteria, and acid-producing bacteria (APB) in very high (10,000 – 99,999 bacteria per mL) concentrations. The fact that there was no evidence of an increased concentration of the bacteria near the failure site suggests that bacteria did not play a role in the failure.
3.7 Mechanical Test Results
The results of the tensile testing for samples removed from the Segment C (D/S joint) are shown in Table 4. The MYS and ultimate tensile strength (UTS) for the pipe segment were
Final Report – 813 8385 1 Metallurgical Analysis of 24-Inch Houstonia 200 Service Failure at MP 21.6 (8/25/08)
Page 5
CC TECHNOLOGIES, INC.
determined to be 51.8-ksi and 71.5-ksi, respectively, compared to an EYS of 48.0-ksi. The failure joint was not tested since it was deformed during the failure event.
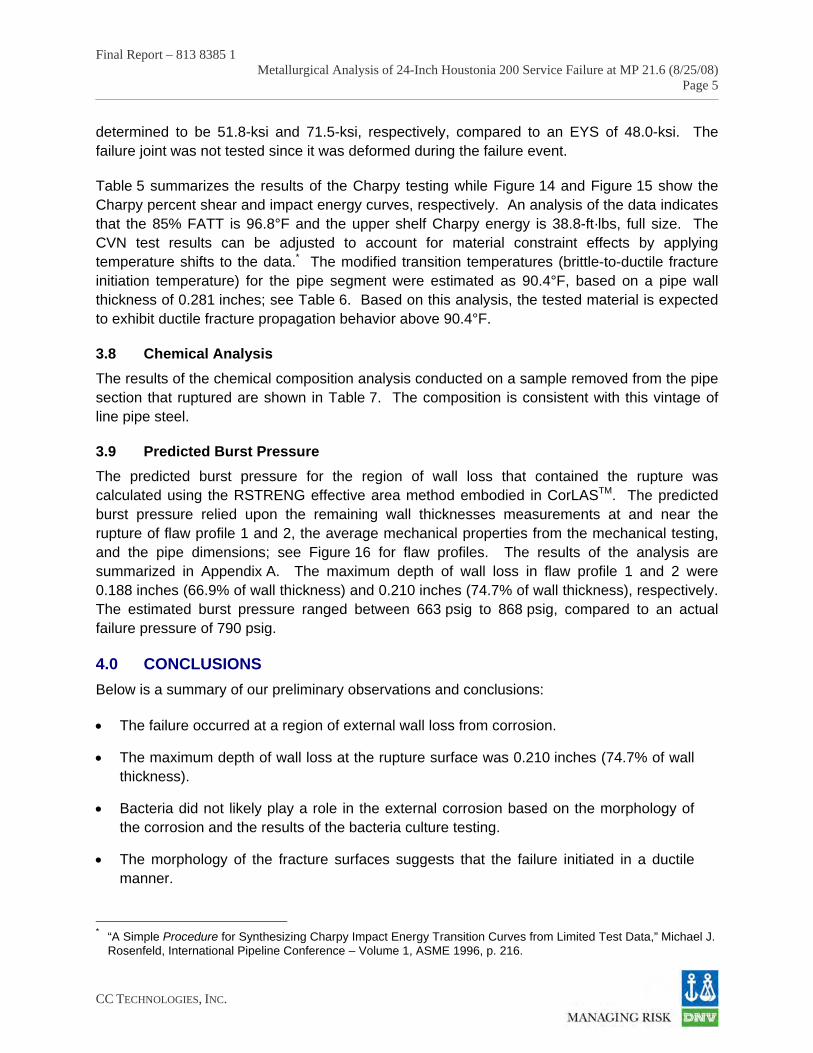
Table 5 summarizes the results of the Charpy testing while Figure 14 and Figure 15 show the Charpy percent shear and impact energy curves, respectively. An analysis of the data indicates that the 85% FATT is 96.8°F and the upper shelf Charpy energy is 38.8-ft·lbs, full size. The CVN test results can be adjusted to account for material constraint effects by applying temperature shifts to the data.* The modified transition temperatures (brittle-to-ductile fracture initiation temperature) for the pipe segment were estimated as 90.4°F, based on a pipe wall thickness of 0.281 inches; see Table 6. Based on this analysis, the tested material is expected to exhibit ductile fracture propagation behavior above 90.4°F.
3.8 Chemical Analysis
The results of the chemical composition analysis conducted on a sample removed from the pipe section that ruptured are shown in Table 7. The composition is consistent with this vintage of line pipe steel.
3.9 Predicted Burst Pressure
The predicted burst pressure for the region of wall loss that contained the rupture was calculated using the RSTRENG effective area method embodied in CorLASTM. The predicted burst pressure relied upon the remaining wall thicknesses measurements at and near the rupture of flaw profile 1 and 2, the average mechanical properties from the mechanical testing, and the pipe dimensions; see Figure 16 for flaw profiles. The results of the analysis are summarized in Appendix A. The maximum depth of wall loss in flaw profile 1 and 2 were 0.188 inches (66.9% of wall thickness) and 0.210 inches (74.7% of wall thickness), respectively. The estimated burst pressure ranged between 663 psig to 868 psig, compared to an actual failure pressure of 790 psig.
4.0 CONCLUSIONS
Below is a summary of our preliminary observations and conclusions:
• The failure occurred at a region of external wall loss from corrosion.
• The maximum depth of wall loss at the rupture surface was 0.210 inches (74.7% of wall thickness).
• Bacteria did not likely play a role in the external corrosion based on the morphology of the corrosion and the results of the bacteria culture testing.
• The morphology of the fracture surfaces suggests that the failure initiated in a ductile manner.
* “A Simple Procedure for Synthesizing Charpy Impact Energy Transition Curves from Limited Test Data,” Michael J.
Rosenfeld, International Pipeline Conference – Volume 1, ASME 1996, p. 216.

Final Report – 813 8385 1 Metallurgical Analysis of 24-Inch Houstonia 200 Service Failure at MP 21.6 (8/25/08)
Page 6
CC TECHNOLOGIES, INC.
• The morphology of the seam weld is consistent with an EFW seam.
• The microstructure and steel composition are consistent with line pipe steel.
• The results of the tensile and Charpy testing are consistent with this vintage of line pipe steel.
• The estimated burst pressure ranged between 663 psig to 868 psig, compared to an actual failure pressure of 790 psig.

Final Report – 813 8385 1 Metallurgical Analysis of 24-Inch Houstonia 200 Service Failure at MP 21.6 (8/25/08)
Page 7
CC TECHNOLOGIES, INC.
Table 1. Summary of the results (in areas of minimal or no corrosion) of wall thickness
measurements performed on the pipe segments.
Segment ID
Description Wall
Thickness 1 (inches)
Wall Thickness 2
(inches)
Wall Thickness 3
(inches)
Wall Thickness 4
(inches)
A1 D/S of and cut from
Segment A2 0.271 0.275 0.281 0.280
A2 Segment that
contained U/S girth weld and failure origin
0.282 0.281 0.278 0.275
B1 D/S arrest segment 0.279 0.276 0.280 0.280
C Segment for mechanicals
0.281 0.281 0.282 0.283
Table 2. Results of elemental analysis of scale samples removed from the external pipe surface using energy dispersive spectroscopy (EDS).
Location A, Corroded Region
(wt %)
Location B, Non-Corroded Region
(wt %)
O 26 68
Na <1 -
Mg <1 3.4
Al <1 1.6
Si <1 5.6
S <1 <1
K <1 <1
Ca 1.5 4.3
Mn 1.3 -
C - 15
Fe 69 2.1

Final Report – 813 8385 1 Metallurgical Analysis of 24-Inch Houstonia 200 Service Failure at MP 21.6 (8/25/08)
Page 8
CC TECHNOLOGIES, INC.
Table 3. Results of bacteria analysis performed on scale samples removed from the external surfaces, at and away from the region of external corrosion.
Scale from Location A Scale from Location B
Test Result Bacteria
Concentration Test Result Bacteria
Concentration
Aerobic positive Very High positive Very High
Anaerobic positive Very High positive Very High
Acid-Producing positive Very High positive Very High
Sulfate-Reducing negative - negative -
Iron-Related negative - negative -
Bacteria Concentration Key:
Very Low (1 – 9 bacteria per mL),
Low (10 – 99 bacteria per mL),
Moderate (100 – 999 bacteria per mL),
High (1,000 – 9,999 bacteria per mL),
Very High (10,000 – 99,999 bacteria per mL)
Table 4. Results of tensile tests performed on transverse samples from Pipe Segment C (D/S of failure joint).
Pipe Segment C
Yield Strength, ksi 51.8
Tensile Strength, ksi 71.5
Elongation in 2 inches, % 33.0
Reduction of Area, % 52.0

Final Report – 813 8385 1 Metallurgical Analysis of 24-Inch Houstonia 200 Service Failure at MP 21.6 (8/25/08)
Page 9
CC TECHNOLOGIES, INC.
Table 5. Results of Charpy V-notch impact tests performed on samples removed from
the base metal of Pipe Segment C.
Sample ID
Temperature, °F
Sub-size Impact Energy, ft-lbs
Full Size Impact Energy,
ft-lbs Shear,
%
Lateral Expansion,
mils
1 -30 2 3.5 0 0
2 -5 3 5.3 5 0
3 20 4 7 15 1
4 45 10 17.6 40 9
5 70 16 28.1 60 22
6 95 21 36.9 85 30
7 120 22 38.7 95 31
8 145 21.5 37.8 98 31
Table 6. Results of analysis of the Charpy V-notch impact energy and percent shear plots.
Pipe Segment C
Upper Shelf Impact Energy (Full Size), Ft-lbs 38.8
85% FATT, °F 96.8
Maxey Adjusted 85% FATT, °F 90.4

Final Report – 813 8385 1 Metallurgical Analysis of 24-Inch Houstonia 200 Service Failure at MP 21.6 (8/25/08)
Page 10
CC TECHNOLOGIES, INC.
Table 7. Results of chemical analysis of a pipe steel sample from Pipe Segment A2 (failure joint) by optical emission spectroscopy (OES) removed from the joint that ruptured.
Element Base Metal
(Wt. %)
C (Carbon) 0.287
Mn (Manganese) 1.07
P (Phosphorus) 0.011
S (Sulfur) 0.029
Si (Silicon) 0.008
Cu (Copper) 0.023
Sn (Tin) 0.002
Ni (Nickel) 0.014
Cr (Chromium) 0.015
Mo (Molybdenum) 0.000
Al (Aluminum) 0.002
V (Vanadium) 0.001
Nb (Niobium) 0.002
Zr (Zirconium) 0.001
Ti (Titanium) 0.001
B (Boron) 0.0002
Ca (Calcium) 0.0000
Co (Cobalt) 0.003
Fe (Iron) Balance
Carbon Equivalent (CEIIW) 0.47

Draft Report – 813 8385 1 Metallurgical Analysis of 24-Inch Houstonia 200 Service Failure at MP 21.6 (8/25/08)
Page 11
CC TECHNOLOGIES, INC.
Figure 1. Photograph of Pipe Segment A1 (internal surface) in the as-received condition.
Flow

Final Report – 813 8385 1 Metallurgical Analysis of 24-Inch Houstonia 200 Service Failure at MP 21.6 (8/25/08)
Page 12
CC TECHNOLOGIES, INC.
Figure 2. Photograph of Pipe Segment B1 in the as-received condition.
Flow

Final Report – 813 8385 1 Metallurgical Analysis of 24-Inch Houstonia 200 Service Failure at MP 21.6 (8/25/08)
Page 13
CC TECHNOLOGIES, INC.
Figure 3. Photograph of Pipe Segment C in the as-received condition.

Final Report – 813 8385 1 Metallurgical Analysis of 24-Inch Houstonia 200 Service Failure at MP 21.6 (8/25/08)
Page 14
CC TECHNOLOGIES, INC.
Figure 4. Photograph of Pipe Segment A2 (external surface) in the as-received condition.
Flow
U/S girth weld
Seam weld
Mount M2
Chemistry sample

Final Report – 813 8385 1 Metallurgical Analysis of 24-Inch Houstonia 200 Service Failure at MP 21.6 (8/25/08)
Page 15
CC TECHNOLOGIES, INC.
Figure 5. Photograph of the external surface of Pipe Segment A2 on the clockwise side of rupture.
12 inches from U/S girth weld
Wall loss
Scale removed for bacteria testing and EDS, Location A
Scale removed for bacteria testing and EDS, Location B
Mating portion of Mount M1
Axial direction

Final Report – 813 8385 1 Metallurgical Analysis of 24-Inch Houstonia 200 Service Failure at MP 21.6 (8/25/08)
Page 16
CC TECHNOLOGIES, INC.
Figure 6. Photograph of the external surface of Pipe Segment A2 on the counter-clockwise side of rupture.
12 inches from U/S girth weld Wall loss
Mating portion of Mount M1
Axial direction

Final Report – 813 8385 1 Metallurgical Analysis of 24-Inch Houstonia 200 Service Failure at MP 21.6 (8/25/08)
Page 17
CC TECHNOLOGIES, INC.
6 7 8 9 10 11 12 13 14 15 16 17 18 19 20 21 22 23 24 25
34
35
36
37
38
39
40
41
42
43
44
45
46
47
Remaining Wall (in)
Distance from U/S Girth Weld (in)
Dis
tance C
lock
wise
of S
ea
m W
eld L
oo
king
D/S
0.25-0.3
0.2-0.25
0.15-0.2
0.1-0.15
0.05-0.1
0-0.05
Fracture
Face Region
Figure 7. Remaining wall in the region of the probable failure origin.
Deepest region measured
Approximate fracture path

Final Report – 813 8385 1 Metallurgical Analysis of 24-Inch Houstonia 200 Service Failure at MP 21.6 (8/25/08)
Page 18
CC TECHNOLOGIES, INC.
Figure 8. Stereo light photomicrograph of a transverse cross-section removed from the rupture near the failure origin (Mount M1, 4% Nital Etchant).
OD ID
Figure 9 Figure 10

Final Report – 813 8385 1 Metallurgical Analysis of 24-Inch Houstonia 200 Service Failure at MP 21.6 (8/25/08)
Page 19
CC TECHNOLOGIES, INC.
Figure 9. Stereo light photomicrograph of the rupture area indicated in Figure 8 (Mount M1, 4% Nital Etchant).
Figure 10. Light photomicrograph of the external surface of the pipe in Mount M1 (4% Nital Etchant, area indicated in Figure 8).
OD ID

Final Report – 813 8385 1 Metallurgical Analysis of 24-Inch Houstonia 200 Service Failure at MP 21.6 (8/25/08)
Page 20
CC TECHNOLOGIES, INC.
Figure 11. Stereo light photomicrograph of the seam weld cross-section (Mount M2, 4% Nital Etchant).
Figure 12. Light photomicrograph of the typical base metal microstructure from Mount M2 (4% Nital Etchant).
Pearlite
Flow lines
Ferrite
Inclusion
OD ID

Final Report – 813 8385 1 Metallurgical Analysis of 24-Inch Houstonia 200 Service Failure at MP 21.6 (8/25/08)
Page 21
CC TECHNOLOGIES, INC.
1 2 3 4 5 6 7 8 9 10keV
0
20
40
60
80
100
cps/eV
Fe Fe Mn Mn
Ca Ca
S
O
Al Si Mg
K Na
Figure 13. EDS spectrum of scale that was removed from the external surface.
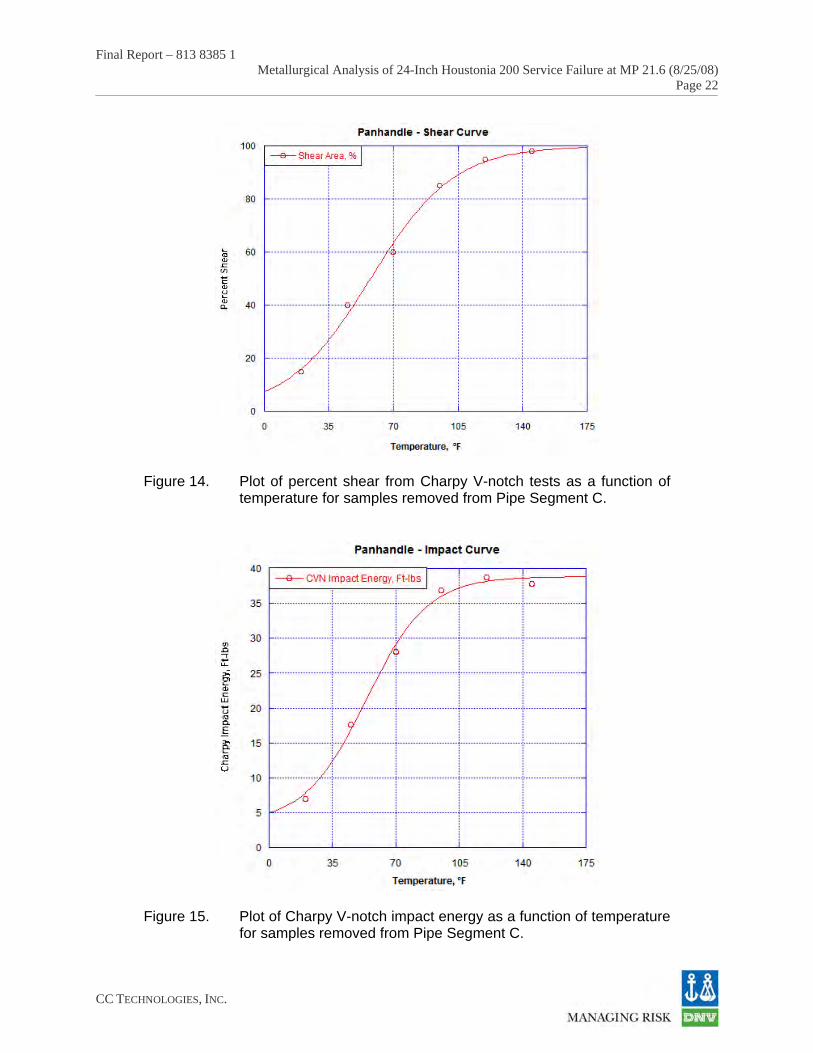
Final Report – 813 8385 1 Metallurgical Analysis of 24-Inch Houstonia 200 Service Failure at MP 21.6 (8/25/08)
Page 22
CC TECHNOLOGIES, INC.
Figure 14. Plot of percent shear from Charpy V-notch tests as a function of temperature for samples removed from Pipe Segment C.
Figure 15. Plot of Charpy V-notch impact energy as a function of temperature for samples removed from Pipe Segment C.

Final Report – 813 8385 1 Metallurgical Analysis of 24-Inch Houstonia 200 Service Failure at MP 21.6 (8/25/08)
Page 23
CC TECHNOLOGIES, INC.
0.000
0.050
0.100
0.150
0.200
0.250
6.0 8.0 10.0 12.0 14.0 16.0 18.0 20.0 22.0 24.0 26.0
Distance from U/S girth weld (in)F
law
dep
th (
inch
es)
Flaw Profile One
Flaw Profile Two
100% wallthickness(wt)0.281 nominal
0% wt
25% wt
50% wt
75% wt
Figure 16. Flaw depth vs. length profile of the measured flaws.

CC TECHNOLOGIES, INC.
APPENDIX A
DESCRIPTION OF CORLASTM

Final Report – 813 8385 1 Metallurgical Analysis of 24-Inch Houstonia 200 Service Failure at MP 21.6 (8/25/08)
Page A-1
CC TECHNOLOGIES, INC.
APPENDIX A
Description of CorLAS™
The CorLAS™ computer program was developed by CC Technologies to evaluate crack-like flaws in pipelines based on inelastic fracture mechanics. Using the effective area of the actual, measured crack length-depth profile, an equivalent semi-elliptical surface flaw is modeled and used to compute the effective stress and the applied value of J for internal pressure loading.
The effective stress and applied J are then compared with the flow strength ( fsσ ) and fracture
toughness (JC), respectively, to predict the failure pressure.
The program also contains a similar inelastic fracture mechanics analysis for through-wall flaws. The fracture toughness of the steel can be estimated from Charpy data or measured by means of a JIC test. In the most recent version of CorLAS™, the fracture toughness analysis automatically checks for plastic instability and only the fracture toughness curve needs to be considered for crack-like flaws. The actual tensile and Charpy properties of the pipe joint, measured from the samples removed, can be used for the critical leak/rupture length calculation.
***************************************************************************** Houstonia 200 :SEMI-ELLIPTICAL FLAW PROFILE EST YS 48 ksi UTS, psi = 71500. YS, psi = 51750. FS, psi = 61750. E, ksi = 29500. nexp = 0.110 Jc, lb/in = 1935. Thin-wall (OD) formula for hoop stress Tmat = 62.5 OD, in. = 24.00 Wall Thickness, in. = 0.281 SUMMARY OF RESULTS FOR EFFECTIVE-AREA METHOD Flaw: Start, in. = 4.000 Length, in. = 9.000 Area, in.^2 = 1.283 Depth,in.: Maximum = 0.188 Equivalent Flaw = 0.182 Failure Stress, psi = 37048. Failure Pressure, psig = 867.53 ******** Input Flaw Profile Data ********* ---------- ----------
Length, in. Depth, in.
---------- ---------- 0 0 1 0.052 2 0.061 3 0.059 4 0.138 5 0.132 6 0.188 7 0.158 8 0.155

Final Report – 813 8385 1 Metallurgical Analysis of 24-Inch Houstonia 200 Service Failure at MP 21.6 (8/25/08)
Page A-2
CC TECHNOLOGIES, INC.
9 0.086 10 0.126 11 0.145 12 0.173 13 0.102 15 0.071 16 0.079 17 0.096 18 0.03 19 0.029 20 0.021 21 0
---------- ---------- ******** Effective Flaw Results ********* ---------- ---------- ---------- ---------- ---------- ---------- ---------- ----------
Flaw Flaw EffectiveFlow Failure Japplied, Failure
i Start, in.
Length, in.
Area, in.^2
Stress, psi lb/in Tapplied Pressure, psig
---------- ---------- ---------- ---------- ---------- ---------- ---------- ---------- THOSE BELOW ARE FOR FLOW-STRENGTH FAILURE CRITERION
1 4 9 1.283 37048 4278.6 1794.1 867.5 ---------- ---------- ---------- ---------- ---------- ---------- ---------- ---------- ***************************************************************************** Houstonia 200 :SEMI-ELLIPTICAL FLAW PROFILE EST YS 48 ksi UTS, psi = 71500. YS, psi = 51750. FS, psi = 61750. E, ksi = 29500. nexp = 0.110 Jc, lb/in = 1935. Thin-wall (OD) formula for hoop stress Tmat = 62.5 OD, in. = 24.00 Wall Thickness, in. = 0.281 SUMMARY OF RESULTS FOR EFFECTIVE-AREA METHOD Flaw: Start, in. = 5.000 Length, in. = 8.000 Area, in.^2 = 1.480 Depth,in.: Maximum = 0.210 Equivalent Flaw = 0.236 Failure Stress, psi = 28328. Failure Pressure, psig = 663.34 ******** Input Flaw Profile Data ********* ---------- ----------
Length, in. Depth, in.
---------- ---------- 0 0 1 0.094 2 0.119 3 0.139 4 0.131 5 0.126

Final Report – 813 8385 1 Metallurgical Analysis of 24-Inch Houstonia 200 Service Failure at MP 21.6 (8/25/08)
Page A-3
CC TECHNOLOGIES, INC.
6 0.21 7 0.201 8 0.192 9 0.179
10 0.188 12 0.189 13 0.139 15 0.076 16 0.071 17 0.051 18 0.054 19 0.051 20 0.032 21 0
---------- ---------- ******** Effective Flaw Results ********* ---------- ---------- ---------- ---------- ---------- ---------- ---------- ----------
Flaw Flaw EffectiveFlow Failure Japplied, Failure
i Start, in.
Length, in.
Area, in.^2
Stress, psi lb/in Tapplied Pressure, psig
---------- ---------- ---------- ---------- ---------- ---------- ---------- ---------- THOSE BELOW ARE FOR FLOW-STRENGTH FAILURE CRITERION
1 5 8 1.48 28328 10025.2 6519.7 663.3 ---------- ---------- ---------- ---------- ---------- ---------- ---------- ----------

CC Technologies / Det Norske Veritas CCT/DNV is a leading provider of technology in managing corrosion and materials risks. As one of the few firms to combine practical engineering solutions with state-of-the-art research and testing, we can offer our clients innovative, cost effective solutions. We specialize in engineering, research and testing for corrosion control and monitoring, fitness-for-service, pipeline/plant integrity analysis, materials evaluation and selection, failure analysis, litigation support, management systems approaches and instrumentation and software design and development.

Pipeline Failure Investigation Report
- 33 - Form 11 Pipeline Failure Investigation Report (Revised 03/07/08)
Appendix D
Panhandle Close Interval Survey