
Pingmesh: A Large-Scale System for Data Center Network Latency ...
14
Pingmesh: A Large-Scale System for Data Center Network Latency Measurement and Analysis * Chuanxiong Guo, Lihua Yuan, Dong Xiang, Yingnong Dang, Ray Huang, Dave Maltz, Zhaoyi Liu, Vin Wang, Bin Pang, Hua Chen, Zhi-Wei Lin, Varugis Kurien † Microsoft, † Midfin Systems {chguo, lyuan, dxiang, yidang, rayhuang, dmaltz, zhaoyil, vinwang, bipang, stchen, linzw}@microsoft.com, vkurien@midfinsystems.com ABSTRACT Can we get network latency between any two servers at any time in large-scale data center networks? The collected latency data can then be used to address a series of challenges: telling if an application perceived latency issue is caused by the network or not, defin- ing and tracking network service level agreement (SLA), and automatic network troubleshooting. We have developed the Pingmesh system for large- scale data center network latency measurement and anal- ysis to answer the above question affirmatively. Pingmesh has been running in Microsoft data centers for more than four years, and it collects tens of terabytes of la- tency data per day. Pingmesh is widely used by not only network software developers and engineers, but also ap- plication and service developers and operators. CCS Concepts •Networks → Network measurement; Cloud com- puting; Network monitoring; •Computer systems organization → Cloud computing; Keywords Data center networking; Network troubleshooting; Silent packet drops 1. INTRODUCTION In today’s data centers there are hundreds of thou- sands of servers. These servers are connected via net- * This work was performed when Varugis Kurien was with Microsoft. Permission to make digital or hard copies of all or part of this work for personal or classroom use is granted without fee provided that copies are not made or distributed for profit or commercial advantage and that copies bear this notice and the full citation on the first page. Copyrights for components of this work owned by others than ACM must be honored. Abstracting with credit is per- mitted. To copy otherwise, or republish, to post on servers or to redistribute to lists, requires prior specific permission and/or a fee. Request permissions from [email protected]. SIGCOMM ’15, August 17 - 21, 2015, London, United Kingdom c 2015 ACM. ISBN 978-1-4503-3542-3/15/08. . . $15.00 DOI: http://dx.doi.org/10.1145/2785956.2787496 work interface cards (NICs), switches and routers, ca- bles and fibers, which form large-scale intra and inter data center networks. The scale of the data center net- works (DCNs) is growing even larger due to the rapid development of cloud computing. On top of the phys- ical data center infrastructure, various large-scale, dis- tributed services are built, e.g., Search [5], distributed file systems [17] and storage [7], MapReduce [11]. These distributed services are large and evolving soft- ware systems with many components and have complex dependencies. All of these services are distributed and many of their components need to interact via the net- work either within a data center or across different data centers. In such large systems, software and hardware failures are the norm rather than the exception. As a result, the network team faces several challenges. The first challenge is to determine if an issue is a network issue or not. Due to the distributed systems nature, many failures show as “network” problems, e.g., some components can only be reached intermittently, or the end-to-end latency shows a sudden increase at the 99 th percentile, the network throughput degrades from 20MB/s per server to less than 5MB/s. Our experience showed that about 50% of these “network” problems are not caused by the network. However it is not easy to tell if a “network” problem is indeed caused by network failures or not. The second challenge is to define and track network service level agreements (SLAs). Many services need the network to provide certain performance guarantees. For example, a Search query may touch thousands of servers and the performance of a Search query is de- termined by the last response from the slowest server. These services are sensitive to network latency and packet drops and they care about the network SLA. Network SLA needs to be measured and tracked individually for different services since they may use different set of servers and different part of the network. This be- comes a challenging task because of the huge number of services and customers in the network. The third challenge is network troubleshooting. When network SLAs are broken due to various network fail- 139
-
Upload
duongkhanh -
Category
Documents
-
view
218 -
download
0
Transcript of Pingmesh: A Large-Scale System for Data Center Network Latency ...

Pingmesh: A Large-Scale System for Data CenterNetwork Latency Measurement and Analysis∗
Chuanxiong Guo, Lihua Yuan, Dong Xiang, Yingnong Dang, Ray Huang, Dave Maltz,Zhaoyi Liu, Vin Wang, Bin Pang, Hua Chen, Zhi-Wei Lin, Varugis Kurien†
Microsoft, †Midfin Systems{chguo, lyuan, dxiang, yidang, rayhuang, dmaltz, zhaoyil, vinwang, bipang, stchen,
linzw}@microsoft.com, [email protected]
ABSTRACTCan we get network latency between any two serversat any time in large-scale data center networks? Thecollected latency data can then be used to address aseries of challenges: telling if an application perceivedlatency issue is caused by the network or not, defin-ing and tracking network service level agreement (SLA),and automatic network troubleshooting.
We have developed the Pingmesh system for large-scale data center network latency measurement and anal-ysis to answer the above question affirmatively. Pingmeshhas been running in Microsoft data centers for morethan four years, and it collects tens of terabytes of la-tency data per day. Pingmesh is widely used by not onlynetwork software developers and engineers, but also ap-plication and service developers and operators.
CCS Concepts•Networks→Network measurement; Cloud com-puting; Network monitoring; •Computer systemsorganization → Cloud computing;
KeywordsData center networking; Network troubleshooting; Silentpacket drops
1. INTRODUCTIONIn today’s data centers there are hundreds of thou-
sands of servers. These servers are connected via net-∗This work was performed when Varugis Kurien waswith Microsoft.
Permission to make digital or hard copies of all or part of this work for personalor classroom use is granted without fee provided that copies are not made ordistributed for profit or commercial advantage and that copies bear this noticeand the full citation on the first page. Copyrights for components of this workowned by others than ACM must be honored. Abstracting with credit is per-mitted. To copy otherwise, or republish, to post on servers or to redistribute tolists, requires prior specific permission and/or a fee. Request permissions [email protected].
SIGCOMM ’15, August 17 - 21, 2015, London, United Kingdomc© 2015 ACM. ISBN 978-1-4503-3542-3/15/08. . . $15.00
DOI: http://dx.doi.org/10.1145/2785956.2787496
work interface cards (NICs), switches and routers, ca-bles and fibers, which form large-scale intra and interdata center networks. The scale of the data center net-works (DCNs) is growing even larger due to the rapiddevelopment of cloud computing. On top of the phys-ical data center infrastructure, various large-scale, dis-tributed services are built, e.g., Search [5], distributedfile systems [17] and storage [7], MapReduce [11].
These distributed services are large and evolving soft-ware systems with many components and have complexdependencies. All of these services are distributed andmany of their components need to interact via the net-work either within a data center or across different datacenters. In such large systems, software and hardwarefailures are the norm rather than the exception. As aresult, the network team faces several challenges.
The first challenge is to determine if an issue is anetwork issue or not. Due to the distributed systemsnature, many failures show as “network” problems, e.g.,some components can only be reached intermittently, orthe end-to-end latency shows a sudden increase at the99th percentile, the network throughput degrades from20MB/s per server to less than 5MB/s. Our experienceshowed that about 50% of these “network” problems arenot caused by the network. However it is not easy totell if a “network” problem is indeed caused by networkfailures or not.
The second challenge is to define and track networkservice level agreements (SLAs). Many services needthe network to provide certain performance guarantees.For example, a Search query may touch thousands ofservers and the performance of a Search query is de-termined by the last response from the slowest server.These services are sensitive to network latency and packetdrops and they care about the network SLA. NetworkSLA needs to be measured and tracked individuallyfor different services since they may use different setof servers and different part of the network. This be-comes a challenging task because of the huge number ofservices and customers in the network.
The third challenge is network troubleshooting. Whennetwork SLAs are broken due to various network fail-
139

ures, “live-site” incidents happen. A live-site incident isany event that results in an impact to the customers,partners or revenue. Live-site incidents need to be de-tected, mitigated, and resolved as soon as possible. Butdata center networks have hundreds of thousands to mil-lions of servers, hundreds of thousands of switches, andmillions of cables and fibers. Thus detecting where theproblem is located is a hard problem.
To address the above challenges, we have designedand implemented Pingmesh, a large-scale system fordata center network latency measurement and analy-sis. Pingmesh leverages all the servers to launch TCPor HTTP pings to provide the maximum latency mea-surement coverage. Pingmesh forms multiple levels ofcomplete graphs. Within a data center, Pingmesh letsthe servers within a rack form a complete graph andalso uses the top-of-rack (ToR) switches as virtual nodesand let them form a second complete graph. Acrossdata centers, Pingmesh forms a third complete graph bytreating each data center as a virtual node. The calcula-tion of the complete graphs and related ping parametersare controlled by a central Pingmesh Controller.
The measured latency data are collected and stored,aggregated and analyzed by a data storage and analy-sis pipeline. From the latency data, network SLAs aredefined and tracked at both the macro level (i.e., datacenter level) and the micro level (e.g., per-server andper-rack levels). The network SLAs for all the servicesand applications are calculated by mapping the servicesand applications to the servers they use.
Pingmesh has been running in tens of globally dis-tributed data centers of Microsoft for four years. Itproduces 24 terabytes of data and more than 200 bil-lion probes per day. Because of the universal availabilityof the Pingmesh data, answering if a live-site incidentis because of the network becomes easier: If Pingmeshdata does not indicate a network problem, then the live-site incident is not caused by the network.
Pingmesh is heavily used for network troubleshootingto locate where the problem is. By visualization and au-tomatic pattern detection, we are able to answer whenand where packet drops and/or latency increases hap-pen, identify silent switch packet drops and black-holesin the network. The results produced by Pingmesh isalso used by application developers and service opera-tors for better server selection by considering networklatency and packet drop rate.
This paper makes the following contributions: Weshow the feasibility of building a large-scale network la-tency measurement and analysis system by designingand implementing Pingmesh. By letting every serverparticipate, we provide latency data for all the serversall the time. We show that Pingmesh helps us better un-derstand data center networks by defining and trackingnetwork SLA at both macro and micro scopes, and thatPingmesh helps reveal and locate switch packet dropsincluding packet black-holes and silent random packetdrops, which were less understood previously.
2. BACKGROUND
2.1 Data center networksData center networks connect servers with high speed
and provide high server-to-server bandwidth. Today’slarge data center networks are built from commodityEthernet switches and routers [1, 12, 2].
Figure 1 shows a typical data center network struc-ture. The network has two parts: intra data center(Intra-DC) network and inter data center (Inter-DC)network. The intra-DC network is typically a Clos net-work of several tiers similar to the network describedin [1, 12, 2]. At the first tier, tens of servers (e.g., 40)use 10GbE or 40GbE Ethernet NICs to connect to atop-of-rack (ToR) switch and form a Pod. Tens of ToRswitches (e.g., 20) are then connected to a second tierof Leaf switches (e.g., 2-8). These servers and ToR andLeaf switches form a Podset. Multiple Podsets thenconnect to a third tier of Spine switches (tens to hun-dreds). Using existing Ethernet switches, an intra-DCnetwork can connect tens of thousands or more serverswith high network capacity.
One nice property of the intra-DC network is thatmultiple Leaf and Spine switches provide a multi-pathnetwork with redundancy. ECMP (equal cost multi-path) is used to load-balance traffic across all the paths.ECMP uses the hash value of the TCP/UDP five-tuplefor next hop selection. As a result, the exact path ofa TCP connection is unknown at the server side evenif the five-tuple of the connection is known. For thisreason, locating a faulty Spine switch is not easy.
The inter-DC network is to interconnect the intra-DCnetworks and to connect the inter-DC networks to theInternet. The inter-DC network uses high-speed, longhaul fibers to connect data centers networks at differentgeolocations. Software defined networking (SWAN [13],B4 [16]) are further introduced for better wide area net-work traffic engineering.
Our data center network is a large, sophisticated dis-tributed systems. It is composed of hundreds of thou-sands of servers, tens of thousands switches and routers,and millions of cables and fibers. It is managed by Au-topilot [20], our home-grown data center managementsoftware stack, and the switches and NICs run soft-ware and firmware provided by different switch and NICproviders. The applications run on top of the networkmay introduce complex traffic patterns.
2.2 Network latency and packet dropsIn this paper we use the term “network latency” from
application’s point of view. When an application A ata server sends a message to an application B at a peerserver, the network latency is defined as the time in-terval from the time A sends the message to the timeB receives the message. In practice we measure round-trip-time (RTT) since RTT measurement does not needto synchronize the server clocks.
140

Inter-DC network
DC1
DC2 DC3
Spine
Leaf
ToR
Podset
Pod
Servers
Intra-DC
network
Figure 1: Data center network structure.
RTT is composed of application processing latency,OS kernel TCP/IP stack and driver processing latency,NIC introduced latency (e.g., DMA operations, inter-rupt modulation) [22], packet transmission delay, prop-agation delay, and queuing delay introduced by packetbuffering at the switches along the path.
One may argue the latencies introduced by applica-tions and kernel stack are not really from the network.In practice, our experiences have taught us that ourcustomers and service developers do not care. Once alatency problem is observed, it is usually called a “net-work” problem. It is the responsibility of the networkteam to show if the problem is indeed a network prob-lem, and if it is, mitigate and root-cause the problem.
User perceived latency may increase due to variousreasons, e.g., queuing delay due to network congestion,busy server CPU, application bugs, network routingissues, etc. We also note that packet drops increaseuser perceived latency, since dropped packets need tobe retransmitted. Packet drops may happen at differ-ent places due to various reasons, e.g., fiber FCS (framecheck sequence) errors, switching ASIC defects, switchfabric flaw, switch software bug, NIC configuration is-sue, network congestions, etc. We have seen all thesetypes of issues in our production networks.
2.3 Data center management and data pro-cessing systems
Next we introduce Autopilot [20] and Cosmos andSCOPE [15]. Data centers are managed by centralizeddata center management systems, e.g., Autopilot [20] orBorg [23]. These management systems provide frame-works on how resources including physical servers aremanaged, how services are deployed, scheduled, moni-tored and managed. Pingmesh is built within the frame-work of Autopilot.
Autopilot is Microsoft’s software stack for automaticdata center management. Its philosophy is to run soft-ware to automate all data center management tasks,including failure recovery, with as minimal human in-volvement as possible. Using the Autopilot terminol-ogy, a cluster, which is a set of servers connected bya local data center network, is managed by an Au-topilot environment. An Autopilot environment has
a set of Autopilot services including Device Manager(DM), which manages the machine state, DeploymentService (DS) which does service deployment for bothAutopilot and various applications, Provisioning Ser-vice (PS) which installs Server OS images, WatchdogService (WS) which monitors and reports the healthstatus of various hardware and software, Repair Service(RS) which performs repair action by taking commandsfrom DM, etc.
Autopilot provides a shared service mode. A sharedservice is a piece of code that runs on every autopilotmanaged server. For example, a Service Manager is ashared service that manages the life-cycle and resourceusage of other applications, a Perfcounter Collector is ashared service that collects the local perf counters andthen uploads the counters to Autopilot. Shared ser-vices must be light-weight with low CPU, memory, andbandwidth resource usage, and they need to be reliablewithout resource leakage and crashes.
Pingmesh uses our home-grown data storage and anal-ysis system, Cosmos/SCOPE, for latency data storageand analysis. Cosmos is Microsoft’s BigData systemsimilar to Hadoop [3] which provides a distributed filesystem like GFS [17] and MapReduce [11]. Files in Cos-mos are append-only and a file is split into multiple‘extents’ and an extent is stored in multiple servers toprovide high reliability. A Cosmos cluster may havetens of thousands of servers or more, and gives usersalmost ‘infinite’ storage space.
SCOPE [15] is a declarative and extensible scriptinglanguage, which is built on top of Cosmos, to analyzemassive data sets. SCOPE is designed to be easy touse. It enables users to focus on their data insteadof the underlying storage and network infrastructure.Users only need to write scripts similar to SQL withoutworrying about parallel execution, data partition, andfailure handling. All these complexities are handled bySCOPE and Cosmos.
3. DESIGN AND IMPLEMENTATION
3.1 Design goalThe goal of Pingmesh is to build a network latency
measurement and analysis system to address the chal-lenges we have described in Section 1. Pingmesh needsto be always-on and be able to provide network latencydata for all the servers. It needs to be always on be-cause we need to track the network status all the time.It needs to produce network latency data for all theservers because the maximum possible network latencydata coverage is essential for us to better understand,manage, and troubleshoot our network infrastructure.
From the beginning, we differentiated Pingmesh fromvarious public and proprietary network tools (e.g., tracer-oute, TcpPing, etc.). We realized that network tools donot work for us because of the following reasons. First,these tools are not always-on and they only produce
141
Pingmesh agent
Pingmeshgenerator
Pinglist.xml
Network graph
log
vip
Pingmesh agent
log
Servers
Pingmesh Controller
Web service
Cosmos Store
SCOPE Jobs
Database
Visuali-zation
Tcp/Http
probings
Data Storage and Analysis
(DSA)
Pingmesh Agent
Alert
vip
Perfcounter Aggregator
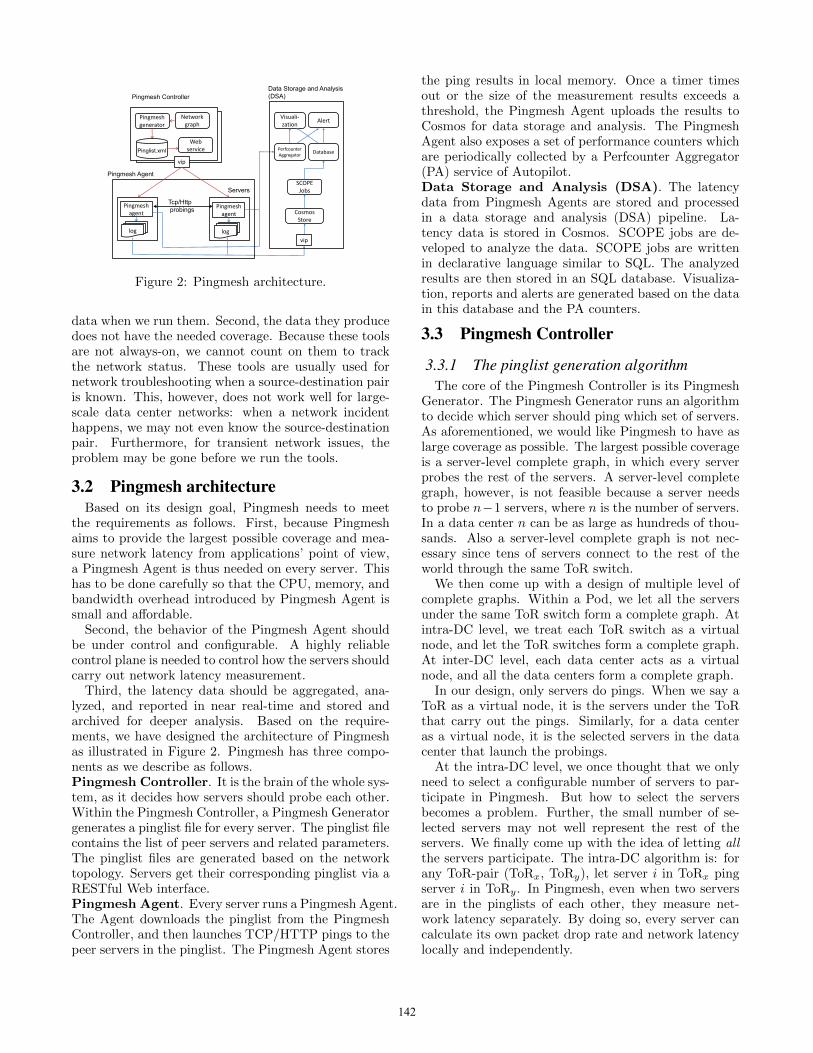
Figure 2: Pingmesh architecture.
data when we run them. Second, the data they producedoes not have the needed coverage. Because these toolsare not always-on, we cannot count on them to trackthe network status. These tools are usually used fornetwork troubleshooting when a source-destination pairis known. This, however, does not work well for large-scale data center networks: when a network incidenthappens, we may not even know the source-destinationpair. Furthermore, for transient network issues, theproblem may be gone before we run the tools.
3.2 Pingmesh architectureBased on its design goal, Pingmesh needs to meet
the requirements as follows. First, because Pingmeshaims to provide the largest possible coverage and mea-sure network latency from applications’ point of view,a Pingmesh Agent is thus needed on every server. Thishas to be done carefully so that the CPU, memory, andbandwidth overhead introduced by Pingmesh Agent issmall and affordable.
Second, the behavior of the Pingmesh Agent shouldbe under control and configurable. A highly reliablecontrol plane is needed to control how the servers shouldcarry out network latency measurement.
Third, the latency data should be aggregated, ana-lyzed, and reported in near real-time and stored andarchived for deeper analysis. Based on the require-ments, we have designed the architecture of Pingmeshas illustrated in Figure 2. Pingmesh has three compo-nents as we describe as follows.Pingmesh Controller. It is the brain of the whole sys-tem, as it decides how servers should probe each other.Within the Pingmesh Controller, a Pingmesh Generatorgenerates a pinglist file for every server. The pinglist filecontains the list of peer servers and related parameters.The pinglist files are generated based on the networktopology. Servers get their corresponding pinglist via aRESTful Web interface.Pingmesh Agent. Every server runs a Pingmesh Agent.The Agent downloads the pinglist from the PingmeshController, and then launches TCP/HTTP pings to thepeer servers in the pinglist. The Pingmesh Agent stores
the ping results in local memory. Once a timer timesout or the size of the measurement results exceeds athreshold, the Pingmesh Agent uploads the results toCosmos for data storage and analysis. The PingmeshAgent also exposes a set of performance counters whichare periodically collected by a Perfcounter Aggregator(PA) service of Autopilot.Data Storage and Analysis (DSA). The latencydata from Pingmesh Agents are stored and processedin a data storage and analysis (DSA) pipeline. La-tency data is stored in Cosmos. SCOPE jobs are de-veloped to analyze the data. SCOPE jobs are writtenin declarative language similar to SQL. The analyzedresults are then stored in an SQL database. Visualiza-tion, reports and alerts are generated based on the datain this database and the PA counters.
3.3 Pingmesh Controller
3.3.1 The pinglist generation algorithmThe core of the Pingmesh Controller is its Pingmesh
Generator. The Pingmesh Generator runs an algorithmto decide which server should ping which set of servers.As aforementioned, we would like Pingmesh to have aslarge coverage as possible. The largest possible coverageis a server-level complete graph, in which every serverprobes the rest of the servers. A server-level completegraph, however, is not feasible because a server needsto probe n−1 servers, where n is the number of servers.In a data center n can be as large as hundreds of thou-sands. Also a server-level complete graph is not nec-essary since tens of servers connect to the rest of theworld through the same ToR switch.
We then come up with a design of multiple level ofcomplete graphs. Within a Pod, we let all the serversunder the same ToR switch form a complete graph. Atintra-DC level, we treat each ToR switch as a virtualnode, and let the ToR switches form a complete graph.At inter-DC level, each data center acts as a virtualnode, and all the data centers form a complete graph.
In our design, only servers do pings. When we say aToR as a virtual node, it is the servers under the ToRthat carry out the pings. Similarly, for a data centeras a virtual node, it is the selected servers in the datacenter that launch the probings.
At the intra-DC level, we once thought that we onlyneed to select a configurable number of servers to par-ticipate in Pingmesh. But how to select the serversbecomes a problem. Further, the small number of se-lected servers may not well represent the rest of theservers. We finally come up with the idea of letting allthe servers participate. The intra-DC algorithm is: forany ToR-pair (ToRx, ToRy), let server i in ToRx pingserver i in ToRy. In Pingmesh, even when two serversare in the pinglists of each other, they measure net-work latency separately. By doing so, every server cancalculate its own packet drop rate and network latencylocally and independently.
142
At the inter-DC level, all the DCs form yet anothercomplete graph. In each DC, we select a number ofservers (with several servers selected from each Podset).
Combining the three complete graphs, a server inPingmesh needs to ping 2000-5000 peer servers depend-ing on the size of the data center. The Pingmesh Con-troller uses threshold values to limit the total number ofprobes of a server and the minimal time interval of twosuccessive probes for a source destination server pair.
3.3.2 Pingmesh Controller implementationThe Pingmesh Controller is implemented as an Au-
topilot service and becomes part of the Autopilot man-agement stack. It generates Pinglist file for every serverby running the Pingmesh generation algorithm. Thefiles are then stored in SSD and served to the serversvia a Pingmesh Web service. The Pingmesh Controllerprovides a simple RESTful Web API for the PingmeshAgents to retrieve their Pinglist files respectively. ThePingmesh Agents need to periodically ask the Controllerfor Pinglist files and the Pingmesh Controller does notpush any data to the Pingmesh Agents. By doing so,Pingmesh Controller becomes stateless and easy to scale.
As the brain of the whole Pingmesh system, the PingmeshController needs to serve hundreds of thousands of PingmeshAgents. Hence the Pingmesh Controller needs to befault-tolerant and scalable. We use Software Load-Balancer(SLB) [14] to provide fault-tolerance and scalability forthe Pingmesh Controller. See [9, 14] for the details ofhow SLB works. A Pingmesh Controller has a set ofservers behind a single VIP (virtual IP address). SLBdistributes the requests from the Pingmesh Agents tothe Pingmesh Controller servers. Every Pingmesh Con-troller server runs the same piece of code and gener-ates the same set of Pinglist files for all the serversand is able to serve requests from any Pingmesh Agent.The Pingmesh Controller can then easily scale out byadding more servers behind the same VIP. Also once aPingmesh Controller server stops functioning, it is auto-matically removed from rotation by the SLB. We havesetup two Pingmesh Controllers in two different datacenter clusters to make the controller even more faulttolerant geographically.
3.4 Pingmesh Agent
3.4.1 Pingmesh Agent design considerationsThe Pingmesh Agent runs on all the servers. Its task
is simple: downloads pinglist from the Pingmesh Con-troller; pings the servers in the pinglist; then uploadsthe ping result to DSA.
Based on the requirement that Pingmesh needs to beable to distinguish if a user perceived latency increase isdue to network or not, Pingmesh should use the sametype of packets generated by the applications. Sincealmost all the applications in our data centers use TCPand HTTP, Pingmesh uses TCP and HTTP instead ofICMP or UDP for probing.
Because we need to differentiate if a ‘network’ issue isbecause of the network or the applications themselves,Pingmesh Agent does not use any network libraries usedby the applications. Instead, we have developed ourown light-weight network library specifically designedfor network latency measurement.
The Pingmesh Agent can be configured to send outand respond to probing packets of different lengths,other than the TCP SYN/SYN-ACK packets. As a re-sult, the Pingmesh Agent needs to act as both client andserver. The client part launches pings and the serverpart responds to the pings.
Every probing needs to be a new connection anduses a new TCP source port. This is to explore themulti-path nature of the network as much as possible,and more importantly, reduce the number of concurrentTCP connections created by Pingmesh.
3.4.2 Pingmesh Agent implementationThough the task is simple, the Pingmesh Agent is one
of the most challenging part to implement. It must meetthe safety and performance requirements as follows.
First, the Pingmesh Agent must be fail-closed andnot create live-site incidents. Since the Pingmesh Agentruns on every server, it has the potential to bring downall the servers if it malfunctions (e.g., uses large portionof CPU and memory resources, generates large volumeof probing traffic, etc.). To avoid bad things from hap-pening, several safety features have been implementedinto the Pingmesh Agent:
• The CPU and maximum memory usages of thePingmesh Agent are confined by the OS. Oncethe maximum memory usage exceeds the cap, thePingmesh Agent will be terminated.
• The minimum probe interval between any two serversis limited to 10 seconds, and the probe payloadlength is limited to 64 kilobytes. These limits arehard coded in the source code. By doing so, weput a hard limit on the worst-case traffic volumethat Pingmesh can bring into the network.
• If a Pingmesh Agent cannot connect to its con-troller for 3 times, or if the controller is up butthere is no pinglist file available, the PingmeshAgent will remove all its existing ping peers andstop all its ping activities. (It will still react topings though.) Due to this feature, we can stopthe Pingmesh Agent from working by simply re-moving all the pinglist files from the controller.
• If a server cannot upload its latency data, it willretry several times. After that it will stop tryingand discard the in-memory data. This is to en-sure the Pingmesh Agent uses bounded memoryresource. The Pingmesh Agent also writes the la-tency data to local disk as log files. The size of logfiles is limited to a configurable size.
143

(a) CPU usage (b) Memory usage
Figure 3: CPU and memory usages of Pingmesh Agent.
Second, a Pingmesh Agent needs to launch pings toseveral thousand of servers by design. But as a sharedservice, the Pingmesh Agent should minimize its re-sources (CPU, memory, and disk space) usage. It shoulduse close to zero CPU time and as small memory foot-print as possible, so as to minimize its interference withcustomers’ applications.
In order to achieve the performance goal and improvePingmesh’s latency measurement accuracy, we use C++instead of Java or C# to write Pingmesh Agent. Thisis to avoid the common language runtime or Java vir-tual machine overhead. We have developed a networklibrary specifically for Pingmesh. The goal of the li-brary is solely for network latency measurement, andit is designed to be light-weight and to handle a largenumber of concurrent TCP connections. The libraryis directly based on the Winsock API, and it uses theWindows IO Completion Port programming model forefficient asynchronous network IO processing. The li-brary acts as both client and server, and it distributesthe probing processing load to all the CPU cores evenly.
We have done extensive measurements to understandand optimize Pingmesh Agent’s performance. Figure 3shows the CPU and memory usages of the PingmeshAgent on a typical server. During the measurement,this Pingmesh Agent was actively probing around 2500servers. The server has 128GB memory and two In-tel Xeon E5-2450 processors, each with 8 cores. Theaverage memory footprint is less than 45MB, and theaverage CPU usage is 0.26%.
We note that the probing traffic generated by a PingmeshAgent is small, typically tens of Kb/s. As a comparison,our data center network provides several Gb/s through-put between any two servers in a data center.
3.5 Data Storage and AnalysisFor Pingmesh data storage and analysis, we use the
well established existing systems, Cosmos/SCOPE andAutopilot’s Perfcounter Aggregator (PA) service, in-stead of reinventing the wheel.
The Pingmesh Agent periodically uploads the aggre-gated records to Cosmos. Similar to the Pingmesh Con-troller, the front-end of Cosmos uses load-balancer andVIP to scale out. At the same time, the Pingmesh
Agent performs local calculation on the latency dataand produces a set of performance counters includingthe packet drop rate, the network latency at 50th the99th percentile, etc. All these performance counters arecollected and aggregated and stored by the PA serviceof Autopilot.
Once the results are in Cosmos, we run a set of SCOPEjobs for data processing. We have 10-min, 1-hour, 1-dayjobs at different time scales. The 10-min jobs are ournear real-time ones. For the 10-min jobs, the time in-terval from when the latency data is generated to whenthe data is consumed (e.g., alert fired, dashboard fig-ure generated) is around 20 minutes. The 1-hour and1-day pipelines are for non real-time tasks includingnetwork SLA tracking, network black-hole detection,packet drop detection, etc. All our jobs are automati-cally and periodically submitted by a Job Manager toSCOPE without user intervention. The results of theSCOPE jobs are stored in a SQL database, from whichvisualization, reports, and alerts are generated.
In practice, we found this 20-minute delay works finefor system level SLA tracking. In order to further re-duce response time, we in parallel use the AutopilotPA pipeline to collect and aggregate a set of Pingmeshcounters. The Autopilot PA pipeline is a distributed de-sign with every data center has its own pipeline. The PAcounter collection latency is 5 minutes, which is fasterthan our Cosmos/SCOPE pipeline. The PA pipeline isfaster than Cosmos/SCOPE, whereas Cosmos/SCOPEis more expressive than PA for data processing. Byusing both of them, we provide higher availability forPingmesh than either of them.
We differentiate Pingmesh as an always-on servicefrom a set of scripts that run periodically. All the com-ponents of Pingmesh have watchdogs to watch whetherthey are running correctly or not, e.g., whether pinglistsare generated correctly, whether the CPU and mem-ory usages are within budget, whether pingmesh dataare reported and stored, whether DSA reports networkSLAs in time, etc. Furthermore, the Pingmesh Agent isdesigned to probe thousands of peers in a light-weightand safe way.
All the Pingmesh Agents upload 24 terabytes latencymeasurement results to Cosmos per day. This is morethan 2Gb/s upload rate. Though these look like largenumbers, they are only a negligible fraction of the totalcapacity provided by our network and Cosmos.
4. LATENCY DATA ANALYSISIn this section, we introduce how Pingmesh helps us
better understand network latency and packet drops,define and track the network SLA, and determine if alive-site incident is because of network issues or not. Allthe data centers we describe in this section have similarnetwork architecture as we have introduced in Figure1, though they may vary in size and may be built atdifferent times.
144

4.1 Network latencyFigure 4 shows the intra-DC latency distribution of
two representative data centers DC1 in US West andDC2 in US Central. DC1 is used by distributed storageand MapReduce and DC2 is by an interactive Searchservice. Servers in DC1 are throughput intensive andthe average server CPU utilization is as high as 90%.Servers in DC1 use the network heavily and transmitand receive several hundreds of Mb/s data on averageall the time. DC2 is latency sensitive and servers havehigh fan-in and fan-out in that a server needs to com-municate with a large number of other servers to servicea Search query. The average CPU utilization in DC2 ismoderate and the average network throughput is lowbut the traffic is bursty.
The CDFs in Figure 4 are calculated from latencydata of one normal working day, when there were nonetwork incidents detected and no live-site incidents be-cause of the network. We track both intra-pod andinter-pod latency distributions, with and without TCPpayload. If not specifically mentioned, the latency weuse in the paper is the inter-pod TCP SYN/SYN-ACKRTT without payload.
Figure 4(a) shows the overall inter-pod latency dis-tributions and Figure 4(b) shows the inter-pod distri-bution at high percentile. We once expected that thelatency of DC1 should be much larger than DC2 sinceservers and the network in DC1 are highly loaded. Butthis turned out not the case for latencies at the 90th orlower percentile.
But DC1 does have much higher latency at the highpercentile as shown in Figure 4(b). At P99.9, the inter-pod latencies are 23.35ms and 11.07ms for DC1 andDC2, respectively. At P99.99, the inter-pod latenciesbecome 1397.63ms and 105.84ms. Our measurementresult shows it is hard to provide low latency (e.g., sub-milliseconds level) at three or four 9s, even when theservers and network are both light-loaded at macro timescale. This is because the server OS is not a real-timeoperating system and the traffic in our network is burst.We see 10−5 packet drop rate for intra-pod communica-tions (Section 4.2) even when average network utiliza-tion is low to moderate.
Figure 4(c) compares the intra-pod and inter-pod la-tency distributions, and Figure 4(d) studies the inter-pod latency with and without payload, all in DC1. Forlatency measurement with payload, after TCP connec-tion setup, we let the client send a message (typically800-1200 bytes within one packet). The client measuresthe payload latency once it receives the echoed backmessage from the server.
As shown in Figure 4(c), intra-pod latency is alwayssmaller than inter-pod latency as expected. The 50th
(P50) and the 99th (P99) intra-pod and inter-pod laten-cies are (216us, 1.26ms) and (268us, 1.34ms) for DC1.The differences at P50 and P99 are 52us and 80us, re-spectively. These numbers show that the network does
Data center Packet drop rateIntra-pod Inter-pod
DC1 (US West) 1.31× 10⁻⁵ 7.55× 10⁻⁵
DC2 (US Central) 2.10× 10⁻⁵ 7.63× 10⁻⁵
DC3 (US East) 9.58× 10⁻⁶ 4.00× 10⁻⁵
DC4 (Europe) 1.52× 10⁻⁵ 5.32× 10⁻⁵
DC5 (Asia) 9.82× 10⁻⁶ 1.54× 10⁻⁵
Table 1: Intra-pod and inter-pod packet drop rates.
introduce tens of microsecond latency due to queuingdelay. But the queuing delay is small. Hence we can in-fer that the network provides enough network capacity.
Figure 4(d) shows the latency difference with andwithout payload. With payload, the latency increasesfrom 268us to 326us at P50, and from 1.34ms to 2.43msat P99, respectively. The increase is mainly because ofthe increased transmission delay 1 and the user spaceprocessing overhead for the receiving servers to echoback the message. In most cases, the latency distribu-tions with and without payload are similar. We intro-duced payload ping because it can help detect packetdrops that are related to packet length (e.g., fiber FCSerrors and switch SerDes errors that are related to biterror rate).
Based on the Pingmesh data, we are able to calculatenot only the latency distributions of the data centers,but also the latency CDFs for all the applications andservices. From these results, we are able to track net-work latency for all of them all the time.
4.2 Packet drop ratePingmesh does not directly measure packet drop rate.
However, we can infer packet drop rate from the TCPconnection setup time. When the first SYN packet isdropped, TCP sender will retransmit the packet afteran initial timeout. For the rest successive retries, TCPwill double the timeout value every time. In our datacenters, the initial timeout value is 3 seconds, and thesender will retry SYN two times. Hence if the measuredTCP connection RTT is around 3 seconds, there is onepacket drop; if the RTT is around 9 seconds, there aretwo packet drops. We use the following heuristic toestimate packet drop rate:
probes with 3s rtt + probes with 9s rtt
total successful probes.
Note that we only use the total number of successfulTCP probes instead of the total probes as the denom-inator. This is because for failed probes, we cannotdifferentiate between packet drops and receiving serverfailure. In the numerator, we only count one packetdrop instead of two for every connection with 9 secondRTT. This is because successive packet drops within aconnection are not independent: the probability the sec-ond SYN is dropped is much higher if the first SYN is1We have disabled cut-through switching at theswitches in our data centers. This is to stop FCS er-rors from propagation.
145

(a) (b) (c) (d)
Figure 4: (a)Inter-pod latency of two data centers. (b) Inter-pod latency at high percentile. (c) Intra-pod andinter-pod latency comparison. (d) Latency comparison with and without payload.
dropped. We have verified the accuracy of the heuristicfor a single ToR network by counting the NIC and ToRpacket drops.
In our network, SYN packets are treated the same asother packets. Hence the drop rate of SYN packets canbe considered representative drop rate of the other datapackets in normal condition. This assumption, however,may not be true when packet drop rate is related topacket size, e.g., due to FCS errors. We did see packetsof larger size may experience higher drop rate in FCSerror related incidents. In what follows, the results wepresent are when the networks were in normal condition.
Our network does not differentiate packets of differentIP protocols (e.g., TCP vs. UDP). Hence, our packetdrop calculation holds for non-TCP traffic as well.
Table 1 shows the packet drop rates of five data cen-ters. We show both the intra-pod and inter-pod packetdrop rates. For intra-pod packet drops, those are dropsat ToR switch, NIC, and end-host network stack. Theinter-pod packet drops may come from the Leaf andSpine switches and the corresponding links, in additionto the ToR, NIC, and end-host stack.
From Table 1, several observations can be made. First,the packet drop rates are in the range of 10−4 − 10−5.We track the packet drop rates for all our data cen-ters every day and we find the drop rate is in thisrange unless network incidents happen. Second, theinter-pod packet drop rate is typically several timeshigher than that of intra-pod. This indicates most ofthe packet drops happen in the network instead of thehosts. Third, the intra-pod drop rate is around 10−5,which is larger than we have expected.
Our experience tells us packet drops may occur dueto many reasons, e.g., switch buffer overflow, NIC re-ceiving buffer overflow, optical fiber FCS errors, switch-ing ASIC malfunction, etc. Though our measurementresults suggest that the packet drop rate at normal con-dition is around 10−4 − 10−5, we are still at the earlyphase in understanding why it stays in this range.
Many data center applications, e.g., Search, may usehundreds or even thousands of TCP connections simul-taneously. For these applications, high latency tail there-fore becomes the norm due to the large number of con-
(a) The 99th percentile la-tency
(b) Packet drop rate
Figure 5: The 99th network latency and packet droprate metrics for a service.
nections used. Applications have introduced several ap-plication level tricks to deal with packet drops [10].
From the per server latency data, we can calculateand track network SLAs at server, pod, podset, anddata center levels. Similarly, we can calculate and tracknetwork SLA for individual services.
4.3 Is it a network issue?In large distributed data center systems, many parts
may go wrong. When a live-site incident happens, itis not easy to identify which part causes the problem.There are occasions that all the components seem finebut the whole system is broken. If the network cannotprove it is innocent, the problem will then be called a“network problem”: I did not do anything wrong to myservice, it must be the fault of the network.
The network team is then engaged to investigate. Atypical procedure is as follows. The network on-callengineer asks the service which is experiencing issuesfor detailed symptoms and source-destination pairs; hethen logs into the source and/or destination servers andruns various network tools to reproduce the issue; hemay also look at the switch counters along the possiblepaths for anomaly; if he cannot reproduce, he may askfor more source-destination pairs. The procedure mayneed several rounds of iterations.
The above approach does not work well for us, sinceit is a manual process and does not scale. If the issueturns out not to be caused by the network, the serviceowners waste their time in engaging with the wrong
146

team. If the issue is indeed because of the network,the manual process causes long time-to-detect (TTD),time-to-mitigate (TTM), and time-to-resolve (TTR).
Pingmesh changed the situation. Because Pingmeshcollects latency data from all the servers, we can alwayspull out Pingmesh data to tell if a specific service hasnetwork issue or not. If Pingmesh data does not cor-relate to the issue perceived by the applications, thenit is not a network issue. If Pingmesh data shows it isindeed a network issue, we can further get detailed datafrom Pingmesh, e.g., the scale of the problem (e.g., howmany servers and applications are affected), the source-destination server IP addresses and TCP port numbers,for further investigation.
We define network SLA as a set of metrics includ-ing packet drop rate, network latency at the 50th per-centile and the 99th percentile. Network SLA can thenbe tracked at different scopes including per server, perpod/podset, per service, per data center, by using thePingmesh data. In practice we found two network SLAmetrics: packet drop rate and network latency at the99th percentile are useful for telling if an issue is causedby the network or not. Figure 5 shows these two met-rics for a service in one normal week. The packet droprate is around 4× 10⁻⁵ and the 99th percentile latencyin a data center is 500-560us. (The latency shows a pe-riodical pattern. This is because this service performshigh throughput data sync periodically which increasesthe 99th percentile latency.) If these two metrics changesignificantly, then it is a network issue.
We currently use a simple threshold based approachfor network SLA violation detection. If the packet droprate is greater than 10−3 or the 99th percentile latencyis larger than 5ms, we will categorize this as a networkproblem and fire alerts. 10−3 and 5ms are much largerthan the normal values. We keep Pingmesh historicaldata for 2 months, and we run various data analysison top of the Pingmesh data to track the network SLAsfor different data centers and customers. There are hugeopportunities in using data mining and machine learn-ing to get more value out of the Pingmesh data.
In Section 5, we will study one specific packet dropin detail: switch silent packet drops.
5. SILENT PACKET DROP DETECTIONIn this section, we introduce how Pingmesh helps de-
tect switch silent packet drops. When silent packetdrops happen, the switches for various reasons do notshow information about these packet drops and the switchesseem innocent. But applications suffer from increasedlatency and packet drops. How to quickly identify ifan ongoing live-site incident is caused by switch silentpacket drops therefore becomes critical.
In the past, we have identified two types of switchsilent packet drops: packet black-hole and silent randompacket drops. Next, we introduce how we use Pingmeshto detect them.
Figure 6: The number of switches with packet black-holes detected.
5.1 Packet black-holePacket black-hole is a special type of switch packet
drops. For a switch that is experiencing packet black-holes, packets that meet certain ‘patterns’ are droppeddeterministically (i.e., 100%) by the switch. We haveidentified two types of packet black-holes. In the firsttype of black-hole, packets with specific source destina-tion IP address pairs get dropped. The symptom is asfollowing: server A cannot talk to server B, but it cantalk to servers C and D just fine. All the servers A-Dare healthy.
In the second type of black-hole, packets with spe-cific source destination addresses and transport portnumbers are dropped. Note that for this type of black-hole, packets with the same source destination addresspair but different source destination port numbers aretreated differently. For example, Server A can talk toServer B’s destination port Y using source port X, butnot source port Z.
The first type of black-holes is typically caused byTCAM deficits (e.g., parity error) in the switching ASIC.Some TCAM entries in the TCAM table may get cor-rupted, and the corruption causes only packets withcertain source and destination address patterns beendropped. (Since only destination address is used fornext-hop lookup for IP routing, on may wonder whysource IP address plays an role. Our guess is that aTCAM entry includes not only destination address butalso source address and other meta data.)
We know less about the root causes of the secondtype of black-hole. We suspect it may be because oferrors related to ECMP which uses source and destina-tion IP addresses and port numbers to decide the nextforwarding hop.
Based on our experience, these two types of packetblack-holes can be fixed by reloading the switch. Hencethe question becomes how to detect the switches withblack-holes.
We have devised a ToR switch black-hole detectionalgorithm based on Pingmesh data. The idea of thealgorithm is that if many servers under a ToR switchexperience the black-hole symptom, then we mark the
147

Figure 7: Silent random packet drops of a Spine switchdetected by Pingmesh during an incident.
ToR switch as a black-hole candidate and assign it ascore which is the ratio of servers with black-hole symp-tom. We then select the switches with black-hole scorelarger than a threshold as the candidates. Within a pod-set, if only part of the ToRs experience the black-holesymptom, then those ToRs are blacking hole packets.We then invoke a network repairing service to safelyrestart the ToRs. If all the ToRs in a podset experiencethe black-hole symptom, then the problem may be inthe Leaf or Spine layer. Network engineers are notifiedto do further investigation.
Figure 6 shows the number of ToR switches withblack-holes the algorithm detected. As we can see fromthe figure, the number of the switches with packet black-holes decreases once algorithm began to run. In ouralgorithm, we limit the algorithm to reload at most 20switches per day. This is to limit the maximum num-ber of switch reboots. As we can see, after a period oftime, the number of switches detected dropped to onlyseveral per day.
We would like to note that the TCP source port ofthe Pingmesh Agent varies for every probing. Withthe large number of source/destination IP address pairs,Pingmesh scans a big portion of the whole source/destinationaddress and port space. After Pingmesh black-hole de-tection came online, our customers did not complainabout packet black-holes anymore.
5.2 Silent random packet dropsThe higher the tier a switch is located in the net-
work, the more severe impact it will have when it beginsto drop packets. When a Spine switch drops packetssilently, tens of thousands of servers and many serviceswill be impacted and live-site incidents with high sever-ity will be triggered.
Here we introduce how Pingmesh helped locate silentrandom packet drops of a Spine switch. In one inci-dent, all the users in a data center began to experienceincreased network latency at the 99th percentile. Us-ing Pingmesh, we could confirm that the packet drops
in that data center has increased significantly and thedrops were not deterministic. Fig. 7 shows the packetdrop rate change of a service. Under normal condi-tion, the percentage of latency should be at around10−4 − 10−5. But it suddenly jumped up to around2× 10−3.
Using Pingmesh, we could soon figure out that onlyone data center was affected, and the other data centerswere fine. Packet drops at ToR and Leaf layers cannotcause the latency increase for all our customers due tothe much smaller number of servers under them. Thelatency increase pattern shown in Figure 8(d) pointedthe problem to the Spine switch layer.
But we could not find any packet drop hint (FCSerrors, input/output packet discards, syslog errors, etc.)at those switches. We then suspected that this is likely acase of silent packet drops. The next step was to locatethe switches that were dropping packets.
Again, by using Pingmesh, we could figure out severalsource and destination pairs that experienced around1%-2% random packet drops. We then launched TCPtraceroute against those pairs, and finally pinpointedone Spine switch. The silent random packet drops weregone after we isolated the switch from serving live traf-fic. The postmortem analysis with the switch providerrevealed that the packet drops were due to bit flips of afabric module of that switch.
The above case is one of the first silent random packetdrop cases we met and it took us long time to resolve.After that we ran into more cases and we have improvedboth Pingmesh data analysis and other tools for betterautomatic random silent packet drop detection. Ourexperiences told us that random silent packet drops maybe because of different reasons, e.g., switching fabricCRC checksum error, switching ASIC deficit, linecardnot well seated, etc. These types of switch silent packetdrops cannot be fixed by switch reload and we haveto RMA (return merchandise authorization) the faultyswitch or components.
Compared to packet drops due to network congestionand link FCS errors, packet black-holes and silent ran-dom drops are new and less understood to us. Due tothe whole coverage and always-on properties of Pingmesh,we are able to confirm that switch silent packet dropsdo happen in real-world and categorize different silentpacket drop types, and further locate where the silentpacket drops happen.
6. EXPERIENCES LEARNEDPingmesh is designed to be scalable. We understand
that not all the networks are of our size. We believethat the lessons we learned from Pingmesh are bene-ficial to networks of both large and small scales. Oneof the lessons we learned is the value of trustworthylatency data of full coverage. If the data is not trust-worthy, then the results built on top of it cannot betrusted. Our experience told us that not all SNMP
148

data are trustworthy. A switch may drop packets eventhough its SNMP tells us everything is fine. We trustPingmesh data because we wrote the code, tested andran it. When there are bugs, we fixed them. After sev-eral iterations, we knew we can trust the data. Becauseof the full coverage and trustworthy of its latency data,Pingmesh could carry out accurate black-hole and silentpacket drop detection. As a comparison, simply usingswitch SNMP and syslog data does not work since theydo not tell us about packet black-holes and silent drops.
In what follows, we introduce several additional lessonswe have learned from building and running Pingmesh,which we believe can be applied to networks of differentscales as well.
6.1 Pingmesh as an always-on serviceFrom the beginning of the project, we believed that
Pingmesh needs to cover all the servers and be always-on. But not everyone agreed. There were argumentsthat latency data should only be collected on-demand;that we should only let a few selected servers participatein latency measurement, so as to reduce the overhead.We disagree with both of them.
In its essence, the first argument is always-on vs on-demand. One may argue that it is a waste of resource ifthe always-on latency data is not used, hence we shouldonly collect latency data when it is needed.This argu-ment has two issues. First, we cannot predict whenthe latency data will be needed since we do not knowwhen a live-site incident will happen. When a live-siteincident occurs, having network latency data readily athands instead of collecting them at that time is a muchbetter choice. Second, when something bad happens,we typically do not know which network devices causedthe trouble, hence we do not even have the source des-tination pairs to launch latency measurement.
Using only a small number of selected servers forlatency measurement limits the coverage of Pingmeshdata, and poses challenges on which servers should bechosen. As we have demonstrated in the paper, lettingall the servers participate gives us the maximum pos-sible coverage, and easily balance the probing activityamong all the servers. As we have demonstrated in thepaper, the CPU, memory and bandwidth overhead in-troduced by Pingmesh is affordable.
Having latency data that is always-on brings benefitsthat we did not recognize in the beginning. After experi-encing a few live-site incidents due to packet black-holeand switch silent packet drops, we found that we coulduse the Pingmesh data to automatically detect thesetypes of switch failures, because of the whole coverageand always-on nature of Pingmesh data (Section 5).
6.2 Loosely coupled components help evolve-ment
Pingmesh benefits from a loosely coupled system de-sign. Pingmesh Controller and Pingmesh Agent interactonly through the pinglist files, which are standard XML
files, via standard Web API. Pingmesh Agent provideslatency data as both CSV files and standard perfor-mance counters.
Due to its loosely coupled design, Pingmesh could bebuilt step by step in three phases. In the first phase,we focused on Pingmesh Agent. We built a simplePingmesh Controller which statically generates pinglistfiles using a simplified pinglist generation algorithm.The latency data was simply put into Cosmos withoutautomatic analysis. This phase demonstrated the feasi-bility of Pingmesh. At the end of this phase, the latencydata was already used for network SLA calculation.
In the second phase, we built a full fledged PingmeshController which automatically updates pinglists oncenetwork topology is updated or configuration is adjusted.The new version of Pingmesh Controller is also of highercapacity and more fault tolerant by setting up multiplecontrollers in geo-distributed data centers.
In the third phase, we focused on data analysis andvisualization. We built a data processing pipeline whichautomatically analyzes the collected latency data in ev-ery 10 minutes, one hour, one day, respectively. Theprocessed results are then stored in database for visu-alization, report and alert services.
The major tasks of these three phases were finished inJune 2012. After that, many new features were addedinto Pingmesh:Inter-DC Pingmesh. Pingmesh originally worked forintra-DC. However, extending it to cover Inter-DC iseasy. We extended the Pingmesh Controller’s pinglistgeneration algorithm so as to select a set of servers fromevery data center and let them carry out Inter-DC pingand the job was done. There is no single line of code orconfiguration change of the Pingmesh Agent. We didadd a new inter-DC data processing pipeline though.QoS monitoring. After Pingmesh was deployed, net-work QoS was introduced into our data center which dif-ferentiates high priority and low priority packets basedon DSCP (differentiated service code point). Again, weextended the Pingmesh Generator to generate pinglistsfor both high and low priority classes. In this case, wedid need a simple configuration change of the PingmeshAgent to let it listen to an additional TCP port whichis configured for low priority traffic.VIP monitoring. Pingmesh was originally designedto measure network latency of physical networks. Inour data centers, load-balancing and IP address virtu-alization is widely used. Address virtualization exposesa logical Virtual IP address (VIP) to users, and the VIPis mapped to a set of physical servers. The physical IPaddresses of these servers are called DIP (destinationIP). In our load-balancing system, there is a controlplan maintains the VIP to DIP mapping and a dataplan that delivers packets that target for a VIP to theDIPs via packet encapsulation. When Pingmesh gotdeployed, a natural extension is let Pingmesh to moni-tor the availability of the VIPs. This again is done byextending the Pingmesh Generation algorithm to cover
149
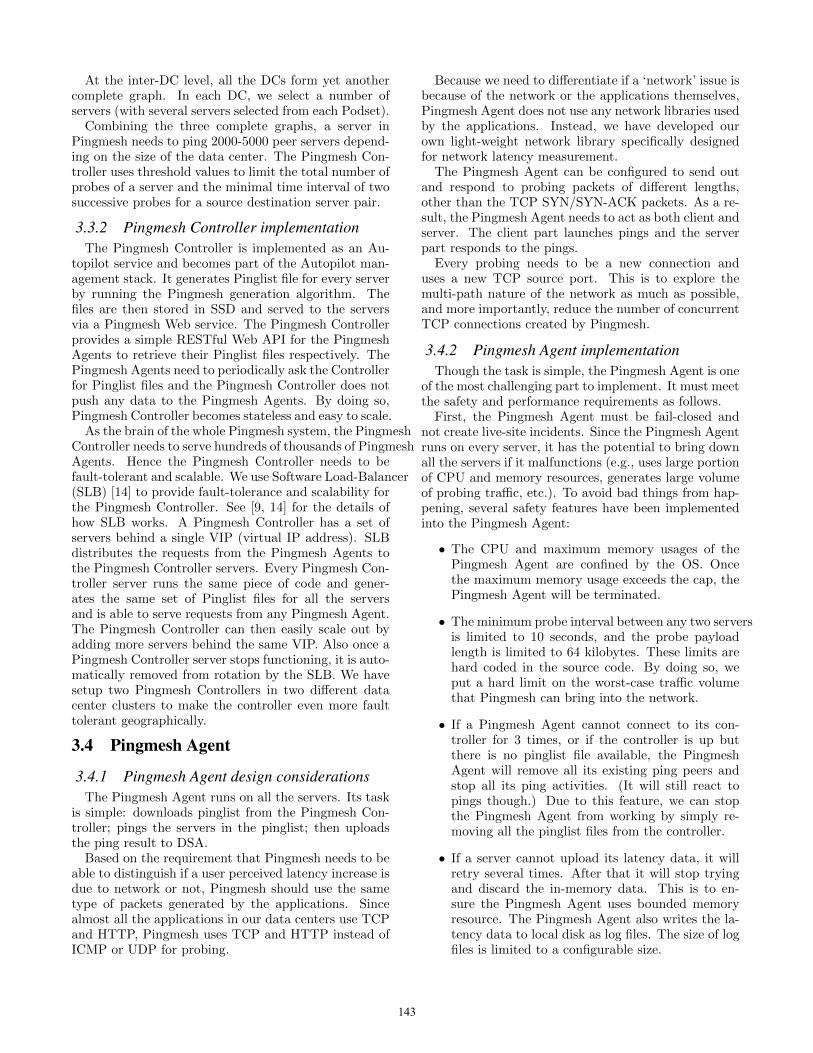
(a) Normal (b) Podset down (c) Podset failure (d) Spine failure
Figure 8: Network latency patterns through visualization.
the VIPs as the target, without touching the rest of thePingmesh pipeline.Silent packet drop detection. As we have discussedin Section 5, we have been using Pingmesh for silentpacket drop detection. Since the latency data is alreadythere, we only need to figure out the detection algorithmand implement the algorithm in the DSA pipeline with-out touching other Pingmesh components.Network metrics for services. Two Pingmesh met-rics have been used by service developers to design andimplement better services. The Pingmesh Agent ex-poses two PA counters for every server: the 99th latencyand the packet drop rate. Service developers can use the99th latency to get better understanding of data centernetwork latency at server level. The per-server packetdrop rate has been used by several services as one of themetrics for server selection.
For the above extensions, only inter-DC Pingmeshand QoS monitoring were by design, the rest three justhappened out of our expectation. Thanks to Pingmesh’sloosely coupled design, all these features were addedsmoothly without adjusting its architecture.
6.3 Visualization for pattern discoveryWe have invested heavily in Pingmesh data analysis
and visualization. Our happy findings are that dataspeaks for themselves and that visualization helps usbetter understand and detect various latency patterns.
Figure 8 shows several typical visualized latency pat-terns. In the figure, a small green, yellow, or red blockor pixel shows the network latency at the 99th percentilebetween a source-destination pod-pair. Green meansthe latency is less than 4ms, yellow means the latencyis between 4-5ms, and red is for latency larger than 5ms.A white block means there is no latency data available.
Figure 8(a) shows an (almost) all-green pattern, whichmeans the network works fine. Though looks straight-forward, this all-green pattern is one of the most widelyused feature of Pingmesh. Using this pattern, we caneasily tell the global healthy status of the network.
Figure 8(b) shows a pattern of a white-cross. Thewidth of the white-cross corresponds to a Podset, whichcontains around 20 pods. This pattern shows a Podset-down scenario. Podset-down typically is due to the lossof power of the whole Podset.
Figure 8(c) shows a pattern of a red-cross. The widthof the red-cross again corresponds to a Podset. Thered-cross shows high network latency from and to thePodset. This pattern shows there is a network issuewithin the Podset, since the network latency of otherPodsets are normal. There may be several causes of thePodset red-cross. If both Leaf and ToR switches are allL3 switches, then at least one of the Leaf switches isdropping packets. If the whole Podset is a L2 domain,then it is possibly caused by broadcast storm, e.g., dueto some switches loss their configuration.
Figure 8(d) shows a pattern of red-color with green-squares along the diagonal. Here each small green-square is a Podset. It shows that the network latencieswithin the Podsets are normal, but cross-Podset latencyare all out of network SLA. It shows a network issue atthe Spine switch layer.
The success of the visualization is beyond our expec-tation. It has become a habit for many of us to openthe visualization portal regularly to see if the networkis fine. The visualization portal has been used not onlyby network developers and engineers, but also by ourcustomers to learn if there is a network issue or not.We also observed an interesting usage pattern: Whenthe visualization system was first put into use, it wastypically used by the network team to ‘prove’ to our cus-tomers that the network was fine. Now our customersusually use the visualization to show that there is in-deed an on-going network issue. This is a usage patternchange that we are happy to see.
6.4 Pingmesh limitationsDuring the period of running Pingmesh, we have un-
covered two limitations of Pingmesh. First, thoughPingmesh is able to detect which tier a faulty network
150

device is located in, it cannot tell the exact location. Inour network, there are tens to hundreds of switches atthe Spine layer. Knowing the Spine layer is experiencingsome issue is good but not enough. We need methods tolocate and isolate the faulty devices as fast as possible.This is a known limitation of Pingmesh from beginning.As described in Section 5.2, we combine Pingmesh andTCP traceroute to address this issue.
The second limitation comes from Pingmesh’s currentlatency measurement. Though the Pingmesh Agent cansend and receive probing messages of up to 64 KB, weonly use SYN/SYN-ACK and a single packet for sin-gle RTT measurement. Single packet RTT is good atdetecting network reachability and packet-level latencyissues. But it does not cover the case when multipleround trips are needed. We recently experienced a live-site incident caused by TCP parameter tuning. A bugintroduced in our TCP parameter configuration soft-ware rewrote the TCP parameters to their default value.As a result, for some of our services, the initial conges-tion window (ICW) reduced from 16 to 4. For longdistance TCP sessions, the session finish time increasedby several hundreds of milliseconds if the sessions needmultiple round trips. Pingmesh did not catch this be-cause it only measures single packet RTT.
7. RELATED WORKOur experiences running one of the largest data cen-
ter networks in the world taught us that all the compo-nents including applications, OS kernel, NIC, switchingASIC and firmware, and fibers may cause communica-tion failures. See [4] for a summary of various failuresthat may cause network partition.
[21] and [6] studied traffic and flow characteristics ofdifferent types of data centers, by collecting networktraces. Pingmesh focuses on network latency and iscomplementary to these works.
Both Pingmesh and [18] are designed to detect packetdrops in the network. Both use active probing packetsand are capable of covering the whole network. Theapproaches, though, are different. [18] uses RSVP-TEbase source routing to pinpoint the routing path of aprobing packet. It hence needs to create the routingpaths and maps in advance. It also means that theprobing packets are traversing the network in LSPs (la-bel switched paths) different from those used by thenon-probing packets. Second, RSVP-TE is based onMPLS, which, though is widely used for WAN traffic en-gineering, is not used within the data centers. Pingmeshcan be used for both intra-DC and inter-DC networks.Using source routing does provide an advantage: [18]can directly pinpoint the switches or links that droppackets. We have shown in Section 5.2 Pingmesh canlocalize faulty devices together with traceroute.
Cisco IPSLA [8] also uses active packets for networkperformance monitoring. IPSLA is configured to runat Cisco switches, and is capable of sending ICMP, IP,
UDP, TCP, and HTTP packets. IPSLA collects net-work latency, jitter, packet loss, server response time,and even voice quality scores. The results are stored lo-cally at the switches and can be retrieved via SNMP orCLI (command-line interface). Pingmesh differs fromIPSLA in several ways. First, Pingmesh uses serverinstead of switches for data collection. By doing so,Pingmesh becomes network device independent whereasIPSLA works only for Cisco devices. Second, Pingmeshfocuses on both measurement and latency data analysis.To achieve its goal, Pingmesh has not only PingmeshAgent for data collection, but also a control plane forcentralized control and a data storage and analysis pipeline.IPSLA does not have such a control plane and data stor-age and analysis pipeline.
NetSight [19] tracks packet history by introducingpostcard filters at the switches to generate capturedpacket events called postcard. Several network trou-bleshooting services, nprof, netshark, netwatch, ndb,can be built on top of NetSight. Compared with Net-Sight, Pingmesh is server-based in that it does not needto introduce additional rules into the switches. FurtherPingmesh is capable of detecting switch silent packetdrops. It is not clear how silent packet drop rules canbe written for NetSight, since it is not known in advancewhich type of packets may be dropped.
ATPG [25] determines a minimal set of probing pack-ets that cover all the network links and forwarding rules.Pingmesh does not try to minimize the number of prob-ings. As long as the overhead is affordable, we preferto let Pingmesh run all the time. Further it is not clearhow ATPG can deal with packet black-holes where therules for black-holes cannot be determined in advance.
Pingmesh focused on physical network and it uses ac-tive probings by installing the Pingmesh Agent in theservers. For third party VMs and virtual networks, how-ever, installing the Pingmesh Agent may not be feasi-ble. In this case passive traffic collection as explored byVND [24] may be used.
8. CONCLUSIONWe have presented the design and implementation of
Pingmesh for data center network latency measurementand analysis. Pingmesh is always-on and it providesnetwork latency data by all the servers and for all theservers. Pingmesh has been running in Microsoft datacenters for more than four years. It helps us answer if aservice issue is caused by the network or not, define andtrack network SLA at both macro and micro levels, andit has become to be an indispensable service for networktroubleshooting.
Due to its loosely coupled design, Pingmesh turnedout to be easily extensible. Many new features havebeen added while the architecture of Pingmesh is stillthe same. By studying the Pingmesh latency data andlearning from the latency patterns via visualization anddata mining, we are able to continuously improve the
151

quality of our network, e.g., by automatically fixingpacket black-holes and detecting switch silent randompacket drops.
9. ACKNOWLEDGEMENTWe thank Lijiang Fang, Albert Greenberg, Wilson
Lee, Randy Kern, Kelvin Yiu, Dongmei Zhang, Yong-guang Zhang, Feng Zhao, the members of the Wirelessand Networking Group of Microsoft Research Asia fortheir support at various stages of this project. We thankour shepherd Sujata Banerjee and the anonymous SIG-COMM reviewers for their valuable and detailed feed-back and comments.
10. REFERENCES[1] M. Al-Fares, A. Loukissas, and A. Vahdat. A
Scalable, Commodity Data Center NetworkArchitecture. In Proc. SIGCOMM, 2008.
[2] Alexey Andreyev. Introducing data center fabric,the next-generation Facebook data centernetwork. https://code.facebook.com/posts/360346274145943/,Nov 2014.
[3] Hadoop. http://hadoop.apache.org/.[4] Peter Bailis and Kyle Kingsbury. The Network is
Reliable: An Informal Survey of Real-WorldCommunications Failures. ACM Queue, 2014.
[5] Luiz Barroso, Jeffrey Dean, and Urs Holzle. WebSearch for a Planet: The Google ClusterArchitecture. IEEE Micro, March-April 2003.
[6] Theophilus Benson, Aditya Akella, and David A.Maltz. Network Traffic Characteristics of DataCenters in the Wild. In Internet MeasurementConference, November 2010.
[7] et.al Brad Calder. Windows Azure Storage: AHighly Available Cloud Storage Service withStrong Consistency. In SOSP, 2011.
[8] Cisco. IP SLAs Configuration Guide, Cisco IOSRelease 12.4T.http://www.cisco.com/c/en/us/td/docs/ios-xml/ios/ipsla/configuration/12-4t/sla-12-4t-book.pdf.
[9] Citrix. What is Load Balancing? http://www.citrix.com/glossary/load-balancing.html.
[10] Jeffrey Dean and Luiz Andre Barroso. The Tail atScale. CACM, Februry 2013.
[11] Jeffrey Dean and Sanjay Ghemawat. MapReduce:Simplified Data Processing on Large Clusters. InOSDI, 2004.
[12] Albert Greenberg et al. VL2: A Scalable andFlexible Data Center Network. In SIGCOMM,August 2009.
[13] Chi-Yao Hong et al. Achieving High Utilizationwith Software-Driven WAN. In SIGCOMM, 2013.
[14] Parveen Patel et al. Ananta: Cloud Scale LoadBalancing. In ACM SIGCOMMM. ACM, 2013.
[15] R. Chaiken et al. SCOPE: Easy and EfficientParallel Processing of Massive Data Sets. InVLDB’08, 2008.
[16] Sushant Jain et al. B4: Experience with aGlobally-Deployed Software Defined WAN. InSIGCOMM, 2013.
[17] Sanjay Ghemawat, Howard Gobioff, andShun-Tak Leung. The Google File System. InACM SOSP. ACM, 2003.
[18] Nicolas Guilbaud and Ross Cartlidge. GoogleBackbone Monitoring, Localizing Packet Loss in aLarge Complex Network, Feburary 2013.Nanog57.
[19] Nikhil Handigol, Brandon Heller, VimalkumarJeyakumar, David Mazieres, and Nick McKeown.I Know What Your Packet Did Last Hop: UsingPacket Histories to Troubleshoot Networks. InNSDI, 2014.
[20] Michael Isard. Autopilot: Automatic Data CenterManagement. ACM SIGOPS Operating SystemsReview, 2007.
[21] Srikanth Kandula, Sudipta Sengupta, AlbertGreenberg, Parveen Patel, and Ronnie Chaiken.The nature of data center traffic: Measurements& analysis. In Proceedings of the 9th ACMSIGCOMM Conference on Internet MeasurementConference, IMC ’09, 2009.
[22] Rishi Kapoor, Alex C. Snoeren, Geoffrey M.Voelker, and George Porter. Bullet Trains: AStudy of NIC Burst Behavior at MicrosecondTimescales. In ACM CoNEXT, 2013.
[23] Cade Metz. Return of the Borg: How TwitterRebuilt Google’s Secret Weapon.http://www.wired.com/2013/03/google-borg-twitter-mesos/all/, March 2013.
[24] Wenfei Wu, Guohui Wang, Aditya Akella, andAnees Shaikh. Virtual Network Diagnosis as aService. In SoCC, 2013.
[25] Hongyi Zeng, Peyman Kazemian, GeorgeVarghese, and Nick McKeown. Automatic Test
Packet Generation. In CoNEXT, 2012.
152


![Modeling and Analyzing Latency in the Memcached system€¦ · Memcached, Latency, Modeling, Quantitative Analysis 1 Introduction Memcached [1] has been adopted in many large-scale](https://static.fdocuments.net/doc/165x107/602be0d3f99b302af7257ea9/modeling-and-analyzing-latency-in-the-memcached-system-memcached-latency-modeling.jpg)


