PINCH ANALYSIS :
30
NITROGEN-BASED FERTILIZER INDUSTRY Energy Recovery at an Ammonia Plant PINCH ANALYSIS : For the Efficient Use of Energy, Water & Hydrogen
Transcript of PINCH ANALYSIS :

NITROGEN-BASED FERTILIZER INDUSTRYEnergy Recovery at an Ammonia Plant
PINCH ANALYSIS :For the Efficient Use of Energy,Water & Hydrogen


PINCH ANALYSIS:For the Efficient Use of Energy,
Water & Hydrogen
NITROGEN-BASED FERTILIZER INDUSTRYEnergy Recovery at an Ammonia Plant

We would appreciate hearing from you about this document. Please send your comments to:
CanmetENERGY in Varennes
1615, Lionel-Boulet Boulevard, P.O. Box 4800
Varennes, Quebec, J3X 1S6
Canada
For more information:
Telephone: 1 (450) 652-4621 Facsimile: 1 (450) 652-5177 Website: http://canmetenergy.nrcan.gc.ca Email: [email protected]
Cat. No.: M154-60/4/2009E-PDFISBN: 978-1-100-19820-0
This Pinch Analysis Application Example has been initially developed by Veritech.
© Her Majesty the Queen in Right of Canada, 2012

5
Table of Contents
Pinch Analysis Application Example
Nitrogen-Based Fertilizer Industry - Energy Recovery at an Ammonia Plant . . . . . . . . . .7
Process Description . . . . . . . . . . . . . . . . . . . . . . . . . . . . . . . . . . . . . . . . . . . . . . . . . . . . 8
Step 1: Obtain Data on Existing Process Configuration Relevant to Pinch Study . . . . . 10
Operating Data . . . . . . . . . . . . . . . . . . . . . . . . . . . . . . . . . . . . . . . . . . . . . . . . 10
Economic Data . . . . . . . . . . . . . . . . . . . . . . . . . . . . . . . . . . . . . . . . . . . . . . . . 10
Step 2: Generate targets for each relevant utility using the Composite Curves and the Grand Composite Curve . . . . . . . . . . . . . . . . . . . . . . . . . . . . . . . . . . . 14 Set ∆Tmin values . . . . . . . . . . . . . . . . . . . . . . . . . . . . . . . . . . . . . . . . . . . . . . 14
Composite and Grand Composite Curves . . . . . . . . . . . . . . . . . . . . . . . . . . . . 15
Establish hot and cold utility targets . . . . . . . . . . . . . . . . . . . . . . . . . . . . . . . . 17
Step 3: Identify major inefficiencies in the heat exchanger network . . . . . . . . . . . . . 18
Step 4: Identify possible process modifications to reduce the energy use . . . . . . . . . 20
Step 5: Consider alternative retrofit strategies and select the most promising one . . 24
Step 6: Define and economically evaluate projects to the selected strategy . . . . . . . 26
Conclusions . . . . . . . . . . . . . . . . . . . . . . . . . . . . . . . . . . . . . . . . . . . . . . . . . . . . . . . . . .28
Energy Recovery at an Ammonia Plant


Energy Recovery at an Ammonia Plant 7
PINCh ANAlySIS APPlICATION ExAmPlE
Nitrogen-Based Fertilizer Industry Energy Recovery at an Ammonia Plant
This document describes a Pinch study of an Ammonia plant typical of that found in a facility that manufactures nitrogen-based fertilizers. The objective of this docu-ment is to illustrate in more concrete terms how Pinch analysis can be used to analyze and improve this industrial process in a retrofit situation. It is one of the step-by-step examples that support the technical guide entitled Pinch Analysis for the Efficient Use of Energy, Water and Hydrogen produced by Natural Resources Canada. The Pinch concepts used in this example are presented in more details in this guide.
Pinch techniques were initially developed to address energy efficiency issues in new plant design situations. The techniques need to be modified for retrofit studies like the one described here. The key distinction is that in retrofit situations the analysis must take into account equipment that is already installed, whereas in a new design situation the designer has the flexibility to add or delete equipment at will. This difference makes the retrofit problem inherently more constrained.
Broadly speaking, modifications identified by a Pinch analysis may be categorized as changes to the process configuration itself (primarily in the unit heat recovery network) and changes to the process-utility interface. The latter category may also include changes to the unit heat recovery network, but focuses on improving the manner in which hot and cold utilities (flue gas, steam, cooling water, refrigeration, etc.) are utilized to serve the needs of the process. In retrofit situations, the con-straints imposed by existing equipment can compromise the practicality and eco-nomic viability of changes to the process; under such circumstances, improvements to the process-utility interface may be more feasible and economically rewarding.
Although different approaches are possible for Pinch studies in retrofit situations, the approach taken in this example can be summarized in the following steps:
Obtain data on existing process configuration relevant to Pinch study
Generate targets for each relevant utility using the Composite Curves and the Grand Composite Curve
Identify major inefficiencies in the existing heat exchanger network
Identify possible process modifications to reduce the energy use

Pinch Analysis Application Example - Nitrogen-Based Fertilizer Industry8
Consider alternative retrofit strategies and select the most promising one
Define and economically evaluate projects related to the selected strategy
The objective in the Pinch study is to make changes that reduce the net cost of utili-ties for the process, taking overall site impacts into account. All costs mentioned in this text are given in Canadian dollars (CAN$)
Process Description
The ammonia process consists of:
• Feedgastreatment(primarilysulfurremoval)
• Primaryandsecondaryreformingtoproducesynthesisgas(primarilyhydrogen plus carbon monoxide)
• Highandlowtemperatureshiftreactors(tomaximizehydrogenyield)
• CO2 removal and recovery
• MethanationtoconvertresidualCOandCO2 to methane
• Ammoniasynthesis
• Productseparationviarefrigeration
• Compression(feedgas,air,processgas,refrigerant)
The process areas listed above are fully integrated and include an associated heat recovery network and ammonia refrigeration system.
This example is based on a moderate-size ammonia plant having a production rate of approximately 1,000 st/d1.
Theprocessisillustratedasasimplifiedprocessflowdiagram(PFD)inFigure1,which shows the main process streams and their respective heating or cooling loads. To simplify the schematic and aid understanding of energy flows, individual exchangers are not shown, but the locations of energy addition and removal are shown. Accordingly, the heat loads shown are aggregated duties that may represent more than one heat exchanger and/or furnace heating coil and thus may involve
1 1,000 st/d: 1,000 short tonnes per day (1 short tonne = 0.9 metric tonne)

9
both process-to-process heat exchange and utility heating or cooling. Clarification of that portion of the utility heating supplied by primary reformer flue gas is pro-videdinFigure2,whichillustratestheconfigurationoftheprimaryreformercon-vection section for the base case. Disaggregation of the heating and cooling require-mentsalsoisindicatedbelowintheHeatExchangerNetworkSummary(Table1),where the duties and temperatures of individual heat exchangers are provided.
Energy Recovery at an Ammonia Plant
Figure 1Simplified Flow Diagram of the Ammonia Process
Methanator
CO2Absorber
CO2Stripper
Desulfurizer
PrimaryReformer
ShiftConvertersSecondary
Reformer
SynthesisConverters
SyngasCompressor
CondensateStripperSteam
Natural Gas
Hydrogen Recycle
-1°C
Air
Steam
ProcessCondensate
CO2
Purge Gas
Ammonia
46°C
10°C
45°C
324°C 183°C
463°C
1003°C
349°C
422°C
241°C
184°C
75°C
84°C
109°C
123°C
41°C
67°C
125°C
59°C291°C
310°C5°C
148°C
17°C
75°C -23°C 156°C
334°C
43°C -23°C
Q = 0.5 MW
Q = 3.4 MW
Q = 3.1 MW
301°C
494°C
Q = 8.8 MW
Q = 57.5 MW Q = 11.8 MW
Q = 29 MW
Q = 11.2 MW
Q = 35.5 MW
Q = 26.2 MW
Q = 6.4 MW
Q = 7.9 MW
Q = 10.5 MW
Q = 4.3 MW
Q = 15.5 MW
Q = 27.9 MW
Q = 42.7 MWQ = 0.4 MW
Vent
RefrigerationSystem
92°C

Pinch Analysis Application Example - Nitrogen-Based Fertilizer Industry10
Step 1: Obtain Data on Existing Process Configuration Relevant to Pinch Study
Operating Data
Data needed for the Pinch study includes heat loads and temperatures for all of the utilities and process streams. In most cases this is obtained from a combination of test data, measured plant data and simulation, often supported by original design data. These data can be divided into two categories: process data and utility data.
Economic Data
The other type of data required is economic data. In the early stages of a study, the most important economic data relates to the cost of energy. Later capital costs becomeimportant;thisisdiscussedunderStep6.
Energypricesgenerallydependonwhichutilityisbeingconsidered,andinthepresent example fuel gas, steam generation, and purchased power costs must be considered. The applicable values for this study were as follows:
Figure 2
RadiantSection
Steam
Superheated Steam
BFWFuel
SteamFuel NaturalGas
NaturalGas
Steam/Air
Steam/Air
To SecondaryReformer
Mixed Feed
1,062ºC917ºC861ºC579ºC
743ºC
345ºC 565ºC896ºC
684ºC
377ºC334ºC
H2 H3U2 U3a H4 H5 U3b U1
AuxiliaryBoiler
Primary Reformer Furnace: Convection Section Configuration

Energy Recovery at an Ammonia Plant 11
Fuel: 6.00CAN$/GJ
100bargsteam(HP):19.00CAN$/1000kg
38bargsteam(MP): 15.30CAN$/1000kg
PurchasedPower: 47.00CAN$/MWh
Notwithstanding the values shown above, it should be noted that utility pricing - especially steam pricing - can be a complex issue. In this study, as in many Pinch studies, a site-wide steam system model was developed to arrive at an appropriate price structure and to verify the value of anticipated steam savings.
Note: The value of cooling water is generally a small fraction (typically ~10%) of that for hot utilities and thus is ignored in this example. It should be kept in mind that reduc-tion in cooling water usage can take on greater importance where plant operation or throughput is constrained by existing cooling system limitations.
Annualized energy costs and savings are calculated based on an assumed “on-streamfactor”of97%,or8,500hours/year.
Once collected, the required data must be put it in the proper format for the Pinch study. This is often referred as the data extraction phase. The main rules for data extraction are presented in the Pinch Analysis for the Efficient Use of Energy, Water and Hydrogen guide of Natural Resources Canada.
Heatloadsandtemperaturesforallstreamsintheprocessarerequiredforthestudy.Not included in the process stream data, however, is the radiant section process heat duty for the primary reformer, since it is a “given” that this duty cannot be suppliedtotheprocessinanyotherway.Hencethisportionoftheprocessisnotavailable for reintegration in some other manner.
Heatexchangermatchesintheexistingheatrecoverynetwork(includingthoseintheprimary reformer convection section) and the base stream data set used for the study are shown in Table 1. Note existing utility duties are shown for completeness.
Forthepurposesoftargetingexistingutilityloadsareignored,sincetheyreflectthe existing heat integration scheme, which may not be optimal. The only excep-tions are utility streams closely related to process operation and are not considered changeable. An example of this is process steam injection which is a process re-quirement unchanged by the heat integration scheme. Also, the primary reformer is a large fired heater. The radiant duty of the primary reformer, and hence its fuel firingrate,issetbyfeedstockconversionrequirements.Subjecttothisconstraint,the design objective is to make best use of the convective heat remaining in the flue gas leaving the radiant section of the reformer.

Pinch Analysis Application Example - Nitrogen-Based Fertilizer Industry12
Heat Exchanger Hot Side Cold Side
N° Type (1) Duty (MW) Stream
Ts (2)
(°C)T
t (2)
(°C)Stream
Ts (2)
(°C)T
t (2)
(°C)
P1 P-P 5 .91 low Temp Shift Converter Feed 332 241 methanator Feed 118 291
P2 P-P 17 .24 Gas to CO2 Absorber 184 137 CO
2 Striper Reboiler 124 125
P3 P-P 11 .23 CO2 Stripper Bottoms 123 97 CO
2 Stripper Feed 84 109
P4 P-P 2 .02 Syngas Compressor Intercooler 148 88 methanator Feed 59 118
P5 P-P 7 .34 Syngas Compressor Discharge 32 -11 Syngas Feed to Converters -23 23
P6 P-P 20 .55 Converter Effluent 183 43 Syngas Feed to Converters 23 156
H1 P-hU 0 .48 lP Steam 148 147 Natural Gas Feed -1 46
H2 P-P 2 .40 Combined Flue Gas 377 345 Natural Gas and h2 Recycle 45 244
H3 P-P 0 .97 Combined Flue Gas 579 565 Natural Gas and h2 Recycle 244 324
H4 P-hU 7 .78 Primary Reformer Flue Gas 1062 917 mixed Feed to Primary Ref . 301 494
H5 P-hU 3 .11 Primary Reformer Flue Gas 917 861 Steam/Air to Secondary Reformer 183 463
H6 P-hU 8 .95 lP Steam 148 147 CO2 Stripper Reboiler 123 124
C1 P-CU 57 .52 high Temp Shift Converter Feed 1003 349 hP Steam Generation 317 318
C2 P-CU 5 .84 low Temp Shift Converter Feed 422 332 hP Steam Generation 317 318
C3 P-CU 11 .76 Gas to CO2 Absorber 137 75 BFW Preheat 44 112
C4 P-CU 24 .26 CO2 Stripper Bottoms 97 41 Surface Condenser Water 35 46
C5 P-CU 6 .37 CO2 from Stripper 92 67 Surface Condenser Water 35 46
C6 P-CU 5 .16 methanator Effluent 310 158 BFW Preheat 112 292
C7 P-CU 4 .82 methanator Effluent 158 28 Cooling Water 20 35
C8 P-CU 0 .51 methanator Effluent 28 13 10° Refrigeration 9 10
C9 P-CU 1 .52Syngas Compressor
Intercooler88 39 Cooling Water 20 35
C10 P-CU 0 .75Syngas Compressor
Intercooler39 17 10° Refrigeration 9 10
C11 P-CU 2 .06Syngas Compressor
Discharge75 32 Cooling Water 20 35
C12 P-CU 4 .78Syngas Compressor
Discharge32 13 10° Refrigeration 9 10
C13 P-CU 3 .36Syngas Compressor
Discharge13 -3 -7° Refrigeration -8 -7
C14 P-CU 5 .28Syngas Compressor
Discharge-3 -23 -33° Refrigeration -34 -33
C15 P-CU 10 .81 Converter Effluent 334 261 BFW Preheat 212 293
C16 P-CU 11 .37 Converter Effluent 261 183 BFW Preheat 112 212

Energy Recovery at an Ammonia Plant 13
Process Stream or Utility?
The Composite Curves generally represent the heating and cooling needs of process streams. The Grand Composite Curve is then used to select the appropriate mix of hot and cold utilities to satisfy these needs. In the Am-monia process, however, the distinction between process and utility streams mustbeconsideredcarefully.Forexample,fluegastypicallyisregardedasahotutility.However,thePrimaryReformerfluegasisanunalterableproc-essfeature,ineffectmakingthefluegasaprocessstream.Forpurposesofstream data extraction, it is assumed that flue gas heat is available down to the temperature at which acid gas condensation would make further heat recovery economically impractical due to metallurgical considerations.
Heat Exchanger Hot Side Cold Side
N° Type (1) Duty (MW) Stream
Ts (2)
(°C)T
t (2)
(°C)Stream
Ts (2)
(°C)T
t (2)
(°C)
C17 P-CU 0 .43 Purge Gas 43 -23 -33° Refrigeration -34 -33
C18 U-U 18 .53 Refrigerant Condenser 109 25 Cooling Water 20 35
LSI lSI mP Steam 254 253 Process Steam 112 253
LSI lSI mP Steam 254 253 Process Steam 253 254
U1 P-hU 0 .78 Combined Flue Gas 345 334 Fuel Gas 17 163
U2 U-U 14 .08 Combined Flue Gas 565 377 BFW Preheat 112 297
U3b U-U 12 .85 Primary Reformer Flue Gas 861 684 Steam Superheat 373 441
U3a U-U 10 .34 Combined Flue Gas 743 579 Steam Superheat 318 373
Process Data Utility Data
(1) “P-P” indicates process-to-process heat exchanger; “P-CU” indicates utility cooling; “P-HU” indicates utility heating; “U-U” indicates hot utility/cold utility heat exchange; LSI indicates live steam injection (0 approach temp required)(2) T
s = supply temperature; T
t = target temperature
Table 1: heat Exchanger Network Summary DTmin values

Pinch Analysis Application Example - Nitrogen-Based Fertilizer Industry14
Step 2: Generate targets for each relevant utility using the Composite Curves and the Grand Composite Curve
Set ΔTmin
values
In order to generate the Composite and Grand Composite Curves used for Pinch Analysis, it is first necessary to set ΔT
min values for the problem. ΔT
min, or minimum
temperature approach, is the smallest temperature difference to be allowed in any heat exchange match between hot and cold streams. This parameter reflects the trade-off between energy consumption (which decreases as the ΔT
min value gets
smaller) and the required capital investment for heat recovery equipment (which increases as the ΔT
min value gets smaller).
It is possible to explore this trade-off quantitatively (for example, by using Pinch area targeting and capital cost targeting tools as presented in the Pinch Analysis for the Efficient Use of Energy, Water and Hydrogen guide), but in practice this is rarely done. Rather, there are typical ranges of ΔT
min values that have been found to repre-
sent a reasonable trade-off between capital and energy that generally can be applied with a high level of confidence.
In this pinch example, a ΔTmin
value of 20oC, has been applied to all process-to-processheatexchangematches.However,differentcapital-energytrade-offsapplyfor heat transfer between process streams and utilities; therefore, different ΔT
min
values typically are applied to heat exchange matches for each utility.
The following utility ΔTmin
values were selected:
Fluegas: 40oC
Steam: 10oC
CoolingWater: 10oC
Refrigeration 5oC
The ΔTmin
value for flue gas is somewhat arbitrary given its high-temperature char-acteristic. As discussed below, the minimum temperature approach for the flue gas is, in practice, set by the minimum temperature to which the flue gas may be practi-cally cooled, taking possible corrosion problems (from condensable) into account. The lower ΔT
min value for refrigeration reflects the higher energy cost associated
with power-intensive refrigeration systems (as compared to cooling utilities such as cooling water and air).

Energy Recovery at an Ammonia Plant 15
Composite and Grand Composite Curves
The Composite Curves for the base case stream data summarized in Table 1 are showninFigure3.Thesecurvesarecomprisedofalltheprocessheatingandcool-ing duties, and targets for utility use and generation can be inferred from these curves. In this case the process has an inherent excess of high temperature energy. This energy can be utilized to generate substantial quantities of superheated high pressure steam as currently done in exchangers U3a and U3b.
Figure 3
Figure 4
Composite Curves for Ammonia Process (∆Tmin
= 20°C) - Base Case
Grand Composite Curve for Ammonia Process (∆Tmin
= 20°C) - Base Case
0.0 50.0 100.0 150.0 200.0 250.0 300.0
Enthalpy (MW)
Tem
pera
ture
(°C)
Cold composite curve
Hot composite curve
-200
200
400
600
800
1,000
1,200
0
0.0 40.0 80.0 120.0 160.0 200.0
Enthalpy (MW)
Tem
pera
ture
(°C)
Utility curve
Process curve
-200
200
400
600
800
1,000
1,200
0

Pinch Analysis Application Example - Nitrogen-Based Fertilizer Industry16
AsecondrepresentationofthebasecasedataisprovidedinFigure4intheformof the Grand Composite Curve. In this representation, the base case heat rejection profileoftheprocessismatchedagainsttheavailableutilities-HPsteamgenera-tion,MPsteamuse,LPsteamuse,coolingwater,andrefrigeration.
The composite and grand composite curves show that the Ammonia process is a “Threshold problem” that requires only heat removal. This implies that there should be no net requirement for heating of process streams with hot utility (remember that we have accepted that the reformer firing duty is fixed, so the curves are not implying that the process does not require any external energy supply). Note that despite the excess of energy the grand composite curve shows potential for use of MPandLPsteam.Ingeneral,itisagoodideatomaximizeuseoflowerpressuresteammaximizinggenerationofHPsteam,sincethereispotentialforshaft-work(power)generationvialetdownofHPsteamtoMPsteamviaturbines.
Table 2 summarizes the energy targets for utility level as derived from the Grand Com-posite Curve at the selected values of ΔT
min. In the first instance targets are developed on
the assumption that there are no practical or economic constraints that would prevent the target energy use from being achieved. This assumption will be reconsidered later.
The scope for changes in utility use through improved integration is the difference betweenactualandtargetuse/generationofeachutility.ForexamplethetargetMPsteamuseis20.0MW,andtheactualuseis30.2MWsuggestingthatsavingsof10.2MWofMPsteamcanbemade.
Threshold Problem
The Ammonia Process is, in Pinch terms, a “Threshold problem” (see illustra-tion below). Below a certain ΔT
min value, “threshold problems” require only
HOTutilityor(asinthecaseofAmmonia)COLDutility,butnotboth.Suchproblems do not exhibit a process pinch or the “normal” capital vs. energy tradeoff.Theydo,however,haveutilitypinches,asdiscussedinStep3.
“Threshold problems”ForDT
min ≤ DT
threshold, energy targets do not change as DT
min changes.
T
H
∆Tthreshold
∆Tmin ≤ ∆Tthreshold
QHmin
Σ = QHmin
H
T

Energy Recovery at an Ammonia Plant 17
Establish hot and cold utility targets
Table2showsthatthekeydeficitinenergyperformancerelatestoHPsteamgenera-tionbeingbelowtargetby29.5MW.Theimplicationofthisisthatwithcompletefreedom to redesign the heat recovery systems, heat recovery into steam generation couldbeincreasedby28.5MW-morethan25%ofthebasecase.
Steamuseforprocessheatingisoverallclosetotarget,althoughthebasecasecon-sumesmoreMPsteamandlessLPsteamthantargeted.Duetotheworkproduc-tionpotentialfromexpansionofMPsteamtoLPinaturbine,LPsteamcouldbecheaperthanMPsteamandthedifferencebetweentargetandactualusecouldbeassociated with a cost penalty. A correct understanding of the site steam balance is required to make this determination.
Total actual refrigeration is shown to be slightly below target. This is due to some exchangersinthecoldsectionoftheprocessoperatingbelowthe5°CminimumΔT selectedfortargeting.Suchanobservationiscommoninaretrofitproject.
The primary conclusion to be drawn from the unconstrained targets is that the main opportunity for cost reduction lies with improved integration in the “hot end” of the process.
Utility Existing (MW) Target (MW) Scope (MW)
Hot utilities
mP Steam 30 .2 20 .0 -10 .2
lP Steam 9 .4 20 .0 +10 .6
Total Hot 39.6 40.0 +0.4
Cold utilities
hP Steam Generation 116 .5 145 .0 +28 .5
Refrigeration
10°C Refrigeration 6 .0 5 .2 -0 .8
-7°C Refrigeration 3 .4 4 .0 +0 .6
-33°C Refrigeration 5 .7 6 .8 +1 .1
Total Refrigeration 15.1 16.0 +0.9
Energy targets: Process ∆Tmin
= 20°C, Steam and Cooling Water ∆Tmin
= 10°C, Refrigeration ∆T
min = 5°C
Table 2: Energy Targets Summary

Pinch Analysis Application Example - Nitrogen-Based Fertilizer Industry18
Step 3: Identify major inefficiencies in the heat exchanger network
Previously, it was noted that the Ammonia process is a “Threshold problem”, and as suchdoesn’thaveaprocesspinch.However,whenutilitiesareadded,theycreate“utility pinches”. The reason for differences between actual and target utility use is cross pinch heat transfer - in this case cross utility pinch transfer.
Table 3 summarizes where cross pinch heat transfer is occurring at the “hot end” oftheprocessandisaffectingHPsteamgeneration.
As indicated in Table 3, a major portion of the existing cross-pinch heat transfer is associated with the loss of recoverable flue gas heat to ambient air in the stack. The remaining “lost opportunity” is scattered among numerous heat exchange services and thus is likely to be more difficult to capture, particularly in a retrofit situation.
In order to realize savings in purchased energy it is important to understand the mecha-nisms by which reducing process energy use (or increasing generation) will result in savings. Thus it is necessary to put the target savings in the context of the overall site.
Heat Exchanger Cross-Pinch Heat Transfer (MW) Location
LSI .64 Process steam
H2 .94 Feed gas coil
U1 .57 Fuel gas coil
P2 -2 .2 CO2 stripper reboiler
P1 .17 methanator feed heating
C6 .44 methanator effluent vs . BFW
C7 .56 methanator effluent cooling
P6 .77 Synthesis converter feed heating
H1 .48 Feed heating via lP steam
To stack 12 .1 Flue gas to atmosphere
P4 .17 methanator feed heating
Table 3: Cross-Pinch heat Transfer Summary

Energy Recovery at an Ammonia Plant 19
Figure5showsasimplifiedschematicofthesteamsystemstructure.Someofthecharacteristics important to the integration analysis are:
• Almost50%ofsteamconsumptionisassociatedwithworkgenerationincondensing turbines compressor drives.
• 30%ofsteamconsumptionisassociatedwiththeonly3largesteamcon-sumers: process steam, CO
2 stripper reboiler and process condensate stripper
reboiler. Process steam is added to the methane feed ahead of the reformer - it is both a reactant and a diluant that prevents reforming catalyst coking.
• 100bargHPsteamsavingscanberealizedbyincreasinggenerationinproc-ess waste heat boilers or by improving the thermodynamic efficiency of work production.Suchsavingsresultinfuelreductionsintheauxiliaryboiler.
• 38bargMPsteamsavingscanberealizedviasavingsintheuseof38bargsteam and 3 barg LP steam. Note that some letdown occurs between the 38 bargand3bargheaders.Consequently,whilethereisscopetorealizeMPsavings from savings of 3 barg LP steam, it is limited to the extent of let-down, after which further modifications to the steam system structure - such as elimination of a 38 barg to 3 barg turbine - would be required to keep the system in balance.
Figure 5 Simplified Schematic of Site Steam System
Pumps- Misc
HP100 barg
MP38 barg
LP3 barg
VENT
ProcessHeating
ProcessSteam
Waste HeatBoiler
SyngasCompressor
Compressors- Air- Refrig
AuxiliaryBoiler
PackageBoiler

Pinch Analysis Application Example - Nitrogen-Based Fertilizer Industry20
Step 4: Identify possible process modifications to reduce the energy use
The site steam balance situation indicates that fired steam production can be re-duced by:
Improving the thermodynamic efficiency of work production in turbines to increase work produced per unit mass of steam, and by
Reducing steam demand for process uses on the 38 barg or 3 barg headers.
The idea of improving work efficiency is simply derived from inspection of the steambalancesituation.Severalmodificationscouldbeconsidered,includingin-creased superheat, vacuum improvements, and turbine efficiency improvements. In this case a superheat temperature increase was selected as the appropriate route. Simulationofthesteamsystemshowsthatraisingsuperheattemperaturefromthecurrentvalueof440°C,to482°C,willreduceHPsteamdemandforworkproduc-tion by approximately 7 T/h2, the work delivered to compressors being the same.
WithrespecttoopportunitiesforheatrecoveryintoHPsteamgeneration,severalitems come into consideration:
• TheHPpressureishigh(approximately100barg)thereforemodificationstothe system are expensive.
• Increased steam generation implies addition of vaporization duty. The existing HPsteamgeneratorswouldbeextremelydifficultandexpensivetomodify.
2 7 T/h: 7 tonnes per hour
Site Steam Balance Considerations
The targets show that it is possible to making steam savings, but will they correspond to $ savings? A critical step in answering this question is to ex-amine the project sitewide steam system impact to verify that the reduced steam consumption will, in fact, lower fuel consumption in the site auxiliary and/or package boilers. Consequently, the Pinch analysis must be accom-panied by a “before and after” assessment of sitewide steam generation and use at all pressure levels to verify actual savings.
Energy Recovery at an Ammonia Plant 21
• The most obvious source of waste heat is the reformer flue gas, but not much heat could be recovered into steam generation because the flue gas is available at 334°CandtheHPvaporizationtemperatureisabout320°C.
Whileit isalwayspossibletodesignaheatexchangernetworkthatmeetstheenergy targets practical considerations come into play, particularly in retrofit situ-ations. In this case it becomes apparent that in order to meet the targets extensive modifications to the existing network would be required. In this example, such modifications were not considered likely to be economically viable. Consequently, it was decided to accept the existing steam generation configuration as a constraint and develop new targets. This is done by removing from the analysis all the stream segments associated with heat exchangers that are to be accepted as “unchangeable” features of the process.
The revised composite and grand composite curves reflecting the constrained situ-ationareshowninFigures5and6.Withtheconstraintsinplace,thetargetpictureisquitedifferent,sincetheproblemisnowpinchedandisanetconsumerofMPand LP steam.
TherevisedtargetsimplythatitshouldbepossibletoreduceMPsteamuseby20MWviaimprovedheatintegration.FurtherinspectionrevealsthattheonlylargeMPsteamuserisinfactprocesssteaminjection.However,sincetheprocesssteammust be injected into the gas feed, the target must be interpreted not as scope to “save”MPsteam,butasreflectinganopportunitytogenerateMPsteamthatcandisplaceMPsteamthatwouldotherwisebegeneratedinboilers.
Furtherinspectionoftheheatexchangernetworkshowsthatfluegasisstillakeyheat source, but that it cannot provide all the heat to produce the target savings. Consequently any project to capture the target savings would involve a new steam generationsystem,andcollectionofenergyfrommultiplesources.Suchaprojectwas considered unlikely to be economic since it would require several exchangers, plus auxiliary equipment such as steam drums and so on.
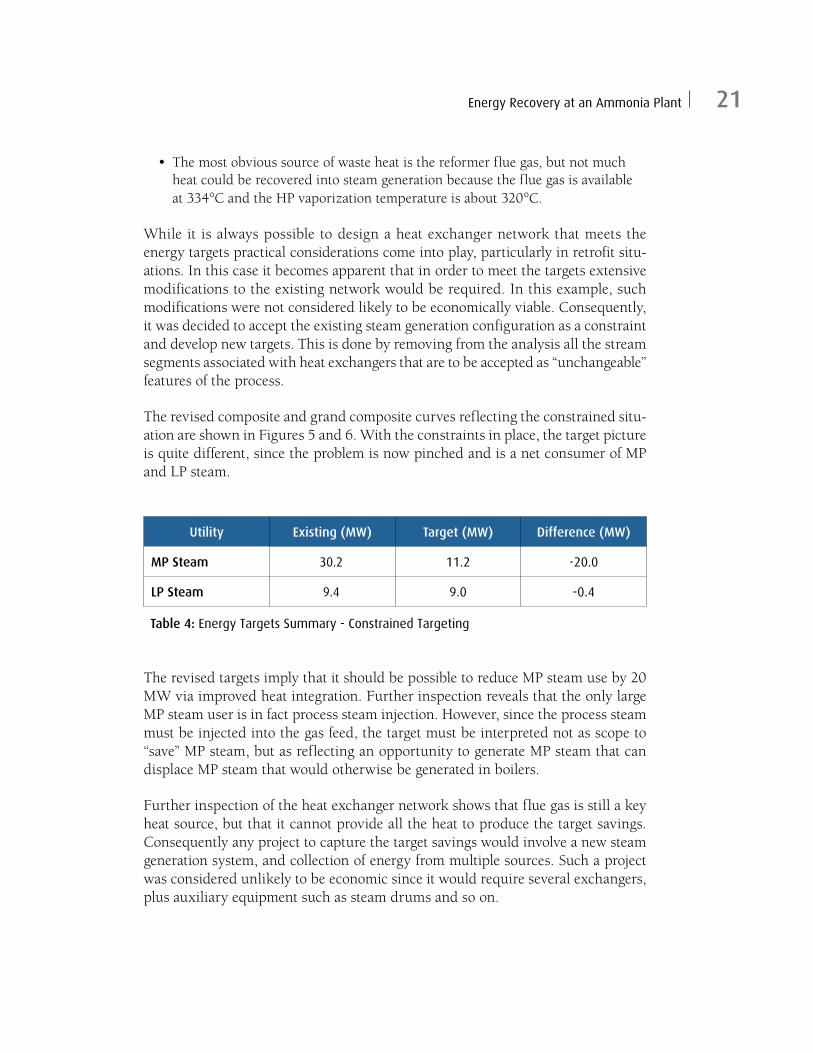
Utility Existing (MW) Target (MW) Difference (MW)
MP Steam 30 .2 11 .2 -20 .0
LP Steam 9 .4 9 .0 -0 .4
Table 4: Energy Targets Summary - Constrained Targeting

Pinch Analysis Application Example - Nitrogen-Based Fertilizer Industry22
Figure 6
Figure 7
Composite Curves for Ammonia Process (∆Tmin
= 20°C) - Constrained Case
Grand Composite Curve for Ammonia Process (∆Tmin
= 20°C) - Constrained Case
0.0 40.0 80.0 120.0 160.0 200.0
Enthalpy (MW)
Tem
pera
ture
(°C)
Cold composite curve
Hot composite curve
-200
200
400
600
800
1,000
1,200
0
0.0 10.0 20.0 30.0 40.0 50.0 70.060.0
Enthalpy (MW)
Tem
pera
ture
(°C)
Utility curve
Process curve
-200
200
400
600
800
1,000
1,200
0
Energy Recovery at an Ammonia Plant 23
In order to maximize heat recovery from the major heat source (i.e. flue gas) while keeping the resulting project fairly simple, the composite and grand composite curves can be used as a guide for identifying process modifications using the +/- principle. This principle recognizes that targets are modified when hot or cold streams are shifted relative to the pinch temperature.
ThecompositecurvesinFigure6showthatifthetemperatureatwhichprocesssteam is generated could be reduced, then it could be accomplished with a lower grade waste heat.
Inspection of the grand composite curve for the constrained case shows 2 major heat duties just above the pinch temperature, one corresponding to the CO
2 stripper
reboilerandtheothercorrespondingtoMPSteamassociatedwithprocesssteaminjection. If some of either of these 2 duties could be shifted to temperatures below the pinch then the targets would be reduced. The conditions in the CO
2 stripper
reboiler cannot be changed.
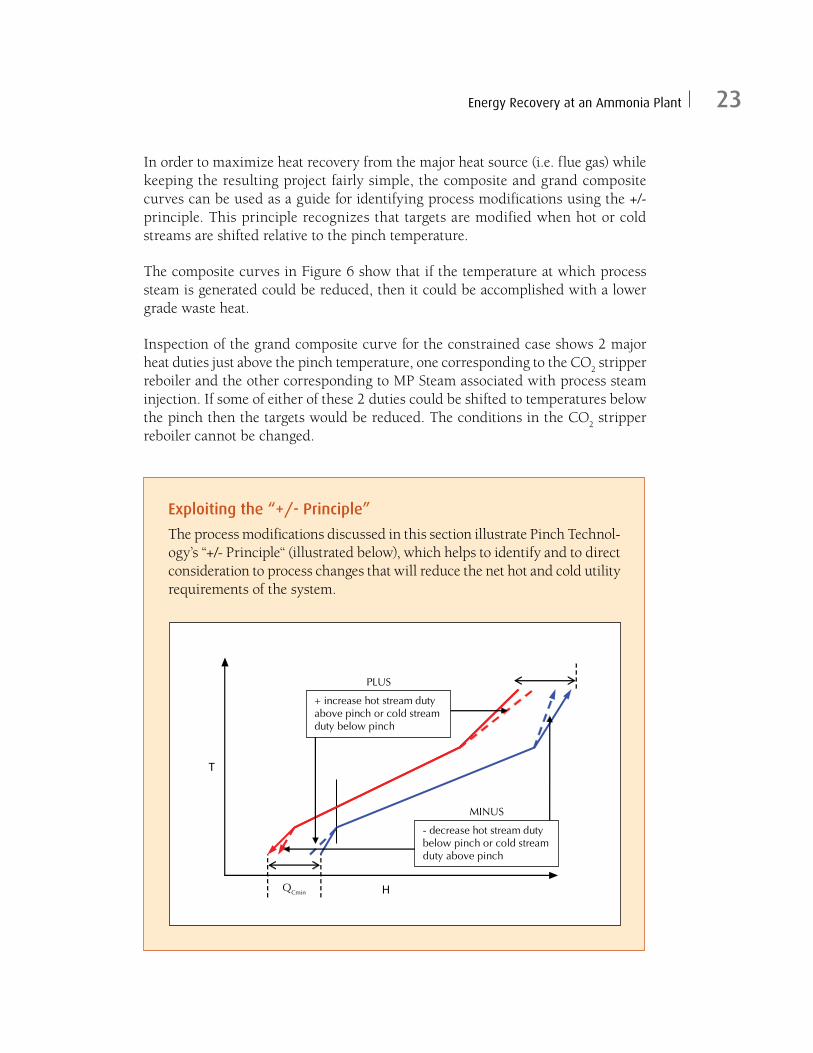
Exploiting the “+/- Principle”
The process modifications discussed in this section illustrate Pinch Technol-ogy’s “+/- Principle“ (illustrated below), which helps to identify and to direct consideration to process changes that will reduce the net hot and cold utility requirements of the system.
QCmin
T
H
PLUS
+ increase hot stream dutyabove pinch or cold streamduty below pinch
MINUS
- decrease hot stream duty below pinch or cold stream duty above pinch

Pinch Analysis Application Example - Nitrogen-Based Fertilizer Industry24
However,itispossibletoshiftsomeoftheMPprocesssteamdutybelowthepinchby taking advantage of the fact that water can be vaporized at lower temperatures if added directly to the process feed gas. This process, saturation, occurs because under these circumstances water vaporizes at lower partial pressure than it would asapurecomponent(i.e.steam).Sincethereformingprocesssimplyrequiresthepresence of water vapor in the feed gas in a fixed molar ratio, any water not added inthesaturationprocessandstillbeaddedbydirectsteaminjection.Furtherin-vestigationofthisopportunityshowsthatabout35%ofthetotalprocesssteamadditioncanbeaccomplishedviasaturation.Figure7showsthegrandcompositecurve for the saturation case.
Step 5: Consider alternative retrofit strategies and select the most promising one
Based on the Targeting analysis, the associated identification of cross-pinch heat transfer, and the site context, it was determined that, recovery of additional heat into superheat and feed gas saturation represented good opportunities, and that reformer flue gas was considered the primary heat source.
Figure 8 Grand Composite Curve Showing Impact of Saturator
0
-200
200
400
600
800
1,000
1,200
0.0 10.0 20.0 30.0 40.0 50.0 70.060.0
Enthalpy (MW)
Tem
pera
ture
(°C)
Utility curve
Process curve

Energy Recovery at an Ammonia Plant 25
In this Pinch example, the activity focused on the reformer flue gas, since the remainingcross-pinchheattransferisinsmallquantities(<2MW)invariousex-changers throughout the plant. As discussed earlier, its elimination was likely to require numerous equipment and piping changes. In many cases correcting the cross-pinchtransferwouldrequireaddingsurfaceareatoexistingservices.Suchopportunities, while potentially attractive, were considered to be secondary priori-ties, to be investigated further in subsequent work.
In most instances where energy is available in flue gas, a combustion air preheater can be considered as a project alternative that competes for the same waste heat, andsuchdeviceshavebeenincorporatedinammoniaplantdesigns.However,ina retrofit situation, combustion air preheat requires not only a large air – air ex-changer, but also significant modifications to the reformer (burner changes, new air ducting).
Further,inthisparticularcasethesaturatorprojectofferedenergyandsynergisticenvironmental benefits including:
• Reducedadditionofprocesssteamflowtothefeedgasduetothesaturatorinstallation.
• Reducedsteamflowtotheprocesscondensatestripperbecauseasignificantportion of the condensate is supplied to the saturator coil.
• Recycleofcondensatestripperoverheadscontainingammoniaandmethanol.
Overall the expected reduction in steam demand is about 30 T/h. This facilitates shutting down package boilers which currently supply 18 T/h of steam to the am-monia plant, with the balance of the savings coming from backing off auxiliary boiler firing.
Package Boiler Steam (kg/h)
Auxiliary Boiler Steam (kg/h)
Waste Heat Boiler
Steam (kg/h)
Total Steam (kg/h)
Steam to Condensing
Turbines (kg/h)
Base Case Base Base Base Base Base
Proposed Case -23,000 -7,000 Base -30,000 -7,000
Table 5: Impact of Selected Projects on Steam Generation

Pinch Analysis Application Example - Nitrogen-Based Fertilizer Industry26
Step 6: Define and economically evaluate projects to the selected strategy
In this Pinch example, the projects of most interest were:
• IncreasedHPsteamsuperheattemperature,and
• Installationofafeedgassaturatorandassociated.
Figure8showsasimplifiedschematicoftheoverallproject.
IncreasingtheHPsteamsuperheattemperaturerequirereplacingtheexistingsu-perheat coils with larger ones designed for the new, larger duty.
The saturator installation consisted of several key equipment items;
• Anewdesulfurizerfeed-effluentheatexchangerbecausedesulfurizationoccursathightemperature(275°C),whilethesaturatorfeedmustbecold.
• Anewsaturatorcoil.
• Aknock-outdrumtoremovecarry-overfromthesaturatorcoil.
• Apumptosupplyprocesscondensatetothesaturator.
• Associatedpipingandinstrumentationchanges.
Other Retrofit Opportunities
Application of Pinch Technology need not (and should not) preclude com-prehensive considerations of other energy- and cost-saving retrofit oppor-tunities. Veritech’s retrofit analysis of Ammonia Plants has identified (in addition to the Pinch-related opportunities discussed in this example) cost-effective projects in the areas such as:
• Combustionairpreheat
• Upgradingcompressorandturbineinternalstoimproveefficiency
• Processimprovements(LoheatBenfieldCO2Removal;Make-up
gas dehydration)

Energy Recovery at an Ammonia Plant 27
Note that since the saturator coil is downstream of the superheat coils, the design of the saturator coil is dependent on the design duty of the superheat coils. In an inte-grated system, this type of interaction is frequently encountered. Process Integration tools allow the designer to understand such interactions and design accordingly.
The resulting primary benefits include:
• Energyusereductionofapproximately2GJ/st
• Energycostsavingsof3.75millionCAN$/yr
• Totalsteamdemandreductionof30T/h
• Shutdownpackageboilers
•An 11% reduction in NOx, and CO
2 emissions from the site due to fuel savings
Theestimatedtotalcostfortheprojectis5.5millionCAN$,resultinginasimplepaybackof1.5yearsonthebasisofenergysavingsalone.
Figure 9 Schematic Diagram of Feed Gas Saturator and Superheat Increase Project
RadiantSection
HP Sat'd
Steam
HP SuperheatedSteam (482°C)
BF
To HPSteam Drum
Air Mixed Feed
36 bargProcess Steam
To ProcessCondensate Recovery
Fuel
Stack Temp.150°C
Air to Secondary Reformer
To SecondaryReformer
AuxiliaryBoiler
Process Condensate
Natural Gas Feed
New Feed GasSaturator Coil
EnlargedSuperheat Coils
AuxiliaryBoiler

Pinch Analysis Application Example - Nitrogen-Based Fertilizer Industry28
CONClUSIONS
The application of Pinch analysis can be carried out in a variety of ways and adapted to the specific process and site considerations being investigated. In retrofit applica-tions involving the Ammonia process, examination of the process-utility interac-tions is a key aspect of the analysis. Good knowledge of the process and its possible alternative configurations - together with the guidance and insights provided by the Composite and Grand Composite Curves - can identify economically attractive retrofit projects. Projects identified through the Pinch aalysis must be carefully evaluated in the context of site steam balance considerations to verify that the ex-pected energy savings will be realized.