Piloted Assessment of a Fault Diagnosis Algorithm on the ATTAS … · Piloted Assessment of a Fault...
21
American Institute of Aeronautics and Astronautics 092407 1 Piloted Assessment of a Fault Diagnosis Algorithm on the ATTAS Aircraft Murray L. Kerr * , Andrés Marcos † and Luis F. Peñin ‡ Deimos Space S.L., Madrid, 28760, Spain Oliver Brieger § Institute of Flight Systems, German Aerospace Center (DLR), 38108 Braunschweig, Germany Ian Postlethwaite ** , Matthew Turner †† Department of Engineering, University of Leicester, Leicester LE1 7RH, UK This paper describes the application of a fault diagnosis algorithm in a simulation campaign conducted with the Advanced Technologies Testing Aircraft (ATTAS). To provide a realistic fault scenario suitable for in-flight testing, the effects of actuator rate saturation were considered to be the result of faults acting on the ATTAS. Fault diagnosis algorithms were designed for these faults using H-infinity fault detection and isolation (FDI) filter synthesis tools and online thresholding algorithms. These fault diagnosis algorithms were assessed in an incremental validation campaign by first using the ATTAS high-fidelity nonlinear model, and then the German Aerospace Center (DLR) ATTAS flight simulator. In-flight data from previous flight campaigns investigating methods to alleviate rate saturation effects was used to assess the performance and robustness of the algorithms under real flight conditions. I. Nomenclature Δ = Norm bounded complex uncertainty 2 ⋅ = L 2 norm of the signal d = Disturbance f a = Actuator fault f ˆ , res = Fault estimate a f ˆ , a res = Actuator fault estimate F = FDI filter () ⋅ ⋅ , l F = Lower LFT interconnection () ⋅ ⋅ , u F = Upper LFT interconnection G = Generic vehicle model M = LFT interconnection of P and F, ( ) F P F M l , = n = Noise p, r = Body axis roll and yaw rate phi, beta = Bank angle and sideslip angle P , P = Generic plant in LFT interconnection * Senior Control Engineer, Deimos Space. [email protected]. † Senior Control Engineer, Deimos Space. ‡ Head of the Simulation and Control section, Deimos Space. Senior AIAA member. § Group Leader, Flight Test Manching, Ingolstadt/ Manching Airbase, AIAA Member. ** Pro-Vice Chancellor, Fielding Johnson Building, University Road, University of Leicester. †† Senior Lecturer, Department of Engineering, University of Leicester. AIAA Guidance, Navigation, and Control Conference 10 - 13 August 2009, Chicago, Illinois AIAA 2009-5760 Copyright © 2009 by Deimos Space S.L. Published by the American Institute of Aeronautics and Astronautics, Inc., with permission. Downloaded by BRISTOL UNIVERSITY on March 17, 2015 | http://arc.aiaa.org | DOI: 10.2514/6.2009-5760
Transcript of Piloted Assessment of a Fault Diagnosis Algorithm on the ATTAS … · Piloted Assessment of a Fault...

American Institute of Aeronautics and Astronautics
092407
1
Piloted Assessment of a Fault Diagnosis Algorithm on the ATTAS Aircraft
Murray L. Kerr*, Andrés Marcos† and Luis F. Peñin‡ Deimos Space S.L., Madrid, 28760, Spain
Oliver Brieger§ Institute of Flight Systems, German Aerospace Center (DLR), 38108 Braunschweig, Germany
Ian Postlethwaite**, Matthew Turner†† Department of Engineering, University of Leicester, Leicester LE1 7RH, UK
This paper describes the application of a fault diagnosis algorithm in a simulation campaign conducted with the Advanced Technologies Testing Aircraft (ATTAS). To provide a realistic fault scenario suitable for in-flight testing, the effects of actuator rate saturation were considered to be the result of faults acting on the ATTAS. Fault diagnosis algorithms were designed for these faults using H-infinity fault detection and isolation (FDI) filter synthesis tools and online thresholding algorithms. These fault diagnosis algorithms were assessed in an incremental validation campaign by first using the ATTAS high-fidelity nonlinear model, and then the German Aerospace Center (DLR) ATTAS flight simulator. In-flight data from previous flight campaigns investigating methods to alleviate rate saturation effects was used to assess the performance and robustness of the algorithms under real flight conditions.
I. Nomenclature Δ = Norm bounded complex uncertainty
2⋅ = L2 norm of the signal
d = Disturbance fa = Actuator fault f̂ , res = Fault estimate
af̂ , ares = Actuator fault estimate F = FDI filter
( )⋅⋅,lF = Lower LFT interconnection
( )⋅⋅,uF = Upper LFT interconnection G = Generic vehicle model M = LFT interconnection of P and F, ( )FPFM l ,= n = Noise p, r = Body axis roll and yaw rate phi, beta = Bank angle and sideslip angle P , P = Generic plant in LFT interconnection
* Senior Control Engineer, Deimos Space. [email protected]. † Senior Control Engineer, Deimos Space. ‡ Head of the Simulation and Control section, Deimos Space. Senior AIAA member. § Group Leader, Flight Test Manching, Ingolstadt/ Manching Airbase, AIAA Member. ** Pro-Vice Chancellor, Fielding Johnson Building, University Road, University of Leicester. †† Senior Lecturer, Department of Engineering, University of Leicester.
AIAA Guidance, Navigation, and Control Conference10 - 13 August 2009, Chicago, Illinois
AIAA 2009-5760
Copyright © 2009 by Deimos Space S.L. Published by the American Institute of Aeronautics and Astronautics, Inc., with permission.
Dow
nloa
ded
by B
RIS
TO
L U
NIV
ER
SIT
Y o
n M
arch
17,
201
5 | h
ttp://
arc.
aiaa
.org
| D
OI:
10.
2514
/6.2
009-
5760

American Institute of Aeronautics and Astronautics
092407
2
u = Plant input wa = Uncertainty input y = Plant output za = Uncertainty output
II. Introduction n-line fault diagnosis offers the ability to improve the reliability of a system during operation. Such capabilities form a critical part of on-line procedures for ensuring the safe operation of engineering systems and are
increasingly required in aeronautical and space vehicles. To provide on-line fault diagnosis capabilities for system hardware faults, subsystem monitoring (consistency checking) and hardware redundancy schemes are typically employed. Recently, model-based fault diagnosis algorithms have been receiving attention, particularly in the research community, as an alternative way to provide fault diagnosis capabilities (see, e.g. Ref.1). This work aims to evaluate the efficacy of model-based fault diagnosis algorithms by validating them in an operationally relevant context. For this the ATTAS vehicle operated by DLR in Braunschweig, Germany, is employed as a testbed for on-line fault diagnosis. In Ref.2 and Ref.3, the results from the Saturation Alleviation In-flight Experiment (SAIFE I and II) test campaigns performed during 2006 and 2007 are presented. The SAIFE flight campaign was performed on the ATTAS aircraft to assess the effectiveness of algorithms for the compensation of the effects of saturation, in particular anti-windup (AW) compensators. Hence the tests were devised in a way that the input constraints (actuator saturation levels) on the vehicle were violated. While actuator saturation is not a fault, the effects of saturation manifest themselves in an equivalent way to faults. Therefore, if the effects of saturation are considered to be those from faults acting on the system, the SAIFE III campaign, being conducted in 2008 and 2009, also offers the opportunity to assess the effectiveness of fault diagnosis algorithms in an operationally relevant, in-flight environment. Moreover, such fault diagnosis algorithms could be employed to provide estimates of the saturation (fault) level to serve as the input to the AW compensators. For the SAIFE III campaign, the ATTAS vehicle is considered with reduced aileron actuator rate limits and the testing is performed at two flight conditions: up-and-away (20000 ft) and landing approach. As demonstrated in Section III.B, considering the effects of saturation as fault effects provides a challenging fault diagnosis scenario within the SAIFE campaign, with the faults not known a priori and having intermittent, fast dynamical characteristics. In the SAIFE III campaign the testing of the fault diagnosis algorithms is performed in three successive stages, with all tests employing the same software implementation of the algorithms. The first step involves the validation of the algorithms on the ATTAS high-fidelity nonlinear model. The second step involves piloted simulator testing using the ATTAS flight simulator operated by DLR in Braunschweig, Germany. This is used for validation of the fault diagnosis algorithms and preparation for aircraft in-flight testing. The third step involves the final in-flight testing of the algorithms on the ATTAS vehicle, in a manner consistent with the procedures employed in SAIFE II (see Ref.2, Ref.3 and Section III.A). The latter two stages were to be performed in December of 2008. However, due to poor weather conditions on the test dates, the final in-flight tests could not be carried out and in view of the results presented in this paper, new flight tests within the SAIFE III campaign have been scheduled for the spring of 2009. Therefore, herein the results of the testing of the fault diagnosis algorithms on the first two stages are presented. In order to further validate the fault diagnosis algorithms in in-flight conditions, due to the postponement of the SAIFE III flight tests, it was decided to use also the flight data from the SAIFE II campaign in 2007 (Ref.3). These additional results are presented in the paper,‡‡ and with the fault diagnosis algorithm not affecting the response of the vehicle (no corrective action is taken based on the fault estimation) and cockpit and control hardware-in-the-loop ground simulator testing of the same algorithms providing assurance that the algorithms work in the hardware environment on the ATTAS, testing of the fault diagnosis algorithm offline on SAIFE II data represents a valid evaluation of the algorithm performance in in-flight conditions. To develop the fault diagnosis algorithm for the effective faults in the vehicle actuators, H-infinity FDI theory is employed. The resulting FDI filters are applied in concert with an online approach for thresholding of the fault estimations provided. H-infinity FDI theory is an established model-based FDI design approach and allows for the design of FDI filters that can provide detection, isolation and estimation of faults, while being insensitive to
‡‡ Note that this flight data was not used in the design or tuning of the FDI filter developed for SAIFE III.
O
Dow
nloa
ded
by B
RIS
TO
L U
NIV
ER
SIT
Y o
n M
arch
17,
201
5 | h
ttp://
arc.
aiaa
.org
| D
OI:
10.
2514
/6.2
009-
5760

American Institute of Aeronautics and Astronautics
092407
3
modelled system uncertainty levels (see, e.g. Ref.1). FDI filters designed using H-infinity FDI theory have been applied previously in the aeronautical and aerospace domains (Ref.4, Ref.5), but only a few of the published applications considered high-fidelity nonlinear simulation models (Ref.5, Ref.6) or in-flight testing (Ref.7). The work presented herein is similar to these latter works and serves to further evaluate the effectiveness of the H-infinity FDI theory, and more generally, model-based FDI for aeronautical systems. The paper is structured as follows. Section III presents the FDI problem considered, with details on the ATTAS vehicle and the fault scenario provided. Section IV details the design of the fault diagnosis algorithm using H-infinity FDI theory and an on-line fault thresholding algorithm. In Section V the results from the first two validation stages in the SAIFE III campaign are shown and analysed using suitable performance indices. Section VI presents the post-SAIFE III validation of the algorithms using the flight data from the 2007 SAIFE II campaign. Conclusions and future work are detailed in Section VII.
III. Problem Statement
A. ATTAS vehicle and flight testing The ATTAS (Advanced Technologies Testing Aircraft) is a highly modified VFW 614 aircraft that has been operated by DLR as testbed and in-flight simulator since 1986 (see Figure III-1 and Figure III-2). The ATTAS features various customized systems, such as an adaptive fly-by-wire flight control system, capable of hosting different controller designs, an experimental cockpit and extensive flight test instrumentation. The aircraft features safety pilot inceptors connected to a mechanical back-up system to allow in-flight assessment of flight control software without requiring extensive certification. In cases when flight safety may be compromised, the safety pilot can always override commands generated by the experimental control laws via the mechanical back-up system. Within the SAIFE flight test campaign, the aircraft is equipped with a passive side stick as primary control inceptor at the evaluation pilot’s station to facilitate high frequency, large amplitude inputs and potentially precipitate ‘bang-bang’ control.
Figure III-1 The ATTAS vehicle
(1) 10000 ft, Ma 0.3 / (2) 10000 ft, Ma 0.4 / (5) 20000 ft, Ma 0.4 / (6) 20000 ft, Ma 0.5 /
(8) pattern altitude, 135 kEAS
Figure III-2 Test points within the ATTAS envelope
Dow
nloa
ded
by B
RIS
TO
L U
NIV
ER
SIT
Y o
n M
arch
17,
201
5 | h
ttp://
arc.
aiaa
.org
| D
OI:
10.
2514
/6.2
009-
5760

American Institute of Aeronautics and Astronautics
092407
4
In the SAIFE I flight tests in 2006 both up-and-away (Flight conditions 1, 2, 3 and 6 in Figure III-2) and landing approach (Flight condition 8 in Figure III-2) flight conditions were tested. In the SAIFE II flight tests in 2007 only up-and-away flight conditions were tested. For the SAIFE III test campaign, testing was planned in three stages at both up-and-away and landing approach flight conditions: high-fidelity nonlinear simulation, piloted flight simulator testing and in-flight testing. As previously mentioned, the in-flight testing stage was postponed due to poor weather on the test dates and only the first two test stages were performed, with these results presented in Section V. Consistent with the previous SAIFE campaigns, the testing focused on the response of the vehicle in the roll axis. The testing evaluated both anti-windup compensator and FDI filter effectiveness, the latter the topic of this paper. In both cases, the software imposed aileron rate limits were severely reduced so as to provide a vehicle with degraded handling qualities. For the up-and-away flight conditions, the rate limits were reduced to 50% of the full authority values and for the landing approach task, 60% of the full authority values. For the up-and-away flight condition, two evaluation tasks were conducted, one being the Handling Qualities During Tracking (HQDT) technique and the other being a birdy target tracking task. The HQDT technique is specifically designed to evaluate PIO susceptibility and involves in this case successive bank angle captures where the pilot flies in a manner designed to expose PIO tendencies. The tracking task requires the pilot to track closely a generic birdy (aircraft symbol) projected onto the main head down display. The birdy performs a predefined sequence of ramp and step-type roll attitude changes, requiring the pilot to perform and assess gross acquisition and fine tracking. For the landing approach flight condition, offset landings were performed to evaluate the effectiveness of the algorithms during this operationally relevant landing-approach phase of flight. For these landings, the aircraft was reconfigured with flaps set to 14 deg and the landing gear extended. The pilot was asked to establish a nominal approach flight path on the active runway with an initial 200 m lateral offset to the runway centreline. When passing through 500 ft AGL (Above Ground Level) the pilot was required to aggressively capture the runway centreline and acquire the nominal flight path to attempt to hit a specified touch down point within the desired touch down zone marked on the runway. More details on the testing procedures can be found in Ref.2. Due to the postponement of the in-flight test stage in the SAIFE III campaign, it was decided to test the fault diagnosis algorithm on in-flight data from the 2007 SAIFE II campaign (Ref.3). These results are presented in Section VI. Table III-1 summarizes the flight test conditions and test stages presented in this paper
Table III-1 FDI test conditions
Flight condition Nonlinear simulation Ground test In-flight test1
FC6 (Mach 0.5, 20000 ft) X X X FC8 (135 kEAS, 1000 ft) X X
1 – Data from SAIFE II flight test in 2007.
B. Fault Scenario One of the difficulties in testing fault diagnosis algorithms in realistic flight conditions is the inability to induce true faults in the systems on the vehicle. Typically a signal generator is used to introduce fictitious faults in the form of combinations of steps, ramps and/or sinusoidal signals. Rather than employ this approach, the choice in this work was to take an existing feature of the vehicle behaviour during the SAIFE tests and consider this as a faulted system behaviour. Here actuator saturation effects were considered to be the effects of faults acting on the vehicle’s actuators and the resulting FDI problem is to perform fault diagnosis on these effective faults. In the SAIFE campaigns the ATTAS aileron rate limits are artificially reduced in the flight control software. During the roll-axis tasks described in the previous section, this effectively makes rate saturation in the software limits (SWL) the only actuator nonlinearity acting on the system. The key features of the pilot-vehicle system can then be described as shown in Figure III-3. Here the hardware limits (HWL) are redundant, with only their linear dynamics active, and within the SWL the only active nonlinearity is rate saturation, here modelled as a first order feedback system with saturation, as is implemented in the ATTAS software for the SAIFE tests.
Dow
nloa
ded
by B
RIS
TO
L U
NIV
ER
SIT
Y o
n M
arch
17,
201
5 | h
ttp://
arc.
aiaa
.org
| D
OI:
10.
2514
/6.2
009-
5760

American Institute of Aeronautics and Astronautics
092407
5
Pilot VehicleDynamics
PrimaryControl Law H 1/s
SWL
HWLsat
Figure III-3 Closed loop pilot-vehicle system with software rate limited actuators.
The concept that underpins the present FDI problem is that this pilot-vehicle system subject to rate saturation can be converted into an equivalent pilot-vehicle system, where the effects of rate saturation have been isolated to a feed-forward path parallel to that of the unsaturated linear actuator dynamics. This equivalent system is depicted in Figure III-4 and can be generated from Figure III-3 by basic signal flow manipulations§§. Considering this representation of the system, when the rate saturation limits are not active, the system behaves without any effect from the upper feed-forward path in Figure III-4. However, when rate saturation is active, the actuation level of the ATTAS vehicle is a combination of the ideal control signal that would arise without saturation active on the control command uid and the signal fu capturing the effects on the combination of SWL and the inactive HWL (linear dynamics). It is this signal fu, that captures the departure from linear actuator behaviour, that is considered to be the effect of a fault acting on the vehicle’s actuator. For the purposes of testing fault diagnosis algorithms, this is sufficient to provide a realistic fault scenario that is also challenging, due to the intermittent and fast dynamical characteristics of the fault signal. This also provides faults that are a priori unknown, which would be the case in any true fault scenario, and therefore prohibits tuning of the fault diagnosis algorithms for a specific fault dynamic. Remark: It is evident from Figure III-4 that the effective fault signal is a nonlinear function of the commanded control signal from the vehicle controller u, with dzn being the deadzone operator, having a deadzone size equal to the rate limit level of the actuator. This setup is not a true fault scenario, but such fault scenarios cannot be tested in flight due to obvious safety reasons. However, it is true that the control signal sent to the vehicle can be separated into that which would ideally be commanded if no saturation were occurring (linear behaviour) and the effect of saturation. Hence, while this is not a fault on the system in the true sense, as mentioned earlier, its affects are equivalent to that of a fault and therefore the resulting FDI problem does provide a fault diagnosis problem with characteristics similar to those in a true fault scenario. For instance, the present degradation in rate limits could arise from a loss of hydraulic power and the effects of this fault would be dependent on the commands sent to the actuator. Remark: As the effects of rate saturation are introduced in the software, they can be measured and recorded, which allows the performance of the FDI algorithm to be accurately determined.
Pilot VehicleDynamicsLinear ActuatorPrimary
Control Law
H/(s+H)
1/(s+H)sH/(s+H)
-
uid
effectivefault
faultdynamics
fu
u
u d
y
url
-
HWL
HWL
dzn
Figure III-4 Equivalent representation of the closed loop pilot-vehicle system with the effects of saturation
shown as an effective fault acting on the control command at the output of the HWL. For the SAIFE testing the aileron actuators are primarily excited and it is their rate limits that are artificially degraded. If one assumes that the lateral and longitudinal vehicle dynamics are decoupled, the fault scenario is then
§§ Similar representations are now standard in the representation of the anti-windup control problem (see, e.g. Ref.8).
Dow
nloa
ded
by B
RIS
TO
L U
NIV
ER
SIT
Y o
n M
arch
17,
201
5 | h
ttp://
arc.
aiaa
.org
| D
OI:
10.
2514
/6.2
009-
5760
American Institute of Aeronautics and Astronautics
092407
6
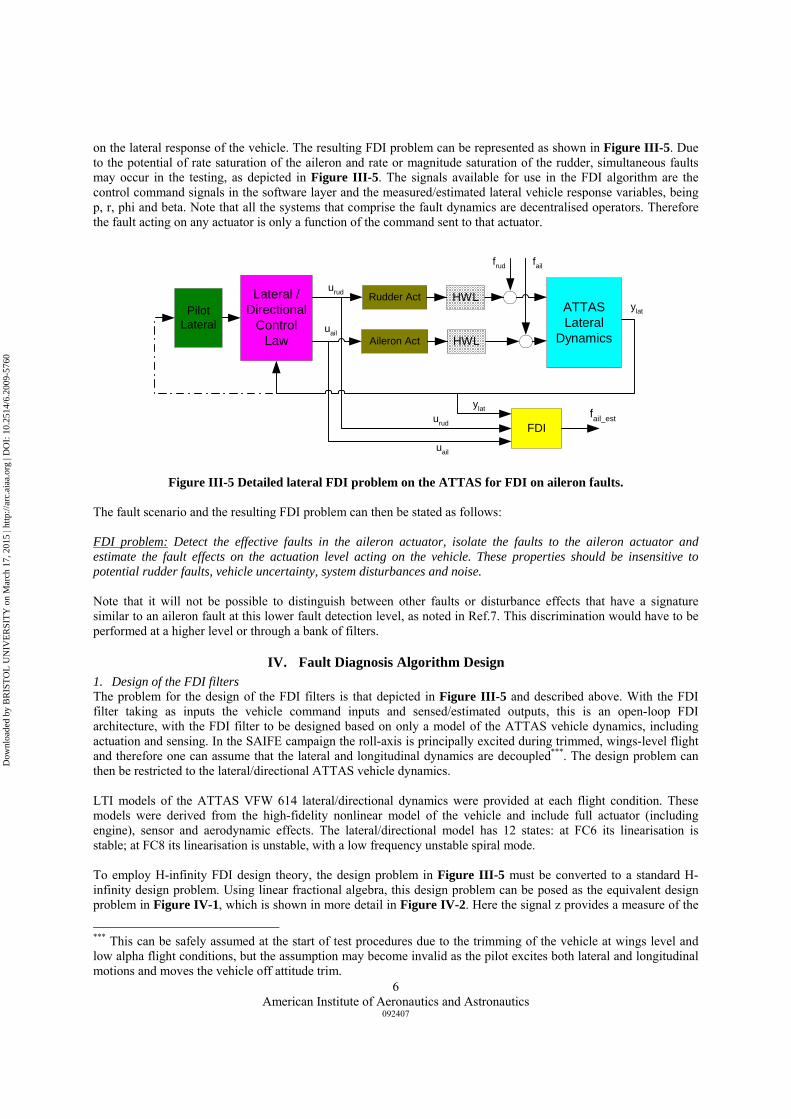
on the lateral response of the vehicle. The resulting FDI problem can be represented as shown in Figure III-5. Due to the potential of rate saturation of the aileron and rate or magnitude saturation of the rudder, simultaneous faults may occur in the testing, as depicted in Figure III-5. The signals available for use in the FDI algorithm are the control command signals in the software layer and the measured/estimated lateral vehicle response variables, being p, r, phi and beta. Note that all the systems that comprise the fault dynamics are decentralised operators. Therefore the fault acting on any actuator is only a function of the command sent to that actuator.
PilotLateral
ATTASLateral
DynamicsAileron Act
Lateral /Directional
ControlLaw
FDI
Rudder Act
fail_est
uail
urud
ylat
ylat
uail
urud
frud fail
HWL
HWL
Figure III-5 Detailed lateral FDI problem on the ATTAS for FDI on aileron faults. The fault scenario and the resulting FDI problem can then be stated as follows: FDI problem: Detect the effective faults in the aileron actuator, isolate the faults to the aileron actuator and estimate the fault effects on the actuation level acting on the vehicle. These properties should be insensitive to potential rudder faults, vehicle uncertainty, system disturbances and noise. Note that it will not be possible to distinguish between other faults or disturbance effects that have a signature similar to an aileron fault at this lower fault detection level, as noted in Ref.7. This discrimination would have to be performed at a higher level or through a bank of filters.
IV. Fault Diagnosis Algorithm Design 1. Design of the FDI filters The problem for the design of the FDI filters is that depicted in Figure III-5 and described above. With the FDI filter taking as inputs the vehicle command inputs and sensed/estimated outputs, this is an open-loop FDI architecture, with the FDI filter to be designed based on only a model of the ATTAS vehicle dynamics, including actuation and sensing. In the SAIFE campaign the roll-axis is principally excited during trimmed, wings-level flight and therefore one can assume that the lateral and longitudinal dynamics are decoupled***. The design problem can then be restricted to the lateral/directional ATTAS vehicle dynamics. LTI models of the ATTAS VFW 614 lateral/directional dynamics were provided at each flight condition. These models were derived from the high-fidelity nonlinear model of the vehicle and include full actuator (including engine), sensor and aerodynamic effects. The lateral/directional model has 12 states: at FC6 its linearisation is stable; at FC8 its linearisation is unstable, with a low frequency unstable spiral mode. To employ H-infinity FDI design theory, the design problem in Figure III-5 must be converted to a standard H-infinity design problem. Using linear fractional algebra, this design problem can be posed as the equivalent design problem in Figure IV-1, which is shown in more detail in Figure IV-2. Here the signal z provides a measure of the
*** This can be safely assumed at the start of test procedures due to the trimming of the vehicle at wings level and low alpha flight conditions, but the assumption may become invalid as the pilot excites both lateral and longitudinal motions and moves the vehicle off attitude trim.
Dow
nloa
ded
by B
RIS
TO
L U
NIV
ER
SIT
Y o
n M
arch
17,
201
5 | h
ttp://
arc.
aiaa
.org
| D
OI:
10.
2514
/6.2
009-
5760
American Institute of Aeronautics and Astronautics
092407
7
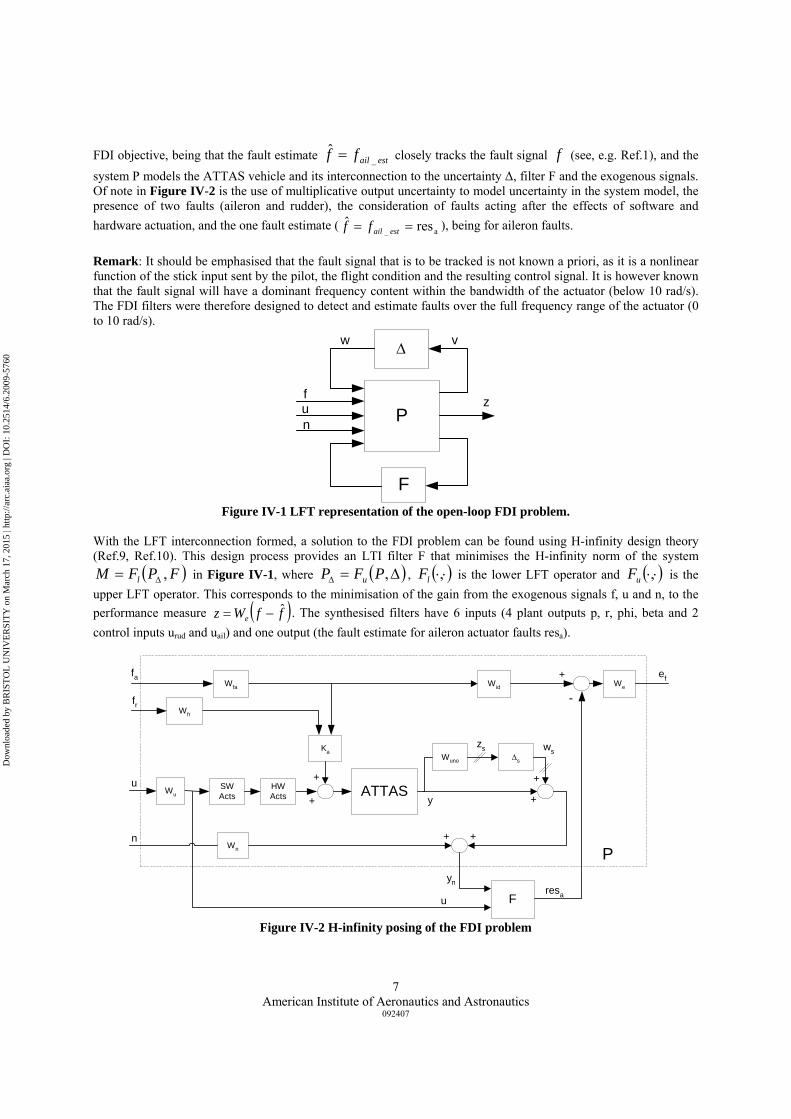
FDI objective, being that the fault estimate estailff _ˆ = closely tracks the fault signal f (see, e.g. Ref.1), and the
system P models the ATTAS vehicle and its interconnection to the uncertainty Δ, filter F and the exogenous signals. Of note in Figure IV-2 is the use of multiplicative output uncertainty to model uncertainty in the system model, the presence of two faults (aileron and rudder), the consideration of faults acting after the effects of software and hardware actuation, and the one fault estimate ( a_ resˆ == estailff ), being for aileron faults. Remark: It should be emphasised that the fault signal that is to be tracked is not known a priori, as it is a nonlinear function of the stick input sent by the pilot, the flight condition and the resulting control signal. It is however known that the fault signal will have a dominant frequency content within the bandwidth of the actuator (below 10 rad/s). The FDI filters were therefore designed to detect and estimate faults over the full frequency range of the actuator (0 to 10 rad/s).
w vΔ
Pu z
F
f
n
Figure IV-1 LFT representation of the open-loop FDI problem.
With the LFT interconnection formed, a solution to the FDI problem can be found using H-infinity design theory (Ref.9, Ref.10). This design process provides an LTI filter F that minimises the H-infinity norm of the system
( )FPFM l ,Δ= in Figure IV-1, where ( )Δ=Δ ,PFP u , ( )⋅⋅,lF is the lower LFT operator and ( )⋅⋅,uF is the upper LFT operator. This corresponds to the minimisation of the gain from the exogenous signals f, u and n, to the performance measure ( )ffWz e
ˆ−= . The synthesised filters have 6 inputs (4 plant outputs p, r, phi, beta and 2 control inputs urud and uail) and one output (the fault estimate for aileron actuator faults resa).
ATTAS
Wuno Δs
Wid We
Ka
F
Wn
u
fa
fr
n
yn
u
y
ef
resa
zs ws
+ +
+
+ +
+
+
-
P
Wfr
SWActs
Wfa
WuHWActs
Figure IV-2 H-infinity posing of the FDI problem
Dow
nloa
ded
by B
RIS
TO
L U
NIV
ER
SIT
Y o
n M
arch
17,
201
5 | h
ttp://
arc.
aiaa
.org
| D
OI:
10.
2514
/6.2
009-
5760

American Institute of Aeronautics and Astronautics
092407
8
2. Design of the online thresholding algorithm The fault estimate provided by the designed FDI filter should be an accurate estimate of the fault, but due to uncertainty it cannot be perfectly decoupled from the effects of the exogenous signals on the system, with noise, control commands and disturbances all coupling to the fault estimate. Given this, to provide a fault diagnostic signal that does not provide significant false fault detections, it was chosen to process the fault estimate signal through an on-line fault thresholding algorithm. The features of the algorithm are shown in Figure IV-3, which shows its implementation in Simulink. The algorithm is similar to that implemented in Ref.7 (see also Ref.1, Section 2.12). Here a filter “Filter_u_e” has been designed to capture the coupling effects from control actuation commands on the fault estimate. This was designed based on observed nonlinear simulation coupling levels. Including a factor to account for known noise levels, these two signals are added and compared to the absolute value of the fault estimate signal provided by the FDI filter to determine if a fault is deemed active. The present approach is conservative, as it disregards any phase information and assumes the worst phase relationship between signals. However, it was considered to be a suitable on-line thresholding approach that could be improved if deemed necessary.
Figure IV-3 Fault estimate post-processing logic
3. Algorithm implementation The complete fault diagnosis algorithm therefore comprises two parts: the FDI filter that provides a fault estimate based on the measured ATTAS vehicle inputs and outputs; and an on-line fault thresholding algorithm that determines if a fault is active based on the relative absolute values of the fault estimates and an estimate of the coupling from control commands and noise to the fault estimate. The designed FDI filters are of an order equal to the vehicle model and weighting filters shown in Figure IV-2, being 26th order. For implementation purposes, these were reduced to 9th or 11th order using standard Hankel reduction techniques (Ref.10). The fault estimation post-processing required additional processing, with the order of the filters employed being 12th order and several summation, absolute value and comparison operators employed. The nonlinear simulation, ground simulator testing and the flight testing is all performed with a sample period of 0.03 seconds. Recording of all the relevant signals can be done in flight and in the flight simulator using the same software configuration.
V. Performance Evaluation As mentioned previously, the designed fault diagnosis algorithm was only assessed within the SAIFE III campaign using the first two validation stages: high-fidelity nonlinear simulation and piloted flight simulator testing (The post-SAIFE III results using existing in-flight data from the SAIFE II flight testing are presented in the subsequent section). In all stages the same software implementation of the algorithm is employed, with the flight simulator testing ensuring the algorithms work in the hardware environment on the ATTAS. Table III-1 summarises the flight conditions and test stages employed. To analyse the performance of the fault diagnosis algorithm for these test stages, performance metrics are employed, as described in the proceeding section.
Dow
nloa
ded
by B
RIS
TO
L U
NIV
ER
SIT
Y o
n M
arch
17,
201
5 | h
ttp://
arc.
aiaa
.org
| D
OI:
10.
2514
/6.2
009-
5760

American Institute of Aeronautics and Astronautics
092407
9
Remark: In most of the testing performed, anti-windup compensators were also engaged to compensate the effects of saturation (see for example Ref.3). This was performed in a manner independent of the fault diagnosis algorithm and without effecting the algorithm implementation; the fault diagnosis algorithm was passed the aileron and rudder actuator commands determined by the control algorithm, including any modifications to this command due to anti-windup compensation.
C. Statistical Results Analysis To assess the effectiveness and robustness of the designed FDI filters, statistical measures of the FDI results are employed. Using these measures of performance, the results of the tests can be summarised as in the tables in the proceeding sections. The following indices are employed for fault detection (FD): True detection rate: Percentage of the time the algorithm declares a fault is active when the fault is active. False detection rate: Percentage of the time a fault is incorrectly declared when the algorithm declares a fault is active. The following indices are employed for fault estimation (FE): True energy ratio: Percentage of the energy in the fault estimate relative to the fault when the fault is active.
( ) 10022_ ×ailestail ff
False energy ratio: Percentage of the energy of the fault estimate corresponding to a false detection. ( ) 100
2_2__ ×estailfalseestail ff
Mean estimation error (not normalised): Average error between the fault and fault estimate signals over the full time period of the test. These metrics provide an indication of the performance of the fault diagnosis algorithm. The true detection rate and false detection rate provide an indication of the fault coverage and the amount of false alarms, respectively. As the faults that are active in the present testing are not introduced but rather are dependent on the piloting actions, it is necessary to choose a fault level below which no fault is deemed active, else, as the fault signal is asymptotically decaying to zero, the fault will be deemed active for all the time beyond the first fault time (This fault level is independent of the thresholding for FDI). Here this fault level was chosen to be 0.1 degrees, which is the approximate level of the noise in the sensed measurements. Hence, for the calculation of the performance metrics, the fault is deemed active when the fault effect is above 0.1 degrees. To further provide an indication of the fault coverage, the true detection rate is calculated for three levels of fault strengths; above the 0.1 degree threshold, above a threshold of 1 degree and above a threshold of 5 degrees. The corresponding rates indicate the level of fault coverage for faults of increasing severity. In addition to detection, it is important to determine the accuracy of the fault estimate. As the fault signal is not of a consistent dynamical characteristic, is it not easy to develop metrics indicating how well the fault is estimated. Here two approaches were employed. One considers the relative levels of the energy of the fault estimate signal and the fault signal, and the other the average error between the fault estimate and the fault signal. As the fault is not of a constant strength, it is not possible to normalise the latter metric. It should be noted that the fault estimate is deemed to be false if it is active (non-zero) when the fault is deemed inactive (below 0.1 degrees here). This determination does however tend to overestimate the level of false estimates, as the small time delay between the fault and fault estimation signals leads to true estimates being deemed false estimates for short periods of time. Remark: The comparison of the energy level between the fault signal and the fault estimate signal is considered to be an effective metric. One does not desire false alarms, but when they do occur, the energy in the erroneous fault estimate should be small, and it is this difference that the metric highlights. Hence one could have only a 50% true detection rate, but if the detection is always performed when the fault effects are large, the fault estimate is performing well (Note that fault detection of faults of all strengths is not feasible given the need to desensitise the fault estimate to noise and disturbance effects). Remark: With the fault effects different for each test case, due to the different pilot inputs, it is not possible to directly compare the results between test conditions. This is especially the case between the testing at different flight
Dow
nloa
ded
by B
RIS
TO
L U
NIV
ER
SIT
Y o
n M
arch
17,
201
5 | h
ttp://
arc.
aiaa
.org
| D
OI:
10.
2514
/6.2
009-
5760

American Institute of Aeronautics and Astronautics
092407
10
conditions, e.g. FC6 and FC8, with the dynamical properties of the vehicle being quite different and at FC8 an offset landing approach was employed in the testing, which places different requirements on the pilot-vehicle system to the procedures employed at FC6 (see Section III.A).
D. ATTAS High-Fidelity Nonlinear Simulation Validation Here the results from the application of the fault diagnosis algorithm to the high-fidelity nonlinear simulation model of the ATTAS vehicle operating at the different flight conditions are presented. This nonlinear simulation environment was developed by DLR and includes the full nonlinear vehicle dynamics, detailed aerodynamic models, aerosurface actuation models and engine models. For each flight condition the vehicle, including engine and aerosurface actuators, is initialized and trimmed before simulation is performed. No sensor noise, winds or disturbances are included. All testing is done starting at the appropriate trimmed flight condition, either at the landing approach condition (FC8) or the up-and-away flight condition (FC6), with the in-flight test procedures performed using a simple proportional gain pilot model to close the loop. The results from this testing at FC6 are summarised in Table V-1. To show that the fault diagnosis algorithm operates independently to the fault levels and control signals, here testing was done with the software rate limits (RL) set at 30%, 50% and 75% of the full authority levels in the hardware limits. Figure V-1, Figure V-2 and Figure V-3 provide an indication of the results obtained during this testing, with the fault estimate after thresholding shown, along with the fault signal, for the pilot-vehicle system performing the birdy tracking task. The displayed results show that for all three cases the fault estimate is very accurate, with minimal false alarms and some missed faults. However, as indicated by the performance indices, the missed faults correspond to faults with small fault strengths (energy levels), with the true energy ratio always close to 100% and therefore the energy in the fault estimation is very close to that of the fault.
Table V-1 Nonlinear simulation performance indices at FC6
Nonlinear simulation
Time Domain FD Performance Time Domain Fault Estimation Performance Sim Case True
detection rate
False detection
rate
True energy
ratio
False energy
ratio
Mean Estimation
error RL 30% 81.85 % 0.15 % 99.00 % 0.25 % 1.75 deg RL 50% 68.05 % 0.41 % 99.44 % 1.18 % 1.72 deg RL 75% 47.09 % 1.17 % 99.72 % 1.72 % 1.70 deg
Dow
nloa
ded
by B
RIS
TO
L U
NIV
ER
SIT
Y o
n M
arch
17,
201
5 | h
ttp://
arc.
aiaa
.org
| D
OI:
10.
2514
/6.2
009-
5760

American Institute of Aeronautics and Astronautics
092407
11
Figure V-1 Fault diagnosis algorithm applied to nonlinear model at FC6 with 75% rate limits.
Figure V-2 Fault diagnosis algorithm applied to nonlinear model at FC6 with 50% rate limits.
Dow
nloa
ded
by B
RIS
TO
L U
NIV
ER
SIT
Y o
n M
arch
17,
201
5 | h
ttp://
arc.
aiaa
.org
| D
OI:
10.
2514
/6.2
009-
5760
American Institute of Aeronautics and Astronautics
092407
12
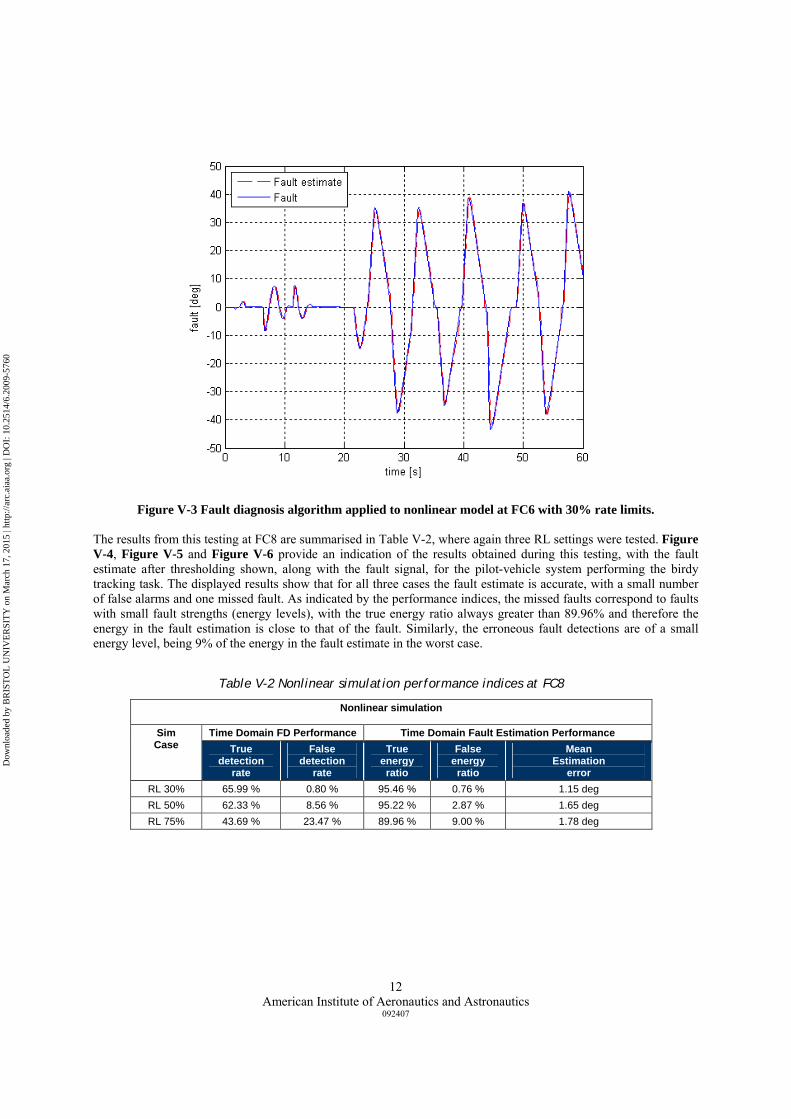
Figure V-3 Fault diagnosis algorithm applied to nonlinear model at FC6 with 30% rate limits. The results from this testing at FC8 are summarised in Table V-2, where again three RL settings were tested. Figure V-4, Figure V-5 and Figure V-6 provide an indication of the results obtained during this testing, with the fault estimate after thresholding shown, along with the fault signal, for the pilot-vehicle system performing the birdy tracking task. The displayed results show that for all three cases the fault estimate is accurate, with a small number of false alarms and one missed fault. As indicated by the performance indices, the missed faults correspond to faults with small fault strengths (energy levels), with the true energy ratio always greater than 89.96% and therefore the energy in the fault estimation is close to that of the fault. Similarly, the erroneous fault detections are of a small energy level, being 9% of the energy in the fault estimate in the worst case.
Table V-2 Nonlinear simulation performance indices at FC8
Nonlinear simulation
Time Domain FD Performance Time Domain Fault Estimation Performance Sim Case True
detection rate
False detection
rate
True energy
ratio
False energy
ratio
Mean Estimation
error RL 30% 65.99 % 0.80 % 95.46 % 0.76 % 1.15 deg RL 50% 62.33 % 8.56 % 95.22 % 2.87 % 1.65 deg RL 75% 43.69 % 23.47 % 89.96 % 9.00 % 1.78 deg
Dow
nloa
ded
by B
RIS
TO
L U
NIV
ER
SIT
Y o
n M
arch
17,
201
5 | h
ttp://
arc.
aiaa
.org
| D
OI:
10.
2514
/6.2
009-
5760

American Institute of Aeronautics and Astronautics
092407
13
Figure V-4 Fault diagnosis algorithm applied to nonlinear model at FC8 with 75% rate limits.
Figure V-5 Fault diagnosis algorithm applied to nonlinear model at FC8 with 50% rate limits.
Dow
nloa
ded
by B
RIS
TO
L U
NIV
ER
SIT
Y o
n M
arch
17,
201
5 | h
ttp://
arc.
aiaa
.org
| D
OI:
10.
2514
/6.2
009-
5760

American Institute of Aeronautics and Astronautics
092407
14
Figure V-6 Fault diagnosis algorithm applied to nonlinear model at FC8 with 30% rate limits.
Dow
nloa
ded
by B
RIS
TO
L U
NIV
ER
SIT
Y o
n M
arch
17,
201
5 | h
ttp://
arc.
aiaa
.org
| D
OI:
10.
2514
/6.2
009-
5760
American Institute of Aeronautics and Astronautics
092407
15
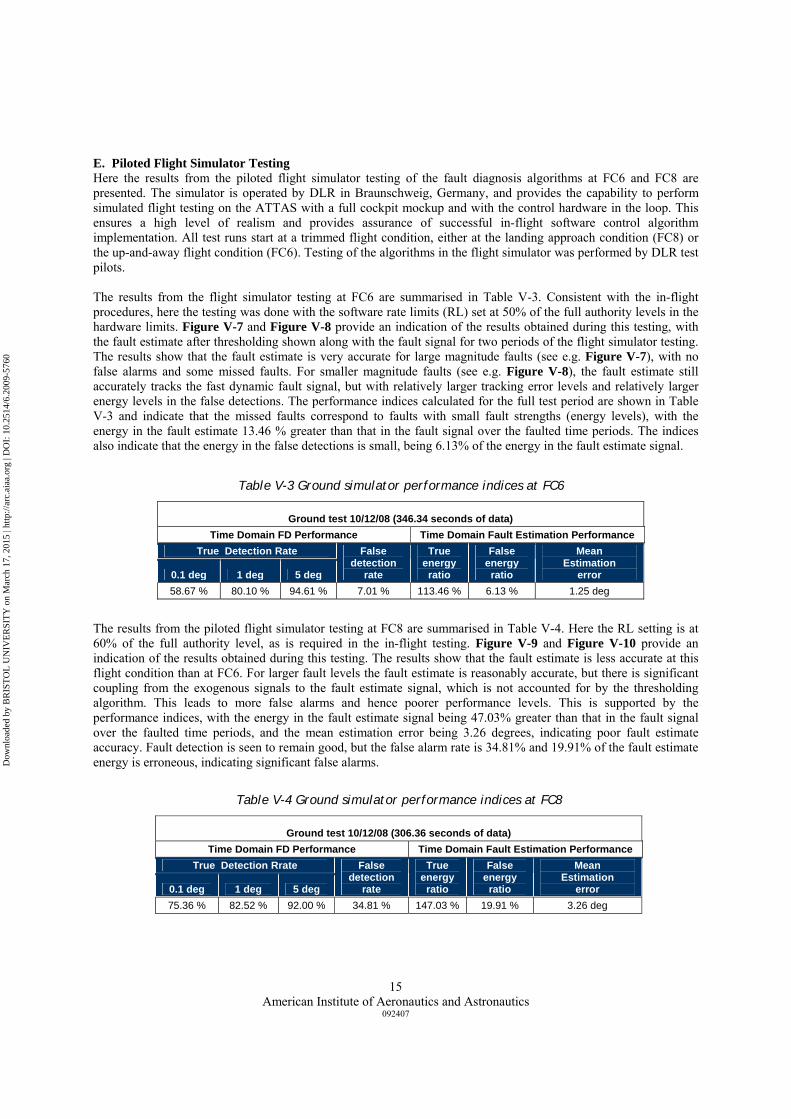
E. Piloted Flight Simulator Testing Here the results from the piloted flight simulator testing of the fault diagnosis algorithms at FC6 and FC8 are presented. The simulator is operated by DLR in Braunschweig, Germany, and provides the capability to perform simulated flight testing on the ATTAS with a full cockpit mockup and with the control hardware in the loop. This ensures a high level of realism and provides assurance of successful in-flight software control algorithm implementation. All test runs start at a trimmed flight condition, either at the landing approach condition (FC8) or the up-and-away flight condition (FC6). Testing of the algorithms in the flight simulator was performed by DLR test pilots. The results from the flight simulator testing at FC6 are summarised in Table V-3. Consistent with the in-flight procedures, here the testing was done with the software rate limits (RL) set at 50% of the full authority levels in the hardware limits. Figure V-7 and Figure V-8 provide an indication of the results obtained during this testing, with the fault estimate after thresholding shown along with the fault signal for two periods of the flight simulator testing. The results show that the fault estimate is very accurate for large magnitude faults (see e.g. Figure V-7), with no false alarms and some missed faults. For smaller magnitude faults (see e.g. Figure V-8), the fault estimate still accurately tracks the fast dynamic fault signal, but with relatively larger tracking error levels and relatively larger energy levels in the false detections. The performance indices calculated for the full test period are shown in Table V-3 and indicate that the missed faults correspond to faults with small fault strengths (energy levels), with the energy in the fault estimate 13.46 % greater than that in the fault signal over the faulted time periods. The indices also indicate that the energy in the false detections is small, being 6.13% of the energy in the fault estimate signal.
The results from the piloted flight simulator testing at FC8 are summarised in Table V-4. Here the RL setting is at 60% of the full authority level, as is required in the in-flight testing. Figure V-9 and Figure V-10 provide an indication of the results obtained during this testing. The results show that the fault estimate is less accurate at this flight condition than at FC6. For larger fault levels the fault estimate is reasonably accurate, but there is significant coupling from the exogenous signals to the fault estimate signal, which is not accounted for by the thresholding algorithm. This leads to more false alarms and hence poorer performance levels. This is supported by the performance indices, with the energy in the fault estimate signal being 47.03% greater than that in the fault signal over the faulted time periods, and the mean estimation error being 3.26 degrees, indicating poor fault estimate accuracy. Fault detection is seen to remain good, but the false alarm rate is 34.81% and 19.91% of the fault estimate energy is erroneous, indicating significant false alarms.
Table V-3 Ground simulator performance indices at FC6
Ground test 10/12/08 (346.34 seconds of data) Time Domain FD Performance Time Domain Fault Estimation Performance
True Detection Rate
0.1 deg 1 deg 5 deg
False detection
rate
True energy
ratio
False energy
ratio
Mean Estimation
error 58.67 % 80.10 % 94.61 % 7.01 % 113.46 % 6.13 % 1.25 deg
Table V-4 Ground simulator performance indices at FC8
Ground test 10/12/08 (306.36 seconds of data) Time Domain FD Performance Time Domain Fault Estimation Performance
True Detection Rrate
0.1 deg 1 deg 5 deg
False detection
rate
True energy
ratio
False energy
ratio
Mean Estimation
error 75.36 % 82.52 % 92.00 % 34.81 % 147.03 % 19.91 % 3.26 deg
Dow
nloa
ded
by B
RIS
TO
L U
NIV
ER
SIT
Y o
n M
arch
17,
201
5 | h
ttp://
arc.
aiaa
.org
| D
OI:
10.
2514
/6.2
009-
5760

American Institute of Aeronautics and Astronautics
092407
16
Figure V-7 Example of fault diagnosis algorithm applied to flight simulator at FC6 with 50% rate limits for large fault levels.
Figure V-8 Example of fault diagnosis algorithm applied to flight simulator at FC6 with 50% rate limits for small fault levels.
Dow
nloa
ded
by B
RIS
TO
L U
NIV
ER
SIT
Y o
n M
arch
17,
201
5 | h
ttp://
arc.
aiaa
.org
| D
OI:
10.
2514
/6.2
009-
5760

American Institute of Aeronautics and Astronautics
092407
17
Figure V-9 Example of fault diagnosis algorithm applied to flight simulator at FC8 with 60% rate limits for
large fault levels.
Figure V-10 Example of fault diagnosis algorithm applied to flight simulator at FC8 with 60% rate limits for small fault levels.
Dow
nloa
ded
by B
RIS
TO
L U
NIV
ER
SIT
Y o
n M
arch
17,
201
5 | h
ttp://
arc.
aiaa
.org
| D
OI:
10.
2514
/6.2
009-
5760

American Institute of Aeronautics and Astronautics
092407
18
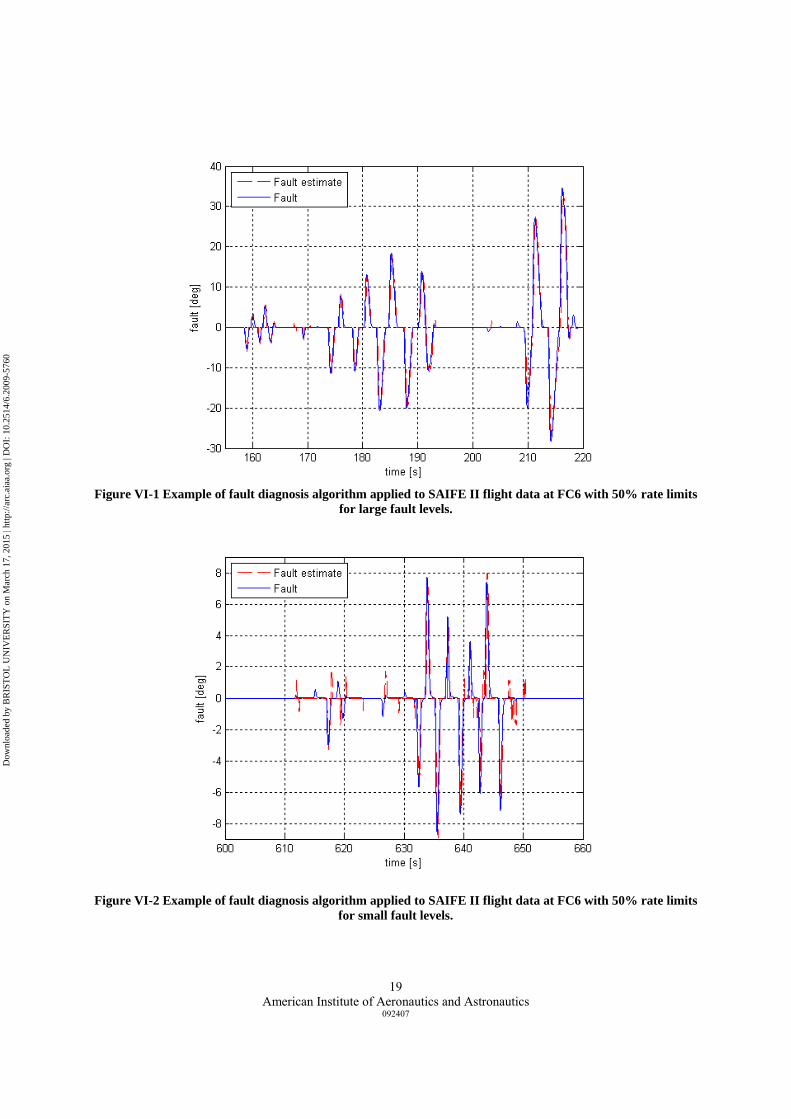
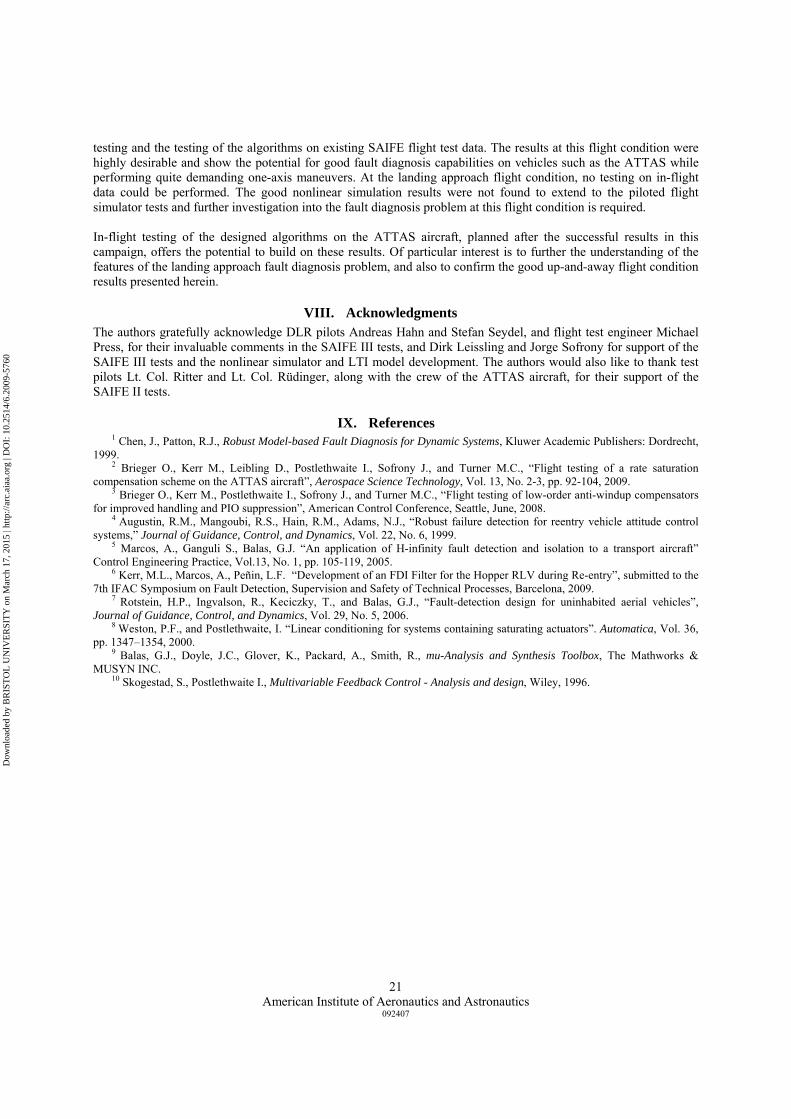
VI. SAIFE II Flight Data Validation To provide further validation of the fault diagnosis algorithms beyond that offered in the SAIFE III testing, and to substitute for the postponed SAIFE III flight tests, here the results from the validation of the fault diagnosis algorithm using the flight test data obtained during the 2007 SAIFE II flight campaign (Ref.3) are shown. As the landing approach task was not flown in the SAIFE II tests, results can only be obtained for FC6. Details of the test procedures were given in Section III-A (see also Ref.3), with the testing performed on the ATTAS vehicle using test pilots from the German Armed Forces Technical and Airworthiness Center for Aircraft. The results from this testing of the algorithms on the flight test at FC6 are summarised in Table VI-1. Consistent with the in-flight procedures, here the testing was done with the software RLs set at 50% of the full authority levels in the hardware limits. Figure VI-1 and Figure VI-2 provide an indication of the results obtained during this testing, with the fault estimate after thresholding shown along with the fault signal for two periods of the flight test. The results show that the fault estimate is very accurate for large magnitude faults, with only very minor false alarms and missed faults. For smaller magnitude faults, the fault estimate still accurately tracks the fast dynamic fault signal, but with relatively larger tracking error levels and relatively larger energy levels in the false detections. The performance indices calculated for the full test period shown in Table VI-1 indicate that the missed faults correspond to faults with very small fault strengths (energy levels), with the energy in the fault estimate 1.37 % less than that in the fault signal over the faulted time periods. The indices also indicate that the energy in the false detections is very small, being 2.71% of the energy in the fault estimate signal. These were considered to be very good results. Remark: The fault diagnosis algorithm tested on the SAIFE II data, and its software implementation, is identical to that employed in the nonlinear simulation and piloted flight simulator tests. Remark: One would have expected higher error levels in the fault estimate and potentially more false alarms when testing in-flight. This is because the FDI algorithm cannot discriminate, at this local level, between a failure in the aircraft actuators and disturbances (wings, gusts etc) on the vehicle that have similar effects on the vehicle response.
Table VI-1 Flight test performance indices at FC6
Flight test 8/07 (2792.4 seconds of data) Time Domain FD Performance Time Domain Fault Estimation Performance
True Detection Rrate
0.1 deg 1 deg 5 deg
False detection
rate
True energy
ratio
False energy
ratio
Mean Estimation
error 59.87 % 80.55 % 94.89 % 5.24 % 98.63 % 2.71 % 1.71 deg
Dow
nloa
ded
by B
RIS
TO
L U
NIV
ER
SIT
Y o
n M
arch
17,
201
5 | h
ttp://
arc.
aiaa
.org
| D
OI:
10.
2514
/6.2
009-
5760
American Institute of Aeronautics and Astronautics
092407
19
Figure VI-1 Example of fault diagnosis algorithm applied to SAIFE II flight data at FC6 with 50% rate limits
for large fault levels.
Figure VI-2 Example of fault diagnosis algorithm applied to SAIFE II flight data at FC6 with 50% rate limits for small fault levels.
Dow
nloa
ded
by B
RIS
TO
L U
NIV
ER
SIT
Y o
n M
arch
17,
201
5 | h
ttp://
arc.
aiaa
.org
| D
OI:
10.
2514
/6.2
009-
5760

American Institute of Aeronautics and Astronautics
092407
20
F. Discussion of Results The results show that the fault diagnosis algorithm performed well, in general, for this challenging and realistic fault scenario. At the up-and-away flight condition (FC6), the results are very good, with accurate tracking of the fault estimate seen, especially for the larger magnitude fault signals. The results achieved in each test case are quite consistent, with accurate fault detection and estimation and only small exogenous signal coupling seen in the nonlinear simulations, flight simulator and flight test results. Surprisingly, the flight test results are slightly better than the piloted flight simulator results. It was found that on-line fault thresholding was required and served to limit the number of false alarms and the energy of these signals to a small level. The landing approach flight condition (FC8) showed inconsistent results. Only nonlinear simulation and flight simulator results are available, with the former showing generally good results (comparable to FC6) while the latter flight simulator tests showed poorer results, with fault tracking accuracy reduced and significant coupling from exogenous signals leading to increased false detections. This feature was not so evident in the nonlinear simulation testing and therefore one would not expect that this is a reflection on a poor fault diagnosis algorithm (ie FDI filter) design. Rather, this would likely be due to a number of potential problems including: the LTI model for the landing approach task may not match well (as well as for FC6) the flight simulator model at this flight condition (FC8); the trim for beta is typically worse at FC8, with an error of around 1 degree typical, which will lead to offsets and potential drifts in the fault estimate; the landing approach task excites more longitudinal and lateral modes which may couple, making FDI based on only the lateral vehicle model inadequate. Additionally, the selection of the sensed vehicle outputs to employ in the fault diagnosis algorithm for FC8 may need to be reconsidered. The results presented were the first testing of the designed algorithms in the ATTAS flight simulator and on the ATTAS flight test data. Considering the results achieved for the FC6 testing, and in particular the flight test results, the fault diagnosis algorithm is seen to perform very well, with very minor false alarms, high detection rates and good fault estimation accuracy achieved. Redesign of the FDI filters and threshold algorithms to reduce the number of false alarms could easily be achieved and would be a useful maturation of the designed algorithms towards a performance level required for implementation. Considering the results achieved for the FC8 testing, it is evident that further investigation is required into the landing approach results and more generally, fault diagnosis problem at this flight condition. It is likely that revised filter design choices and model improvements, and validation of these improvements in the flight simulator and in-flight, would be needed before the designed algorithms can achieve similar results to those achieved at FC6. Remark: The anti-windup compensator activity appeared to have little effect on the FDI filters' performance: equally good behaviour was observed when the AW controllers were active to when they were not active. Remark: Compared with Ref.7, which also considered aileron actuator faults, the results achieved in this work are seen to be more acceptable. However, here an open-loop fault diagnosis algorithm was employed, whereas in Ref.7 a closed-loop fault diagnosis algorithm had to be employed due to the signals available. This made accurate fault diagnosis more difficult, due to the presence of the pilot in the closed-loop.
VII. Conclusions & Future Work This paper presented the design and testing of a fault diagnosis algorithm for faults in the aileron actuators of the ATTAS vehicle. This work was performed within the SAIFE III test campaign. Consistent with the SAIFE test procedures, to provide a fault scenario suitable for in-flight testing, the effects of rate saturation, that arise due to degraded software rate limits on the aileron actuators in the SAIFE campaign, were considered to be the effects of aileron faults. This provided a realistic and challenging fault scenario, with the fault effects a priori unknown and found to be quite varied between test runs. The results from the testing were positive, with the fault diagnosis algorithms, comprising an FDI filter and an on-line fault thresholding algorithm, performing well in all but one test condition. Testing of the fault diagnosis algorithms on a high-fidelity nonlinear simulator for the ATTAS vehicle demonstrated that the algorithms were correctly designed and implemented, with accurate fault detection and estimation achieved at all flight conditions. At the up-and-away flight condition (20000 ft), these results were found to extend to both piloted flight simulator
Dow
nloa
ded
by B
RIS
TO
L U
NIV
ER
SIT
Y o
n M
arch
17,
201
5 | h
ttp://
arc.
aiaa
.org
| D
OI:
10.
2514
/6.2
009-
5760
American Institute of Aeronautics and Astronautics
092407
21
testing and the testing of the algorithms on existing SAIFE flight test data. The results at this flight condition were highly desirable and show the potential for good fault diagnosis capabilities on vehicles such as the ATTAS while performing quite demanding one-axis maneuvers. At the landing approach flight condition, no testing on in-flight data could be performed. The good nonlinear simulation results were not found to extend to the piloted flight simulator tests and further investigation into the fault diagnosis problem at this flight condition is required. In-flight testing of the designed algorithms on the ATTAS aircraft, planned after the successful results in this campaign, offers the potential to build on these results. Of particular interest is to further the understanding of the features of the landing approach fault diagnosis problem, and also to confirm the good up-and-away flight condition results presented herein.
VIII. Acknowledgments The authors gratefully acknowledge DLR pilots Andreas Hahn and Stefan Seydel, and flight test engineer Michael Press, for their invaluable comments in the SAIFE III tests, and Dirk Leissling and Jorge Sofrony for support of the SAIFE III tests and the nonlinear simulator and LTI model development. The authors would also like to thank test pilots Lt. Col. Ritter and Lt. Col. Rüdinger, along with the crew of the ATTAS aircraft, for their support of the SAIFE II tests.
IX. References 1 Chen, J., Patton, R.J., Robust Model-based Fault Diagnosis for Dynamic Systems, Kluwer Academic Publishers: Dordrecht,
1999. 2 Brieger O., Kerr M., Leibling D., Postlethwaite I., Sofrony J., and Turner M.C., “Flight testing of a rate saturation
compensation scheme on the ATTAS aircraft”, Aerospace Science Technology, Vol. 13, No. 2-3, pp. 92-104, 2009. 3 Brieger O., Kerr M., Postlethwaite I., Sofrony J., and Turner M.C., “Flight testing of low-order anti-windup compensators
for improved handling and PIO suppression”, American Control Conference, Seattle, June, 2008. 4 Augustin, R.M., Mangoubi, R.S., Hain, R.M., Adams, N.J., “Robust failure detection for reentry vehicle attitude control
systems,” Journal of Guidance, Control, and Dynamics, Vol. 22, No. 6, 1999. 5 Marcos, A., Ganguli S., Balas, G.J. “An application of H-infinity fault detection and isolation to a transport aircraft”
Control Engineering Practice, Vol.13, No. 1, pp. 105-119, 2005. 6 Kerr, M.L., Marcos, A., Peñin, L.F. “Development of an FDI Filter for the Hopper RLV during Re-entry”, submitted to the
7th IFAC Symposium on Fault Detection, Supervision and Safety of Technical Processes, Barcelona, 2009. 7 Rotstein, H.P., Ingvalson, R., Keciczky, T., and Balas, G.J., “Fault-detection design for uninhabited aerial vehicles”,
Journal of Guidance, Control, and Dynamics, Vol. 29, No. 5, 2006. 8 Weston, P.F., and Postlethwaite, I. “Linear conditioning for systems containing saturating actuators”. Automatica, Vol. 36,
pp. 1347–1354, 2000. 9 Balas, G.J., Doyle, J.C., Glover, K., Packard, A., Smith, R., mu-Analysis and Synthesis Toolbox, The Mathworks &
MUSYN INC. 10 Skogestad, S., Postlethwaite I., Multivariable Feedback Control - Analysis and design, Wiley, 1996.
Dow
nloa
ded
by B
RIS
TO
L U
NIV
ER
SIT
Y o
n M
arch
17,
201
5 | h
ttp://
arc.
aiaa
.org
| D
OI:
10.
2514
/6.2
009-
5760