Pilot Study on Packaging and Packaging Waste - Final Report · PDF file ·...
97
FINAL REPORT Pilot Study on Packaging and Packaging Waste of Iceland Contract nr. ESTAT 200471200004 – Eurostat Grants for 2004-09-28 Waste Statistics Regulations (Regulation 2150/2002/EC) Rob P.M. Kamsma, B.Sc. Cornelis A. Meyles, B.Sc. The Environment and Food Agency of Iceland (UST) Reykjavik, 10 October 2005
Transcript of Pilot Study on Packaging and Packaging Waste - Final Report · PDF file ·...

FINAL REPORT
Pilot Study on Packaging and Packaging Waste of Iceland
Contract nr. ESTAT 200471200004 – Eurostat Grants for 2004-09-28 Waste Statistics Regulations (Regulation 2150/2002/EC)
Rob P.M. Kamsma, B.Sc. Cornelis A. Meyles, B.Sc.
The Environment and Food Agency of Iceland (UST)
Reykjavik, 10 October 2005

FINAL REPORT Pilot Study on Packaging and Packaging Waste in Iceland
- 1 -
Acknowledgements For carrying out this Pilot Study on Packaging and Packaging Waste, a working-group was established with representatives from: Statistics Iceland (Hagstofa Íslands), Environmental Research Institute (ERI) of the Reykjavik University and the Environment and Food Agency of Iceland (Umhverfisstofnun, shortened as UST). Other participating parties were: The Directorate of Customs (Tollur), The National Recycling Fund (Úrvinnslusjóður), municipalities, national institutions and agencies, waste treatment companies as SORPA and recycling companies as Endurvinnslan, other commercial companies, landfillers and incinerators. We would like to especially thank Edda Hermannsdóttir (Hagstofa Íslands), Geir Oddsson (ERI) and Anna M. Sparf (University) for their participation and expertise that they contributed to this pilot study. Furthermore we would like to thank all the companies, institutions and agencies for their time and efforts in participating in this project by answering our questionnaire forms and other questions relating to packaging waste and its management in Iceland. This final report is accomplished through excellent and harmonised co-operation between these different parties. Although several difficulties had to be overcome to develop the methodology described in this report all participating parties were more than willing to give a helping hand throughout this process. Rob P.M. Kamsma, B.Sc Cornelis A. Meyles, B.Sc.

FINAL REPORT Pilot Study on Packaging and Packaging Waste in Iceland
- 2 -
Contents
SUMMARY .....................................................................................................................................4
1. WASTE STATISTICS REGULATION........................................................................................7
1.1 Introduction ................................................................................................................7 1.2 Pilot study objectives .................................................................................................8 1.3 Reporting obligations and requirements.....................................................................9 1.4 Packaging waste recycling and recovery targets ......................................................10 1.5 Packaging waste level of detail ................................................................................11
2. APPROACH...........................................................................................................................14
2.1 Introduction ..............................................................................................................14 2.2 Possible methodological approaches........................................................................15
2.2.1 Historical research..........................................................................................15 2.2.2 Comparison with data from other countries ...................................................15 2.2.3 Import, export and domestic production of packaging ...................................16 2.2.4 Packaging waste generation and treatment ....................................................19
2.3 Evaluation & conclusion ..........................................................................................21 3. MODELLING.........................................................................................................................23
3.1 Introduction ..............................................................................................................23 3.2 Sorting and recycling................................................................................................25
3.2.1 Sorted and recycled sales packaging ..............................................................25 3.2.2 Sorted and recycled transport packaging .......................................................26
3.3 Landfilling................................................................................................................28 3.3.1 Landfilled mixed household waste ..................................................................29 3.3.2 Landfilled mixed production waste .................................................................32
3.4 Incineration...............................................................................................................34 3.5 Surveys .....................................................................................................................35 3.6 Conclusions ..............................................................................................................36
4. RESULTS ..............................................................................................................................37
4.1 Introduction ..............................................................................................................37 4.2 Recycled packaging waste........................................................................................38
4.2.1 Sales packaging waste.....................................................................................38 4.2.2 Transport packaging waste .............................................................................38
4.3 Landfilled packaging waste......................................................................................39 4.3.1 Mixed household/sales packaging waste.........................................................39 4.3.2 Mixed production/transport packaging waste.................................................39
4.4 Incinerated packaging waste ....................................................................................40 4.4.1 Mixed household/sales packaging waste.........................................................40 4.4.2 Mixed production/transport packaging waste.................................................40
4.5 Total generated packaging waste..............................................................................41 4.6 Comparison with recycling and recovery targets .....................................................42
5. EVALUATION & CONCLUSIONS ..........................................................................................43 6. RECOMMENDATIONS & DISCUSSION .................................................................................46 7. REFERENCES .......................................................................................................................49

FINAL REPORT Pilot Study on Packaging and Packaging Waste in Iceland
- 3 -
List of Tables: TABLE 1.1PACKAGING WASTE RECYCLING AND RECOVERY TARGETS 10
TABLE 1.2 PACKAGING TYPES AND MATERIALS 11
TABLE 1.3 PACKAGING WASTE CLASSIFICATIONS ACCORDING TO THE WSTATR 12
TABLE 1.4 SURVEYED AND REPORTED PACKAGING USED FOR WASTE STATISTICS 13
TABLE 3.1 LANDFILLED MIXED HOUSEHOLD AND – PRODUCTION WASTE 29
TABLE 3.2 COMPOSITION OF LANDFILLED MIXED HOUSEHOLD (SALES PACKAGING) WASTE 30
TABLE 3.3 COMPOSITION OF LANDFILLED MIXED PRODUCTION (TRANSPORT PACKAGING) WASTE 32
TABLE 3.4 INCINERATED MIXED HOUSEHOLD AND – PRODUCTION WASTE 34
TABLE 4.1 RECYCLED SALES PACKAGING WASTE IN ICELAND IN 2002 38
TABLE 4.2 RECYCLED TRANSPORT PACKAGING WASTE IN ICELAND IN 2002 38
TABLE 4.3 LANDFILLED SALES PACKAGING WASTE IN ICELAND IN 2002 39
TABLE 4.4 LANDFILLED TRANSPORT PACKAGING WASTE IN ICELAND IN 2002 39
TABLE 4.5 INCINERATED SALES PACKAGING WASTE IN ICELAND IN 2002 40
TABLE 4.6 INCINERATED TRANSPORT PACKAGING WASTE IN ICELAND IN 2002 40
TABLE 4.7 TOTAL GENERATED PACKAGING WASTE IN ICELAND IN 2002 41
TABLE 4.8 COMPARISON WITH PACKAGING WASTE RECYCLING AND RECOVERY TARGETS 42
List of Figures: FIGURE 3.1 BREAKDOWN OF TOTAL WASTE FLOW IN ICELAND IN 2002 24
FIGURE 4.1 TOTAL GENERATED PACKAGING WASTE IN ICELAND IN 2002 41
FIGURE 4.2 COMPARISON WITH PACKAGING WASTE RECYCLING TARGETS 42
List of Annexes: ANNEX I TERMS OF REFERENCE ANNEX II QUESTIONNAIRE SURVEY AND RESULTS ANNEX III ICELANDIC WASTE MANAGEMENT ANNEX IV AVAILABLE DATA SOURCES ANNEX V ASSUMPTIONS AND ESTIMATIONS ANNEX VI SORPA SURVEY RESULTS 1999 – 2003 ANNEX VII TABLES ACCORDING TO COMMISSION DECISION 2005/270/EC ANNEX VIII PACKAGING WASTE RECOVERY AND RECYCLING 1995 – 2002 ANNEX IX AMOUNTS OF WASTE GENERATED BY SECTOR 1995 - 2004
A1 – 1
A2 – 1
A3 – 1
A4 – 1
A5 – 1
A6 – 1
A7 – 1
A8 – 1
A9 – 1
FINAL REPORT Pilot Study on Packaging and Packaging Waste in Iceland
- 4 -
Summary In December 2002 the Regulation of the European Parliament and Council (EC) 2150/2002 on waste statistics entered into force. This Regulation sets the framework for the generation of harmonized statistics by the EU Member States on waste generation, recovery and disposal. The implementation process of the Waste Statistics Regulation 2150/2002/EC (shortly WStatR) includes the conduction of pilot studies in a number of areas of more difficult nature in the field of waste statistics that could not be determined during the preparation of the Regulation. The aim of this pilot study on packaging and packaging waste was to develop a methodology to obtain regular data and give recommendations, which allow the Commission to make further proposals for implementation measures. During this pilot study several possible methodologies were considered, based on:
Historical research, Comparison with data from other countries, Import, export and domestic production of packaging, Packaging waste generation and treatment.
While surveying the packaging and packaging waste sectors and collecting the first data on the basis thereof, several difficulties were encountered regarding the following:
Data on imported and exported packaging was difficult to obtain and proved difficult to process,
Data on the domestic production of packaging was difficult to obtain due to data confidentiality, regarding production information,
Some definitions of packaging and packaging waste are unclear, Packaging or packaging waste registration is unclear and/or not reliable, Insufficient, general information regarding packaging and packaging waste,
both on national and international level. These obscurities made it difficult to establish accurate and reliable packaging waste statistics. It is clear that packaging forms a complex structure and data collection covers a lot of different resources. Data on packaging waste represents a weak point in the waste statistics, not only in Iceland, but also in other countries that are not equipped with a system of selective collection of packaging waste arising from consumption by households, production and other companies. During the period that the pilot study was carried out, not all data that were required for the packaging statistics proved to be available. This caused a need for some assumptions and estimations, though they have all been thoroughly surveyed and evaluated before they were implemented in the final methodology. The methodological approach based on ´packaging waste generation and treatment´ proved to be the most promising and practical, though reliability and accuracy of the registration of collected data on a regional/local level needs further improvement. In Iceland packaging waste is typically processed by three waste treatment methods as: recycling, landfilling and incineration with energy recovery. Some packaging sorts are exported for recycling abroad.
FINAL REPORT Pilot Study on Packaging and Packaging Waste in Iceland
- 5 -
The method described here is mainly based on the following approach. The data collection system is established by looking at the old data collection methods and revising them, but also include the development of new methodological approaches Data on recycled packaging waste can directly be compiled from the recycling companies, where as data on landfilled and incinerated packaging waste can be found through several calculations, such as using the composition and total quantity of mixed household and – production waste going to landfill or incineration. The waste composition is based on several types of surveys that have been carried out in Iceland and in other European countries. These surveys show that mixed household waste is highly related to sales or primary packaging, whereas mixed production waste is very much related to transport or tertiary (and secondary) packaging. Secondary (grouped) packaging in this pilot study has been reported under transport packaging for the reason that is has almost the same purpose as tertiary packaging and is sometimes difficult to distinguish from transport packaging. The method that was developed and is described in this report meets the set objectives to provide accurate and reliable data, is easily updatable and presents a realistic and manageable way of data collection. Furthermore, the method should comply with the reporting obligations of the Packaging Directive and the WStatR. Further improvements of the methodology can be achieved, as can be expected that registrations by municipalities and waste management facilities on waste sorts and – treatment are getting more and more sophisticated and reliable with the establishment of regional waste management plans (2005) and their 3-yearly revisions. To enhance maximum data quality and consistency through the years it is necessary to reconsider the here used assumptions and estimations, which were made for the calculations on landfilled and incinerated packaging waste, in every round of updating the packaging statistics. This methodological approach provided the first consistent set of data on packaging waste in Iceland, showing that around 36% of the total generated municipal waste consists of packaging waste, responding to circa 56.000 tons in Iceland in 2002. Fluctuations in quantities between individual packaging waste sorts appear over the years, though the overall generated packaging waste seems to remain generally in the same order of magnitude, though increasing. The total generated packaging waste mainly consists of plastic, paper and cardboard packaging (together 74% of the total). Packaging waste recycling and recovery has improved significantly since 1995, though not all targets have been reached. Mainly for plastic, paper and cardboard packaging waste further development is needed to increase recycling rates. Generated packaging waste and its treatment has to be reported according to the Commission Decision 2005/270/EC. The tables presented in this Decision are based on packaging waste generation and treatment and thus replaces the tables that are presented in the packaging Directive 94/62/EC, which are based on packaging import, export and domestic production. The Icelandic findings in this pilot study confirm that the shift from data collection on packaging based on import, export and domestic production, as described in Packaging Directive, to a methodological approach based on packaging waste statistics, as described in Commission decision, is favorable and gives a more reliable and manageable system in practice.

FINAL REPORT Pilot Study on Packaging and Packaging Waste in Iceland
- 6 -
The inclusion of packaging waste reported under the Packaging Directive into the WStatR is a point of discussion within the Commission. According to this regulation waste statistics should be reported based on the economic activities in which the waste is generated. This type of information is not available for the data obtained using the proposed methodology. This further breakdown of packaging waste is believed not to be feasible due to the relatively low overall waste amount – as the population in Iceland is only below 300.000 – further more operating companies and industries are in general small in Iceland making reporting of packaging waste vulnerable and subjective. Also the level of accuracy can hardly be mentioned as waste registration systems are getting more sophisticated on regional level all the time. It is believed that a data collection system as described in this pilot study may gain further reliability and reach an acceptable level of consistency within the next few years. Reporting based on the economic activities is therefore not to believed cost effective in Iceland.

FINAL REPORT Pilot Study on Packaging and Packaging Waste in Iceland
- 7 -
1. Waste Statistics Regulation
1.1 Introduction In December 2002 the Regulation of the European Parliament and Council (EC) 2150/2002 on waste statistics entered into force. This Regulation sets the framework for the generation of harmonized statistics by the EU Member States on waste generation, recovery and disposal. The first statistics in compliance with the Regulation have to be produced on the data for the year 2004 by the end of June 2006. The implementation process of the Waste Statistics Regulation 2150/2002/EC, shortly WStatR, includes the conduction of pilot studies on a number of areas of more difficult nature in the field of waste statistics that could not be determined during the preparation of the Regulation. Four types of pilot studies are determined in the program that the Commission has drawn up:
1. Statistics on waste management in agriculture, fisheries and forestry, 2. Statistics on the import and export of waste, 3. Statistics on packaging waste, 4. Statistics on preparatory waste treatment operations.
The aim of these pilot studies is to develop a methodology to obtain regular data, which allow the Commission to make proposals for implementation measures. In 2003 EUROSTAT published the Terms of Reference of these pilot studies and Member States, acceding countries and EFTA countries were invited to present proposals for conducting these studies. More information about the Terms of Reference for Packaging Waste Statistics can be found in annex 1 of this report. The aim of the pilot study on packaging waste is to assess the relation between WStatR and the reporting obligation in the Packaging Directive. The discussion on packaging waste raised two questions. The first concerned the different categories of packaging waste and how detailed packaging waste should appear in the waste statistics. This was related to the second question on how the reporting obligation under the Packaging Directive (94/62/EC) can be incorporated into the WStatR. Or the other way around, could the data reported under the Packaging Directive be used as input for the statistics? The Commission shall adopt the necessary implementing measures based on the results of the pilot studies, carried out in line with WStatR.

FINAL REPORT Pilot Study on Packaging and Packaging Waste in Iceland
- 8 -
1.2 Pilot study objectives The main objective for this pilot study is to describe a methodology to develop an effective data collecting system for estimating packaging waste arising in Iceland, including its treatment, assessing the relation of the data collection system between the WStatR and the reporting obligation in the Packaging Directive, as well as assessing the cost-effectiveness, updates and the quality of the obtained data. The collected data have to be produced in such a way that the system will fully comply with the needs of EUROSTAT as laid down in the WStatR, i.e. by reporting on the parameters concerning packaging and packaging waste as described in Annex I, II and III of the Regulation, enhancing comparability with Member States, other EFTA- and Assessing Countries, especially bearing in mind the following fundamental issues:
Feasibility and relevance of the data collection, Coverage of the area by the statistics, Descriptions, definitions and methodologies to be applied, The level of detail at which data can be collected, Aggregation of levels for waste categories and/or for economic activities.
The methodology has to present a realistic and manageable way of collecting data in the Member State. It has to be determined how the data quality and comparability can be ensured and finally if it presents a harmonised methodology with a possible application in other countries. Iceland has not yet collated data showing progress towards the EU recovery and recycling targets, but it is foreseen that the new waste law (55/2003) will improve results significantly, especially concerning composites, plastic, paper and cardboard packaging. The current Icelandic data collection system on the import, export and production of packaging and packaging waste is not detailed or reliable enough to comply with the WStatR. Based on the existent data on packaging and packaging waste was virtually not possible to decide on the degree of which Iceland fulfils the requirements of the Packaging Directive. Clearly, there was a need to develop a data collecting system on packaging and packaging waste in Iceland.
FINAL REPORT Pilot Study on Packaging and Packaging Waste in Iceland
- 9 -
1.3 Reporting obligations and requirements The following data on packaging waste has to be reported according to the Commission Decision 2005/270/EC on annual basis:
The quantities of packaging waste (in tons) generated, recycled and recovered (all forms of) within the Member State,
The quantities of packaging waste (in tons) arising within the Member State and recovered outside the Member State,
The quantities of packaging waste (in tons) arising outside the Member State and recovered within the Member State.
Member States are obliged to report data on the packaging materials glass, plastic, paper & cardboard and metal. Generated packaging waste and its treatment has to be reported according to the Commission Decision 2005/270/EC, which establishes the formats relating to the database system pursuant to the Packaging Directive 94/62/EC. The formats in this Decision are based on packaging waste generation and treatment and replaces the formats from the Directive, which were based on packaging import, export and domestic production. Furthermore, Member States may provide, on a voluntary basis, further data on packaging and packaging waste that is available and such data may include:
Reporting the different plastic categories, To split metal packaging into steel and aluminum, Reporting composite packaging, Imports, exports and production of empty packaging, Data on reusable packaging, Concentration levels of heavy metals present in packaging within the meaning
of Article 11 of Directive 94/62/EC and the presence of noxious and other hazardous substances and materials within the meaning of the third indent of point 1 of Annex II to Directive 94/62/EC,
Packaging waste that is considered to be hazardous due to contamination by product contents within the meaning of Council Directive 91/689/EEC and Commission Decision 2000/532/EC.
The formats presented in the Commission Decision, including the packaging waste results for Iceland in 2002 are presented in annex 7 of this report.

FINAL REPORT Pilot Study on Packaging and Packaging Waste in Iceland
- 10 -
1.4 Packaging waste recycling and recovery targets In order to comply with the objectives in the Directive 2004/12/EC (amending Directive 94/62/EC), Member States shall take the necessary measures to attain the targets covering the whole of their territory. Because of the specific situation in Iceland e.g. a low population density, population distribution, weather conditions and long distances to the recycling market Iceland was granted to postpone their targets for recycling and recovery until 2011 (1). The following targets apply to the Icelandic territory:
No later than 30 June 2001 between 50 % as a minimum and 65 % as a maximum by weight of packaging waste will be recovered or incinerated at waste incineration plants with energy recovery,
No later than 31 December 2011 60 % as a minimum by weight of packaging waste will be recovered or incinerated at waste incineration plants with energy recovery,
No later than 30 June 2001 between 25 % as a minimum and 45 % as a maximum by weight of the totality of packaging materials contained in packaging waste will be recycled with a minimum of 15 % by weight for each packaging material,
No later than 31 December 2011 between 55 % as a minimum and 80 % as a maximum by weight of packaging waste will be recycled,
No later than 31 December 2011 the following minimum recycling targets for materials contained in packaging waste will be attained:
- 60 % by weight for glass, - 60 % by weight for paper & cardboard, - 50 % by weight for metals, - 22,5 % by weight for plastics, counting exclusively material that is
recycled back into plastics, - 15 % by weight for wood.
Table 1.1Packaging waste recycling and recovery targets
Recycling Recovery 2001 2011 2001 2011
Glass packaging 15% * 60% * - -
Plastic packaging 15% * 22,5% * - -
Paper & cardboard packaging 15% * 60% * - -
Metal packaging 15% * 50% * - -
Wood packaging 15% * 15% * - -
Total packaging 25 – 45% **
55 – 80% **
50 – 65% ** 60%
* Minimum ** Average
1) EEA Agreement of 1.5.2005, Annex II, Chapter XVII, number 7 on page 155 Iceland is granted an extension of
the recovery and recycling targets until 2011, together with Greece, Portugal and Ireland.
FINAL REPORT Pilot Study on Packaging and Packaging Waste in Iceland
- 11 -
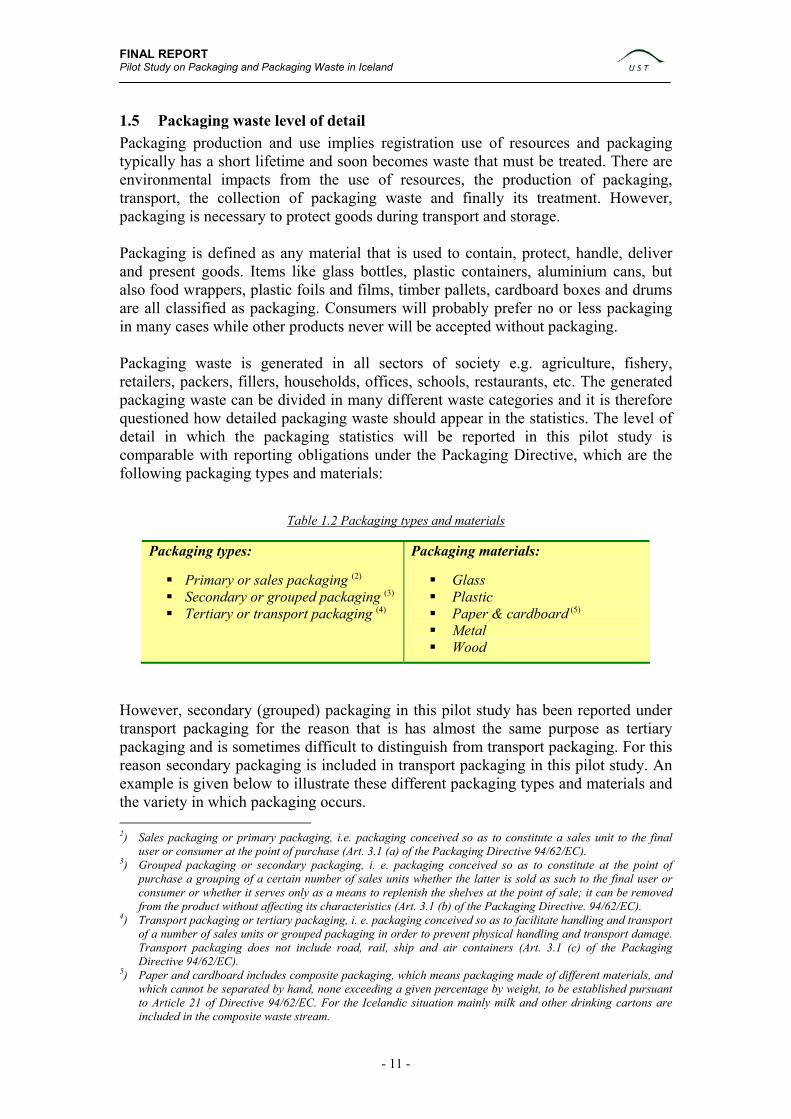
1.5 Packaging waste level of detail Packaging production and use implies registration use of resources and packaging typically has a short lifetime and soon becomes waste that must be treated. There are environmental impacts from the use of resources, the production of packaging, transport, the collection of packaging waste and finally its treatment. However, packaging is necessary to protect goods during transport and storage. Packaging is defined as any material that is used to contain, protect, handle, deliver and present goods. Items like glass bottles, plastic containers, aluminium cans, but also food wrappers, plastic foils and films, timber pallets, cardboard boxes and drums are all classified as packaging. Consumers will probably prefer no or less packaging in many cases while other products never will be accepted without packaging. Packaging waste is generated in all sectors of society e.g. agriculture, fishery, retailers, packers, fillers, households, offices, schools, restaurants, etc. The generated packaging waste can be divided in many different waste categories and it is therefore questioned how detailed packaging waste should appear in the statistics. The level of detail in which the packaging statistics will be reported in this pilot study is comparable with reporting obligations under the Packaging Directive, which are the following packaging types and materials:
Table 1.2 Packaging types and materials
Packaging types:
Primary or sales packaging (2) Secondary or grouped packaging (3) Tertiary or transport packaging (4)
Packaging materials:
Glass Plastic Paper & cardboard (5) Metal Wood
However, secondary (grouped) packaging in this pilot study has been reported under transport packaging for the reason that is has almost the same purpose as tertiary packaging and is sometimes difficult to distinguish from transport packaging. For this reason secondary packaging is included in transport packaging in this pilot study. An example is given below to illustrate these different packaging types and materials and the variety in which packaging occurs. 2) Sales packaging or primary packaging, i.e. packaging conceived so as to constitute a sales unit to the final
user or consumer at the point of purchase (Art. 3.1 (a) of the Packaging Directive 94/62/EC). 3) Grouped packaging or secondary packaging, i. e. packaging conceived so as to constitute at the point of
purchase a grouping of a certain number of sales units whether the latter is sold as such to the final user or consumer or whether it serves only as a means to replenish the shelves at the point of sale; it can be removed from the product without affecting its characteristics (Art. 3.1 (b) of the Packaging Directive. 94/62/EC).
4) Transport packaging or tertiary packaging, i. e. packaging conceived so as to facilitate handling and transport of a number of sales units or grouped packaging in order to prevent physical handling and transport damage. Transport packaging does not include road, rail, ship and air containers (Art. 3.1 (c) of the Packaging Directive 94/62/EC).
5) Paper and cardboard includes composite packaging, which means packaging made of different materials, and which cannot be separated by hand, none exceeding a given percentage by weight, to be established pursuant to Article 21 of Directive 94/62/EC. For the Icelandic situation mainly milk and other drinking cartons are included in the composite waste stream.
FINAL REPORT Pilot Study on Packaging and Packaging Waste in Iceland
- 12 -
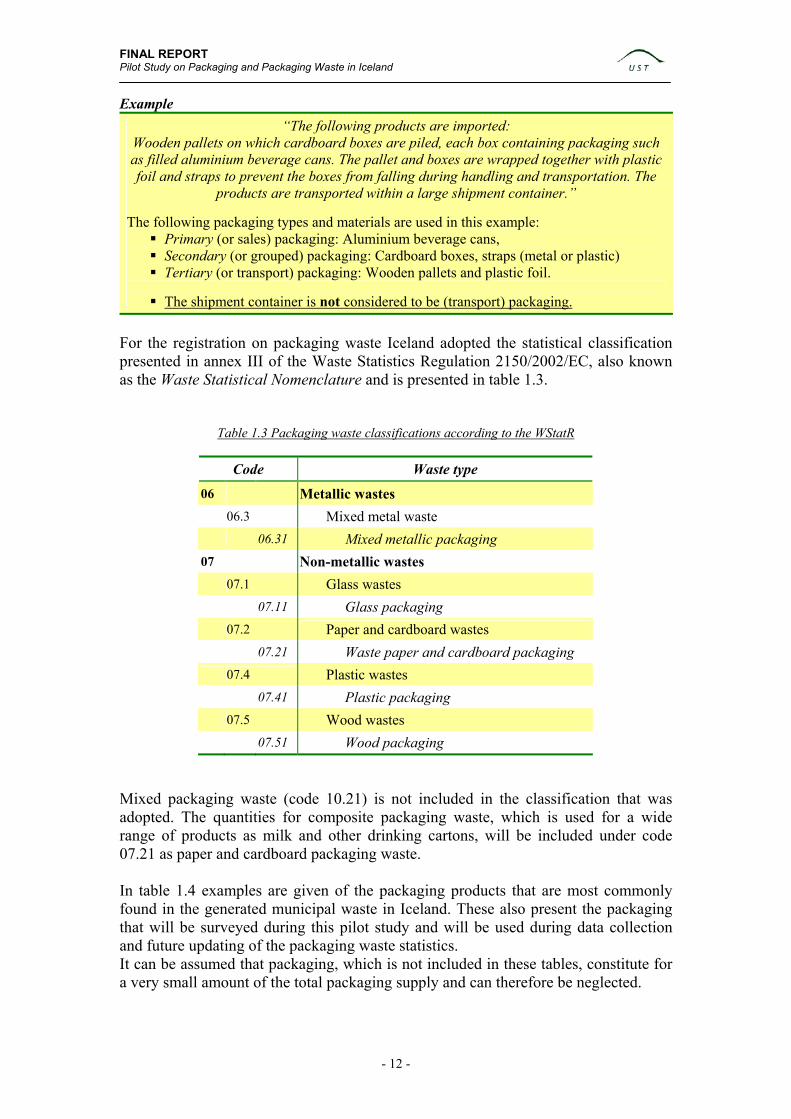
Example “The following products are imported:
Wooden pallets on which cardboard boxes are piled, each box containing packaging such as filled aluminium beverage cans. The pallet and boxes are wrapped together with plastic foil and straps to prevent the boxes from falling during handling and transportation. The
products are transported within a large shipment container.” The following packaging types and materials are used in this example:
Primary (or sales) packaging: Aluminium beverage cans, Secondary (or grouped) packaging: Cardboard boxes, straps (metal or plastic) Tertiary (or transport) packaging: Wooden pallets and plastic foil.
The shipment container is not considered to be (transport) packaging.
For the registration on packaging waste Iceland adopted the statistical classification presented in annex III of the Waste Statistics Regulation 2150/2002/EC, also known as the Waste Statistical Nomenclature and is presented in table 1.3.
Table 1.3 Packaging waste classifications according to the WStatR
Code Waste type
06 Metallic wastes 06.3 Mixed metal waste 06.31 Mixed metallic packaging 07 Non-metallic wastes 07.1 Glass wastes 07.11 Glass packaging 07.2 Paper and cardboard wastes 07.21 Waste paper and cardboard packaging 07.4 Plastic wastes 07.41 Plastic packaging 07.5 Wood wastes 07.51 Wood packaging
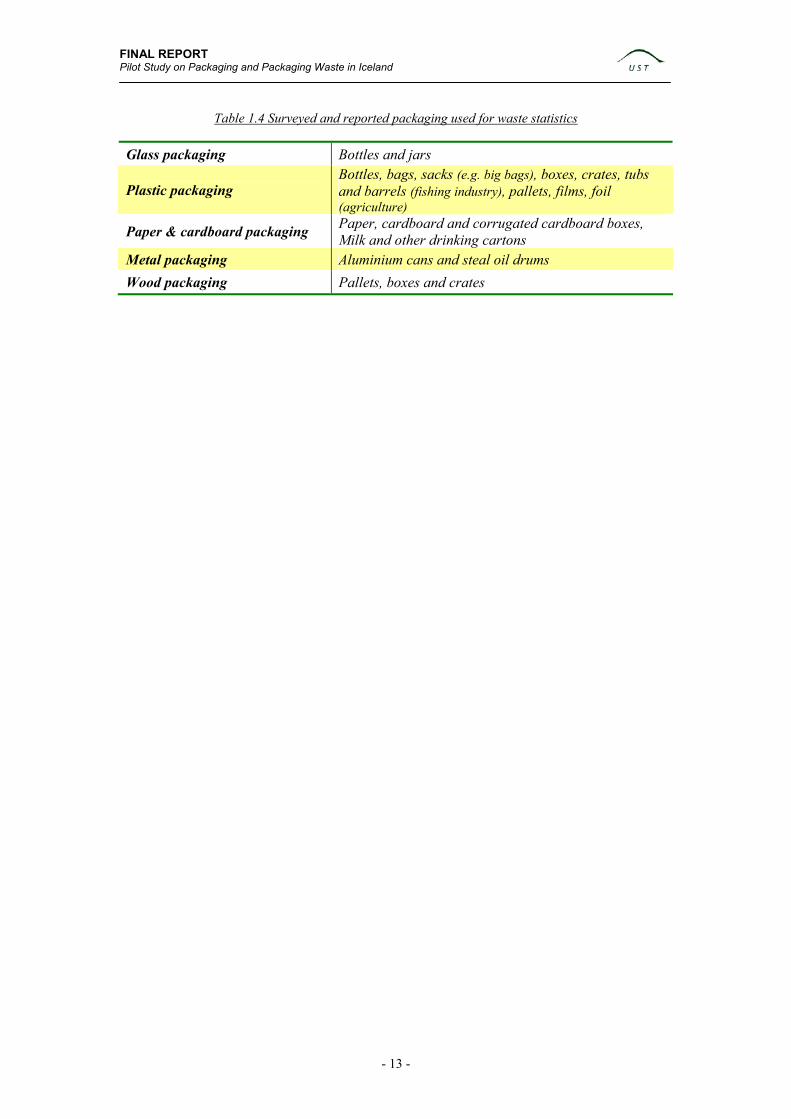
Mixed packaging waste (code 10.21) is not included in the classification that was adopted. The quantities for composite packaging waste, which is used for a wide range of products as milk and other drinking cartons, will be included under code 07.21 as paper and cardboard packaging waste. In table 1.4 examples are given of the packaging products that are most commonly found in the generated municipal waste in Iceland. These also present the packaging that will be surveyed during this pilot study and will be used during data collection and future updating of the packaging waste statistics. It can be assumed that packaging, which is not included in these tables, constitute for a very small amount of the total packaging supply and can therefore be neglected.
FINAL REPORT Pilot Study on Packaging and Packaging Waste in Iceland
- 13 -
Table 1.4 Surveyed and reported packaging used for waste statistics
Glass packaging Bottles and jars
Plastic packaging Bottles, bags, sacks (e.g. big bags), boxes, crates, tubs and barrels (fishing industry), pallets, films, foil (agriculture)
Paper & cardboard packaging Paper, cardboard and corrugated cardboard boxes, Milk and other drinking cartons
Metal packaging Aluminium cans and steal oil drums Wood packaging Pallets, boxes and crates

FINAL REPORT Pilot Study on Packaging and Packaging Waste in Iceland
- 14 -
2. Approach
2.1 Introduction This pilot study on packaging waste has been divided in two parts. The first part is an inventory on the generated packaging waste, the available data sources and possible methodological approaches that can be found in Iceland. The first part was finished with an interim report, which has been reported to the EUROSTAT Commission in October 2004. From the first part it was concluded that it would be difficult to collect data on packaging in overall, but especially regarding transport packaging, which was assumed to present a large share of the total generated packaging waste in Iceland. It became clear that packaging and packaging waste forms a complex structure and, based on the data available today, it would be difficult to present accurate and reliable packaging statistics that comply with the reporting obligations of WStatR. Registration by municipalities and waste treatment facilities of waste types and – amounts has been poor throughout the country, but are slowly improving. The registration by SORPA, the main waste treatment facility in Iceland however is fairly sophisticated but does not include many data on transport packaging as a specific waste stream. The second part of the study was used to survey the possible methodological approaches to assemble a reliable and updatable statistics model and to collate data on the basis thereof. Finally clear and operational conclusions are given on the assessments of the cost effectiveness, the quality of the obtained data and data comparability between countries, including recommendations regarding the possible inclusion of the reporting obligations under the Packaging Directive into the WStatR. This chapter describes each methodological approach possible, including the required work for data collection, data availability and the uncertainties as assumptions and estimations that were made. Finally the possible methods are evaluated, looking at their advantages and disadvantages and concluding which method is the most promising and accurate to be used under the given circumstances.
FINAL REPORT Pilot Study on Packaging and Packaging Waste in Iceland
- 15 -
2.2 Possible methodological approaches This paragraph presents the four methods used for data collection on packaging and packaging waste that have been considered to be the most applicable for the Icelandic situation, which are:
1. Historical research, 2. Comparison with data from other countries, 3. Import, export and domestic production of packaging, 4. Packaging waste generation and treatment.
2.2.1 Historical research Several studies on packaging have been carried out in Iceland, though they have all been based on one single study from 1995, which on its turn was based on a correlation between the external trade statistics from the Statistics Iceland and information of production from local packaging producers. At that time it was stated that the Icelandic consumption is made up of packaging produced in Iceland and abroad. The packaging produced abroad was imported (empty) for use in Iceland or formed part of imported and exported finished goods. The composition of the packaging supply that was established showed that paper and cardboard packaging presented the largest share, followed by plastics packaging and wood packaging. During the following years the study report and results from 1991 have been revised and more data was collected from the Directorate of Customs. The revised versions presented the packaging supply for 1995, 1998 and 2000 and contained several small changes, mainly trying to eliminate the uncertainties that were found during the first study. It was mainly sales packaging that was taken in consideration at that time and transport packaging was only accounted for till some extent. This is one of this reasons why more focus has now been put on the transport packaging waste during this pilot study The results of former studies can be found in annex 8 of this report, presenting the total packaging waste generated, recycled and recovered. 2.2.2 Comparison with data from other countries This method was used as an addition to other methodological approaches to compare the Icelandic packaging and packaging waste results with those from other European countries. Several Member States that are or have been working on a pilot study on packaging and packaging waste have been approached. In addition was a literature study on other packaging studies or researches that have been carried out in other European countries. This literature study clearly showed that establishing packaging waste statistics is problematic in many countries and that very little information as on this subject is yet available. The literature study showed also that the composition of municipal, household and production waste are roughly comparable between countries, though significant differences can occur. The data that was collected using this method has partly been used in the process of figure estimation.

FINAL REPORT Pilot Study on Packaging and Packaging Waste in Iceland
- 16 -
2.2.3 Import, export and domestic production of packaging The first methodological approach that has been considered dates from 1991 and represents the import, export and domestic production of packaging. For this method it was assumed that the information would be provided by one source only, obtainable on yearly basis and for which the quality and standardisation would be ensured. This method established the quantity of packaging that was put on the market for consumption, thus the packaging supply. In the Commission Decision 2005/270/EC (art 2.2) it is noted that packaging waste generation in a Member State may be deemed to be equal to the amount of packaging put on the market in the same year within that Member State. For materials occurring in small quantities and those who are not mentioned in the Decision, estimations may be used. These estimations shall be based on the best information available. In order to use this methodology to the following information has to be obtained:
Total quantity of packaging placed on the marked = (A + B) – C
A) Is the quantity of imported empty and filled sales packaging and transport packaging,
B) Is the domestic production of sales and transport packaging using the imported raw materials,
C) Is the quantity of exported empty and filled sales packaging and transport packaging.
In Iceland the Directorate of Customs (Tollur) carries out the registration of imported and exported products. From the Customs the data is sent to the Statistics Iceland (Hagstofa Ísland) that reports the data in the External Trade Reports (which are yearly published). Using these yearly reports, information can be found on the type of products that have been imported and exported, from which country, their quantities (net weight) and value. The classification that is used in the External Trade Reports is based on the Icelandic Customs Tariff, which is based on the International nomenclature. More information about the Directorate of Customs and the Statistics Iceland can be found in annex 4 of this report. Filled sales packaging From the External Trade Reports it is not possible to obtain data on the quantity and sorts of packaging that is used as filled sales packaging. To estimate this packaging quantity, each imported filled sales product has to be surveyed, where it has be estimated what the packaging weight is (difference between the product gross and net weight) and of which material the packaging has been produced. Typically only the gross weight, thus the packaging including the good is known, which makes this estimation more difficult and unreliable.

FINAL REPORT Pilot Study on Packaging and Packaging Waste in Iceland
- 17 -
The results would only present a rough estimation and the quality of this data cannot be ensured. Although most of this work has to be carried out only once, the results from such a survey will have to be revised every year to ensure the quality of the obtained data. Meaning a very low cost effectiveness. Currently there are no other alternatives to obtain this type of packaging data from the import registration. Empty sales packaging For empty sales (and transport) packaging, data can be compiled from the External Trade Reports both by quantity and material. Nevertheless, from these reports it cannot be estimated the amounts of the imported empty sales packaging that is actually consumed inside the country and are used to fill or pack goods for export. To gain more information on this it will be necessary to contact the production and processing companies as distributors, manufacturers, packers, fillers and retailers. This information is in most cases considered confidential and is therefore difficult to compile. Thus, the quality within this way of data collection cannot be ensured and no alternatives are currently available to collect data on empty sales packaging. Transport packaging Transport packaging can be divided in two groups: transport packaging that is imported and used by companies, thus put on the consumption market, and transport packaging that is used for the handling and transportation of the imported products. The quantities of the transport packaging that is especially imported and used by the commercial and trade companies for the transportation and export of their products can be obtained from the External Trade Reports. A similar problem as for empty sales packaging arises here, as it cannot be determined how much of this packaging (secondary/tertiary) will actually be used inside Iceland or is used with export of products. The second group of transport packaging (tertiary), which is used for the transportation and handling of the imported products, was assumed to be a good indicator for the total generated transport packaging waste. This type of packaging becomes waste shortly after the product has been delivered to the customer (shop/retailer) and it is assumed that this quantity constitutes for a significant percentage of the total generated packaging waste. For this pilot study the Directorate of Customs carried out a survey on transport packaging. It was assumed that the quantity of transport packaging could be calculated by deducting the total net weight from the total gross weight, which are both registered on the declaration forms that are used for the registration of imported and exported products. Only the declaration forms that contained one record (tariff number), thus one specific product, could be used for this calculation. It was found that around 75% of all declaration forms used at the import, contained one record and could therefore be used for this project. For the remaining 25%, declaration forms containing more than one record, it had to be assumed that the same amount of transport packaging would be used, or a relation had to be found between the quantity of imported packaging and packed products and the amount of transport packaging used. The quantity of transport packaging for those cases could not be established otherwise.
FINAL REPORT Pilot Study on Packaging and Packaging Waste in Iceland
- 18 -
It was concluded that the survey results could not be used either for the actual data collection system or as an indicator for several reasons. Firstly no relation could be found between the quantity of the imported products and the percentage of transport packaging used. The survey made clear that based on the records for several imported products the quantity of transport packaging seemed to change drastically between years, while the amount of imported products from which the transport packaging was calculated, remained similar between years. That would mean that during one year more transport packaging would be used for one specific imported product, than during another year. Secondly, during the survey several product groups turned out to have a negative quantity of transport packaging. No clear explanation for these problems could be found. Thirdly, it was difficult to determine if quantities consist of actual transport packaging or that non-packaging was included. It was ensured that the weight of the shipment containers was not included in these quantities, but for other smaller transporting equipment e.g. trolleys this was not clear. Finally the quantity of transport packaging that was found during this survey could not be split up by packaging material. The quantity of transport packaging that was estimated during this survey was already exceeded the total quantity of generated packaging waste (sales + transport packaging) that had been found earlier. It was therefore decided that these survey results could not be used until more information has been gathered on these issues. Domestic production The production of packaging in Iceland is mostly carried out by processing imported raw materials, as Iceland has no national resources for the production of raw materials. It proved to be difficult to compile data on the production of packaging from the production companies for the reason that this information is often considered confidential. Especially in Iceland where the market is relatively small and competition is mostly between just a few companies. Using the External Trade Reports to obtain the quantities of imported raw materials also proved to be unsuitable because it proved to be impossible to decide the breakdown of produced packaging/non-packaging products and how much of the produced packaging is put on the Icelandic market or is exported. Using the registration of imported packaging and packed products that carry a deposit (or recycling) fee might help to overcome the uncertainties. These products have to be registered and thus annual data are available. Deposit fees are already charged to some of the packaging products and this type of registration is used today, but it does not cover yet the whole packaging supply for Iceland. When deposit fees are charged more extensively on common packaging products that are used in Iceland, this approach might prove more valuable the collection of packaging data and is assumed to have a high cost effectiveness.
FINAL REPORT Pilot Study on Packaging and Packaging Waste in Iceland
- 19 -
2.2.4 Packaging waste generation and treatment A methodological approach based on packaging waste treatment was assumed to be the most feasible one for data collection today. This method applies to the end of the packaging life cycle by considering packaging waste generation and treatment. Packaging typically becomes waste shortly after it has been consumed and is treated. Within the Icelandic waste management system municipal waste is typically treated by landfilling it (70%), collected separately for recycling either inside or outside the national territory (27%) or incinerated (3%)with energy recovery. More background information on waste management in Iceland from 1970 till 2004 can be found in annex 3 of this report. The public in Iceland is not compelled by law to sort or classify solid waste, except for hazardous waste, which can be brought to collection points all over the country. Each municipality sets its own rules regarding the separation, collection and treatment of solid waste. In the Reykjavik capital area, which makes up approximately 62% of the total Icelandic population, the public is encouraged to deliver sorted, solid waste to special SORPA recycling centres located throughout the service area. They are open to individuals as well as small firms and institutions. From the recycling centres the waste is transported to SORPA’s bailing and sorting plant. Larger companies and institutions can bring their solid waste themselves to the sorting and bailing plant or directly to the landfill operated by SORPA. In many municipalities throughout the country there are sorting sites where the public can bring their sorted waste, typically garden waste, timber, scrap metal, bulky waste, clothes and shoes, drinking cartons, (news)paper and beverage packaging made from plastic, glass and aluminium. Furthermore there has been an increase in special collection of agricultural foliage from farms. Landfilling In Iceland the main waste treatment of waste is by landfilling. The transportation costs within Iceland are relatively high because of relatively low waste amounts, long distances between municipalities and harsh meteorological conditions during a significant part of the year. This is the main reason why there are many but relatively small landfills in Iceland. Cooperation between local authorities in waste- treatment has increased, which is why disposal sites are now fewer than earlier and those remaining have increased in size. It may be expected that this trend will continue. Despite an almost two-fold increase in the recovery of waste over the past 10 years, the quantity of waste bound for permanent landfills has not diminished. Recycling The recycling of waste increased since a recycling scheme for packaging waste was introduced in Iceland in 1996. Nowadays most of the recycled household packaging waste consists of sales packaging such as plastic, glass and metal beverages e.g. bottles and jars. The transport packaging that is recycled mainly consists of plastic packaging as films or foils, tubs, barrels and boxes used in the fish industry, paper and cardboard boxes, metal oil drums and wooden pallets and crates.

FINAL REPORT Pilot Study on Packaging and Packaging Waste in Iceland
- 20 -
Although a lot of effort has been put into increasing the recycling and recovery rate, Iceland is facing some difficulties reaching the packaging recycling and recovery targets. In Iceland, the sorting + treatment of packaging waste is mainly carried out by companies as SORPA and Endurvinnslan. There are a few other (smaller) recycling companies and waste collecting and transportation companies that work either together with larger waste treatment companies or operate individually. Most of the waste that is collected for recycling is exported to Europe. The main reasons for little domestic recycling are the relatively long distances between municipalities, the relatively low quantities of waste, harsh weather conditions and abundant energy from geothermal sources and hydropower plants. This results in high collection, transportation and processing costs and thus makes domestic recycling less attractive as an economic activity. It is cheaper to export or landfill waste. Recovery as incineration The third waste treatment method is incineration of waste with or without energy recovery. There are 5 incineration plants operational in Iceland today but they are relatively small with capacities ranging from 500 – 13.000 tonnes a year. There is no incineration without energy recovery in Iceland today. ´Open pit burning´ has virtually been stamped out. Reuse The reuse of packaging is not very common in Iceland. However some sorts of packaging as plastic tubs, barrels and euro-pallets are reused. According to the Packaging Waste Directive, the amounts of reused packaging waste are voluntary to report and very little registration of packaging reuse in Iceland is kept. Reuse of packaging will therefore not be further included in this report.

FINAL REPORT Pilot Study on Packaging and Packaging Waste in Iceland
- 21 -
2.3 Evaluation & conclusion In order to decide which method would be the best option to apply in Iceland the possible methods will be evaluated. The most important advantages and disadvantages for each data collection method will shortly be described of which final conclusions will be made. The decision on which methodological approach is the most applicable will be based on the data availability, whether its quality can be ensured, and the data are updateable and to what extent it presents a reliable and manageable way of data collection that can be used in Iceland. Import, export and domestic production of packaging Advantage(s)
The main advantage that can be recognised for this method is the possibility for application if data availability on the import, export and domestic production of packaging would be more sophisticated regarding the packaging content and constitution in the Custom’s records. This data typically originates at the Directorate of Customs and Statistics Iceland, though during the pilot study it was concluded that no sufficient data could be provided. If the available data becomes more accurate and reliable this could present a manageable and updateable method of data collection, which could have a high cost effectiveness and future developments might change the feasibility of this approach and therefore has to be taken in consideration.
Disadvantage(s)
Data on transport packaging used for the protection and handling of the imported products is not registered at the imports, though this quantity is assumed to constitute for a large percentage of the total generated packaging waste. Surveys showed that using declaration forms to estimate this quantity does not provide reliable figures and typically it cannot be divided by packaging weight or material, which is one of the reporting requirements,
Data on filled sales packaging cannot be obtained from the External Trade Reports in
a manageable and reliable way. Obtaining this data would be time and money consuming and only results is a rough estimation of which the quality cannot be ensured,
Data on empty sales packaging is partly obtainable from the External Trade Reports,
though from that quantity it cannot be estimated how much is put on the marked for consumption or is used for the export,
Domestic production of packaging is mainly by using imported raw material. Using
data on the raw material supply and the External Trade Reports cannot be used to estimated how much packaging is production, for it is used for both the production of packaging or non-packaging products. Data from packaging production companies is difficult to compile due to the confidentiality of the information.
In general, data on imported and exported packaging is difficult to obtain and is thus assumed to be inaccurate. Data on the domestic production of packaging is difficult to obtain due to data confidentiality. Applying this method would not present a cost-effective method of data collecting in the current situation.
FINAL REPORT Pilot Study on Packaging and Packaging Waste in Iceland
- 22 -
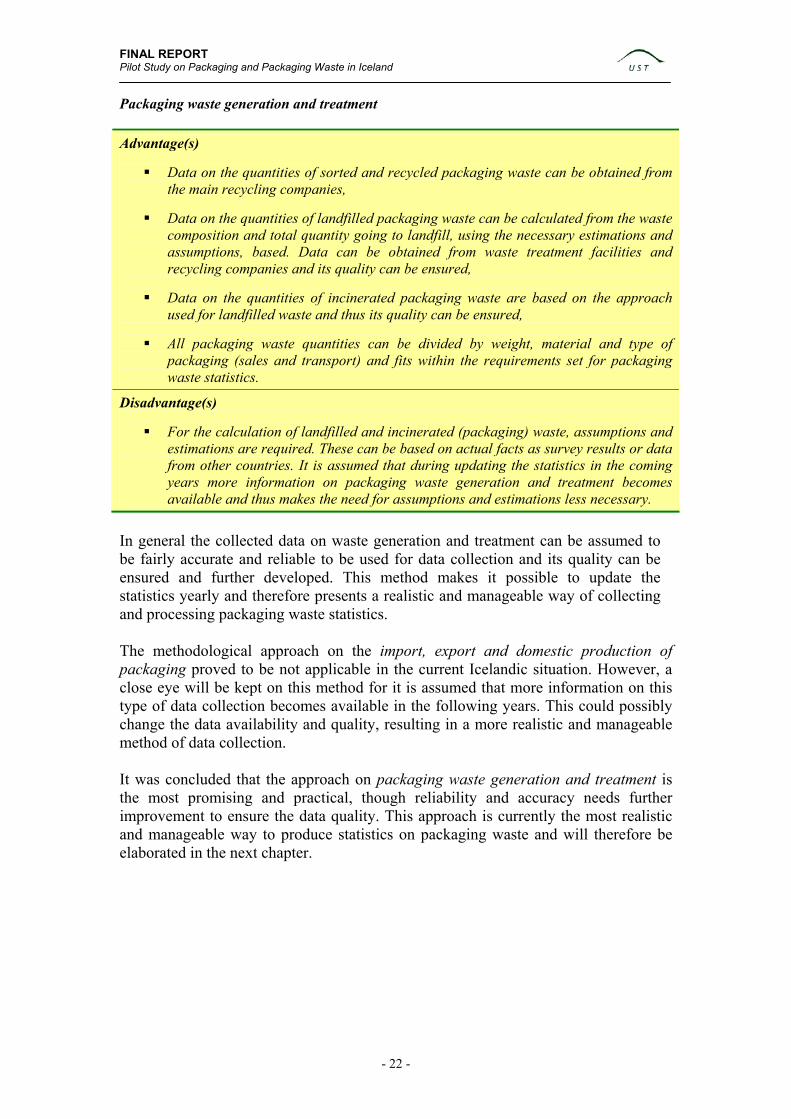
Packaging waste generation and treatment Advantage(s)
Data on the quantities of sorted and recycled packaging waste can be obtained from the main recycling companies,
Data on the quantities of landfilled packaging waste can be calculated from the waste
composition and total quantity going to landfill, using the necessary estimations and assumptions, based. Data can be obtained from waste treatment facilities and recycling companies and its quality can be ensured,
Data on the quantities of incinerated packaging waste are based on the approach
used for landfilled waste and thus its quality can be ensured,
All packaging waste quantities can be divided by weight, material and type of packaging (sales and transport) and fits within the requirements set for packaging waste statistics.
Disadvantage(s)
For the calculation of landfilled and incinerated (packaging) waste, assumptions and estimations are required. These can be based on actual facts as survey results or data from other countries. It is assumed that during updating the statistics in the coming years more information on packaging waste generation and treatment becomes available and thus makes the need for assumptions and estimations less necessary.
In general the collected data on waste generation and treatment can be assumed to be fairly accurate and reliable to be used for data collection and its quality can be ensured and further developed. This method makes it possible to update the statistics yearly and therefore presents a realistic and manageable way of collecting and processing packaging waste statistics. The methodological approach on the import, export and domestic production of packaging proved to be not applicable in the current Icelandic situation. However, a close eye will be kept on this method for it is assumed that more information on this type of data collection becomes available in the following years. This could possibly change the data availability and quality, resulting in a more realistic and manageable method of data collection. It was concluded that the approach on packaging waste generation and treatment is the most promising and practical, though reliability and accuracy needs further improvement to ensure the data quality. This approach is currently the most realistic and manageable way to produce statistics on packaging waste and will therefore be elaborated in the next chapter.

FINAL REPORT Pilot Study on Packaging and Packaging Waste in Iceland
- 23 -
3. Modelling
3.1 Introduction This chapter will describe the technical aspects that are required for the methodological approach on packaging waste generation and treatment. For each waste treatment as recycling, landfilling and incineration it will be explained how the packaging quantities can be calculated, presenting the basic figures used for these calculations and discussing the assumptions and estimations that have to be done. Several notes will be given presenting special points of interest that have to be kept in mind during data collection, processing and future updating. These are mainly the issues that would need improvement in the future, but in the current situation present the best option available. These estimations and assumptions are reported in one table, which can be found in annex 5, forming a list that has to be revised when updating. The survey methods that were used during the process of data collection are shortly discussed and more information on those can be found in the annexes. Finally the conclusions that were found during the modelling of this methodology are summed up in the final paragraph. This model used for this methodology is based on the total waste flow in Iceland, which distinguishes four waste streams, each treated by either recycling, landfilling or incineration:
Sorted household waste presents the waste that is directly sorted by the household and brought to the recycling centres/sorting sites and will be used for recycling.
Sorted production waste includes slaughterhouse waste, waste from fish
processing and agriculture. Most of these waste streams are separately collected and registered, but occasionally are also included in the collection of municipal waste. Packaging waste in this waste stream is mostly easy to detect visually. By experience separated production waste includes very little packaging waste.
Mixed household waste is generated by households, but also by
companies/institutions such as hotels, offices, restaurants, schools, wholesale and small business, etc. The composition of mixed household waste is assumed to be more or less the same within the whole country. Mixed household waste is mostly landfilled, but also incinerated with energy recovery.
Mixed (non-household) production waste is generated in the commerce, food
and trade industry, but has a very different composition than mixed household waste. In the Reykjavik capital area, mixed production waste is either brought to the sorting and bailing plant (by the companies themselves or by the private sector) or is brought directly to the landfill operated by SORPA. Mixed production waste is mostly landfilled and a very small amount is incinerated with energy recovery.

FINAL REPORT Pilot Study on Packaging and Packaging Waste in Iceland
- 24 -
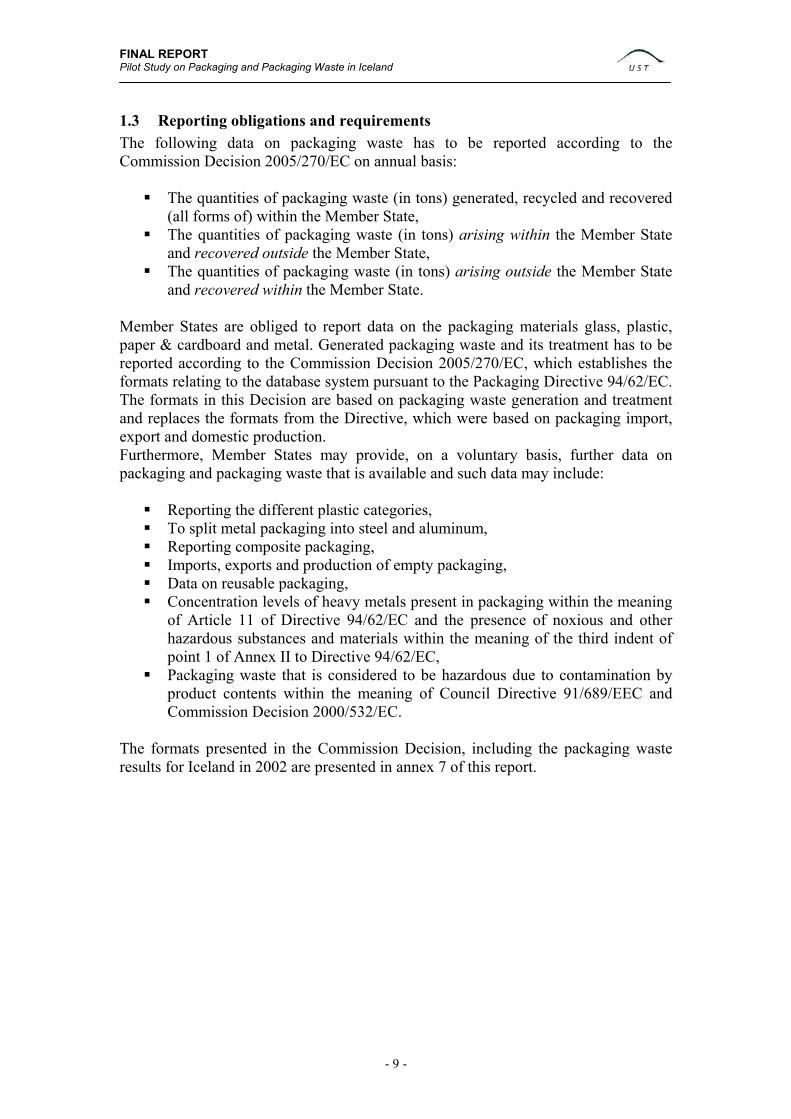
Other waste forms a fifth stream, which is a part of the production waste. This includes tires, end-of-life vehicles (scrap metal) and hazardous waste that contain no packaging and are further excluded from this pilot study. In preparation of the first national waste management plan a thorough assessment was made to estimate the different waste flows in Iceland. From this research it was concluded that the breakdown of the total waste flow, as described above, was somewhere around 30% municipal/household waste and 70% production and other waste as can be seen in figure 3.1 and table A9.1 in Annex 9. With the introduction of regional waste management plans it may be expected that the registration of waste amount on a local/regional level will get even more accurate in the near future. The coverage of waste collection services is 100% in Iceland.
Figure 3.1 Breakdown of total waste flow in Iceland in 2002
Household waste29%
Production waste60%
Hazardousewaste
2% Scrap metal + Tires9%
Mixed household waste 14,2%Beverage packaging 4,7%Newspapers & printed paper 2,3%Food leftovers 3,7%Hazardouse waste 0,1%Others 3,4%
Sorted household waste 14,8%Garden waste 2,7%Timber waste 0,6%Paper & paperboard 2,0%Beverage packaging 1,6%Clothes, shoes & textiles 0,2%Mixed bulky waste 6,6%Sludge 1,0%Electric devices 0,1%
Sorted production waste 28,6%Agricultural waste + sileage foil 9,6%Timber waste 3,4%Slaughterhouse and fishprocessing waste 9,8%Industrial metalproduction waste 2,0%Clinical waste 0,2%C & D waste 2,8%Glass waste 0,8%
Mixed (non-household) production waste 31,4%
Breakdown based on questionnaires

FINAL REPORT Pilot Study on Packaging and Packaging Waste in Iceland
- 25 -
3.2 Sorting and recycling Figure 3.1 shows that there are two waste streams that are sorted and used for recycling, which are:
Sorted Household waste, Sorted Production waste.
In general, the data presenting quantities of collected and recycled packaging waste, can be obtained from SORPA and Endurvinnslan, e.g. can be found in year reports and the quality of this data can be ensured through the operation of reliable registration systems. The registration kept at the smaller companies is not yet optimal for a data collection system, but is assumed to be reliable enough to be used for the current packaging statistics. Future improvements for a data registration may be expected. It proved relatively easy to produce statistics on recycled packaging waste in Iceland, because most of the packaging data can be provided by these sorting and recycling companies. More information about these companies can be found in annex 4 of this report. 3.2.1 Sorted and recycled sales packaging To obtain data on sorted and recycled sales packaging waste, companies as SORPA, Endurvinnslan have to be addressed. SORPA is mainly collecting and bailing paper & cardboard waste for recycling. This waste includes newspapers and other printed-paper, cardboard boxes (transport packaging), milk and other drinking cartons (composite packaging) and other paper and cardboard waste. Paper & cardboard waste is collected in special placed containers on different location in the municipalities e.g. in container parks, at recycling centres or near supermarkets. Paper & cardboard (including composite) waste is exported to Sweden for further recycling. The largest amount of this waste is collected in the southwest part of Iceland, which is estimated to be 80% of the total. The remaining 20% is collected from the rest of the country. If the sorted waste does not fulfil the criteria for recycling it is going to landfill. Endurvinnslan is the only company in Iceland that accepts one-way plastic (PET) and glass bottles and aluminium cans for recycling. Since the foundation of Endurvinnslan the collection of one-way containers has been highly succcessful and now over 80% of bottles and cansare returned to Endurvinnslan. A deposit fee is paid on delivery of one-way containers to the recycling centers operated by Endurvinnslan all over the country. Once the one-way containers have been collected together and passed through preliminary processing by Endurvinnslan, all the containers are sent abraod for recycling. The collected plastic and aluminium packaging is exported to the Netherlands, but also to America for recycling. Glass packaging are shredded and used for road construction and engineering material on landfill sites.
FINAL REPORT Pilot Study on Packaging and Packaging Waste in Iceland
- 26 -
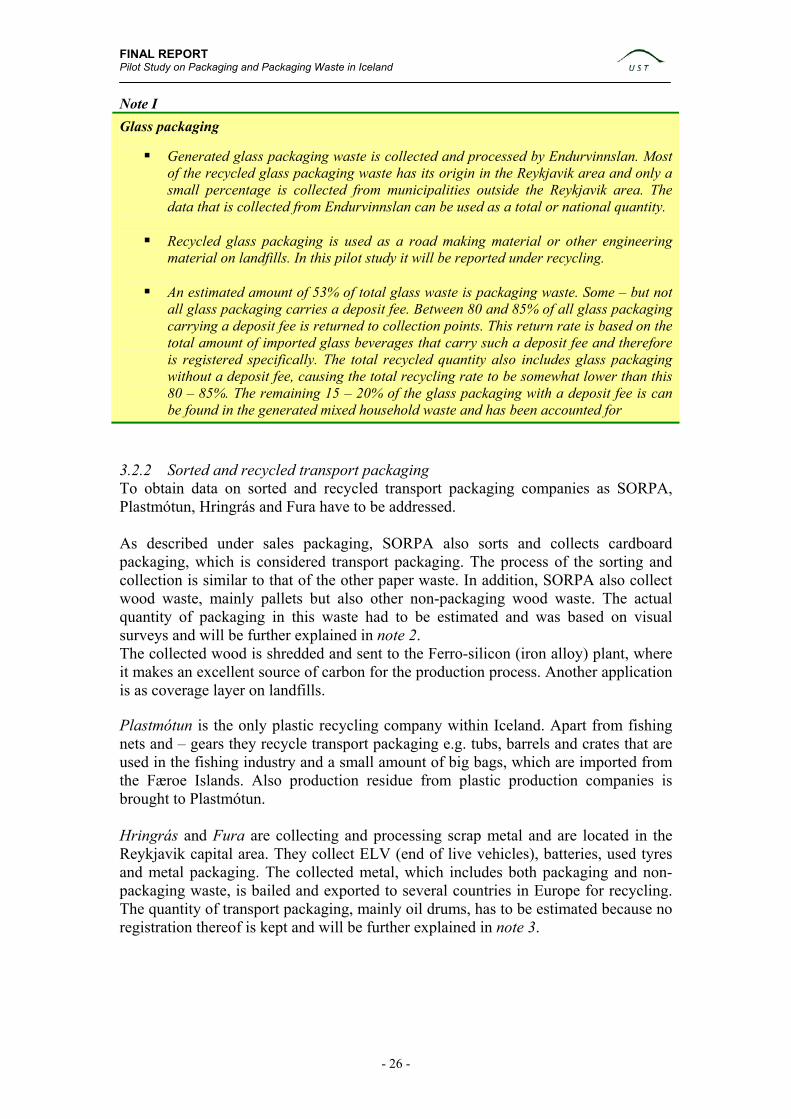
Note I Glass packaging
Generated glass packaging waste is collected and processed by Endurvinnslan. Most of the recycled glass packaging waste has its origin in the Reykjavik area and only a small percentage is collected from municipalities outside the Reykjavik area. The data that is collected from Endurvinnslan can be used as a total or national quantity.
Recycled glass packaging is used as a road making material or other engineering
material on landfills. In this pilot study it will be reported under recycling.
An estimated amount of 53% of total glass waste is packaging waste. Some – but not all glass packaging carries a deposit fee. Between 80 and 85% of all glass packaging carrying a deposit fee is returned to collection points. This return rate is based on the total amount of imported glass beverages that carry such a deposit fee and therefore is registered specifically. The total recycled quantity also includes glass packaging without a deposit fee, causing the total recycling rate to be somewhat lower than this 80 – 85%. The remaining 15 – 20% of the glass packaging with a deposit fee is can be found in the generated mixed household waste and has been accounted for
3.2.2 Sorted and recycled transport packaging To obtain data on sorted and recycled transport packaging companies as SORPA, Plastmótun, Hringrás and Fura have to be addressed. As described under sales packaging, SORPA also sorts and collects cardboard packaging, which is considered transport packaging. The process of the sorting and collection is similar to that of the other paper waste. In addition, SORPA also collect wood waste, mainly pallets but also other non-packaging wood waste. The actual quantity of packaging in this waste had to be estimated and was based on visual surveys and will be further explained in note 2. The collected wood is shredded and sent to the Ferro-silicon (iron alloy) plant, where it makes an excellent source of carbon for the production process. Another application is as coverage layer on landfills. Plastmótun is the only plastic recycling company within Iceland. Apart from fishing nets and – gears they recycle transport packaging e.g. tubs, barrels and crates that are used in the fishing industry and a small amount of big bags, which are imported from the Færoe Islands. Also production residue from plastic production companies is brought to Plastmótun. Hringrás and Fura are collecting and processing scrap metal and are located in the Reykjavik capital area. They collect ELV (end of live vehicles), batteries, used tyres and metal packaging. The collected metal, which includes both packaging and non-packaging waste, is bailed and exported to several countries in Europe for recycling. The quantity of transport packaging, mainly oil drums, has to be estimated because no registration thereof is kept and will be further explained in note 3.
FINAL REPORT Pilot Study on Packaging and Packaging Waste in Iceland
- 27 -
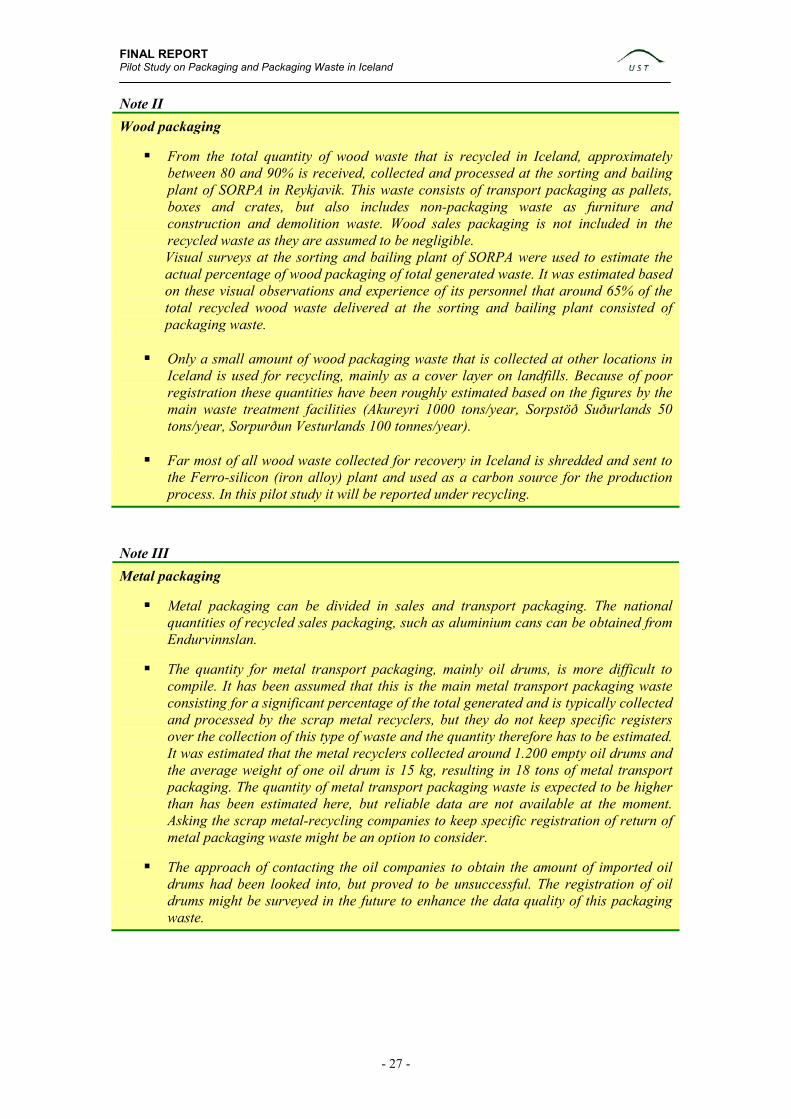
Note II Wood packaging
From the total quantity of wood waste that is recycled in Iceland, approximately between 80 and 90% is received, collected and processed at the sorting and bailing plant of SORPA in Reykjavik. This waste consists of transport packaging as pallets, boxes and crates, but also includes non-packaging waste as furniture and construction and demolition waste. Wood sales packaging is not included in the recycled waste as they are assumed to be negligible. Visual surveys at the sorting and bailing plant of SORPA were used to estimate the actual percentage of wood packaging of total generated waste. It was estimated based on these visual observations and experience of its personnel that around 65% of the total recycled wood waste delivered at the sorting and bailing plant consisted of packaging waste.
Only a small amount of wood packaging waste that is collected at other locations in Iceland is used for recycling, mainly as a cover layer on landfills. Because of poor registration these quantities have been roughly estimated based on the figures by the main waste treatment facilities (Akureyri 1000 tons/year, Sorpstöð Suðurlands 50 tons/year, Sorpurðun Vesturlands 100 tonnes/year).
Far most of all wood waste collected for recovery in Iceland is shredded and sent to
the Ferro-silicon (iron alloy) plant and used as a carbon source for the production process. In this pilot study it will be reported under recycling.
Note III Metal packaging
Metal packaging can be divided in sales and transport packaging. The national quantities of recycled sales packaging, such as aluminium cans can be obtained from Endurvinnslan.
The quantity for metal transport packaging, mainly oil drums, is more difficult to
compile. It has been assumed that this is the main metal transport packaging waste consisting for a significant percentage of the total generated and is typically collected and processed by the scrap metal recyclers, but they do not keep specific registers over the collection of this type of waste and the quantity therefore has to be estimated. It was estimated that the metal recyclers collected around 1.200 empty oil drums and the average weight of one oil drum is 15 kg, resulting in 18 tons of metal transport packaging. The quantity of metal transport packaging waste is expected to be higher than has been estimated here, but reliable data are not available at the moment. Asking the scrap metal-recycling companies to keep specific registration of return of metal packaging waste might be an option to consider.
The approach of contacting the oil companies to obtain the amount of imported oil
drums had been looked into, but proved to be unsuccessful. The registration of oil drums might be surveyed in the future to enhance the data quality of this packaging waste.
FINAL REPORT Pilot Study on Packaging and Packaging Waste in Iceland
- 28 -
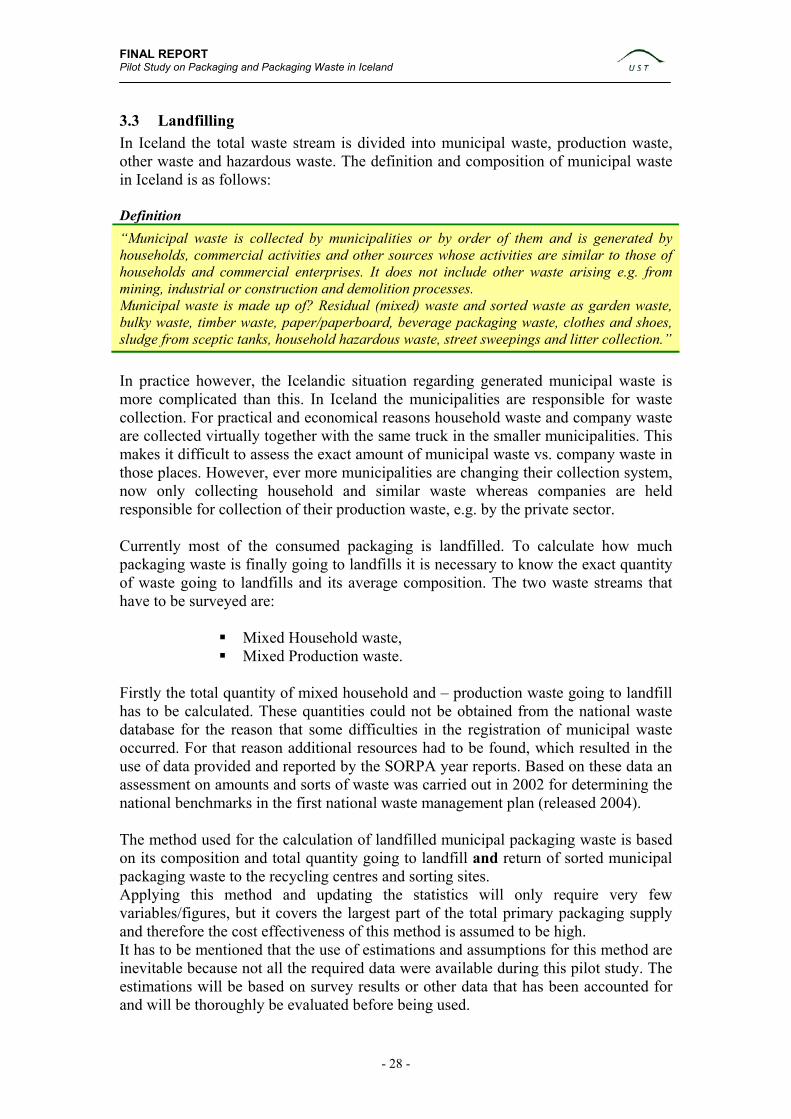
3.3 Landfilling In Iceland the total waste stream is divided into municipal waste, production waste, other waste and hazardous waste. The definition and composition of municipal waste in Iceland is as follows: Definition “Municipal waste is collected by municipalities or by order of them and is generated by households, commercial activities and other sources whose activities are similar to those of households and commercial enterprises. It does not include other waste arising e.g. from mining, industrial or construction and demolition processes. Municipal waste is made up of? Residual (mixed) waste and sorted waste as garden waste, bulky waste, timber waste, paper/paperboard, beverage packaging waste, clothes and shoes, sludge from sceptic tanks, household hazardous waste, street sweepings and litter collection.” In practice however, the Icelandic situation regarding generated municipal waste is more complicated than this. In Iceland the municipalities are responsible for waste collection. For practical and economical reasons household waste and company waste are collected virtually together with the same truck in the smaller municipalities. This makes it difficult to assess the exact amount of municipal waste vs. company waste in those places. However, ever more municipalities are changing their collection system, now only collecting household and similar waste whereas companies are held responsible for collection of their production waste, e.g. by the private sector. Currently most of the consumed packaging is landfilled. To calculate how much packaging waste is finally going to landfills it is necessary to know the exact quantity of waste going to landfills and its average composition. The two waste streams that have to be surveyed are:
Mixed Household waste, Mixed Production waste.
Firstly the total quantity of mixed household and – production waste going to landfill has to be calculated. These quantities could not be obtained from the national waste database for the reason that some difficulties in the registration of municipal waste occurred. For that reason additional resources had to be found, which resulted in the use of data provided and reported by the SORPA year reports. Based on these data an assessment on amounts and sorts of waste was carried out in 2002 for determining the national benchmarks in the first national waste management plan (released 2004). The method used for the calculation of landfilled municipal packaging waste is based on its composition and total quantity going to landfill and return of sorted municipal packaging waste to the recycling centres and sorting sites. Applying this method and updating the statistics will only require very few variables/figures, but it covers the largest part of the total primary packaging supply and therefore the cost effectiveness of this method is assumed to be high. It has to be mentioned that the use of estimations and assumptions for this method are inevitable because not all the required data were available during this pilot study. The estimations will be based on survey results or other data that has been accounted for and will be thoroughly be evaluated before being used.
FINAL REPORT Pilot Study on Packaging and Packaging Waste in Iceland
- 29 -
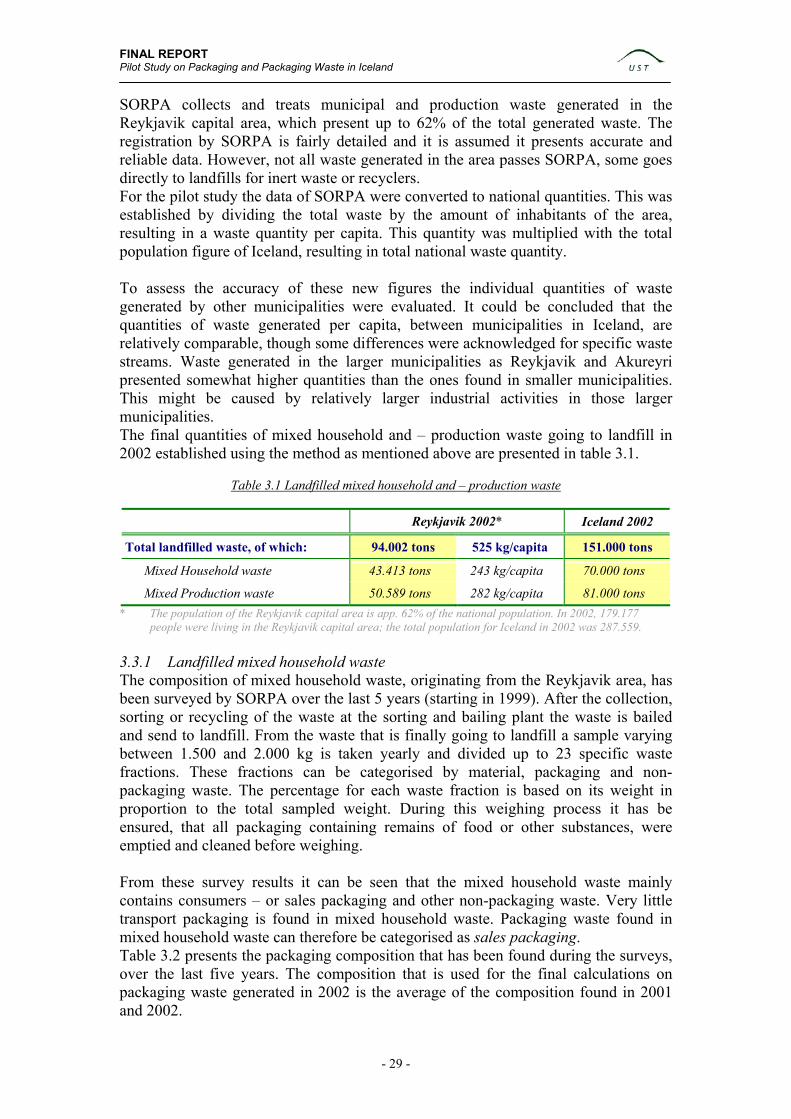
SORPA collects and treats municipal and production waste generated in the Reykjavik capital area, which present up to 62% of the total generated waste. The registration by SORPA is fairly detailed and it is assumed it presents accurate and reliable data. However, not all waste generated in the area passes SORPA, some goes directly to landfills for inert waste or recyclers. For the pilot study the data of SORPA were converted to national quantities. This was established by dividing the total waste by the amount of inhabitants of the area, resulting in a waste quantity per capita. This quantity was multiplied with the total population figure of Iceland, resulting in total national waste quantity. To assess the accuracy of these new figures the individual quantities of waste generated by other municipalities were evaluated. It could be concluded that the quantities of waste generated per capita, between municipalities in Iceland, are relatively comparable, though some differences were acknowledged for specific waste streams. Waste generated in the larger municipalities as Reykjavik and Akureyri presented somewhat higher quantities than the ones found in smaller municipalities. This might be caused by relatively larger industrial activities in those larger municipalities. The final quantities of mixed household and – production waste going to landfill in 2002 established using the method as mentioned above are presented in table 3.1.
Table 3.1 Landfilled mixed household and – production waste
Reykjavik 2002* Iceland 2002
Total landfilled waste, of which: 94.002 tons 525 kg/capita 151.000 tons
Mixed Household waste 43.413 tons 243 kg/capita 70.000 tons
Mixed Production waste 50.589 tons 282 kg/capita 81.000 tons * The population of the Reykjavik capital area is app. 62% of the national population. In 2002, 179.177
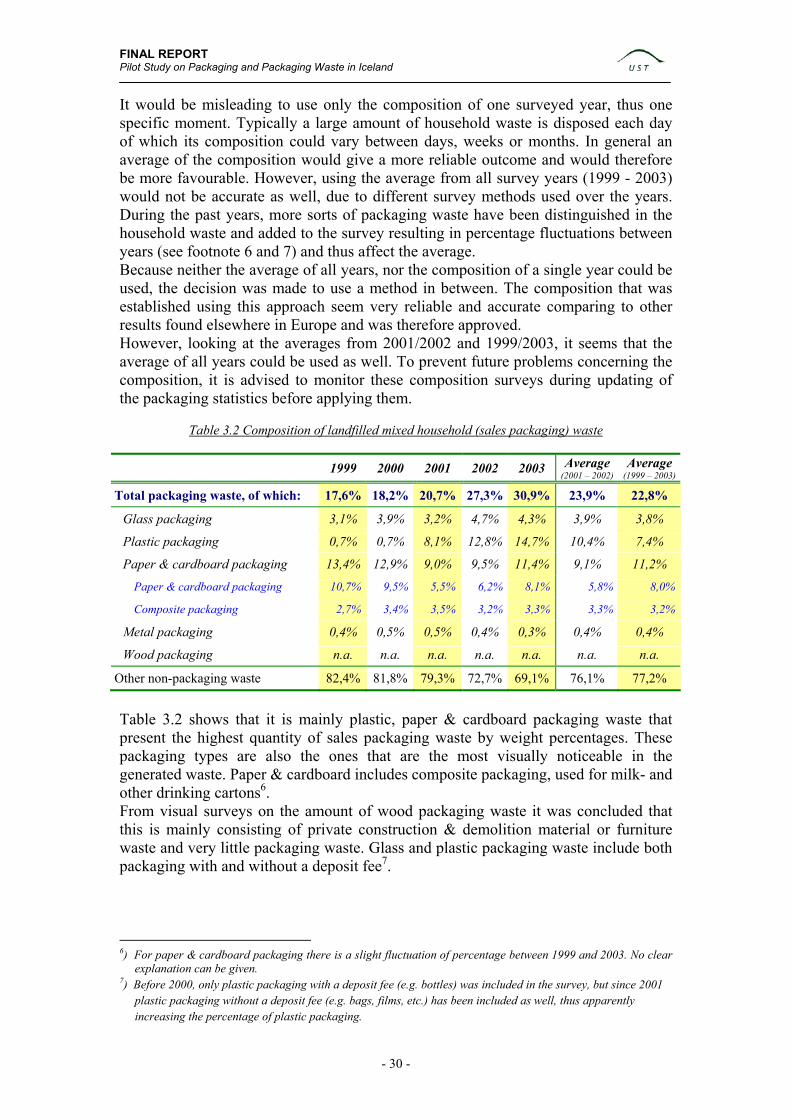
people were living in the Reykjavik capital area; the total population for Iceland in 2002 was 287.559. 3.3.1 Landfilled mixed household waste The composition of mixed household waste, originating from the Reykjavik area, has been surveyed by SORPA over the last 5 years (starting in 1999). After the collection, sorting or recycling of the waste at the sorting and bailing plant the waste is bailed and send to landfill. From the waste that is finally going to landfill a sample varying between 1.500 and 2.000 kg is taken yearly and divided up to 23 specific waste fractions. These fractions can be categorised by material, packaging and non-packaging waste. The percentage for each waste fraction is based on its weight in proportion to the total sampled weight. During this weighing process it has be ensured, that all packaging containing remains of food or other substances, were emptied and cleaned before weighing. From these survey results it can be seen that the mixed household waste mainly contains consumers – or sales packaging and other non-packaging waste. Very little transport packaging is found in mixed household waste. Packaging waste found in mixed household waste can therefore be categorised as sales packaging. Table 3.2 presents the packaging composition that has been found during the surveys, over the last five years. The composition that is used for the final calculations on packaging waste generated in 2002 is the average of the composition found in 2001 and 2002.
FINAL REPORT Pilot Study on Packaging and Packaging Waste in Iceland
- 30 -
It would be misleading to use only the composition of one surveyed year, thus one specific moment. Typically a large amount of household waste is disposed each day of which its composition could vary between days, weeks or months. In general an average of the composition would give a more reliable outcome and would therefore be more favourable. However, using the average from all survey years (1999 - 2003) would not be accurate as well, due to different survey methods used over the years. During the past years, more sorts of packaging waste have been distinguished in the household waste and added to the survey resulting in percentage fluctuations between years (see footnote 6 and 7) and thus affect the average. Because neither the average of all years, nor the composition of a single year could be used, the decision was made to use a method in between. The composition that was established using this approach seem very reliable and accurate comparing to other results found elsewhere in Europe and was therefore approved. However, looking at the averages from 2001/2002 and 1999/2003, it seems that the average of all years could be used as well. To prevent future problems concerning the composition, it is advised to monitor these composition surveys during updating of the packaging statistics before applying them.
Table 3.2 Composition of landfilled mixed household (sales packaging) waste
1999 2000 2001 2002 2003 Average (2001 – 2002)
Average (1999 – 2003)
Total packaging waste, of which: 17,6% 18,2% 20,7% 27,3% 30,9% 23,9% 22,8%
Glass packaging 3,1% 3,9% 3,2% 4,7% 4,3% 3,9% 3,8%
Plastic packaging 0,7% 0,7% 8,1% 12,8% 14,7% 10,4% 7,4%
Paper & cardboard packaging 13,4% 12,9% 9,0% 9,5% 11,4% 9,1% 11,2%
Paper & cardboard packaging 10,7% 9,5% 5,5% 6,2% 8,1% 5,8% 8,0%
Composite packaging 2,7% 3,4% 3,5% 3,2% 3,3% 3,3% 3,2%
Metal packaging 0,4% 0,5% 0,5% 0,4% 0,3% 0,4% 0,4%
Wood packaging n.a. n.a. n.a. n.a. n.a. n.a. n.a.
Other non-packaging waste 82,4% 81,8% 79,3% 72,7% 69,1% 76,1% 77,2%
Table 3.2 shows that it is mainly plastic, paper & cardboard packaging waste that present the highest quantity of sales packaging waste by weight percentages. These packaging types are also the ones that are the most visually noticeable in the generated waste. Paper & cardboard includes composite packaging, used for milk- and other drinking cartons6. From visual surveys on the amount of wood packaging waste it was concluded that this is mainly consisting of private construction & demolition material or furniture waste and very little packaging waste. Glass and plastic packaging waste include both packaging with and without a deposit fee7.
6) For paper & cardboard packaging there is a slight fluctuation of percentage between 1999 and 2003. No clear
explanation can be given. 7) Before 2000, only plastic packaging with a deposit fee (e.g. bottles) was included in the survey, but since 2001
plastic packaging without a deposit fee (e.g. bags, films, etc.) has been included as well, thus apparently increasing the percentage of plastic packaging.

FINAL REPORT Pilot Study on Packaging and Packaging Waste in Iceland
- 31 -
The survey results (see figure A6.1 in Annex 6) show that the largest waste stream in mixed household waste is presented by food leftovers (26-31%). The second largest individual waste stream is paper and cardboard (around 19%), followed by plastics (around 15%). From the total generated mixed household waste, between 60 - 70% (64% in average) presents biodegradable waste. The other waste streams constitute mainly of newspapers, clothing, transparent plastic, metal (scrap), diapers, batteries, stones, food leftovers, floor covering, electric devices, wax and others, which are not considered to contain packaging waste. More detailed breakdown and quantities of the surveyed mixed household waste can be found in annex 6. One has to bear in mind that changes in waste sorting by the public will show changes in the composition of mixed household waste. It is therefore highly recommended to continue these composition surveys on a regular (yearly) basis to ensure the data quality and to establish more reference years, which can be needed for comparing purposes over the years.

FINAL REPORT Pilot Study on Packaging and Packaging Waste in Iceland
- 32 -
3.3.2 Landfilled mixed production waste The composition of production waste is quite different and more diverse than that of mixed household waste. Packaging that can be found in this waste is coming from the commerce and trade industry and is mainly generated by production companies, distributors, manufacturers, packers and fillers. Each of these companies has its own characteristic waste "fingerprint". Production waste is either brought to the sorting and bailing plant and separately processed from the other waste streams or is brought to the landfill directly by the companies themselves or collectors in the private sector. From the survey results on the composition of mixed household waste it can be concluded that mixed production waste mainly would consist of transport packaging and other non-packaging waste. The percentage of sales packaging in mixed production waste is assumed to be very little and can be neglected and therefore packaging found in mixed production waste can be categorized as transport packaging. In order to estimate the composition of mixed production waste, questionnaires and visual surveys at waste treatment companies and municipalities in Iceland were used. For comparison study results on waste composition of mixed household and – production waste in some other European countries were used (Ireland, Norway, Denmark and Romania). It has to be emphasised that the composition of production waste has to be surveyed more thoroughly in the future, especially when updating the packaging statistics to ensure data quality. The estimated composition of mixed production waste is presented in table 3.3.
Table 3.3 Composition of landfilled mixed production (transport packaging) waste
Iceland 2002
Total packaging waste, of which: 26,0%
Plastic packaging 10,0%
Paper & cardboard packaging 15,0%
Metal packaging 0,5%
Wood packaging 0,5%
Other non-packaging waste 74,0%
In mixed production waste, the packaging fractions as plastic, paper and cardboard present the highest percentage. The percentage of metal and wood transport packaging proved to be relatively low because they are mostly separately collected for recycling. Plastic, paper and cardboard packaging waste is generally collected with the rest of the generated waste. Glass transport packaging waste has not been found during the visual surveys and is therefore not included.

FINAL REPORT Pilot Study on Packaging and Packaging Waste in Iceland
- 33 -
Note IV Plastic packaging
Agricultural foil, which is used for packing hay bails, is considered as packaging, and has been separately collected since 2003. There was set a recycling fee for agricultural foil in that year. The total quantity of agricultural foil used in 2002 is assumed to be similar to that of 2003 and has been estimated by the Icelandic Recycling Fund, based on the imported amount, to be around 1.600 tons a year.
Treatment of agricultural foil however has changed significantly between 2002 and
2003. Whereas in 2002 it was mostly landfilled and some part incinerated (with or without energy recovery), in 2003 incineration with energy recovery had increased. The actual quantity that has been recycled could not be estimated during the pilot study but is considered to be negligible.
Therefore, the quantity of agricultural foil was added to the final quantity of plastic
transport packaging going to landfill. This only applies to the year 2002, for future updating of the packaging statistics this quantity is most likely to be divided under recycling and recovery, but needs to be looked into more thoroughly.

FINAL REPORT Pilot Study on Packaging and Packaging Waste in Iceland
- 34 -
3.4 Incineration The calculation that was used to establish the quantity of packaging waste that has been incinerated with energy recovery is based on the method used for landfilled waste. The quantity is calculated using the total amount of waste going to incineration and the composition of mixed household and – production waste. For the composition of the waste streams the same percentages were used as for waste going to landfill. To estimate how much of the incinerated municipal waste consisted of mixed household and – production waste, visual surveys at incineration plants were conducted. These surveys showed that mainly bagged municipal waste is incinerated. It was estimated that approximately 90% of the total incinerated waste presents mixed household waste and only a small amount (10%) is mixed production waste. Today, nearly all waste going to incineration plants is incinerated with energy recovery. Glass and metal present in the incinerated waste can be found in the ashes and slugs. For the comparison with the recovery targets (see paragraph 1.4), only packaging waste that is incinerated with energy recovery will be included and thus excluded the quantities of incinerated glass and metal packaging waste. The final quantities of mixed household and – production waste incinerated in 2002 established using the method as mentioned above are presented in table 3.4.
Table 3.4 Incinerated mixed household and – production waste
Iceland 2002
Total incinerated waste, of which: 7.000 tons
Mixed Household waste (90%) 6.300 tons
Mixed Production waste (10%) 700 tons
FINAL REPORT Pilot Study on Packaging and Packaging Waste in Iceland
- 35 -
3.5 Surveys There are several survey methods that can be used to assess waste streams. Questionnaires and visual surveys have been used here supported with general contact by phone, e-mail and personal visits. The questionnaires that were used during the pilot study were either sent by fax or e-mail. The questionnaires were sent directly to companies that were first contacted by phone, explaining the aim and objectives of the project and asking for their participation in this pilot study. Two questionnaire surveys were used during this pilot study:
a) Questionnaires to local authorities as municipalities, with questions regarding the disposal of transport packaging on landfill sites or sent to incinerators,
b) Questionnaires to companies operating in the commerce, food and trade
industry, with questions regarding the generated waste. Special attention was paid to the composition of waste regarding transport packaging.
For the questionnaires that have been sent to the municipalities the return rates were very poor. On the deadline only 2 out of the 22 municipalities that were contacted had responded. After reminders sent by e-mail and telephone contacts, 5 more municipalities responded in a period of 1 month after the deadline. It was concluded that the information on packaging waste reported by local authorities still remained poor. In total 13 municipalities responded (after several reminders and contacts) resulting in a response rate of 60%, for which most of them could not provide us with the required data and only a few could make (calculated) estimations. The second group of resources that were contacted via questionnaires were companies with packaging or packaging waste activities, operating in the commerce and trade industry e.g. production companies, distributors, manufacturers, retailers, packers, fillers, etc. These companies were contacted before the questionnaires were sent. The response rate of these questionnaires was much higher than the ones directed to the municipalities, but nevertheless remained poor. Here it was also necessary to remind several companies by e-mail or phone. Approximately 4 weeks after the deadline had expired, the response rate was up to 80%. The quality of the information collected from these resources proved to be very useful for further development of the project. The main outcome of the questionnaire survey was that the main packaging waste streams arising at companies operating in the commerce and trade industry consist of plastic, paper and cardboard transport packaging. More detailed information on these questionnaire surveys can be found in annex 2 of this report. In addition to these surveys is the survey that has been carried out by the Customs, which has been explained in paragraph 2.2.3 under “transport packaging”.

FINAL REPORT Pilot Study on Packaging and Packaging Waste in Iceland
- 36 -
3.6 Conclusions From the model as has been described in this chapter, there are a few conclusion that can be made, which are:
To compile data on sorted, recycled, landfilled and incinerated packaging waste, data sources as recycling and sorting companies (SORPA and Endurvinnslan) can be addressed. In most cases these companies operate reliable database systems or present year reports from which the data can be compiled,
Sorted packaging waste, which does not fulfil the criteria for recycling is
going to landfill (or incineration). These quantities are included in the final quantities of mixed household and – production waste used for this modulation,
Mixed household waste only consists of sales packaging and other non-
packaging waste. To calculate the quantities of sales packaging waste going to landfill or incineration, the quantity and composition of mixed household waste will be used,
Mixed production waste only consists of transport packaging and other non-
packaging waste. To calculate the quantities of transport packaging waste going to landfill or incineration, the quantity and composition of mixed production waste will be used,
There are several sorts of packaging waste for which accurate data could not
yet be provided during this pilot study. These are wood, metal and plastic transport packaging. For those, estimations were used which will have to be revised during the updating of the packaging statistics in the future,
The composition of mixed household waste has been surveyed very
thoroughly through the years and accurate and reliable data is available. The composition of mixed production waste however, had to be estimated during this study, though based on visual and questionnaire surveys, and has to be surveyed more thoroughly in the future.

FINAL REPORT Pilot Study on Packaging and Packaging Waste in Iceland
- 37 -
4. Results
4.1 Introduction The results on packaging waste that was generated in Iceland in 2002 was established using the methodological approach based on waste generation and treatment. How these quantities can be found has been described in chapter 3 and therefore this chapter only presents the total and individual packaging waste quantities for each waste treatment method as recycling, landfilling and incineration. Packaging waste quantities are divided by material and type as sales and transport packaging. The results are shortly commented, explaining what the highest and lowest packaging streams are and from which source the data was compiled. The final quantities of recycled and recovered packaging waste are compared with the recycling and recovery targets that Iceland has to comply with and it will be determined which packaging types need further improvements to meet these targets. More detailed information on the figures that has been used for the final calculations on packaging waste can be found in the annexes 5 – 9 of this report.
Annex 5 present all assumptions and estimations that have been used during this pilot study, including a short description, the data source and where it can be found in this report.
Annex 6 presents the results from the composition survey that has been carried
out by SORPA over the last 5 years.
Annex 7 presents the tables that have to be completed according to the Commission Decision 2005/270/EC on the Packaging Directive. The first table presents the quantities of packaging waste generated in the Member State and recycled, recovered or incinerated with energy recovery within or outside the Member State. The second table presents the quantities of packaging waste exported to other Member States or outside the Community for further recycling, recovery or incineration with energy recovery. The third table presents the same as the second table, but is regarding the import of packaging waste into Iceland.
Annex 8 presents the packaging waste results that have been established for
the years 1998, 1998 and 2000, which are used as comparison with this pilot study results. The quantities for the year 1998 and 2000 are based on the figures from 1995 that have been established during another packaging survey, but also include several estimations.
Annex 9 presents the total amounts of waste generated by sector for the years
1995 – 2004 in Iceland.

FINAL REPORT Pilot Study on Packaging and Packaging Waste in Iceland
- 38 -
4.2 Recycled packaging waste 4.2.1 Sales packaging waste In 2002, 7.343 tons of sales packaging waste has been separately collected and recycled inside and/or outside the country. Glass packaging waste represents the highest individual quantity of recycled sales packaging waste. Composite packaging (forms a part of paper & cardboard packaging) presents the lowest individual quantity. Data on glass, plastic and metal packaging is compiled from the Endurvinnslan and paper & cardboard packaging is coming from SORPA year reports. Glass packaging is recycled inside Iceland and the other packaging sorts are all exported. There is no separate collection or recycling for wood sales packaging and is therefore not included in this table.
Table 4.1 Recycled sales packaging waste in Iceland in 2002
Sales
packaging(tons)
Total recycled, of which: 7.343 Glass packaging 3.476 Plastic packaging 1.493 Paper & cardboard packaging 1.894
Paper & cardboard packaging 1.780 Composite packaging 114
Metal packaging 480 4.2.2 Transport packaging waste A total of 7.761 tons transport packaging waste has been separately collected and recycled in Iceland in 2002. Wood transport packaging as pallets and crates present the highest individual quantity of transport packaging waste. Metal packaging present the lowest individual quantity. All wood packaging waste is recycled inside Iceland. Plastic, paper & cardboard are mostly exported, though a small amount is used for domestic recycling. Metal transport packaging is exported together with the other scrap metal waste.
Table 4.2 Recycled transport packaging waste in Iceland in 2002
Transport packaging
(tons) Total recycled, of which: 7.761
Plastic packaging 135 Paper & cardboard packaging 543 Metal packaging 18 Wood packaging 7.065

FINAL REPORT Pilot Study on Packaging and Packaging Waste in Iceland
- 39 -
4.3 Landfilled packaging waste 4.3.1 Mixed household/sales packaging waste In 2002, 16.660 tons of sales packaging waste was landfilled in Iceland. The amount of sales packaging is based on the total quantity of mixed household waste going to landfill and its composition (see paragraph 3.3.1). Plastic packaging presents the highest individual quantity of sales packaging going to landfill, closely followed by paper & cardboard packaging. Metal packaging present the lowest individual quantity. Glass and plastic packaging contains packaging with and without a deposit fee. From the total glass packaging going to landfill, around 35% has a deposit fee (e.g. bottles) and 65% is without a deposit fee. For plastic packaging this is respectively 5% and 95%. Plastic packaging without a deposit fee are mainly plastic bags, small boxes or trays and food wrappings. Wood sales packaging could not be separated from the other wooden waste in mixed household waste, but its quantity is assumed to be very little and can therefore be neglected and is not included in this table.
Table 4.3 Landfilled sales packaging waste in Iceland in 2002
Sales
packaging(tons)
Total landfilled, of which: 16.660 Glass packaging 2.730 Plastic packaging 7.280 Paper & cardboard packaging 6.370
Paper & cardboard packaging 4.060 Composite packaging 2.310
Metal packaging 280 4.3.2 Mixed production/transport packaging waste A total of 22.660 tons transport packaging waste was landfilled in Iceland in 2002. The amount of transport packaging is based on the total quantity of mixed production waste going to landfill and its composition (see paragraph 3.3.2). Paper & cardboard packaging present the highest individual quantity of transport packaging going to landfill, closely followed by plastic packaging. Plastic transport packaging waste includes 1.600 tones of agricultural foil, which in 2002 was still landfilled (see note 4, page 32).
Table 4.4 Landfilled transport packaging waste in Iceland in 2002
Transport packaging
(tons) Total landfilled, of which: 22.660
Plastic packaging 9.700 Paper & cardboard packaging 12.150 Metal packaging 405 Wood packaging 405
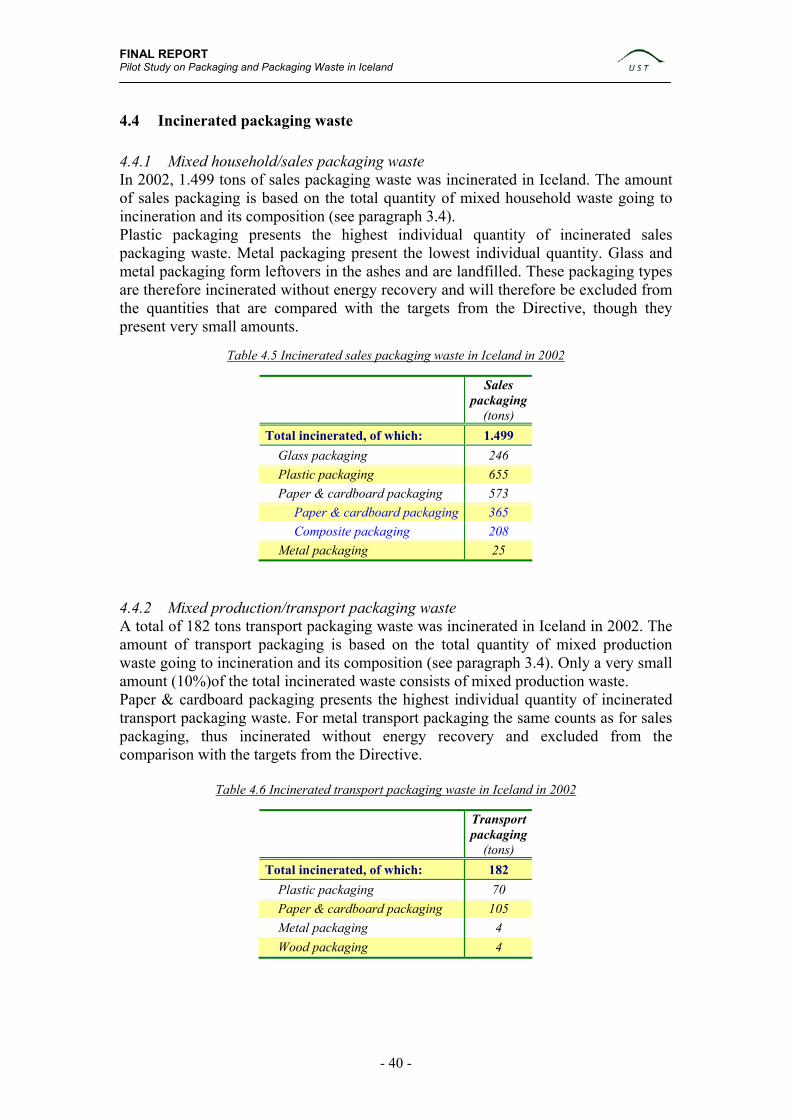
FINAL REPORT Pilot Study on Packaging and Packaging Waste in Iceland
- 40 -
4.4 Incinerated packaging waste 4.4.1 Mixed household/sales packaging waste In 2002, 1.499 tons of sales packaging waste was incinerated in Iceland. The amount of sales packaging is based on the total quantity of mixed household waste going to incineration and its composition (see paragraph 3.4). Plastic packaging presents the highest individual quantity of incinerated sales packaging waste. Metal packaging present the lowest individual quantity. Glass and metal packaging form leftovers in the ashes and are landfilled. These packaging types are therefore incinerated without energy recovery and will therefore be excluded from the quantities that are compared with the targets from the Directive, though they present very small amounts.
Table 4.5 Incinerated sales packaging waste in Iceland in 2002
Sales packaging
(tons) Total incinerated, of which: 1.499
Glass packaging 246 Plastic packaging 655 Paper & cardboard packaging 573
Paper & cardboard packaging 365 Composite packaging 208
Metal packaging 25 4.4.2 Mixed production/transport packaging waste A total of 182 tons transport packaging waste was incinerated in Iceland in 2002. The amount of transport packaging is based on the total quantity of mixed production waste going to incineration and its composition (see paragraph 3.4). Only a very small amount (10%)of the total incinerated waste consists of mixed production waste. Paper & cardboard packaging presents the highest individual quantity of incinerated transport packaging waste. For metal transport packaging the same counts as for sales packaging, thus incinerated without energy recovery and excluded from the comparison with the targets from the Directive.
Table 4.6 Incinerated transport packaging waste in Iceland in 2002
Transport packaging
(tons) Total incinerated, of which: 182
Plastic packaging 70 Paper & cardboard packaging 105 Metal packaging 4 Wood packaging 4

FINAL REPORT Pilot Study on Packaging and Packaging Waste in Iceland
- 41 -
4.5 Total generated packaging waste From tables 4.1 till 4.6 it can be seen that a total of 56.105 tons of packaging waste was generated in Iceland in 2002, which is 195 kg per capita. From the total generated packaging waste, 25.502 tons (45%) is assumed to be sales packaging waste and 30.603 tons (55%) transport packaging waste. From the total generated, 39.320 tons (70%) is landfilled, 15.104 tons (27%) is recycled and 1.681 tons (3%) is incinerated (mostly) with energy recovery. The total generated packaging waste represents 36% of the total generated municipal and production waste. Paper & cardboard packaging present the highest packaging waste stream with 40% of the total generated from which cardboard transport packaging waste present the highest individual packaging stream. Plastic packaging waste presents the second largest packaging waste stream with 34% of which the quantity sales and transport packaging are almost equal to each other. Plastic, paper & cardboard packaging waste added together present up to 74% of the total generated packaging waste.
Table 4.7 Total generated packaging waste in Iceland in 2002
Total packaging Class. *
Sales packaging
(tons)
Transport packaging
(tons) (tons) (%)
Total generated, of which: 25.502 (89 kg/capita)
30.603 (106 kg/capita)
56.105 (195 kg/capita) 100
Recycled 7.343 7.761 15.104 27 Landfilled 16.660 22.660 39.320 70 Recovered 1.499 182 1.681 3
Glass packaging 07.11 6.452 n.a. 6.452 11 Plastic packaging 07.41 9.428 9.905 19.333 34 Paper & cardboard packaging 07.21 8.837 12.798 21.635 40
Paper & cardboard packaging -- 6.205 12.798 19.003 35 Composite packaging -- 2.632 n.a. 2.632 5
Metal packaging 06.31 785 427 1.212 2
Wood packaging 07.51 n.a. 7.473 7.473 13 * Possible classification according to the Waste Statistics Regulation NACE rev.1, see page 12.
Figure 4.1 Total generated packaging waste in Iceland in 2002
Wood packaging13%
Metal packaging2%
Paper & cardboardpackaging
40%
Plastic packaging34%
Glass packaging11%

FINAL REPORT Pilot Study on Packaging and Packaging Waste in Iceland
- 42 -
4.6 Comparison with recycling and recovery targets A comparison has been made between the packaging waste results for 2002 and the recycling and recovery targets from the Packaging Directive 94/62/EC. Recovery in Iceland consists of recycling and incineration with energy recovery. In the Directive minimum targets have been set for the recycling of individual packaging waste materials. For recovery there are no individual targets set. For the total recycling and recovery of packaging waste, both minimum and maximum targets have been set. All the targets are presented as percentages by weight. The comparison between the packaging results from 2002, with the recycling and recovery targets for 2001 and 2011 is presented in table 4.8 and illustrated in figure 4.2.
Table 4.8 Comparison with packaging waste recycling and recovery targets
Recycling Recovery Results 2002 Results 2002
Total Generated
(tons) Target 2001
Target 2011 (tons) (%)
Target 2001
Target 2011 (tons) (%)
Total, of which: 56.105 25 - 45%
55 - 80% 15.104 26,9 50 –
65% 60% 16.558 29,5
Glass packaging 6.452 15% 60% 3.476 53,9 - - 3.476 53,9 Plastic packaging 19.333 15% 22,5% 1.628 8,4 - - 2.353 12,2 Paper & cardboard packaging 21.635 15% 60% 2.437 11,3 - - 3.162 14,6
Paper & cardboard packaging 19.003 15% 60% 2.323 12,2 - - 3.048 16,0 Composite packaging 2.632 - - 114 4,3 - - 839 31,9
Metal packaging 1.212 15% 50% 498 41,1 - - 498 41,1 Wood packaging 7.473 15% 15% 7.065 94,5 - - 7.068 94,6
Figure 4.2 Comparison with packaging waste recycling targets
0%10%20%30%40%50%60%70%80%90%
100%
Perc
enta
ge b
y w
eigh
t
Glasspackaging
Plasticpackaging
Paper &cardboardpackaging
Metalpackaging
Woodpackaging
Packaging waste recyclingtarget for 2001 (as aminimun)
Packaging waste results for2002
Packaging waste recyclingtarget for 2011 (as aminimum)
FINAL REPORT Pilot Study on Packaging and Packaging Waste in Iceland
- 43 -
5. Evaluation & Conclusions During the work that has been carried out during this pilot study it became clear that packaging usage forms a complex structure. To assess the packaging streams it is necessary to use a sophisticated and elaborated data collection system. Conclusion 1: Data quality and reliability Roughly, one could distinguish two main approaches to find the assess the amounts of packaging used, i.e. by looking into packaging placed on the market with import, export, domestic production as main parameters and by waste treatment with separation, collection and the different treatment methods as parameters. During this pilot study, the approach of looking into import, export and domestic production of packaging proved to be highly ineffective, as the data registration used by the Icelandic Directory of Customs and Icelandic Statistics do not provide the necessary information needed for the reporting obligation in the Packaging Directive. During the pilot study it became clear that making the system compatible to suit the reporting obligation would be very time-consuming, if possible at all. It has to be noted though that future developments might change the feasibility of this approach as it may be expected that ever more packaging materials will be subject to a recycling fee in the future, thus making their specific registration more accurate. The approach of looking into the packaging waste generation and – treatment proved to be more promising. However, specific data registration on packaging waste represents a weak point in the waste statistics, not only in Iceland, but also in other countries that are not equipped with a registration system of selective collection of packaging waste arising from different sources, such as households, production and other companies. In Iceland packaging waste is in generally not separately registered from other generated waste, as packaging waste is very much treated together with other generated municipal and production waste. Another difficulty lies within the packaging definitions, which typically countries have different conceptions of and thus making it difficult and unclear which definition to use, resulting in problems with comparison of data sets e.g. different conceptions of what municipal, mixed household and - production waste is. Reliability, consistency and accuracy of the basic parameters need further improvement on a regional level to ensure overall data quality. With the implementation of regional waste management plans it may be expected that waste statistics will be more and more suitable for assessing packaging waste amounts on a national level.
FINAL REPORT Pilot Study on Packaging and Packaging Waste in Iceland
- 44 -
Conclusion 2: Waste composition The waste composition, meaning the packaging and non-packaging fractions found in waste, is based on yearly measurements of municipal waste composition and visual and questionnaire surveys on production waste composition. Similar studies and surveys have been carried out in other European countries. It can be assumed that packaging waste in mixed household waste, which is generated by households and companies consist only of sales packaging (primary). Furthermore it can be assumed that mixed production waste from companies consists only of secondary and tertiary, thus transport packaging waste. Secondary packaging is included in transport packaging because is has almost the same purpose as tertiary packaging and is sometimes difficult to distinguish from transport packaging. Conclusion 3: Recycling data system Data on recycled packaging waste is mostly obtained from municipalities, waste treatment facilities and recycling companies and the quality of this data can be ensured by the use of reliable and accurate registration systems, making updating of the recycled packaging statistics possible. Data on landfilled or incinerated packaging waste can be found through several mathematical approaches based on calculations of the composition and total quantity of mixed household and – production waste going to landfill or incineration. Conclusion 4: Reaching the targets of the Directive The final recycling and recovery results showed that Iceland has some difficulties complying with the targets of the Packaging Directive Both for several individual packaging sorts as for the total quantity of packaging recycling and recovery Iceland does not meet these targets. From the results on packaging recycling it can be concluded that the biggest difficulty in complying with the recycling targets is for plastic, paper and cardboard packaging waste. Both packaging streams do not comply with the target for 2001 and are still far from the target for 2011. The recycled glass, metal and wood packaging waste all comply with the targets for 2001. Wood packaging already complies with the target for 2011, where glass and metal packaging are still a few percentages to short. The total quantity of recycled packaging waste complies with the target for 2001, but is still far from the target for 2011. From the results on packaging recovery it can be concluded that the targets for total recovery of packaging waste has not been reached so far. The quantities of recovered packaging waste as incineration with energy recovery present only a very small percentage of the total recovered. Although a significant amount of work has been accomplished to reach these targets, further development and improvements have to be made to reach the targets in the remaining space of time.

FINAL REPORT Pilot Study on Packaging and Packaging Waste in Iceland
- 45 -
Conclusion 5: Updating statistics Generated packaging waste and its treatment has to be reported according to the Commission Decision 2005/270/EC. The tables presented in this Decision are based on packaging waste generation and treatment and thus replaces the tables that are presented in the packaging Directive 94/62/EC, which are based on packaging import, export and domestic production. The Icelandic findings in this pilot study confirm that the shift from data collection on packaging based on import, export and domestic production, as described in Packaging Directive, to a methodological approach based on packaging waste statistics, as described in Commission decision, is favorable and gives a more reliable and manageable system in practice. Packaging statistics must be updated annually. The first update must be carried out in 2006, presenting the packaging statistics for the year 2003 and from that point forward. For updating the statistics this final report can be used as a manual, whereas the made estimations and assumptions might need to be evaluated and revised if necessary. Conclusion 6: Packaging Directive vs. WStatR Finally it can be concluded that it might be problematic to incorporate the packaging waste data reported under the Packaging Directive into the WStatR. The level of detail that is used in the Packaging Directive does not match the requirements for the WStatR, which is to report generated (packaging) waste by all economical activities that are found in a Member State. More information about the packaging waste reported under the Packaging Directive or WStatR, comparison of packaging waste statistics between countries and possible application of a harmonised methodology in other countries will be discussed in the next chapter.

FINAL REPORT Pilot Study on Packaging and Packaging Waste in Iceland
- 46 -
6. Recommendations & Discussion This chapter presents the recommendations and discussion regarding the questions that are asked in the Terms of Reference and refer to the following subjects:
How should the packaging statistics be reported, under the WStatR or under the Packaging Directive?
Which level of detail has to be used for the packaging statistics? How can methodologies be harmonised and how can data quality and
comparability be ensured? What is needed to improve domestic recycling of packaging waste?
Packaging Directive vs. WStatR One of the main questions is whether and in what way the WStatR should include packaging waste and/or whether the reporting obligation under the Packaging Directive could be replaced by the WStatR? Or can the data already obtained under the Packaging Directive be included in waste statistics? Whereas packaging waste reported under the Commission Decision 2005/270/EC (replacing the formats from the Packaging Directive 94/62/EC) is focussed on reporting packaging waste statistics according to treatment, the reporting obligations under the WStatR are based on the economical activities that are to be found within a Member State. From the pilot study results it can be concluded that it will be very difficult for Iceland to include packaging statistics reported under the Commission Decision into the WStatR. Statistics compiled using the registrations on waste sorts and – treatment cannot be divided into the classification (NACE) used in the WStatR. Although there are a few packaging streams (e.g. agricultural foil, fish boxes, crates and barrels, oil drums), which could be reported according to the WStatR, it would only present a small percentage (10 – 15%) of the total generated packaging waste. In order to report all generated packaging waste under the WStatR requires more resources and better registration methods. During this pilot study it was not possible to identify any clear and operational options to report packaging waste under the WStatR and therefore it is proposed to report packaging statistics under the Packaging Directive (according to the Commission Decision 2005/270/EC). Packaging waste level of detail The second main question asked in the Terms of Reference is how detailed packaging waste should appear in the statistics. The answer to this question depends very much on the decision if statistics have to be reported under WStatR or Packaging directive. Reporting packaging waste based on the economical sectors requires a different level of detail than reporting it according to waste generation and treatment. The level of detail that was used during this pilot study is related to the reporting obligations of the Commission decision, which is by material, type and treatment. This format and level of detail seem to be already available in most of the other European countries and would therefore also be applicable for statistics comparison between countries.

FINAL REPORT Pilot Study on Packaging and Packaging Waste in Iceland
- 47 -
A point of interest regarding the level of detail is the decision to report packaging waste in two, instead of three types of packaging. Whereas data on primary (sales) and tertiary (transport) packaging are relatively easy to obtain secondary (grouped) packaging is less detectable in Iceland. Secondary packaging has almost a similar purpose as tertiary packaging and is typically difficult to distinguish from the generated transport packaging waste. Therefore, it is proposed to include secondary packaging under tertiary packaging and report them as transport packaging to enhance data quality and comparability. Although the Commission Decision 2005/270/EC does not require reporting of sales and transport packaging, it is recommended for the Icelandic situation to keep the distinction between packaging sorts. This is both for the benefit of data collection and -quality as well as monitoring recovery activities. Harmonising methodologies and comparability A country’s waste management system is much related to the economical and geographical situation of that country, as the system can be expected to respond with the use of packaging materials available. In Iceland much of the products used are imported, resulting in a relative high amount of transport packaging. When harmonising methodologies in order to compare different data sets and situations in countries, aspects such as the consumption pattern of packaging, waste definitions and geographical situation have to be considered. These aspects typically result in different quantities of different packaging waste sorts generated in a country and thus affects data comparability. It is for this reason that Iceland recommends to evaluate the packaging consumption and the definitions used before making final proposals for data comparison. Domestic recycling Domestic recycling in Iceland is problematic due to the long distances between municipalities and the relatively low quantities of waste. Local recycling of packaging waste within the country is only economically interesting for those waste streams that are voluminous and represent a relative low economical value, e.g. wooden pallets. As cheap energy is widely abundant in Iceland, incineration with energy recovery is not very interesting from an economical point of view. The comparison with the recycling targets (chapter 4) show that plastic, paper & cardboard packaging are the waste streams, which Iceland has the most problems complying with. Although several recycling companies are operating in Iceland, most of them produce on a small scale, covering just a small area. Because most of the packaging is imported to Iceland it could be economically interesting to look at the possibilities to increase the recycling of packaging waste and use it for the domestic production of new packaging, replacing some of the imported packaging. It has been calculated that collection and export of certain packaging types as paper, cardboard and plastic foil is cheaper than landfilling today, but this would only apply to the more densely populated area of the Reykjavik capital. Collection of packaging waste in other parts of the country is costly and it remains to be seen whether this would be defendable from an environmental point of view, as its long transport to a recycling center can be expected to have a significant environmental impact. A thorough life-cycle assessment is needed to make clear whether this would be a realistic and sensible option.
FINAL REPORT Pilot Study on Packaging and Packaging Waste in Iceland
- 48 -
To meet the targets of the Packaging Directive it is clear that either the recycling capacity within the country has to increase significantly or an increase in export of recyclable packaging waste is needed. There are several ways of increasing domestic recycling possible: 1) Paper & cardboard packaging waste, together with non-packaging, could be used to manufacturing egg trays or other products that are typically made of recycled paper & cardboard. The advantage of this recycling process in Iceland is the use of the geothermal recourses, which present most of the necessary ingredients for the recycling process as (warm) water, steam and electricity. To enhance an increase in recycling rates, paper & cardboard packaging waste it is necessary to collect them from the companies operating in the commerce and trade industry (generating mixed production waste, including transport packaging). Before the year 2011, paper & cardboard packaging recycling has to increase by 44%, in order to reach a target of 60%. Based on the waste figures calculated during this pilot study it can be estimated that it requires the collection of 90% of the paper & cardboard packaging waste generated by those companies in order to meet this target. This percentage is based on a situation in which the total generated municipal waste does not increase drastically, including the quantities of paper & cardboard packaging waste that are already collected today by SORPA. 2) Recycled plastic packaging could be used for the production of road signs (already done by Plastmótun) or transport packaging (e.g. foils, pallets, fish boxes, etc.). Compared to paper & cardboard, the recycling target for plastic packaging could relatively easy be reached. Before the year 2011, plastic packaging recycling has to increase by 12%, in order to reach the target of 22,5%. A similar situation occurs as for paper & cardboard, which is approaching the companies operating in the commerce and trade industry in order to establish the largest increase in recycling rate. It is mainly plastic wrappings as films and foils that can be collected from these sectors, though other packaging types as crates, barrels or pallets can be collected as well. A large contribution to the plastic recycling will be the collection of agricultural foil, which has been charged with a recycling fee starting from 2003, forcing the separate collection of this waste. Based on the waste figures calculated during this pilot study it can be estimated that it requires a collection of 20% of the plastic packaging waste generated by those companies in order to meet the target. This percentage is based on a situation in which the total generated municipal waste does not increase drastically, including the quantities of plastic packaging waste that are already collected and recycled today by Endurvinnslan (export) and Plastmótun (recycling). In addition is the collection of Agricultural foil, which might be included in order to reach the target and could presents between 25 – 30% of the total quantity of plastic packaging recycling. The collected transport packaging waste is generally cleaner compared to the sales packaging from households and collecting transport packaging requires fewer resources to reach the required amounts compared to the collection of sales packaging from households. Generally one source in the commerce and trade industry covers a much larger quantity of packaging waste than from one household.
FINAL REPORT Pilot Study on Packaging and Packaging Waste in Iceland
- 49 -
7. References Pilot study working-group
Cornelis A. Meyles, Rob P.M. Kamsma Umhverfisstofnun (UST) – The Environment and Food Agency of Iceland
Edda Hermannsdóttír Hagstofa Íslands - Statistics Iceland
Geir Oddsson, Anne M. Sparf
Umhverfisstofnun Háskoli Íslands – The Environmental Research Institute, University of Iceland (ERI)
Other participators and contacts Björn H. Halldórsson, Gyða S. Björnsdóttir SORPA
Eiríkur Hannesson Endurvinnslan hf
Karll Garðasson Tollur – The Directorate of Custom
Ólafur Kjartansson Úrvinnslusjoður – The National Recycling Fund
Hjörtur Jónsson Plastmótun ehf.
Einar Guttormsson Hringrás ehf. Directives and regulations
Pilot studies Terms of References, Third call for proposal, Pilot Studies for the implementation of Regulation 2150/2002/EC on waste statistics, Technical description of the action
Landsáætlun um meðhöndlun urgangs 2004 – 2016, Icelandic National Waste Management Plan for 2004 –2016, Umhverfisstofnun.
The European Parliament and Council Directive 94/62/EC of 20 December 1994 on packaging and packaging waste.
Regulation (EC) No 2150/2002 (WStatR) of the European Parliament and the Council of 25 November 2002 on waste statistics.
Commission Decision 2005/270/EC establishing the formats relating the database system pursuant to European Parliament and Council Directive 94/62/EC on packaging and packaging waste.
Other documentation
A survey on trends in usage, recycling, and recovery of packaging in Iceland from 1991 to the year 2001, The Environment and Food Agency in Iceland, Cornelis A. Meyles,
A Survey of Nordic Packaging Data Collection Methods, Nordic council of ministers Environment, TemaNord 2003:562, O. Kaysen Econet A/S and J. Jakobsen LOGISYS A/S.
National Waste Database, Factsheet series 2001, EPA Environment Protection Agency, Ireland
External Trade by HS numbers, Hagstofa Íslands 2002, Iceland
Könnun á magni umbúða á Íslandi árið 1991, Iðntæknistofnun – G. Kjartansson, G. Jónsson and H. J. Bjarnadóttir, Iceland 1993
Könnun á magni umbúða á Íslandi árið 1995, Endurvinnslan hf. - G. Bragason, Iceland 1997
Interim Report, Pilot Study on Packaging and Packaging Waste, The Environment and Food Agency in Iceland, October 2004, Rob P.M. Kamsma, Cornelis A. Meyles Interim Reports on the Pilot Study on Packaging and Packaging Waste reported by Romania, Greece, Malta, Slovenia and Lithuania

FINAL REPORT Pilot Study on Packaging and Packaging Waste in Iceland
A 1 - 1
Annex I
Terms of Reference

FINAL REPORT Pilot Study on Packaging and Packaging Waste in Iceland
A 1 - 2
Third call for proposal Pilot studies for the implementation of Regulation 2150/2002/EC
on waste statistics
Technical description for a pilot study on statistics on packaging waste 1. Background
The discussion on packaging waste raised two questions. The first concerned the different categories of packaging waste. The main question was how detailed should packaging waste appear in the statistics. This was related to the second question on how the reporting obligation under the Packaging Directive (94/62/EC) can be incorporated into the Statistics regulation. Or the other way around, could the data reported under the Packaging Directive be used as input for the statistics?
According to Annex I, Section 2(2) of the Waste Statistics Regulation (No 2002/2150/EC), pilot studies shall be carried out in order to assess the inclusion of packaging waste categories in the EWC-Stat (Annex I, Section 2.)
“In accordance with the reporting obligation under Directive 94/62/EC, the Commission will draw up a programme for pilot studies to be carried out on a voluntary basis by Member States in order to assess the relevance of including packaging waste entries (EWC-Stat Rev2) in the breakdown list set out in point 1 (Annex I, Section 2.1). The Commission will finance up to 100% of the costs for these pilot studies. On the basis of the conclusions of these pilot studies, the Commission will adopt the necessary implementation measures in accordance with the procedure referred to in Article 7(2) of this Regulation”.
The aim of the pilot study is to assess the relation between the Waste Statistics Regulation and the reporting obligation in the Packaging Directive and thereby assess the relevance of including packaging waste in Annex I of the Waste Statistics Regulation. The conclusions from pilot studies have to be clear, operational and include assessment on the cost effectiveness and the quality of data obtained.
The Commission shall adopt the necessary implementing measures based on the results of pilot studies.

FINAL REPORT Pilot Study on Packaging and Packaging Waste in Iceland
A 1 - 3
2. Objectives The study should give an answer to the following questions:
A. General information
i. Which are the (environment) policy needs concerning statistics on packaging waste and to be included in the context of waste statistics, both at national and EU-level.
B. Specific information on data collection
ii. Identification of options to include packaging waste within the Waste Statistics Regulation.
iii. Proposals on streamlining the process of data collection and reporting. Recommendations on whether and in what way the Waste Statistics Regulation should include packaging waste and/or whether the reporting obligation under the Packaging Directive could be replaced by the Waste Statistics Regulation? Or can the data already obtained under the Packaging Directive be included in waste statistics?
iv. Proposals for the necessary level of detail for statistics on packaging waste.
v. Inclusion of work that already has been done on reporting of packaging waste (DG Environment).
C. Conclusions and recommendations
In the conclusions of the study specific attention should be given on the questions:
vi. What is a realistic and manageable way of collecting the data in the Member States?
vii. How can data quality and comparability be ensured?
viii. A recommendation for a harmonised methodology, with possible application in other countries has to be given.
The conclusions from pilot studies have to be clear, operational and include assessment on the cost effectiveness and the quality of data obtained in the proposed methodology. The Commission shall adopt the necessary implementing measures based on the results of pilot studies.

FINAL REPORT Pilot Study on Packaging and Packaging Waste in Iceland
A 2 - 1
Annex II
Questionnaire survey and results

FINAL REPORT Pilot Study on Packaging and Packaging Waste in Iceland
A 2 - 2
REPORT OF QUESTIONNAIRE ON PACKAGING AND
PACKAGING WASTE
Survey of chosen Icelandic companies
Companies were contacted by phone 19th January 2005 to introduce the project, followed
by a survey that was sent out to 12 companies with packaging and packaging waste
activities the same day by e-mail. A reminder e-mail was sent 31st of January. In addition,
those companies that had not answered were contacted again by phone 15th of February.
A total of 10 answers were received, so the reply rate was 83%.
The contacted companies were:
Plastprent/Sigurplast
Blumarís/Skinney Thinganes
Lýsi
Ora
SR-mjöl/Síldarvinnslan
Osta- og smjörsalan
Mjólkursamsalan (MS)
Katla
Nói Síríus
Egill Skallagrímsson
Samhentir Kassagerð
Kassagerðin
Katla informed that they did not have the time to reply the survey. Answers were not
received from Ora. The majority of the companies were medium to large sized
production companies, operating in the most important economical sectors that are
related to packaging and packaging waste (Table 1 to 3).

FINAL REPORT Pilot Study on Packaging and Packaging Waste in Iceland
A 2 - 3
Table A 2.1 Description of activities
Please give a short description of your company and its activities
Name of company Description of activities
Plastprent Produces and sells film packaging and plastic bottles and containers
Skinney Thinganes Fish catching and producing
Lýsi Production of fishoil and fishoil related products
Síldarvinnslan Production and export of various fish products + 5 fish oil factories
Osta- og smjörsalan Packaging, marketing and sales of cheese and dairy products Import of packaging and raw materials, additives and equipment for own use and for regional dairy assoications
Mjólkursamsalan, MS* Production, packaging, sales and distribution of dairy products
Nói Síríus Production, import and distribution of confectionary and candy Import and distribution of of breakfast cereals
Egill Skallagrímsson Manufacturer of soft drinks, beer and spirits. Importer of coffee, wine and spirits
Samhentir Kassagerð Trading company, with packaging goods (import mostly), Wearhouse for packaging goods. Sell to fishindustry and industrial companys
Kassagerðin Producer of corrugated and folding carton
* For operations in Reykjavík

FINAL REPORT Pilot Study on Packaging and Packaging Waste in Iceland
A 2 - 4
Table A 2.2 Type of business
Which of the following descriptions apply to your company?
Company Production company
Retail business
Wholesale or small business
Packer or filler of products
Plastprent x
Skinney Thinganes x
Lýsi x x
Síldarvinnslan x
Osta- og smjörsalan x
Mjólkursamsalan, MS x x x
Nói Síríus x
Egill Skallagrímsson x
Samhentir Kassagerð x
Kassagerðin x
Table A 2.3 Number of employees
What is the number of employees at your company?
Company 1-9 10-19 20-49 50-99 >100
Plastprent x
Skinney Thinganes x
Lýsi x
Síldarvinnslan x
Osta- og smjörsalan x
Mjólkursamsalan, MS x
Nói Síríus x
Egill Skallagrímsson x
Samhentir Kassagerð x
Kassagerðin x
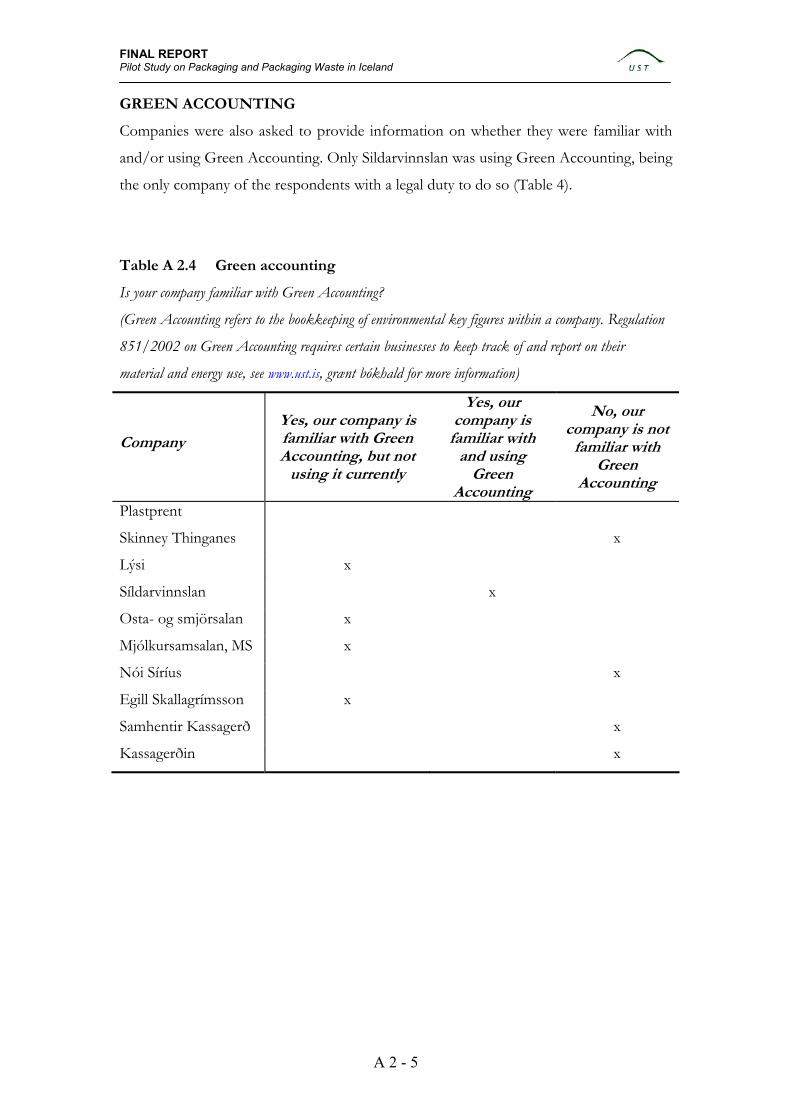
FINAL REPORT Pilot Study on Packaging and Packaging Waste in Iceland
A 2 - 5
GREEN ACCOUNTING
Companies were also asked to provide information on whether they were familiar with
and/or using Green Accounting. Only Sildarvinnslan was using Green Accounting, being
the only company of the respondents with a legal duty to do so (Table 4).
Table A 2.4 Green accounting
Is your company familiar with Green Accounting?
(Green Accounting refers to the bookkeeping of environmental key figures within a company. Regulation
851/2002 on Green Accounting requires certain businesses to keep track of and report on their
material and energy use, see www.ust.is, grænt bókhald for more information)
Company Yes, our company is familiar with Green Accounting, but not
using it currently
Yes, our company is
familiar with and using
Green Accounting
No, our company is not
familiar with Green
Accounting
Plastprent
Skinney Thinganes x
Lýsi x
Síldarvinnslan x
Osta- og smjörsalan x
Mjólkursamsalan, MS x
Nói Síríus x
Egill Skallagrímsson x
Samhentir Kassagerð x
Kassagerðin x
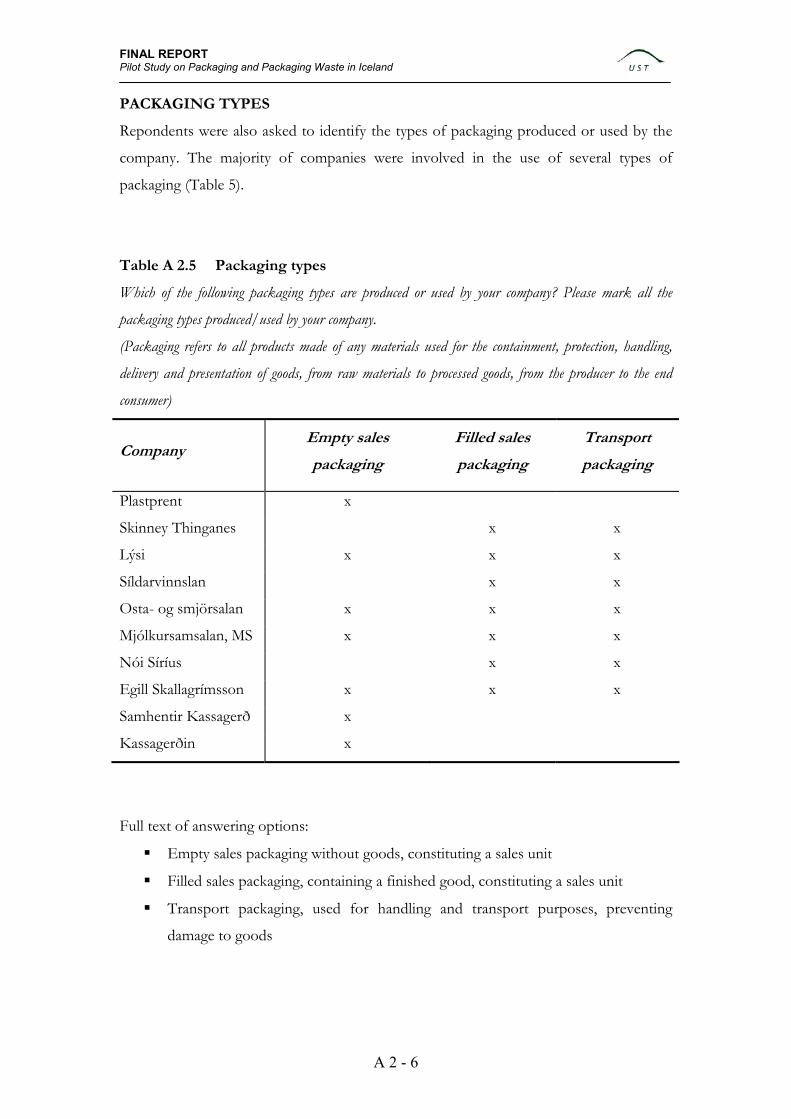
FINAL REPORT Pilot Study on Packaging and Packaging Waste in Iceland
A 2 - 6
PACKAGING TYPES
Repondents were also asked to identify the types of packaging produced or used by the
company. The majority of companies were involved in the use of several types of
packaging (Table 5).
Table A 2.5 Packaging types
Which of the following packaging types are produced or used by your company? Please mark all the
packaging types produced/used by your company.
(Packaging refers to all products made of any materials used for the containment, protection, handling,
delivery and presentation of goods, from raw materials to processed goods, from the producer to the end
consumer)
Company Empty sales
packaging
Filled sales
packaging
Transport
packaging
Plastprent x
Skinney Thinganes x x
Lýsi x x x
Síldarvinnslan x x
Osta- og smjörsalan x x x
Mjólkursamsalan, MS x x x
Nói Síríus x x
Egill Skallagrímsson x x x
Samhentir Kassagerð x
Kassagerðin x
Full text of answering options:
Empty sales packaging without goods, constituting a sales unit
Filled sales packaging, containing a finished good, constituting a sales unit
Transport packaging, used for handling and transport purposes, preventing
damage to goods

FINAL REPORT Pilot Study on Packaging and Packaging Waste in Iceland
A 2 - 7
PACKAGING MATERIALS
The majority of companies were using several types of packaging materials, as the results
in Table 6 show. Plastic as well as paper/cardboard were the most common types of
packaging materials used.
Table A 2.6 Packaging materials
Which of the following packaging materials are produces or used by your company? Please mark all the
packaging materials produced or used by your company.
(Production of packaging means the actual production of the packaging itself, which later in the process
will be used to pack goods. A packaging is used when filled or packed with a good so it can be put on the
market)
Company Glass PlasticPaper and
cardboard Metal Wood Composite
Plastprent x x x x
Skinney Thinganes
Lýsi x x x x x
Síldarvinnslan x x x x
Osta- og smjörsalan x x x x
Mjólkursamsalan, MS x x x x
Nói Síríus x x x x
Egill Skallagrímsson x x x x
Samhentir Kassagerð x x
Kassagerðin x
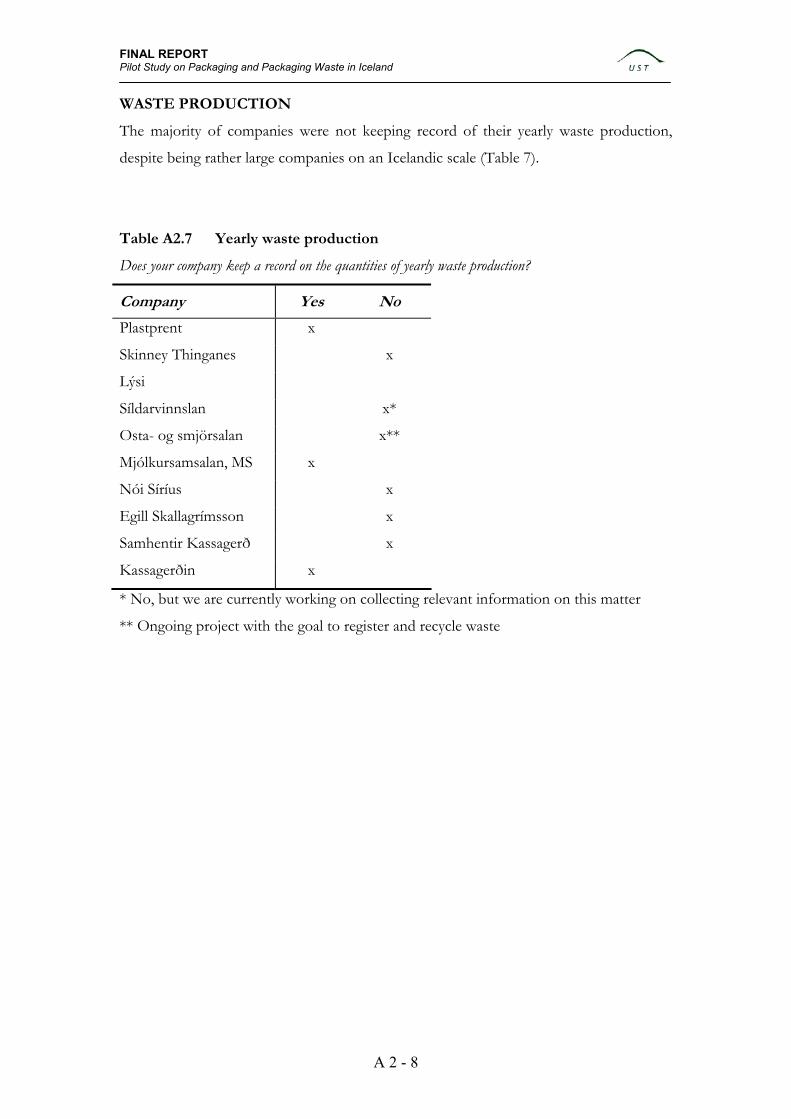
FINAL REPORT Pilot Study on Packaging and Packaging Waste in Iceland
A 2 - 8
WASTE PRODUCTION
The majority of companies were not keeping record of their yearly waste production,
despite being rather large companies on an Icelandic scale (Table 7).
Table A2.7 Yearly waste production
Does your company keep a record on the quantities of yearly waste production?
Company Yes No
Plastprent x
Skinney Thinganes x
Lýsi
Síldarvinnslan x*
Osta- og smjörsalan x**
Mjólkursamsalan, MS x
Nói Síríus x
Egill Skallagrímsson x
Samhentir Kassagerð x
Kassagerðin x
* No, but we are currently working on collecting relevant information on this matter
** Ongoing project with the goal to register and recycle waste

FINAL REPORT Pilot Study on Packaging and Packaging Waste in Iceland
A 2 - 9
PACKAGING WASTE STREAMS
The results regarding the composition of packaging waste streams are not comparable, as
some respondents have obviously intended the quantitities to represent percentage of the
total waste stream, not only packaging waste. However, plastic and paper/cardboard
were the largest packaging waste streams in most companies.
Note: For future use this question should be rephrased to avoid misunderstandings
Table A 2.8 Packaging waste streams
Please estimate the quantities of specific materials within the total packaging waste stream generated by
your company
Company Glass Plastic Paper and cardboard
Metal Wood Composite Other
Plastprent <1%
Skinney Thinganes NA >20% >20%
Lýsi >20% <1% >20% <1% <20% NA <5%
Síldarvinnslan <1% >20% <10% NA NA NA NA
Osta- og smjörsalan <1% <20% >20% <1% <5% <1%
Mjólkursamsalan, MS NA 55% 10% 7% NA 28% NA
Nói Síríus NA >20% >20% <1% NA <1% NA
Egill Skallagrímsson <1% <1% <5% <1%
Samhentir Kassagerð NA <20% >20% <5% <10% NA NA
Kassagerðin >20%
Replying instructions for this question:
For each packaging material, please mark the cell that you think gives a reliable
estimation of the size of that specific waste stream compared to the total. Please note
that the question only concerns packaging waste, and does not include production
residues or other waste streams. If the material is not part of your packaging waste
stream, please mark NA, for not applicable.

FINAL REPORT Pilot Study on Packaging and Packaging Waste in Iceland
A 2 - 10
REUSE OF TRANSPORT PACKAGING
The majority of companies were reusing transport packaging. Wooden transport
packaging (pallets), were the most common type of reused transport packaging (Table 9).
Table A 2.9 Reuse of transport packaging
Does your company reuse transport packaging? If yes, which types of transport packaging are reused?
Company Plastic
transport packaging
Metal transport
packaging
Wooden transport
packaging
Other transport
packaging
Our company does not
reuse transport
packagingPlastprent x x
Skinney Thinganes x
Lýsi x x
Síldarvinnslan
Osta- og smjörsalan x
Mjólkursamsalan, MS x
Nói Síríus x
Egill Skallagrímsson x x
Samhentir Kassagerð
Kassagerðin x
Full answering options:
Plastic transport packaging, such as fish boxes of all sizes, pallets etc.
Metal transport packaging, such as road, ship or air containers
Wooden transport packaging, e.g. pallets
Other transport packaging
Our company does not reuse transport packaging

FINAL REPORT Pilot Study on Packaging and Packaging Waste in Iceland
A 2 - 11
DATA ON FREQUENCY AND LIFESPAN OF TRANSPORT PACKAGING
Te majority of companies that were reusing transport packaging were able to estimate
their frequency and lifespan (Table 10).
Table A 2.10 Frequency and lifespan of transport packaging
If your company reuses transport packaging, would you be able to estimate their frequency and lifespan?
(Frequency refers to the number of times a transport packaging is re-used. Lifespan refers to the length of
time (months or years) in which the transport packaging is used before disposal)
Company Yes No
Plastprent
Skinney Thinganes
Lýsi x
Síldarvinnslan
Osta- og smjörsalan x*
Mjólkursamsalan, MS x
Nói Síríus x
Egill Skallagrímsson
Samhentir Kassagerð
Kassagerðin
* Lifespan 5 years

FINAL REPORT Pilot Study on Packaging and Packaging Waste in Iceland
A 2 - 12
COMMENTS
The survey approach seems to be a relatively good way of contacting companies, but
requires a lot of resources as companies are contacted beforehand be phone. A larger
sample would require a different approach. Companies would be approached straight
through e-mail, without the initial phone calls, which would probably lower the response
rate somewhat. In addition, the number of questions should be reduced to the absolute
essential. The number of questions should not be more than five or six. The questions
on packaging types and materials as well as packaging waste streams should be included,
whereas questions on general waste and transport packaging could be omitted.
Some of the questions would need rewording. Also, more answers could probably be
received if the survey form and introduction letter would be in Icelandic. In addition, the
time needed to process the survey results could be reduced by using a web survey
solution such as ´Outcome´ from the company ´Vefur´. This would also make it easier
for companies to answer, and problems with the answering format could be avoided.
Reminder e-mails could be sent two or three times. With these measures, an additional
response rate of 40% should be achieved.
Anne M. Sparf The Environmental Research Institute (ERI) University of Iceland

FINAL REPORT Pilot Study on Packaging and Packaging Waste in Iceland
A 3 - 1
Annex III
Icelandic waste management

FINAL REPORT Pilot Study on Packaging and Packaging Waste in Iceland
A 3 - 2
Icelandic waste management Geography and population The territory of Iceland is 103,125 km2 and the number of inhabitants 292,587 (2004). In the period 1994-2005, the population of Iceland increased yearly by around 1% on average. Average population density is 2.8 inhabitants/km2. 62% of the entire population live in the greater Reykjavik capital area, which is why the population density in rural areas is smaller still. For the reason that relatively small amounts of waste are generated, divided over many small municipalities and the long distances between, the costs of transportation are exceptionally high for the Icelandic territory. For this reason many of the recycled waste streams are sent abroad from several locations in the country e.g. from the larger capital areas as Reykjavik and Akureyri. Waste management in Iceland from 1970 till 2005 Since the 1970s Iceland has made considerable progress regarding waste management. The main treatment option in the 1970s was open-pit burning, resulting in many open dumps on many places emitting smoke, short from settlements.
Figure A 3.1 Waste treatment in Iceland in 1970
In the 1990´s the obvious disadvantages of widely spread uncontrolled open-pit burning had been recognized. Therefore, many municipalities raised burning-cisterns, typically concrete “boxes”, preventing waste to blow away, but still resulting in relatively low incineration temperatures. Also landfilling became more common.

FINAL REPORT Pilot Study on Packaging and Packaging Waste in Iceland
A 3 - 3
Figure A 3.2 Waste treatment in Iceland in 1990
In 2000 open-pit burning had gradually been stamped out as not being acceptable any longer. Instead, landfill became the most general way of final treatment, but also some (small) incineration plants were built, some of which boasted energy recovery. Furthermore, recycling options became more and more an option, as result of increased cooperation between municipalities.
Figure A 3.3 Waste treatment in Iceland in 2005
These activities have resulted in that waste management in Iceland has gradually become a business activity. Establishment of collection systems and -sites has created ways for public and business to dispense of their waste in a sound way. Waste treatment facilities are fewer than earlier and those remaining have increased in size, due to an increasing co-operation between municipalities. However, despite an almost two-fold increase in the recovery of waste over the past 10 years, the quantity of waste bound for permanent landfills has not diminished. Around 70 per cent of municipal waste is still going to landfill, only around 3 per cent is incinerated with energy recovery, and 26 per cent is recycled or recovered by other means than incineration with energy recovery. Recovery is around 28% of total waste.
FINAL REPORT Pilot Study on Packaging and Packaging Waste in Iceland
A 3 - 4
Waste generation Until 2004 the amount of waste generated in Iceland was estimated based mainly on data from SORPA, the biggest waste treatment facility in Iceland. This was a rough estimate although SORPA serves the capital area of Reykjavik and covering ca. 62 per cent of the Icelandic population. Recently the amounts of waste generated in 2002 were assessed in a more detailed way, e.g. by using more concise definitions of waste streams and inclusion more waste-types, such as agricultural waste, industrial waste and construction & demolition waste. It became clear that waste amounts were in fact significantly higher than previously estimated and therefore needed to be revised accordingly (see table A9.1, annex 9 of this report). Recent legislation on waste Law 55/2003 on Waste Management was set to address the more stringent demands on nowadays waste-management. The objective of the law is to decrease the quantity of waste by preventing generation of waste, increase recycling and recovery and reduce the quantity of waste deposited in landfills. Based on law 55/2003, the following three new regulations were issued implementing the landfill directive (1999/31/EC) and incineration directive (2000/76/EC):
no. 737/2003 on treatment of waste no. 738/2003 on landfill of waste no. 739/2003 on incineration of waste,
The Waste Management Law 55/2003 and Regulation 737/2003 on waste treatment transpose the following EU targets into Icelandic law:
1. To reduce the total weight of organic household waste to be landfilled by 25 per cent by no later than 1 January 2009, by 50 per cent by no later than 30 June 2013, and by 65 per cent by no later than 30 June 2020,
2. To reduce the total weight of other organic waste, such as biodegradable organic waste to be landfilled, by 25 per cent by no later than 1 January 2009, by 50 per cent by no later than 30 June 2013 and by 65 per cent by no later than 30 June 2020,
3. To recover packaging waste by between 50 per cent as a minimum and 65 per cent as a maximum by weight, to recycle between 25 per cent as a minimum and 45 per cent as a maximum by weight of the totality of packaging materials contained in packaging waste, with a minimum of 15 per cent by weight for each packaging material, all on a yearly basis,
4. To reuse and recover end-of-life vehicles by no later than 31 December 2005 by 15 per cent as a minimum, and to reuse and recover the average total weight of vehicles by 20 per cent as a minimum,
5. To collect and treat in an appropriate way an average of 4 kilos of WEEEs per capita annually.
In addition, the regulation 738/2003 provides for the ban on landfilling of scrap metals including end-of-life vehicles, liquid wastes, hazardous waste, contagious and radioactive medical waste and tires.
FINAL REPORT Pilot Study on Packaging and Packaging Waste in Iceland
A 3 - 5
The ban on landfilling of tires will take effect from 16 July 2006, but until then it is allowed to landfill shredded tires. By 16 July 2009, all landfill operators must either comply with the regulation or shut down their operation. Regulation 737/2003 on treatment of waste makes the local authorities responsible for collection, handling and treatment of municipal waste. It is expected that in response to the new law and regulations on waste the costs of waste management will increase. The law 55/2003 provides for the setting up of a special Coordination Committee to monitor the Implementation of Laws. The role of the Committee is, amongst other things, to monitor the compliance of the law, assess the cost-effectiveness of the programme and, if necessary, ensure funding for the programme in the future were needed. The Icelandic Recycling Fund (2003) The Icelandic government decided, at least for the time being, not to introduce landfill- and incineration taxes as widely elsewhere in Europe, as these are thought to merely increase the overall cost of waste treatment and not have big influence on prevention, reuse, recycling and recovery of waste generated in the country. Instead, Law 162/2002 on Recycling Fees was passed, superseding Law 56/1996 on hazardous waste fee (and its amendments). This was followed by setting up the Icelandic Recycling Fund (Úrvinnslusjóður, IRF), replacing the former Hazardous waste Committee from 1996. A recycling fee is now being levied on the products recognized in the law, i.e. hazardous waste, end-of-life vehicles, composite packaging (drinking cartons), farm silage films and tires, in order to finance their collection sites, transport from the sites and recycling, recovery or disposal. The introduction of a recycling fee on products will raise funds for treatment of these products when they become waste. The (recycling and/or deposit) fee is collected both from imported goods and produced in Iceland. Therefore the, funds are payable from the very start of waste treatment activities, i.e. sorting and collection, providing the municipalities and waste treatment facilities with financial resources that are needed to meet the increased costs for treatment of those products, thus enhancing recovery and recycling operations. The IRF is responsible for collecting recycling levies and disbursing them. Its aim is to achieve the recycling targets for the products in question in the most cost-effective way possible. Funds levied thus will be used to improve efficiency in the recycling and disposal of the addressed waste types. The IRF is independent organization managed by a board of five people, appointed for four-year terms. The Environment Minister appoints the chairman, and the others are nominated by the Confederation of Icelandic Fisheries and Agriculture, the Confederation of Trade and Industry, the Retailers Confederation, and the Association of Municipalities respectively.
FINAL REPORT Pilot Study on Packaging and Packaging Waste in Iceland
A 3 - 6
The items and the levies are set out in annexes to the Law. Items that carry a recycling fee to day are the following:
Lubricating and fuel oils, Photo chemicals, Organic solvents, Pesticides and herbicides, Isocyanides, Batteries and car batteries, Halogenated hydrocarbons, Solvent-based paint and printing ink, End-of-life vehicles, Used tires, Farm silage film, Beverage (drinking) cartons, End-of-life vehicles (also is set a deposit, see below).
If waste arising from products subject to the recycling levy is exported out of Iceland for recycling, the exporter can claim back the recycling fee from the IRF. The IRF may also reach agreement with operators to refund the fee in case of independent recycling of own-waste More precise rules for the operation of the Icelandic Recycling Fund were set out in Regulation 531/2003 (superseding 227/2003). On the basis of current trends, it is expected that more waste types will be added to this list in the future. Deposit system for beverages A deposit system on non-refillable aluminium, steel, plastic and glass packaging has been in place in Iceland since 1989 as stipulated by law 52/1989 and achieved a return rate of over 80 per cent for refillable and non-refillable bottles, and cans. Law 162/2002 states that a recycling levy for non-refillable aluminium, steel, plastic and glass packaging will take effect on 1 January 2008 (but does not set levy rates for these). On that date, law 52/1989 will be repealed, i.e. there will no longer be a deposit. The IRF has negotiated a contract with Endurvinnslan Ltd to operate the deposit system for non-refillable bottle and cans until 2008. Law 162/2002 allows that the IRF to reach an agreement with Endurvinnslan Ltd earlier than 2008 about switching from a deposit to the recycling levy. End-of-life vehicles Apart from a recycling fee, a deposit system for end-of-life vehicles is also in force in Iceland since 2003, according to law 162/2002. The owner of a vehicle registered after 1980 has to pay a fee of ISK 520 per quarter, i.e. ISK 1,040 per annum. This fee is levied from the time the car is first registered until it is officially de-registered. The vehicle must be formally de-registered at a testing station or vehicle registration office before the fee is no longer charged. For vehicles exempt from the vehicle registration fee this fee has not to be paid.

FINAL REPORT Pilot Study on Packaging and Packaging Waste in Iceland
A 3 - 7
Packaging and packaging waste. So far, data on the amounts of the different packaging waste types that arise in Iceland have been scarce making reporting and policy-making difficult. In connection with Council Regulation 2150/2002/EC on Waste Statistics, a pilot study is being carried out to develop a methodology of monitoring packaging waste streams in Iceland, producing quantity-rows for the years 2002, 2003 (and 2004) and making it possible to update data in the future in a reliable and efficient way (see current report). Waste treatment Several regional cooperative on waste treatment facilities are in operation. In the capital area of Reykjavik this is SORPA, a company owned by several municipalities, serving around 62 per cent of the total Icelandic population. SORPA also operates eight container parks and has bring-sites in city centers. The public and small operators can take a wide range of recyclable items to the bring sites operated by SORPA free of charge. However, one has to pay to drop off waste which is not collected by the municipalities and exceeding 2 m3 at the bring sites, such as building waste, garden waste, waste associated with vehicle repairs, waste associated with pets, etc. Free of charge are recyclable waste sorts that are subject to a recycling fee such as drinking cartons, silage foil, tires and hazardous waste. From the bring sites, the material is taken to the collection and baling center of SORPA in Gufunes where it is sorted for either recovery or disposal, typically for landfilling in Alfsnes. Larger companies may take their (bulky) waste directly to Alfsnes, subject to a gate fee, depending on sorts and amounts dropped off. Companies that bring their waste directly to the sorting center in Gufunes have to pay a gate fee depending of amount and waste sorts, except for the items subject to the recycling fee, which can be dropped off free. The gate fees at Gufunes are as follows (effective 1 July 2005): ISK 3.65/kg for newspapers and magazines, while it costs ISK 3.24 per kg to drop off graphic paper. The rate for mixed waste is ISK 9.11/kg and for bulky mixed waste ISK 13,15. However, for economical and environmental reasons SORPA pays the waste holder up to ISK 5,42 per kg for sorted corrugated cardboard ready for recycling and also for sorted plastic film up to ISK 12,45, depending on the amount brought. National Waste Management Plan 2004-2016 Law 55/2003 stipulates that the Environment and Food Agency of Iceland (Umhverfisstofnun, shortly UST) must draw up a National Waste Management Plan (NWMP). The (first) NWMP was released in April 2004. The main objectives of the National Waste Management Plan are:
Compliance with the “polluter-pays” directive, Obligation on local authorities to submit annual reports on quantity and
composition of treated waste, Compulsory management of asbestos, hazardous waste and contaminated soil, Managing waste within national borders where it makes economic sense, Creating the most cost-effective conditions possible for the recycling of waste.
FINAL REPORT Pilot Study on Packaging and Packaging Waste in Iceland
A 3 - 8
The following is the timetable for the implementation of the Programme:
From 1 January 2006, a minimum of 85 per cent of all ELVs must be reused or recovered (in addition, a minimum of 80 per cent of the average weight of the vehicles must be either reused or recycled),
From 16 July 2006, ban on the landfilling of tires, both whole and shredded. From 1 December 2006, a minimum of 4 kg of WEEEs per capita must be
treated appropriately, From 1 January 2009, organic household and industrial waste going to
landfills must be decreased by 25 per cent, compared to the amounts produced in 1995,
From 1 July 2013, organic household and industrial waste going to landfills must be decreased by 50 per cent, compared to the amounts produced in 1995,
From 1 January 2015, the reuse and recovery of ELVs must be at least 95 per cent (85 per cent of the average weight of ELVs must be either reused or recycled),
From 1 July 2020 organic household and industrial waste going to landfills must be reduced by 65 per cent, compared to the amounts produced in 1995,
The Plan also includes the new provisions of the EU Directive 2204/12/EC of 11 February 2004 amending Directive 94/62/EC on packaging and packaging waste: the Icelandic government has to make provisions for the implementation of this directive before 2013 and is expected to give its waste management operators up to 3 years to meet the new requirements.
In order to meet the targets of the National Waste Management Plan, the recovery of organic waste, packaging waste and WEEE has to increase significantly. Although it is feasible to recover organic waste by means of energy recovery, if the 6 relatively small incineration plants in Iceland continue to operate on current efficiency levels, recovery of organic waste will have to be increased by other means, e.g. by composting or anaerobic digestion. Regional Waste Management Plans Based on the NWMP, local authorities have to draw up and activate local (or regional) waste management plans (RWMP) by 1 April 2005, elaborating on how the municipalities will comply with the objectives of the national plan. Guidelines to local authorities for making their local plans were released In October 2004. The national plan and local programs will be reviewed every 3 years. The key factor in monitoring the success of the RWMP will be the collection of more reliable and accurate data on the quantity and quality of waste that is generated on a local (regional) level. Despite improvements in data collection over the past few years, there are big local differences in quality of data that hamper effective policy-making and regional co-operation. Therefore, the first regional waste management plans of 2005 would especially have to focus on data collection.

FINAL REPORT Pilot Study on Packaging and Packaging Waste in Iceland
A 4 - 1
Annex IV
Available data sources

FINAL REPORT Pilot Study on Packaging and Packaging Waste in Iceland
A 4 - 2
The Directorate of Customs The Directorate of Customs (Tollur) was established in 1929. From the beginning, the main service functions have remained the same. Firstly, to control import, transit and export, and secondly, the collection of duties, taxes and various state revenue. The Directorate of Customs main objectives are to strengthen control, hinder importation of illegal goods, ensure correct levy of import charges and improve collection results. The administration of customs and internal revenue falls within the jurisdiction of the Minister of Finance, who is the head of customs affairs in the country. Iceland is divided into 27 customs districts, which are the same as the Administrative Districts of Magistrates (the Commissioner of Police and Customs). Magistrates serve as directors of customs in their district as well as commissioners of police. According to law the Directorate of Customs is required to co-ordinate various work processes in the customs districts with regard to collection of duties, customs control and decision-making. More information can be found on www.tollur.is

FINAL REPORT Pilot Study on Packaging and Packaging Waste in Iceland
A 4 - 3
Statistics Iceland Statistics Iceland is the national statistical institute of Iceland (Hagstofa Íslands). It was founded in 1914. The operation of Statistics Iceland is based on the legislation on Statistics Iceland and other acts on official statistics, the Act and statutes on the Central Government Administration, the legislation on civil registration and the National Register of Population and other legislation. Statistics Iceland is divided into three statistical divisions – personal and social statistics, business statistics and national accounts, as well as the National Population Registry. Information on external trade is primarily based on customs declarations for imports and exports. The customs authorities register import and export declarations and the data is available on-line to Statistics Iceland. This data is checked and corrected as far as possible. Frequently the importer or exporter concerned is contacted in order to obtain further information or make corrections. Data on external trade is gathered from other sources as well. Thus the Icelandic Directorate of Shipping (Register of Vessels) and the Civil Aviation Administration, Flight Safety Department, supply information regarding purchases and sales of ships and aircraft and the importers or exporters concerned are contacted for further details. The Directorate of Shipping provides information on ships sent for conversions abroad. The companies concerned are subsequently contacted for closer details. As regards improvements of foreign vessels carried out by Icelandic companies, information is obtained from the relevant companies Classification The classification of goods in external trade is based on the nomenclature of the Icelandic Customs Tariff. The current Tariff entered into force on 1 January 1988 according to the Customs Act No. 96/1987, amending the Customs Act No. 55/1987. The tariff is based on the international Nomenclature of the Customs Cooperation council in Brussels. The international classification is entitled the Harmonized Commodity Description and Coding System, also known in abbreviated form as HS. The Harmonized System was adopted by an international convention of the Customs Cooperation Council signed in Brussels in June 1983 and published in 1985. Iceland was party to this convention and ratified it in June 1986. The HS code entered into force in most of the member states of the Customs Cooperation Council on 1 January 1988. According to the Customs Act the Customs Tariff may be changed by an advertisement in the Official Gazette. Such changes have been made each year, e.g. to incorporate changes in the HS. The HS is a six-digit nomenclature in which the first two digits form chapters numbered 01-97, the goods being classified according to material. States that have signed the Harmonized System Convention have committed themselves to employ this six-digit system while being free to use a more detailed classification with a greater number of digits at the national level. The Icelandic Customs Tariff is an eight-digit classification that complies with the six digits of the HS with the addition of two digits that are used in some instances for a more detailed breakdown according to Icelandic requirements. The HS includes just over 5,000 numbers whereas there were close to 6,800 numbers in the current Icelandic Tariff. Iceland adopted SITC, Rev. 3, in the beginning of 1988 when the new Customs Tariff entered into force.

FINAL REPORT Pilot Study on Packaging and Packaging Waste in Iceland
A 4 - 4
Countries Statistics Iceland defines countries according to the international standard ISO-3166. Division between countries is based on country of consumption as regards exports and country of production as regards imports. Thus an attempt is made to identify the final destination of exported goods and the country of origin in case of imports rather than the country of sale or purchase or the importing or exporting country as the case may be. On occasion, however, exporters have no knowledge of the final destination of their merchandise, nor importers of the country of origin, and in such cases the importing or exporting countries are registered. Value The value of an imported item of good is either presented at CIF or fob value while exports are presented at fob value only. The fob (free on board) value means the price for the item when it is on board whatever means of transport in the country of export. CIF (cost, insurance, freight) value also includes costs induced until the item is unloaded in the country of import. This chiefly involves freight rates and insurance costs. It is customary in external trade statistics to present imports at their CIF value and exports at their fob value. For reasons of national accounts production and various statistical analyses, however, both these methods have been applied to present imports. According to the nature of the case, the general rule does not apply to fresh fish sold in foreign ports. In order to determine prices for this category of exports, certain cost items are subtracted from the gross-price value in varying proportions, depending on the country. Figures on the value of imports are reached by converting the foreign currency value of the commodity to Icelandic krónur (ISK) at the selling exchange rate of the currency concerned. Export figures, on the other hand, are based on buying rates of exchange. The reference rate of exchange is a so-called customs exchange rate, which is the official exchange rate as registered by the Central Bank of Iceland on the 28th of each month or, in case that date is not a working day, on the first following working day. Quantity Quantity of imports and exports refers to net weight (i.e. weight without packaging) in tonnes unless otherwise specified. Under several tariff numbers quantity has been recorded in other units, i.e. cubic metres (wood), by piece (various kinds of clothing, cars, ships, aircraft etc.), pairs (shoes) or litres (wine). More information can be found on www.hagstofa.is
FINAL REPORT Pilot Study on Packaging and Packaging Waste in Iceland
A 4 - 5
SORPA Solid waste and solid waste-disposal are prominent modern urban services throughout the industrialized world. Iceland has close to 300.000 people, about 186.000 (62%) of whom live in Reykjavík, Iceland’s capital and its adjoining municipalities. Since 1991, The City of Reykjavík and six other municipalities have coordinated their solid waste disposal through an independent firm named SORPA, which these seven municipalities jointly own and run. Nine representatives from the municipalities and a general manager, Mr. Ögmundur Einarsson, form SORPA’s Board of Directors Municipalities with ownership are: Reykjavík, Kópavogur, Hafnarfjörður, Garðabær, Seltjarnarnes, Mosfellsbær, Bessastaðahreppur. The formation of SORPA received a strong push from increased debate on environmental issues. Simultaneously, its formation was influenced by an Icelandic government policy issued in the early 1990s to reduce solid waste, step by step. The most densely populated area, which is in and around the Capital, had already induced problems in waste disposal that had to be dealt with. Open waste areas at city borders and areas with unsorted waste covered by thin layers of earth had been the only options. Aesthetic problems were obvious, pollution evident and recycling absent. SORPA was designated to tackle the problems. SORPA has 74 employment positions. Those who use SORPA’s services pay fees that cover its operational costs. Goals of SORPA The charter of the firm stipulates a 10-point programme where the goals of SORPA are stated in a generalized way. The programme forms the foundation of company policy and actions. The 10 points are as follows:
To select, procure and operate an environmentally sound landfill site, To build and operate common waste-disposal collection sites, To transport waste from such collection sites, To produce and sell, in an economically sound way, fuel and/or energy
obtained from solid waste, To produce and sell raw material for recycled products in an economically
sound way, To collaborate, in an economically sound way, with companies that promote
recycling of waste products, To follow technical developments in the fields of solid waste-disposal and
recycling, To handle the disposal of hazardous waste, To develop new techniques to retrieve valuable products from solid waste, To publicize the role and policy of SORPA as well as environmental issues
related to waste-disposal. Information and education Disposal of solid waste is an important service. The staff at SORPA takes pleasure in serving their communities in a modern and effective way. Elaborate informational and educational activities are an integral part of SORPA’s service. SORPA publishes informative reading material, brochures and colouring books.
FINAL REPORT Pilot Study on Packaging and Packaging Waste in Iceland
A 4 - 6
Furthermore, SORPA invites primary schools to send groups of pupils on field trips to visit and study all of its levels and branches. Each year, numerous other groups from secondary schools, business firms, various institutions and organizations pay SORPA a visit as well Bailing and sorting plant SORPA’s bailing and sorting plant handles solid waste from homes, firms and institutions in the Capital Area. Compressible solid waste goes through compacting devices, which decrease the volume by 70%. The process renders tied-up stacks to be transported some 20 km to the landfill site at Álfsnes, northeast of Reykjavík. Corrugated cardboard and waste paper (mostly printed material) are exported in compressed stacks to Sweden where the material is recycled. Wood is shredded and sent to the ferro-silicon (iron alloy) plant at Grundartangi, about 50 km NE of Reykjavík, where it makes an excellent source of carbon for the production process. This successful method of carbon production for a ferro-silicon smelter is unique in the world. Scrap metal is brought to the scrap metal firm Fura, which, in turn, exports the material to markets abroad. The municipalities run a well-organized waste collecting service. The waste is brought to SORPA’s bailing and sorting plant from each part of the service area every week or two. Many larger firms and institutions organize the delivery of their solid waste themselves. The public is not compelled by law to sort or classify solid waste, except for hazardous waste. In fact, each municipality sets its own rules regarding the collection and disposal of solid waste. In the Capital Area, the governments encourage the public to deliver sorted, solid waste to special SORPA recycling centres located throughout the service area. They are open to individuals as well as small firms and institutions Recycling centres SORPA operates 8 recycling centres. People bring their solid waste at their own expense and SORPA’s staff instruct them in how to place the sorted materials into the appropriate containers. SORPA also publishes reading material to inform and educate the public about the classification and recycling of solid waste. SORPA operates reception areas for deposit beverage containers (bottles and aluminium cans) to be recycled by another firm. In addition, SORPA has placed large containers (for paper, for example) within the city and town limits. SORPA receives and recycles:
Beverage cartons, Corrugated cardboard, Newspapers and magazines, Office paper, Deposit beverage containers, Metals, Wood and wooden freight
platforms,
Waste from trees and plants, Rocks and glass, Household goods, Clothing, Shoes, Wax, Tires, Hazardous waste.
Tires are being stored at the landfill site until a technique can be found to recycle them in an economically sound way. Clothing is collected in cooperation with the Icelandic Red Cross.

FINAL REPORT Pilot Study on Packaging and Packaging Waste in Iceland
A 4 - 7
The landfill site at Álfsnes SORPA buries the solid, compressed waste that is left after the sorting. When the general waste from homes, firms and institutions has been formed into stacks (or parcels), specially built vehicles transport the material from the main terminal to the landfill site. The landfill site has been divided into lanes, to be utilized one at a time. Forklifts pile up the stacks in an orderly fashion and the stacks are then buried under layers of earth, reducing the amount of earth used and making the best possible use of available space Leachate is after treatment being discharged in coastal water near the landfill. There is a monitoring scheme on wildlife (mussels) and sediments around the outlet. Processed areas are subsequently sown with grass seed and planted with trees. The area may be used as an outdoor recreation area in the future Gas production plant Buried waste produces a substantial volume of methane. Beginning in 1997, SORPA channelled the gas to simple burning devices. Burning the methane rendered it less effective as a greenhouse gas. Thus, any greenhouse effect caused by SORPA waste was considerably reduced. However, in the early summer of 2000, SORPA opened a new gas refining and production plant at Álfsnes to recycle the methane that was previously burnt. As a result, the methane will be suitable as fuel for bi-fuel cars and for production of electricity. Methane, which cannot be used, is burnt to produce electricity and used at the landfill. SORPA formed a sister company “Metan” for the purpose of operating the plant and marketing the gas. More information can be found on www.sorpa.is

FINAL REPORT Pilot Study on Packaging and Packaging Waste in Iceland
A 4 - 8
Endurvinnslan hf. The value of keeping the environment unpolluted is obvious, and it is important to most people to be able to live in a clean, unpolluted country. One-way containers can lead to considerable pollution of the environment. In order to minimise this risk, a deposit is levied in Iceland on beverages such as beer, alcohol and soft drinks, sold in one-way bottles or cans made of metal, glass, plastic etc. Endurvinnslan Ltd is the only company in Iceland that exists to accept one-way bottles and cans for recycling – this is a good example of cooperation between the authorities and private enterprise. Iceland was the first country in the world to set up a deposit system on a national scale for such a wide range of containers. Since the foundation of Endurvinnslan Ltd. in 1989, the collection of one-way containers has been highly succcessful, and now over 80% of bottles and cans with deposit are returned to Endurvinnslan. Once have been collected together and passed through preliminary processing by Endurvinnslan, all the containers can be recycled or reused in some way and some have considerable value. Cans are compressed, then sold abroad, where they are melted down and used to make new cans, after removal of paint, etc. Plastic bottles are compressed, and sold abroad, where they are sorted, washed and ground into chips. The plastic chips then go to a factory where they are moulded into thin plastic thread, which is used to make polyester wool, used in textiles, carpets, etc. The glass is crushed in Iceland and used as landfill material instead of earth or gravel. More information can be found on www.endurvinnslan.is
FINAL REPORT Pilot Study on Packaging and Packaging Waste in Iceland
A 5 - 1
Annex V
Assumptions and estimations

FINAL REPORT Pilot Study on Packaging and Packaging Waste in Iceland
A 5 - 2
Table A 5.1 Assumptions and estimations used during the pilot studying 2002
Subject Assumptions / Estimations for 2002 Description Data Source(s) Reported
1) Landfilled waste Landfilled waste, of which:
- Mixed Household waste (Sales packaging) - Mixed Production waste (Transport packaging)
151.000 tons 70.000 tons (46%) 81.000 tons (54%)
The final quantity of landfilled mixed household and – production waste was recalculated and based on the waste figures presented in the year report from SORPA. The figures, presenting the quantities generated in the Reykjavik capital area were converted to national quantities, using the recalculation method of waste quantity per capita. It had to be assumed that the generated waste in other municipalities outside the Reykjavik area were proportionally similar. This was confirmed by using the figures of the other municipalities, converting them to a quantity per capita and comparing those to the quantities found in Reykjavik. The larger municipalities showed somewhat higher quantities, assumable caused by the industrial activities in those areas.
SORPA UST
- Chapter 3.3
2) Composition of landfilled mixed household waste
Sales packaging, of which: - Glass - Plastic - Paper & cardboard
Paper & cardboard Composite
- Metal - Wood
23,9% 3,9% 10,4% 9,1%
5,8% 3,3%
0,4% n.a.
The composition of mixed household waste has been surveyed by SORPA. Mixed household waste is assumed to contain only sales packaging and other non-packaging waste. The composition for landfilled waste is established by using the average of two years (for 2002, the average of 2001 and 2002). Wood sales packaging is not applicable for the reason that very little wood packaging is disposed in mixed household waste and therefore is difficult to estimate. Composite packaging used for milk and other drinking cartons is included in the quantities of paper and cardboard packaging.
SORPA UST
- Chapter 3.3.1 - Annex 6
3) Composition of landfilled mixed production waste
Transport packaging, of which: - Plastic - Paper & cardboard - Metal - Wood
26,0% 10,0% 15,0% 0,5% 0,5%
The composition of mixed production waste has been estimated using visual and questionnaire surveys. Mixed production waste is assumed to contain only transport packaging and other non-packaging waste. As packaging it mainly contains plastic, paper and cardboard packaging waste. No official figures on this composition are available.
UST - Chapter 3.3.2
4) Sorted and recycled wood packaging waste
- Wood (Transport packaging)
65% Wood waste including packaging and non-packaging waste. Between 80 and 90% of all wooden waste that is separately collected in Iceland, is received at SORPA. It was estimated, based on visual surveys that approximately 65% of the wooden waste received at SORPA is transport packaging waste as pallets, crates and boxes.
UST - Chapter 3.2.2
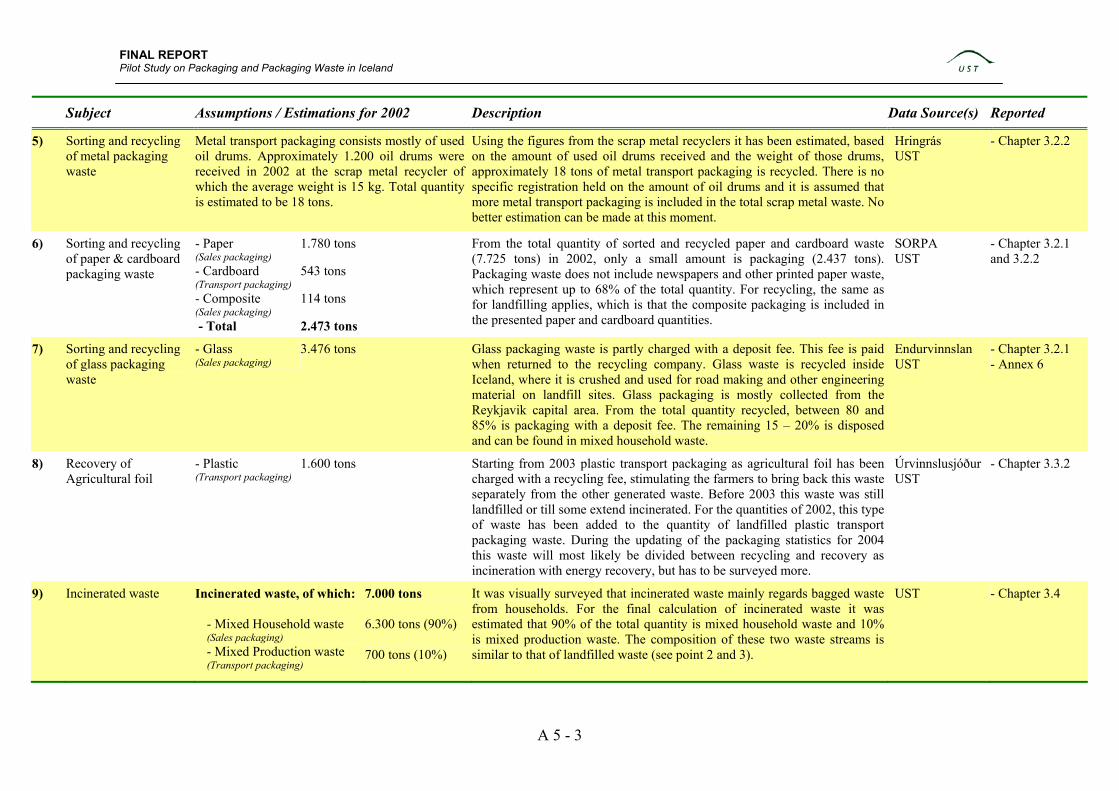
FINAL REPORT Pilot Study on Packaging and Packaging Waste in Iceland
A 5 - 3
Subject Assumptions / Estimations for 2002 Description Data Source(s) Reported
5) Sorting and recycling of metal packaging waste
Metal transport packaging consists mostly of used oil drums. Approximately 1.200 oil drums were received in 2002 at the scrap metal recycler of which the average weight is 15 kg. Total quantity is estimated to be 18 tons.
Using the figures from the scrap metal recyclers it has been estimated, based on the amount of used oil drums received and the weight of those drums, approximately 18 tons of metal transport packaging is recycled. There is no specific registration held on the amount of oil drums and it is assumed that more metal transport packaging is included in the total scrap metal waste. No better estimation can be made at this moment.
Hringrás UST
- Chapter 3.2.2
6) Sorting and recycling of paper & cardboard packaging waste
- Paper (Sales packaging) - Cardboard (Transport packaging) - Composite (Sales packaging) - Total
1.780 tons 543 tons 114 tons 2.473 tons
From the total quantity of sorted and recycled paper and cardboard waste (7.725 tons) in 2002, only a small amount is packaging (2.437 tons). Packaging waste does not include newspapers and other printed paper waste, which represent up to 68% of the total quantity. For recycling, the same as for landfilling applies, which is that the composite packaging is included in the presented paper and cardboard quantities.
SORPA UST
- Chapter 3.2.1 and 3.2.2
7) Sorting and recycling of glass packaging waste
- Glass (Sales packaging)
3.476 tons
Glass packaging waste is partly charged with a deposit fee. This fee is paid when returned to the recycling company. Glass waste is recycled inside Iceland, where it is crushed and used for road making and other engineering material on landfill sites. Glass packaging is mostly collected from the Reykjavik capital area. From the total quantity recycled, between 80 and 85% is packaging with a deposit fee. The remaining 15 – 20% is disposed and can be found in mixed household waste.
Endurvinnslan UST
- Chapter 3.2.1 - Annex 6
8) Recovery of Agricultural foil
- Plastic (Transport packaging)
1.600 tons Starting from 2003 plastic transport packaging as agricultural foil has been charged with a recycling fee, stimulating the farmers to bring back this waste separately from the other generated waste. Before 2003 this waste was still landfilled or till some extend incinerated. For the quantities of 2002, this type of waste has been added to the quantity of landfilled plastic transport packaging waste. During the updating of the packaging statistics for 2004 this waste will most likely be divided between recycling and recovery as incineration with energy recovery, but has to be surveyed more.
Úrvinnslusjóður UST
- Chapter 3.3.2
9) Incinerated waste Incinerated waste, of which:
- Mixed Household waste (Sales packaging) - Mixed Production waste (Transport packaging)
7.000 tons 6.300 tons (90%) 700 tons (10%)
It was visually surveyed that incinerated waste mainly regards bagged waste from households. For the final calculation of incinerated waste it was estimated that 90% of the total quantity is mixed household waste and 10% is mixed production waste. The composition of these two waste streams is similar to that of landfilled waste (see point 2 and 3).
UST - Chapter 3.4

FINAL REPORT Pilot Study on Packaging and Packaging Waste in Iceland
A 5 - 4
Subject Assumptions / Estimations for 2002 Description Data Source(s) Reported
10) Incineration without energy recovery
- Glass (Sales packaging) - Metal (Sales and transport packaging)
246 tons 29 tons
Glass (sales) and metal (sales and transport) packaging are incinerated without energy recovery. Their residues form leftovers in the ashes, which are disposed on the landfill. No energy is extracted from this waste. These quantities will not be used in the comparison with the recovery targets.
UST - Chapter 3.4
11) Landfilled packaging waste with and without a deposit fee
- Glass (Sales packaging)
With a deposit fee Without a deposit fee
- Plastic (Sales packaging)
With a deposit fee Without a deposit fee
3,9% or 2.730 tons
1,3% or 910 tons 2,6% or 1.820 tons
10,4% or 7.280 tons
0,6% or 420 tons 9,8% or 7.860 tons
Landfilled mixed household waste includes glass and plastic sales packaging waste. Both these waste streams contain packaging with and without a deposit fee. Plastic packaging with a deposit fee contains the bottles and other beverages. The plastic packaging without a deposit fee are plastic bags, food wrappings, foils, small buckets, etc.
SORPA UST
- Chapter 4.3.1 - Annex 6
12) Secondary packaging Reported transport packaging includes both secondary (grouped) and tertiary (transport) packaging
Secondary (grouped) packaging in this pilot study has been reported under transport packaging for the reason that is has almost the same purpose as tertiary packaging and is difficult to distinguish from transport packaging.
UST - Chapter 1.5

FINAL REPORT Pilot Study on Packaging and Packaging Waste in Iceland
A 6 - 1
Annex VI
SORPA survey results 1999 – 2003
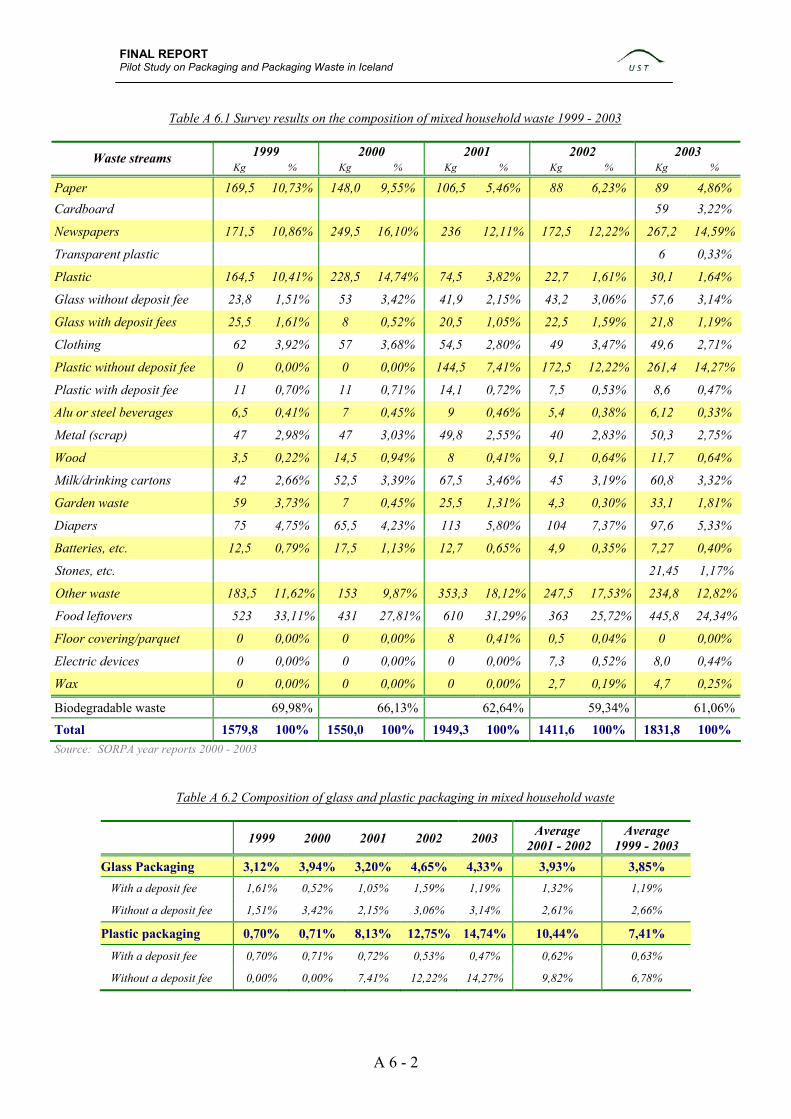
FINAL REPORT Pilot Study on Packaging and Packaging Waste in Iceland
A 6 - 2
Table A 6.1 Survey results on the composition of mixed household waste 1999 - 2003
1999 2000 2001 2002 2003 Waste streams
Kg % Kg % Kg % Kg % Kg %
Paper 169,5 10,73% 148,0 9,55% 106,5 5,46% 88 6,23% 89 4,86% Cardboard 59 3,22%
Newspapers 171,5 10,86% 249,5 16,10% 236 12,11% 172,5 12,22% 267,2 14,59%
Transparent plastic 6 0,33%
Plastic 164,5 10,41% 228,5 14,74% 74,5 3,82% 22,7 1,61% 30,1 1,64%
Glass without deposit fee 23,8 1,51% 53 3,42% 41,9 2,15% 43,2 3,06% 57,6 3,14%
Glass with deposit fees 25,5 1,61% 8 0,52% 20,5 1,05% 22,5 1,59% 21,8 1,19%
Clothing 62 3,92% 57 3,68% 54,5 2,80% 49 3,47% 49,6 2,71%
Plastic without deposit fee 0 0,00% 0 0,00% 144,5 7,41% 172,5 12,22% 261,4 14,27%
Plastic with deposit fee 11 0,70% 11 0,71% 14,1 0,72% 7,5 0,53% 8,6 0,47%
Alu or steel beverages 6,5 0,41% 7 0,45% 9 0,46% 5,4 0,38% 6,12 0,33%
Metal (scrap) 47 2,98% 47 3,03% 49,8 2,55% 40 2,83% 50,3 2,75%
Wood 3,5 0,22% 14,5 0,94% 8 0,41% 9,1 0,64% 11,7 0,64%
Milk/drinking cartons 42 2,66% 52,5 3,39% 67,5 3,46% 45 3,19% 60,8 3,32%
Garden waste 59 3,73% 7 0,45% 25,5 1,31% 4,3 0,30% 33,1 1,81%
Diapers 75 4,75% 65,5 4,23% 113 5,80% 104 7,37% 97,6 5,33%
Batteries, etc. 12,5 0,79% 17,5 1,13% 12,7 0,65% 4,9 0,35% 7,27 0,40%
Stones, etc. 21,45 1,17%
Other waste 183,5 11,62% 153 9,87% 353,3 18,12% 247,5 17,53% 234,8 12,82%
Food leftovers 523 33,11% 431 27,81% 610 31,29% 363 25,72% 445,8 24,34%
Floor covering/parquet 0 0,00% 0 0,00% 8 0,41% 0,5 0,04% 0 0,00%
Electric devices 0 0,00% 0 0,00% 0 0,00% 7,3 0,52% 8,0 0,44%
Wax 0 0,00% 0 0,00% 0 0,00% 2,7 0,19% 4,7 0,25%
Biodegradable waste 69,98% 66,13% 62,64% 59,34% 61,06%
Total 1579,8 100% 1550,0 100% 1949,3 100% 1411,6 100% 1831,8 100% Source: SORPA year reports 2000 - 2003
Table A 6.2 Composition of glass and plastic packaging in mixed household waste
1999 2000 2001 2002 2003 Average 2001 - 2002
Average 1999 - 2003
Glass Packaging 3,12% 3,94% 3,20% 4,65% 4,33% 3,93% 3,85% With a deposit fee 1,61% 0,52% 1,05% 1,59% 1,19% 1,32% 1,19%
Without a deposit fee 1,51% 3,42% 2,15% 3,06% 3,14% 2,61% 2,66%
Plastic packaging 0,70% 0,71% 8,13% 12,75% 14,74% 10,44% 7,41%
With a deposit fee 0,70% 0,71% 0,72% 0,53% 0,47% 0,62% 0,63%
Without a deposit fee 0,00% 0,00% 7,41% 12,22% 14,27% 9,82% 6,78%

FINAL REPORT Pilot Study on Packaging and Packaging Waste in Iceland
A 6 - 3
Table A 6.3 Waste composition of mixed household waste by material 1999 – 2003
Waste materials 1999 2000 2001 2002 2003 Average
1999 - 2003
Total, of which: 100,0% 100,0% 100,0% 100,0% 100,0% 100,0%
Glass 3,1% 3,9% 3,2% 4,7% 4,3% 3,8%
Plastic 11,1% 15,5% 12,0% 14,4% 16,7% 13,9%
Paper & cardboard 21,6% 25,6% 17,6% 18,5% 22,7% 21,2%
Metal 3,4% 3,5% 3,0% 3,2% 3,1% 3,2%
Wood 0,2% 0,9% 0,4% 0,6% 0,6% 0,6%
Composite 2,7% 3,4% 3,5% 3,2% 3,3% 3,2%
Textile 3,9% 3,7% 2,8% 3,5% 2,7% 3,3%
Stone 0,0% 0,0% 0,0% 0,0% 1,2% 0,2%
Wax 0,0% 0,0% 0,0% 0,2% 0,3% 0,1%
Garden and food 36,8% 28,3% 32,6% 26,0% 26,1% 30,0%
Others 17,2% 15,2% 25,0% 25,8% 19,0% 20,4%
Figure A 6.1 Average waste composition of mixed household waste 1999 – 2003
Wood1%
Wax0,1%
Stone0,2%
Textile3%
Composite3%
Metal3%
Glas4% Plastic
14%
Paper & cardboard
21%
Garden and food31%
Others20%

FINAL REPORT Pilot Study on Packaging and Packaging Waste in Iceland
A 7 - 1
Annex VII
Tables according to the Commission decision 2005/270/EC

FINAL REPORT Pilot Study on Packaging and Packaging Waste in Iceland
A 7 - 2
Table A 7.1 Quantities of packaging waste generated in the Member state and recovered or incinerated
at waste incineration plants with energy recovery within or outside the member state.
Recovered or incinerated at waste incineration plants with energy recovery by:
Packaging Waste
Generated Material Recycling
Other forms of
Recycling
Total Recycling
Energy Recovery
Other forms of
Recovery *
Incineration at Waste
Incinerators with Energy
Recovery
Total Recovery and Incineration
at Waste Incinerators with Energy
Recovery
Material
Tonnes (a)
Tonnes (b)
Tonnes (c)
Tonnes (d)
Tonnes (e)
Tonnes (f)
Tonnes (g)
Tonnes (h)
GLASS 6.592 - 3.476 3.476 - 246 - 3.722 PLASTIC 19.748 1.628 - 1.628 - - 725 2.353 PAPER/BOARD 19.272 2.323 - 2.323 - - 470 2.793
Aluminium 800 480 - 480 - 25 - 505 Steel 429 18 - 18 - 4 - 22 METAL ** Total 1.228 498 - 498 - 29 - 527
WOOD 7.475 - 7.065 7.065 - - 4 7.069 OTHER *** 2.751 114 - 114 - - 208 322 TOTAL 57.066 4.563 13.226 15.104 - 275 1.407 16.786
Notes on Table A 7.1: (1) White boxes: Provision of data is mandatory. Estimates may be used though they should be
based on empirical data and explained in the description of the methodology. (2) Light shaded boxes: Provision of data is mandatory, but rough estimates are acceptable. These
estimates should be explained in the description of the methodology. (3) Dark shaded boxes: Provision of data is voluntary. (4) For the purpose of this decision, the data on material recycling for plastics shall include all
material recycled back into plastics. (5) Column c includes all forms of recycling including organic recycling but excluding material
recycling. (6) Column d must be the sum of columns b and c. (7) Column f includes all forms of recovery excluding recycling and energy recovery. (8) Column h must be the sum of columns d, e, f and g. (9) Rate of recovery or incineration at waste incineration plants with energy recovery for the
purpose of Article 6(1) of Directive 94/62/EC: Column h/column a. (10) Recycling rate for the purpose of Article 6(1) of Directive 94/62/EC: Column d/column a. (11) The data for wood shall not be used for the purpose of evaluating the target of a minimum of
15% by weight for each packaging material, as provided for in article 6(1c) of Directive 94/62/EC, as amended by Directive 2004/12/EC.
* Other form of recovery is: Incineration at waste incinerators without energy recovery. ** Metal packaging as aluminium includes mainly cans and beverages (sales packaging) and steel includes
mainly oil drums (transport packaging). *** Other packaging material is ´composite´ and consists of milk and other drinking cartons. In the final
report of the pilot study on packaging waste in Iceland, these quantities have been added to the generated paper and cardboard packaging waste.

FINAL REPORT Pilot Study on Packaging and Packaging Waste in Iceland
A 7 - 3
Table A 7.2 Quantities of packaging waste sent to other Member States or exported outside the
Community for recovery or incineration at waste incineration plants with energy recovery
Packaging waste sent to other Member States or exported outside the Community for:
Material Recycling
Other forms of Recycling
Energy Recovery
Other forms of Recovery
Incineration at Waste
Incineration Plants with
Energy Recovery
Material
Tonnes Tonnes Tonnes Tonnes Tonnes
GLASS - - - - - PLASTIC 1.628 - - - - PAPER AND BOARD 2.323 - - - -
Aluminium 480 - - - - Steel 18 - - - - METAL * Total 498 - - - -
WOOD - - - - - OTHER ** 114 - - - - TOTAL 4.563 - - - -
Notes on Table A 7.2: (1) The data in this table refer only to quantities that are supposed to be counted under the
obligations of the Packaging and Packaging Waste Directive 94/62/EC. They are a subset of the data already provided in table 1. This table is for information purposes only.
(2) Light shaded boxes: Provision of data is mandatory, but rough estimates are acceptable. These estimates should be explained in the description of the methodology.
(3) Dark shaded boxes: Provision of data is voluntary. (4) For the purpose of this decision, the data on material recycling for plastics shall include all
material recycled back into plastics.
* Metal packaging as aluminium includes mainly cans and beverages (sales packaging) and steel includes
mainly oil drums (transport packaging). ** Other packaging material is ´composite´ and consists of milk and other drinking cartons. In the final
report of the pilot study on packaging waste in Iceland, these quantities have been added to the generated paper and cardboard packaging waste.
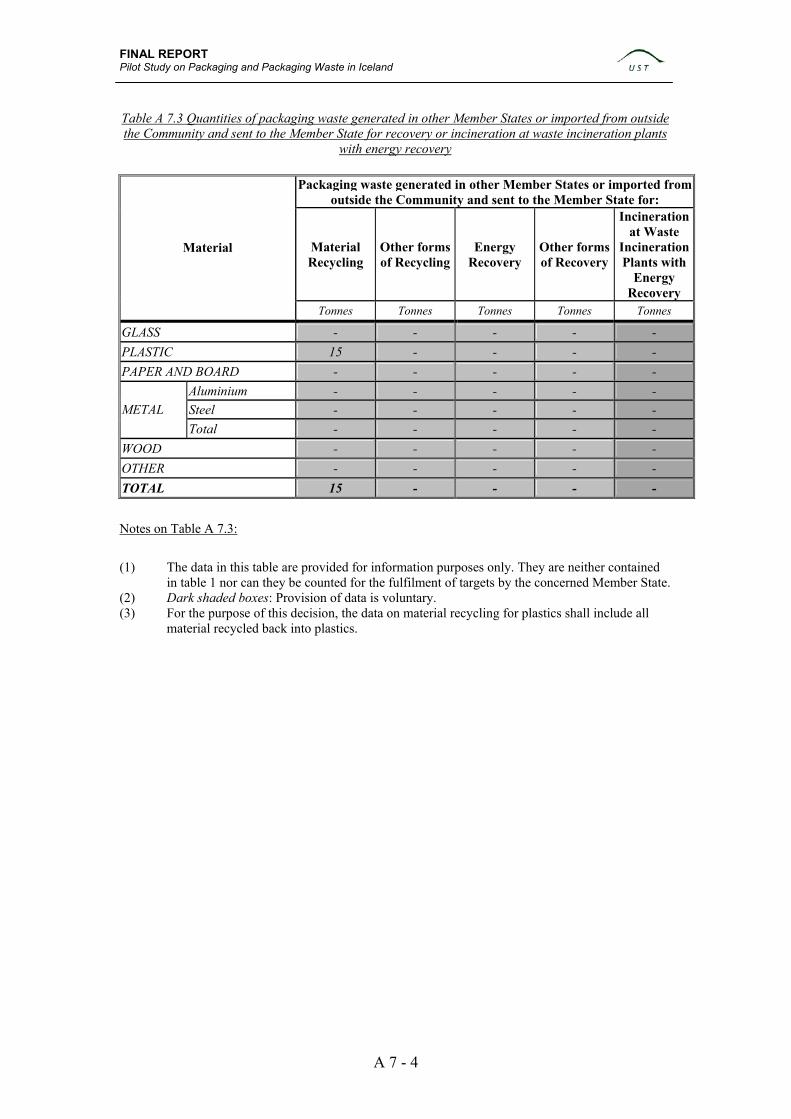
FINAL REPORT Pilot Study on Packaging and Packaging Waste in Iceland
A 7 - 4
Table A 7.3 Quantities of packaging waste generated in other Member States or imported from outside the Community and sent to the Member State for recovery or incineration at waste incineration plants
with energy recovery
Packaging waste generated in other Member States or imported from outside the Community and sent to the Member State for:
Material Recycling
Other forms of Recycling
Energy Recovery
Other forms of Recovery
Incineration at Waste
Incineration Plants with
Energy Recovery
Material
Tonnes Tonnes Tonnes Tonnes Tonnes
GLASS - - - - - PLASTIC 15 - - - - PAPER AND BOARD - - - - -
Aluminium - - - - - Steel - - - - - METAL Total - - - - -
WOOD - - - - - OTHER - - - - - TOTAL 15 - - - - Notes on Table A 7.3: (1) The data in this table are provided for information purposes only. They are neither contained
in table 1 nor can they be counted for the fulfilment of targets by the concerned Member State. (2) Dark shaded boxes: Provision of data is voluntary. (3) For the purpose of this decision, the data on material recycling for plastics shall include all
material recycled back into plastics.

FINAL REPORT Pilot Study on Packaging and Packaging Waste in Iceland
A 8 - 1
Annex VIII
Packaging waste recovery and recycling 1995 – 2002

FINAL REPORT Pilot Study on Packaging and Packaging Waste in Iceland
A 8 - 2
Table A 8.1 Packaging waste generated, recovered and recycled in Iceland in 1995
Generated Recovered Recycled Packaging waste (tons) (tons) (%) (tons) (%)
Total 59.000 11.955 20,3 11.000 18,6 Glass 5.000 1.700 34,0 1.700 34,0 Plastic 16.300 1.810 11,1 1.500 9,2 Paper & cardboard 19.800 2.580 13,0 2.200 11,1
Paper & cardboard 19.800 2.580 13,0 2.200 11,1 Composite 2.600 55 2,0 0 0
Metal 3.800 1.200 31,6 1.200 31,6 Wood 11.300 4.610 40,8 4.400 38,9
Table A 8.2 Packaging waste generated, recovered and recycled in Iceland in 1998
Generated Recovered Recycled Packaging waste (tons) (tons) (%) (tons) (%)
Total 71.160 12.470 17,5 11.342 15,9 Glass 2.860 2.300 80,4 2.300 80,4 Plastic 20.200 1.680 8,3 1.240 6,1 Paper & cardboard 27.100 2.580 9,5 2.200 8,1
Paper & cardboard 27.100 2.580 9,5 2.200 8,1 Composite 2.800 100 3,6 2 0,1
Metal 7.100 1.200 16,9 1.200 16,9 Wood 11.100 4.610 41,5 4.400 39,6
Table A 8.3 Packaging waste generated, recovered and recycled in Iceland in 2000
Generated Recovered Recycled Packaging waste (tons) (tons) (%) (tons) (%)
Total 68.660 14.110 20,6 12.595 18,3 Glass 2.860 2.380 83,2 2.380 83,2 Plastic 20.200 2.170 10,7 1.240 6,1 Paper & cardboard 27.100 2.580 9,5 2.300 8,5
Paper & cardboard 27.100 2.580 9,5 2.300 8,5 Composite 2.800 100 3,6 45 1,6
Metal 4.600 1.200 26,1 1.200 26,1 Wood 11.100 5.680 51,2 5.430 48,9
Table A 8.4 Packaging waste generated, recovered and recycled in Iceland in 2002
Generated Recovered Recycled Packaging waste (tons) (tons) (%) (tons) (%)
Total 56.105 16.558 29,5 15.104 26,9 Glass 6.452 3.476 53,9 3.476 53,9 Plastic 19.333 2.353 12,2 1.628 8,4 Paper & cardboard 21.635 3.162 14,6 2.437 11,3
Paper & cardboard 19.003 3.048 16,0 2.323 12,2 Composite 2.632 839 31,9 114 4,3
Metal 1.212 498 41,1 498 41,1 Wood 7.473 7.068 94,6 7.065 94,5

FINAL REPORT Pilot Study on Packaging and Packaging Waste in Iceland
A 9 - 1
Annex IX
Amounts of waste generated by sector 1995 – 2004

FINAL REPORT Pilot Study on Packaging and Packaging Waste in Iceland
A 9 - 2
Table A 9.1 Generation of waste by sector and waste management 1995 – 2003 (tonnes/year x 1.000)
Year 1995 1996 1997 1998 1999 2000 2001 2002 2003 20041
Inhabitants (x 1000) 268 270 272 275 279 283 286 288 291 293 Total waste, of which: 381 391 401 411 421 432 443 465 476 488
Total municipal waste, of which: 114 117 120 123 126 130 133 137 140 143 Mixed household waste 109 111 108 102 95 88 80 72 71 70 Separated municipal waste 5 6 12 21 31 42 53 65 69 73
Garden waste … … … 1 3 5 8 11 12 13 Timber waste … … … 1 1 2 2 3 3 3 Paper & paperboard … … … 1 2 3 5 7 8 10 Beverage packaging (levied) … 1 2 3 5 7 8 8 8 8 Clothes, shoes & textiles … … … … … … … 1 1 1 Sludge from sceptic-tanks 5 5 5 5 5 5 5 5 6 6 Mixed bulky waste … … 5 10 15 20 25 30 31 32 Street-cleaning waste … … … … … … … … … …
Other waste, of which: 267 274 281 288 295 302 310 328 336 345 Mixed (non-household) production waste 226 233 238 243 248 253 250 146 150 156 Tires 4 4 4 4 4 5 5 5 5 5 Scrap metal 27 27 29 31 33 34 35 40 40 40 Separated production waste, i.e.: 10 10 10 10 10 10 20 137 141 144
Slaughterhouse waste 10 10 10 10 10 10 10 16 16 16 Fish processing (on shore) … … … … … … … 32 32 32 Timber (pallets, crates etc) … … … … … … 10 15 16 17 Industrial metal production … … … … … … … 10 10 10
Agricultural waste, of which: Surplus manure … … … … … … … 45 45 45 Sileage foil … … … … … … … 2 2 2
C&D waste … … … … … … … 12 15 17 Glass … … … … … … … 4 4 4 Clinical waste … … … … … … … 1 1 1
Total waste managed, of which: 381 391 401 411 421 432 443 465 476 488
Recovery, of which 54 65 69 79 87 87 102 119 125 138 Incineration with energy recovery 5 7 7 7 7 7 7 7 7 13 Composting 2 2 2 2 2 2 2 2 3 3 Recycling other than composting 47 56 60 70 78 78 93 110 115 122
Final disposal, of which: 327 326 332 332 334 345 341 346 351 350 Landfill on sites with permit2 235 240 248 274 304 321 321 331 341 345 Landfill on dumpsites without permit 69 66 64 41 16 11 8 4 1 1 Incineration without energy recovery 0 0 0 0 0 0 0 0 0 0 Others3 23 20 20 17 14 13 12 11 9 4
Hazardous waste4, of which: 6 7 7 7 8 7 8 8 8 8
Recovery, incl. energy recovery 5 6 6 6 6 6 6 6 4 4 Landfill – – – – – – – – – – Exported for treatment 1 1 1 1 2 1 2 2 4 4
Population served, % 99 99 99 99 99 99 99 100 100 100 Source: Umhverfisstofnun - Environment and Food Agency of Iceland.
1) Preliminary data, to be confirmed in 2006, based on regional waste management plans to be finalised 2005. 2) Landfill on sites with permit according to regulation no 785/1999. 3) Open-pit burning and incineration in primitive plants. Including landfill of ashes. 4) Hazardous waste not included in total waste.

FINAL REPORT Pilot Study on Packaging and Packaging Waste in Iceland
A 9 - 2