Preventing the Lane Change Accident Through Protective Driving Presented By:

PILOT STUDY OF ACCIDENT SCENARIOS ON A DRIVING SIMULATOR
Thierry Perron Laboratoire d’Accidentologie et de Biomkcanique PSA Peugeot CitroZn - RENAULT (LAB) Jean Chevennement RENAULT Anne Damville Claire Mautuit Centre Europken d’Etudes de SCcuritt et d’Analyses des Risques (CEESAR) Christian Thomas Jean-Yves Le Coz Laboratoire d’Accidentologie et de Biomtcanique PSA Peugeot Citroen - RENAULT (LAB) France Paper Number 98-S2-O-02
ABSTRACT
This paper presents a pilot experimental study carried out by the Laboratory of Accidentology and Biomechanics PSA Peugeot Citroen - RENAULT (LAB) and the European Center of Safety Studies and Risk Analysis (CEESAR) on the RENAULT ESTER motionless driving simulator. Sixty-eight drivers were exposed to a dangerous situation in which another car failed to stop at an intersection. Three distinct configurations were tested : vehicle coming from the right either at a constant speed or decelerating, or stationary vehicle moving-off from the left. Kinematic data and a video presenting the driver’s face and the field of view were recorded. After the driving session, drivers were interviewed by a psychologist of in-depth accident investigation teams in order to analyze their interpretation of the situation.
The analysis carried out is based on a comparison of the behavior (perceptions, interpretations, actions) of drivers who avoided the accident with the behavior of those who crashed. It points out different kinds of difficulties according to the configuration : problems of perception (angular limitations), anticipation (no anticipation of the possible motion of the adverse vehicle) or interpretation (incorrect estimation of the danger level). It provides a basis for the determination of avoidance strategies and the design of active crash avoidance systems (intelligent collision avoidance systems as well as active braking boosters) with the specification (triggering threshold) and efficiency assessment of such systems. This study also provides data for accident reconstruction (e.g. reaction time in accident situations, motion perception threshold...).
INTRODUCTION
Studies conducted on the limits of secondary safety have proved that approximately half of car occupants fatally injured in car accidents could be saved only by
means of primary safety (Thomas 1990). In order to provide better safety, car manufacturers are developing crash avoidance systems. Beyond general accident statistics, the specification of such systems requires accurate data on the space and time history of accidents : vehicles’ positions, speeds, accelerations and drivers’ actions on the accelerator, brake pedal and steering wheel.
General accident databases enable a determination of the most frequent accident situations in which active systems must operate. For example, an analysis conducted on personal injury accidents in France from 1993 to 1995, points out that among accidents involving at least one passenger car : l 36 % occur at intersections, l 49 % of two-vehicle accidents occur at intersections, l 67 % of front-to-side collisions occur at intersections.
These figures, combined with the fact that passive safety systems have a more limited potential efficiency in front-to-side collisions, highlight that intersection accidents are very relevant in the field of active safety. A more detailed analysis carried out on a one year fatal accident report database (a description of this database is provided by Thomas 1996) shows that, among intersection accidents in which at least one car occupant was fatally injured : l 70 % occur outside urban areas, l 72 % occu in the daytime, l 84 % occur on a dry road, l 9 1 % occur without any visibility mask, l 77 % of non-right-of-way are sign posted, l more than 80 % of drivers were crossing straight.
In-depth accident studies with full accident reconstruction provide much more thorough data on the space and time history of accidents (Damville 1997). Reconstructions may be useful to specify some crash avoidance systems, such as emergency braking dynamic assistance or automatic braking anti-collision systems (Perron 1997). Despite the fact that those studies give data on real world accidents, they lack sufiicient accuracy, especially concerning drivers’ actions.
374

In this context, driving simulator experiments seem to be well suited to the analysis of driver behavior in accident situations and complementary to in-depth accident studies. At a methodological level, the aim of the pilot study presented hereafter is to analyze the potential of a motionless driving simulator in certain accident situations for the analysis of driver behavior and the specification of crash avoidance systems. At a more operational level, the experiment is aimed at analyzing the avoidance strategies of right-of-way drivers at intersections when another vehicle fails to yield, in order to determine how to improve them by means of crash avoidance systems (a full analysis of this experiment is provided by Perron 1997).
MATERIAL AND METHOD
Driving Simulator - The experiment was conducted on the ESTER fixed-base driving simulator developed by RENAULT Research Department (Chevennement 1997, Morel Guillemaz 1997). The mock-up is a full RENAULT 19 with a steering wheel actuator. It is not fitted with an Anti-lock Braking System. The visual field covers the entire windshield (from 30” on the left to 50” on the right, figure 1). Engine and aerodynamic noise are simulated by using sampling technology.
v Figure 1. Field of view of the driving simulator.
Configurations - The experimental conditions tested in this experiment were chosen according to the macro- accidentologic data presented above : l the intersection is located in rural area, l the non-right-of-way vehicle comes from a road
perpendicular to the driver, l the weather conditions are good (daylight, dry road), l there is no visibility mask, l the intersection is fully sign posted.
The kinematic configurations of the non-right-of-way vehicle were determined on the basis of in-depth accident studies with ml1 kinematic reconstruction. The non-right- of-way vehicle is hereafter called the “adverse vehicle”. These configurations were also defined in accordance with the simulator specificity. In each configuration, the adverse vehicle is given a certain kinematic law which is triggered when the estimated time to the intersection of drivers reaches a certain value. This time-to-intersection is computed on the basis of a constant speed of the driver. The choice of the adverse vehicle’s kinematics and time-to- intersection trigger are combined in order to place the adverse vehicle in the middle of the driver’s lane when crossing the intersection (supposing that the driver keeps a constant speed). Three main configurations were defined (a pictogram of each configuration is given in figure 2) : l In configuration 0, the adverse vehicle arrives at the
intersection from the driver’s right, at a constant speed of 60 km/h. It is triggered and immediately visible 6.10 s before the driver arrives at the intersection (supposing that he keeps a constant speed).
l In configuration 1, the adverse vehicle arrives at the intersection from the driver’s right, decelerating from X0 to 30 kmih at 3 mls2. At 10 m from the intersection, the vehicle maintains its speed at 30 km/h, and accelerates at 1 m/s2 when arriving in the middle of the junction. It is triggered and immediately visible 6.10 s before the driver arrives at the intersection (supposing that he keeps a constant speed).
l In configuration 2, the adverse vehicle is stopped and visible 1 m behind the stop line, on the left of the driver. It moves off 3.25 s before the driver arrives at the intersection (supposing that he keeps a constant speed).
/I\ I I I
Figure 2. Pictograms of the 3 configurations.
375
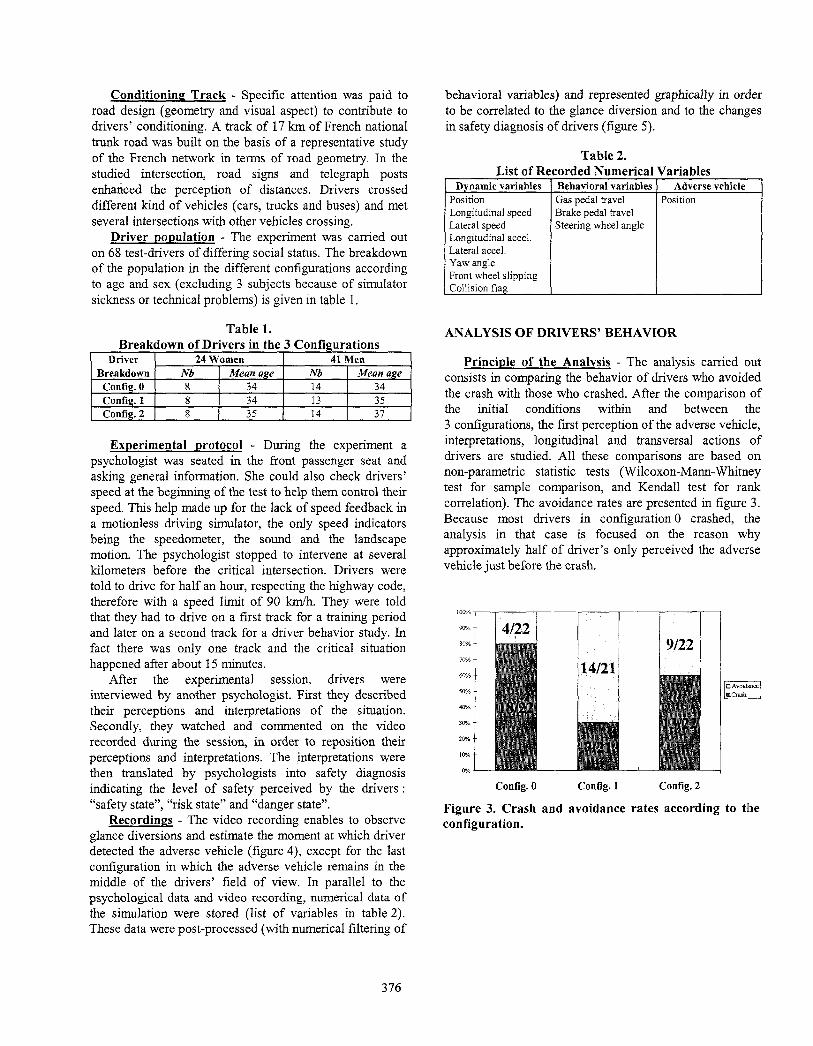
Conditionine Track - Specific attention was paid to road design (geometry and visual aspect) to contribute to drivers’ conditioning. A track of 17 km of French national trunk road was built on the basis of a representative study of the French network in terms of road geometry. In the studied intersection, road signs and telegraph posts enhanced the perception of distances. Drivers crossed different kind of vehicles (cars, trucks and buses) and met several intersections with other vehicles crossing.
Driver population - The experiment was carried out on 68 test-drivers of differing social status. The breakdown of the population in the different configurations according to age and sex (excluding 3 subjects because of simulator sickness or technical problems) is given in table 1.
Table 1.
Experimental protocol - During the experiment a psychologist was seated in the front passenger seat and asking general information. She could also check drivers’ speed at the beginning of the test to help them control their speed. This help made up for the lack of speed feedback in a motionless driving simulator, the only speed indicators being the speedometer, the sound and the landscape motion. The psychologist stopped to intervene at several kilometers before the critical intersection. Drivers were told to drive for half an hour, respecting the highway code, therefore with a speed limit of 90 km/h. They were told that they had to drive on a first track for a training period and later on a second track for a driver behavior study. In fact there was only one track and the critical situation happened after about 1.5 minutes.
After the experimental session, drivers were interviewed by another psychologist. First they described their perceptions and interpretations of the situation. Secondly, they watched and commented on the video recorded during the session, in order to reposition their perceptions and interpretations. The interpretations were then translated by psychologists into safety diagnosis indicating the level of safety perceived by the drivers : “safety state “, “risk state” and “danger state”.
Recordiws - The video recording enables to observe glance diversions and estimate the moment at which driver detected the adverse vehicle (figure 4), except for the last configuration in which the adverse vehicle remains in the middle of the drivers’ field of view. In parallel to the psychological data and video recording, numerical data of the simulation were stored (list of variables in table 2). These data were post-processed (with numerical filtering of
behavioral variables) and represented graphically in order to be correlated to the glance diversion and to the changes in safety diagnosis of drivers (figure 5).
Table 2. List of Recorded Numerical Variables
Dynamic variables \ Behavioral variables 1 Adverse vehicle Position 1 Gas oedal travel I Position
ANALYSIS OF DRIVERS’ BEHAVIOR
Principle of the Analysis - The analysis carried out consists in comparing the behavior of drivers who avoided the crash with those who crashed. After the comparison of the initial conditions within and between the 3 configurations, the first perception of the adverse vehicle, interpretations, longitudinal and transversal actions of drivers are studied. All these comparisons are based on non-parametric statistic tests (Wilcoxon-Mann-Whitney test for sample comparison, and Kendall test for rank correlation). The avoidance rates are presented in figure 3. Because most drivers in configuration 0 crashed, the analysis in that case is focused on the reason why approximately half of driver’s only perceived the adverse
Config. 0 Config. 1 Config. 2
Figure 3. Crash and avoidance rates according to the configuration.
376

e diversion (configuration 1).
Trig
Brake pedal travel (%) 0
-120
i
geri
IOOm
"g
Perception
Throttle-off Throttle-off Braking
- -.__
-. . . . ._, ^ .,. ..,-.-.+ _.... “. I. ../ -__I .._. - -1oom -50 m
1 : ’ : ’ A 1 ZI
/ SOm
$.A-- &t” . . ‘__ I..Yz-? ~~--“--------
Adverse vehicle
Figure 5. Graphical representation of part of the numerical recorded variables (configuration 1).
377

Initial conditions - At 500 m from the intersection, drivers’ speeds are statistically comparable between the different configurations. In configuration 1, there is no statistical difference in speeds at 500 m 250 m and at the triggering of the adverse vehicle between drivers who avoided and those who crashed. In configuration 2, in which the adverse vehicle is visible much before its starting, there is no statistical difference in speeds at 500 m however speeds at 250 m and at the triggering of the adverse vehicle are significantly different (difference of 9 km/h of medians). Drivers’ anticipation therefore plays a significant role in the success of the avoidance action. In configuration 0, drivers who perceived the adverse vehicle much before the collision were driving 15 km/h faster (median value) than those who did not (this difference is statistically significant). This can be explained by a lower angular position of the adverse vehicle at the moment of its triggering. The angle between the driver’s heading and the adverse vehicle from the point of view of driver’s eye is actually :
a=atan waiting Distance to intersec. of adverse vehicle triggering Time to intersec. x driver’s Speed (1.1
The median of this angle is 34” for those who only perceived the adverse vehicle just before the collision, compared to 30” for the others (the distributions being statistically different). This suggests that drivers have more difficulties to detect the adverse vehicle for higher angular positions of this vehicle.
First perception - Drivers’ first perception cannot be determined in configuration 2 because of the central position of the waiting vehicle making it impossible to observe glance diversions. In configuration 0, drivers who perceived the adverse vehicle just before the collision (at a median distance of 16 m from the intersection, compared to 114 m for other drivers), perceived it statistically for a similar angular position, around 30” to the right. This corroborates the previous findings concerning perception problems. In configuration 1, first perception occurred statistically in the same condition for drivers who avoided and those who crashed (the median of the adverse vehicle angular position being 25” to the right, compared to 27” at the triggering of this vehicle). Drivers perceive the adverse vehicle 0.9 s after its triggering (median value).
Interpretation - In configuration 0, 6 out of 8 drivers who perceived the adverse vehicle before their crash estimated themselves in a “safety state” as a first diagnosis. The 2 other drivers made a “risk state” diagnosis but did not decelerate. In configuration 1, 10 out of 12 drivers who avoided made a “risk state” first diagnosis. On the other hand, 5 out of 7 drivers who crashed made a “safety state” diagnosis. This distribution is statistically significant (Fisher exact test). In configuration 2, the speed, at the starting of the adverse vehicle, of drivers who made at least one “risk state” diagnosis is statistically lower than that of
those who remained in a “safety state”. Among the 9 drivers who avoided, 6 were in a “risk state” at the starting of the adverse vehicle, compared to 3 among the 13 drivers who crashed. Therefore, interpretation and anticipation play a significant role in the avoidance of those accidents.
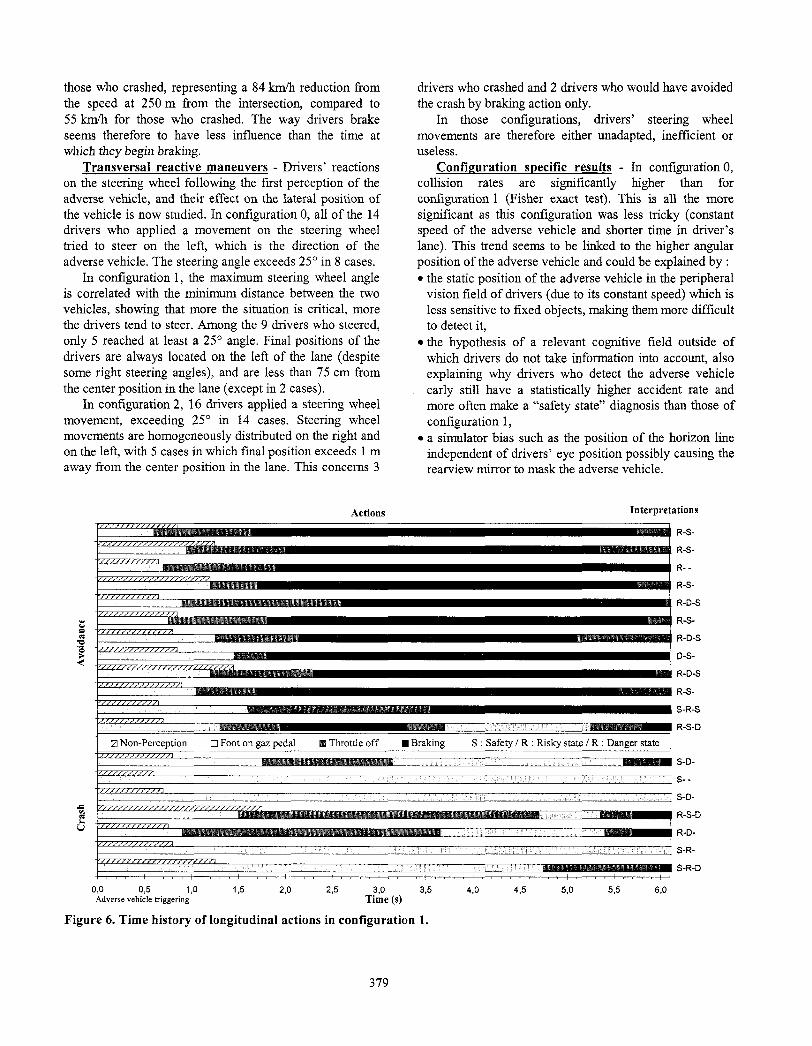
Longitudinal reactive maneuvers - Drivers’ reactions following the first perception of the adverse vehicle on the gas and brake pedals and their effect on their speed is now studied. In configuration 0, drivers who perceived the adverse vehicle long before the crash reacted as late as the others (no statistical difference in the moment of throttle- off between the two groups) : 2.1 s after the perception and 0.7 s before the crash (median values). This must be due to their too optimistic safety diagnosis. For both groups, the speed reduction in the last 250 m is not significant (median lower than 5 km/h).
In configuration 1, the early perception of the adverse vehicle leaves at least 4 s for the drivers to react. Drivers who crashed throttled-off 1.7 s after the triggering of the adverse vehicle, compared to 1.1 s for those who avoided (median values). Either they did not brake at all or they braked late in the last 0.5 s before the crash. Those who avoided braked in a period of 3.5 s after the triggering of the adverse vehicle (the crash should occur 6.1 s after this triggering). The maximum brake pedal travel is statistically identical between the two groups. Foot displacement time (from gas to brake pedal) is statistically lower for drivers who crashed (median being 0.4 s compared to 1.1 s). Their maximum brake pedal speed is significantly higher. This can be explained by the fact that those drivers reacted consecutively to a “danger state” diagnosis. However, maximum brake pedal speed is not correlated to the speed variation. The median of minimum speed of those who avoided is 42 kmfh compared to 87 km/h for those who crashed, representing a 56 km% reduction from the speed at 250 m from the intersection, compared to 11 km/h for those who crashed. The way drivers brake seems therefore to have less influence than the time at which they begin braking.
In configuration 2, all throttles-off are followed by an immediate braking, these actions being all realized in a “danger state” diagnosis. Drivers who avoided start their throttle-off action 0.8 s after the starting of the adverse vehicle (median value). Those who crashed have a supplementary delay of 0.5 s which is statistically significant. There is no significant difference in the foot displacement time between those two groups (medians being respectively 0.4 and 0.3 s). Maximum brake pedal travel and maximum brake pedal speed are also statistically identical between the two groups. This is consistent with the fact that all drivers react in the same “danger state” diagnosis. Maximum brake pedal speed is not correlated with speed reduction. The median of minimum speed of those who avoided is 0 km/h compared to 44 wh for
378
those who crashed, representing a 84 kmih reduction from the speed at 250 m from the intersection, compared to 55 km/h for those who crashed. The way drivers brake seems therefore to have less influence than the time at which they begin braking.
Transversal reactive maneuvers - Drivers’ reactions on the steering wheel following the first perception of the adverse vehicle, and their effect on the lateral position of the vehicle is now studied. In configuration 0, all of the 14 drivers who applied a movement on the steering wheel tried to steer on the left, which is the direction of the adverse vehicle. The steering angle exceeds 25’ in 8 cases.
In configuration 1, the maximum steering wheel angle is correlated with the minimum distance between the two vehicles, showing that more the situation is critical, more the drivers tend to steer. Among the 9 drivers who steered, only 5 reached at least a 25” angle. Final positions of the drivers are always located on the left of the lane (despite some right steering angles), and are less than 75 cm from the center position in the lane (except in 2 cases).
In configuration 2, 16 drivers applied a steering wheel movement, exceeding 25” in 14 cases. Steering wheel movements are homogeneously distributed on the right and on the left, with 5 cases in which final position exceeds 1 m away from the center position in the lane. This concerns 3
Actions
drivers who crashed and 2 drivers who would have avoided the crash by braking action only.
In those configurations, drivers’ steering wheel movements are therefore either unadapted, inefficient or useless.
Configuration wecific results - In configuration 0, collision rates are significantly higher than for configuration 1 (Fisher exact test). This is all the more significant as this configuration was less tricky (constant speed of the adverse vehicle and shorter time in driver’s lane). This trend seems to be linked to the higher angular position of the adverse vehicle and could be explained by : 0 the static position of the adverse vehicle in the peripheral
vision field of drivers (due to its constant speed) which is less sensitive to fixed objects, making them more difficult to detect it,
l the hypothesis of a relevant cognitive field outside of which drivers do not take information into account, also explaining why drivers who detect the adverse vehicle early still have a statistically higher accident rate and more often make a “safety state” diagnosis than those of configuration 1,
l a simulator bias such as the position of the horizon line independent of drivers’ eye position possibly causing the rearview mirror to mask the adverse vehicle.
Interpretations
R-S-
R-S-
R--
R-S-
R-D-S
R-S-
R-D-S
D-S-
R-D-S
R-S-
S-R-S
R-S-D
S-D-
s- -
S-D-
R-S-D
R-D-
S-R-
S-R-D
03 0,5 1,O I,5 LO 23 -rite 3,5 Adverse vehicle triggering (s)
Figure 6. Time history of longitudinal actions in configuration 1.
4.0 4,5 5.0 5,5 60
379

9
8
7
T t
i
t
OC
co <o,l <0,2 <0,3 <0,4 CO,5 CO,6 <0,7 <0,8 <0,9 <, <l,i <1,2 <1,3 41,4 Cl,5 <,,6 <,,7 <,,8 <I,9 <2 >2
Foot displacement time (s)
Figure 7. Breakdown of foot displacement time in the 3 con~gurations.
I co,0
t
co,3 CO,6 co,9 a,2
Adverse vehicle
i a,5 cl,8 C2,l <2,4
travel at drivers’ throttle-off(m)
<2,7 <3,0 >3,0
Figure 8. Breakdown of adverse vehicle travel at drivers’ throttle-off in configuration 2.
380

In configuration 1, the behaviors of those who avoided and of those who crashed stand in sharp contrast (figure 6). Actually, drivers who avoided have highly anticipated the critical situation with precautionary braking actions before the situation becomes really critical, which is not the case for those who crashed.
In configuration 2, drivers who crashed are those who were driving faster and who throttled-off latest : speed at the starting of the adverse vehicle and throttle-off delay are significantly correlated. This can be explained by the double effect of over confidence as regards speed and attention.
Overall results - From the different configurations, the results highlight that : l drivers had greater difficulty in detecting the adverse
vehicle and diagnose the situation when its angular position is higher than 32” to the right,
l the first safety diagnosis was decisive in the avoidance of the crash,
0 drivers who avoided are those who anticipated long in advance and decelerated before the situation became really critical,
l the way drivers braked seems to have less influence than the moment at which they braked,
0 in those configurations, steering wheel movements of drivers were either unadapted, inefficient or useless.
This experiment also provides some useful data for kinematic accident reconstructions that are carried out for in-depth accident investigation. As an example, figure 7 provides the breakdown of foot displacement times for which throttle-off and braking occurred during the same safety diagnosis. Figure 8 gives the breakdown of the adverse vehicle travel at the beginning of drivers’ throttle- off in configuration 2. An example of the use of such data is given by Tarriere (1996).
DISCUSSION
Validity of the experiment - Compared to external observations of human behavior, experiments bring a certain bias due to the experimental context which may be slightly different from normal conditions and in which subjects may feel observed and modify their behavior. Simulator studies bring a supplementary bias due to : l the realism of the simulation (through visual, auditory,
force and movement restitution), which may affect drivers’ perceptions and actions on vehicle controls,
* the virtuality of the context, which may modify drivers’ cognitive interpretation of the situation.
Since drivers do not feel their deceleration when braking in a motionless simulator, they undoubtedly tend to overdose their actions. In this experiment, it is particularly the case for drivers who highly anticipate and proceed to a precautionary maneuver (partial braking). However it is
assumed that the lack of deceleration feedback for this action does not interfere with the time at which the driver initiated it. Moreover, in more critical situations, drivers’ actions were quite extreme and reflex. It is thus assumed that they would not have been so different in a real situation. Interviews with psychologists have shown that most drivers felt as if they were involved in the situation, with some high stress reactions. Moreover, drivers’ reactions are generally consistent with their interpretation. This tends to show that in a short and highly demanding task drivers tend to forget that they are in a totally safe driving simulator. From a more general point of view, drivers’ speed at 500 m from the intersection has been found representative of real speeds on French national roads, highlighting also the simulator’s relevance for long- duration tasks.
A better way to estimate the validity of the experiment, is to compare it to other similar experiments conducted on a real scale on test tracks. For obvious safety reasons, such experiments are not very numerous. Olson (1986) measured drivers’ perception-response times, from the moment an obstacle hidden by a crest becomes visible to the moment the driver applies the brakes. The median of perception-response times in his experiment was 1.1 s, with a 0.4 s foot displacement time (median value). These results are very similar to those of configuration 2, with a 1.3 s braking time and a 0.3 s foot displacement time (median values). The slightly longer braking time may be explained by the fact that in configuration 2 the danger is not immediate : it takes a longer time for drivers to detect the movement of the adverse vehicle and interpret that it is going to cross their lane. Since the experiment presented in this paper was carried out on a motionless simulator, other similar studies conducted on a dynamic driving simulator also provide data to assess the validity of the experiment. The one conducted by Lechner (1991) is similar to configuration 2, with an adverse vehicle arriving at an intersection from the drivers’ right, failing to yield and stopping in the middle of the drivers’ lane. The authors found a mean foot displacement time of 0.2 s, similar to results of configuration 2. In their experiment, the mean braking time was 1.0 s but was found to be positively correlated with the time to intersection at the triggering .of the adverse vehicle (2 s, 2.4 s or 2.8 s in their experiment), which explains why it is longer in configuration 2 (triggering time being 3.25 s in this configuration). The authors also noticed no difference in the realization of braking between those who avoided and those who crashed.
381

ADplication to the specification of crash avoidance systems - Even if braking action is not always the most efficient way to avoid a crash, it is the easiest to assist with intelligent systems and the most relevant to dissipate energy. It is therefore proposed to analyze the point to which braking may still be effective in avoiding the crash in each configuration. Knowing the kinematics of the adverse vehicle, it is possible at any time to compute the constant deceleration that the driver should apply from this moment to avoid the adverse vehicle with a given safety margin. Figures 9 and 10 provide, for each driver, the time- history of the deceleration that the driver should apply to pass 2 m behind the adverse vehicle, respectively in configurations 0 and 1. Figure 11 gives the deceleration that drivers of configuration 2 should apply to stop 2 m before the adverse vehicle’s lane.
These graphics must be related to the moment at which the situation becomes objectively critical, which is not explicit in configurations 0 and 1. In these configurations, it is proposed to characterize this moment with the deceleration that the adverse vehicle should apply from this moment to stop at the intersection (this deceleration is here supposed constant, and it is proposed to call it “degree of
criticity”). It is assumed that, when this deceleration reaches a certain limit, the probability that the adverse driver actually applies the brakes to obtain this level of deceleration becomes relatively low. The risk that this driver will fail to yield becomes therefore high enough so that the right-of-way driver should take the decision to brake. It is here proposed to fix the limit for the degree of criticity at 4 m/s’. This value is reached 2.3 s before the collision in configuration 0, and 1.5 s before the collision in configuration 1.
In configuration 0, perception and interpretation problems were identified. It therefore seems that a system aimed at helping drivers to detect the danger would be relevant. This requires detection of the adverse vehicle and estimation of its speed between 43 and 68 m from the intersection, when the adverse vehicle is at 35 m from the stop line, between 26” and 37” to the right. Figure 9 points out that it is still possible to avoid all crashes if the right- of-way vehicle brakes 2 s before the collision at 6.5 m/s2. This leaves too short a time for the driver to react to an alarm and therefore would require an automatic braking system.
0.0 a5 I,0 1,s 2,o 2.5 3,o 3.5 4,o 4,s LO 5,s 60
Time (s) - 0 at the triggering of the amierse vehicle
Figure 9. Deceleration curves of drivers to pass 2 m behind the adverse vehicle in configuration 0.
382

Time (s) - 0 at the trzggering of the adverse vehzcle
Figure 10. Deceleration curves of drivers to pass 2 m behind the adverse vehicle in configuration 1.
%O 0,s I,0 I,5 2,o 23 38 3,s 48 4,5 5,o
-I
-2
-14
-15
+---- -+--_tp/ 1 1 /
t
Time (s) - 0 at the starting of the adverse vehicle
Figure 11. Deceleration curves of drivers to stop 2 m before the adverse vehicle’s lane in configuration 2.
383

In configuration 1, the problem essentially stems from the interpretation of the adverse vehicle kinematics. The crash being foreseeable only 1.5 s before the collision, the system should also apply the brakes automatically. It should detect the adverse vehicle and estimate its speed between 27 and 51 m from the intersection, when the adverse vehicle is at 10 m from the stop line, between 13” and 2 lo to the right. Figure 10 shows that braking at 6.5 m/s2 would only prevent 4 crashes out of 7. The speed reduction in the remaining crashes would however be significant (at least 35 km/h) and could moreover be accompanied by an anticipatory deployment of passive safety systems.
In configuration 2, most drivers rapidly recognize the danger on themselves. To improve their reactions, an intelligent crash avoidance system should therefore also apply automatic braking. To be acceptable, such a system should brake before all drivers, which means 0.9 s after the starting of the adverse vehicle (having then traveled 0.5 m, and being at 5 km/h). Braking at 7 m’s’ would then avoid all collisions.
However such automatic braking systems are today in the research phase and are facing reliability problems. In configuration 2 for instance, it is not obvious to distinguish early between a non-right-of-way vehicle that is actually crossing the intersection, and another one that is safely turning right. Moreover there are other complex intersection infrastructures in which vehicle kinematics could make the system erroneously believe it is in a danger situation. It is clear that any inopportune activation of such systems would have negative consequences on the acceptability of the system, but also and especially on safety. The technological limits for automatic braking triggering could be pushed back thanks to the addition of criteria based on the driver behavior. Actually, emergency braking dynamic assistance (active braking booster) follows this direction to the extreme, with no data taken on the external situation (environmental source of danger), the trigger being only dependent on the driver’s actions. The experiment presented here also provides data for the specification of such systems.
This experiment provides data quantifying throttle-off and braking actions combined with psychological data on drivers’ diagnosis of the situation. It is therefore possible to determine optimized triggering criteria that maximize triggering in “danger state” and minimize triggering in “risk state”. In this study, 3 different kinds of criteria relative to actions on the gas pedal were taken into account. Those criteria were then also combined with another characterizing the throttle-off. Each studied criterion was based on up to 4 distinct parameters. The optimization provided the best numerical conditions for each kind of criterion. A numerical simulation of the effect of an active braking booster based on these criteria was then carried out
in order to compute the avoidance rate and the decrease in collision speed generated by the system. This assumes that drivers would not have modified their braking force. The analysis gave significant results. However, no criterion was found to reject all inopportune triggering.
It is clear that for the specification and efficiency assessment of active safety systems this experiment is not representative enough to draw any conclusions, due to the number of drivers and situations tested. Actually, inopportune triggering must be studied in many other various non-critical driving situations of daily driving. Moreover, on a motionless simulator drivers probably tend to overdose the corresponding braking actions, which requires further experiments on test tracks or open roads.
CONCLUSION
The experiment presented here points out the benefit of a motionless driving simulator for the analysis of driver behavior in certain driving situations. It is assumed that such experiments are suited to the analysis of maneuvrability* accidents (in which the driver is put in a dangerous situation by external conditions) and guidance* accidents (in which the critical task is to guide the vehicle among different obstacles). It seems that control* accidents (due to a loss of control of the vehicle) are less suited to experiments on a motionless simulator and that pilotability” accidents (due to a driver error) should be studied through observations (in-depth accident investigations for instance). This kind of experiment also seems complementary to in- depth accident investigations since it requires data on the actual kinematics of vehicles in real world accidents, but also gives data for accident reconstructions. This kind of experiment provides useful data for the specification and efficiency assessment of crash avoidance systems. Concerning the different configurations tested, it has been pointed out that : l drivers have more difficulties to detect the adverse
vehicle and diagnose the situation for higher angular positions of this vehicle,
l the first safety diagnosis is decisive in the avoidance of the crash,
l drivers who avoid are those who anticipate far in advance and decelerate before the situation becomes really critical,
l the way drivers brake seems to have less influence than the moment at which they brake,
l in these configurations, steering wheel movements of drivers are either unadapted, inefficient or useless.
* A definition of these terms is given by Perron 1996.
384
ACKNOWLEDGMENTS
The authors wish to extend their acknowledgments to J.-C. Bocquet (Ecole Centrale Paris) for his scientific support in the scope of system safety. This research was carried out with a sponsorship of ANRT and MAIF Foundation within the framework of the French VSR program.
REFERENCES
Chevennement J., Perron T., Le Coz J.-Y., 1997 Contribution of a Motionless Driving Simulator to the Analysis of Driver’s Behavior in “Potential Accident” Situations EAEC, Cernobbio, Italy
Damville A., Perron T., Thomas C., Le Coz J.-Y., 1997 Apport de l’accidentologie en sCcuritC primaire pour I’analyse des facteurs de risques SIA, “L ‘Homme - L’Automobile - La Route”, Rouen, France
Lechner D., Malaterre G., 1991 Emergency maneuver experimentation using a driving simulator SAE 900144 Autotechnologies Conference and Exposition, Monte- Carlo, Monaco
Morel-Guillemaz J., 1997 Contributions of Driving Simulator to Vehicle Design EAEC, Cernobbio, Italy
Olson P., Sivak M., 1986 Perception-Response Time and Unexpected Roadway Hazards Human Factors, Vol. 28, N” 1
Perron T., Thomas C., Le Coz J.-Y., Bocquet J.-C., 1996 Methodological Framework for Primary Automotive Safety : System Safety Approach for the Determination of Critical Scenarios ESV, Melbourne, Australia
Perron T., 1997 Mtthodologie d’analyse de stcuritt primaire automobile pour la spcification fonctionnelle et I’evaluation previsionnelle d’efficacitt de sysdmes d’evitement d’accidents These de doctorat, Ecole Centrale Paris, France
Tarriere C., Brute1 G., Perron T., Chenisbest B., DriscolltR., 1996 European Accident Causation Survey ATA 96A50 11 International Conference Active and Passive Safety, Capri, Italy
Thomas C., Koltchakian S., Tarriere C., Tarriere B., Got C., Pate1 A., 1990 Primary Safety Priorities in View to Technical Feasibility Limits to Secondary Automotive Safety FISITA, Torino, Italy
Thomas C., Perron T., Le Coz J.-Y., Aguade V., 1996 What happens on the road before fatal car crashes ? AAAM, Vancouver, Canada
385