PILOT LAKE RESTORATION INVESTIGATIONS -- V. …galvanic cell oxygen analyzer equipped with a...
49
PILOT LAKE RESTORATION INVESTIGATIONS -- AERATION AND DESTRATIFICATION IN LAKE CATHERINE: SECOND YEAR OPERATION V. Kothandaraman, D. Roseboom, and R. L. Evans Prepared for Illinois Institute of Natural Resources Illinois State Water Survey Urbana, Illinois 1980
Transcript of PILOT LAKE RESTORATION INVESTIGATIONS -- V. …galvanic cell oxygen analyzer equipped with a...

PILOT LAKE RESTORATION INVESTIGATIONS --AERATION AND DESTRATIFICATION IN LAKE CATHERINE:
SECOND YEAR OPERATION
V. Kothandaraman, D. Roseboom, and R. L. Evans
Prepared for Illinois Institute of Natural Resources
Illinois State Water Survey Urbana, Illinois
1980

CONTENTS
Page Background 1 Materials and methods 5 Results and discussion 10
Physical characteristics 10 Temperature 10 Dissolved oxygen 14 Secchi disc transparency 17
Biological characteristics 21 Phytoplanktons 21 Benthic macroinvertebrates 26
Chemical characteristics 28 Chemical treatment 28 Sediment characteristics 34
Summary 36 Acknowledgments 38 References 38 Appendix 40

PILOT LAKE RESTORATION INVESTIGATIONS --AERATION AND DESTRATIFICATION IN LAKE CATHERINE: SECOND YEAR OPERATION
by V. Kothandaraman, Donald P. Roseboom, and Ralph L. Evans
BACKGROUND
The Fox Chain of Lakes, in an advanced stage of eutrophication, experiences recurring problems of luxuriant nuisance algal blooms, periodic fish kills, and offensive odors. These and other symptoms of advanced lake eutrophy impair and interfere with the picturesque beauty of the region, and the aesthetic and recreational enjoyment of the Chain's waters.
A detailed 18-month limnological study of the Fox Chain of Lakes, of which Lake Catherine is a part, was conducted by the Illinois State Water Survey and the Illinois Geological Survey (Kothandaraman, et al., 1977). It became apparent from this study that tributaries to the lake system introduce nutrients, particularly nitrogen and phosphorus, far in excess of limits which are likely to be assimilated without giving rise to nuisance algal blooms. The nutrients released from the lake bottom sediments under anaerobic conditions in the deeper lakes during periods of summer stagnation are also sufficient to sustain algal growths of bloom proportions in the lakes.
The predominant algal types, i.e., blue-green and diatoms, are related to the morphological characteristics of the lakes in the Chain. The northern lakes in the system (figure 1) are relatively deep. Their lesser expanse of water surface makes them less vulnerable to wind action than the large shallow lakes in the system. The deep lakes support similar algal types, mainly blue-greens. In the shallow lakes, diatoms are the dominant species.
Limiting the nutrient influx to the lakes is an essential step in reversing the eutrophic trend in the Fox Chain. Regional plans for pollution abatement in the Fox River watershed, including phosphorus emission control, are in various developmental stages in Illinois and Wisconsin. Illinois has taken a major stride in removal of phosphorus from municipal waste discharges and diverting waste discharges around the lake system where feasible. It is unlikely that nutrient influx into the Fox Chain of Lakes can be curbed to subcritical levels within the next few decades. In the interim, use of in-lake treatment techniques to enhance the Chain's water quality is justified.
In order to assess the efficacy of in-lake treatment methods in the Fox Chain of Lakes, pilot studies were undertaken to investigate the responses of the lake system. Figure 1 shows the sites and pilot demonstration schemes for the Fox Chain. Results of the lake restoration investigations employing copper sulfate to control algae in Mineola Bay of Fox Lake and nutrient inactivation using aluminum sulfate in Bluff Lake are detailed in a report to the Illinois Institute for Environmental Quality (Kothandaraman et al., 1978). An aeration-destratification system designed, fabricated, and supplied by the Aquatic
1

Figure 1. Pilot demonstration schemes in the Fox Chain of Lakes
2

Environmental Control Company (AECC) of Newberry Springs, California, was installed in Lake Catherine during the spring of 1978. The results of the first-year operation of the aerator in Lake Catherine are detailed in a recent report to the Illinois Institute of Natural Resources (Kothandaraman et al., 1979).
The aeration system installed in Lake Catherine was able to destratify the lake's volume to a depth of 26 feet, the depth at which the aerator was located. Oxygen concentrations of 2 mg/l or more were maintained above this depth. Without aeration, lake water at depths below 15 feet from the surface become anoxic during the months of July and August. However, the aerator did not improve water clarity as measured by secchi disc. Nor did aeration in Lake Catherine cause a shift in algal dominance from troublesome blue-green algae to greens or diatoms. This is contradictory to the results reported in the literature (New England Regional Commission, 1971, 1973a, 1973b; Steichen et al., 1979; Symons, 1969). It is felt that the effectiveness of the aeration system in Lake Catherine was limited because the aerator started functioning adequately only from July 6, 1978, long after the thermal stratification in the lake established itself.
The AECC unit installed in Lake Catherine is capable of applying and dispersing chemicals throughout the lake from a single point of application in the lake. At the end of the first-year operation, it was felt that if the aerator was located at the maximum depth of Lake Catherine, if operation was started before stratification occurs, and if chemical applications were instituted at proper time intervals, the water quality of the lake waters could be considerably enhanced.
The pilot aeration-destratification study in Lake Catherine was continued for the second year in 1979 with funding from the Illinois Institute for Environmental Quality, which is now a part of the Illinois Institute of Natural Resources. This report covers, as the title implies, the results of the lake management investigation combining aeration-destratification with periodic chemical treatment of the lake waters during the spring, summer, and early fall of 1979.
A brief discussion of the types of lake aeration devices generally used and the rationale for the selection of the AECC system can be found in the earlier report on aeration and destratification in Lake Catherine (Kothanda-raman et al., 1979). The pros and cons of artificial destratification in eutrophic lakes delineated in the literature (Dunst et al., 1974; U.S. Environmental Protection Agency, 1973) are reiterated here for the purpose of providing additional background information. The following are some advantages of artificial destratification of eutrophic lakes.
• With increased oxygen levels in the hypolimnion, there is a reduction in the anaerobic release of nutrients from the bottom sediments.
• Oxidation of organic and inorganic materials occurs in the water. This is particularly advantageous when the lakes serve as a raw water
3

source, because taste, odor, and color problems caused by iron, manganese, and hydrogen sulfide are eliminated or at least minimized.
• The range of benthic populations is extended to the profundal region which was once anaerobic. An increase in the number of fish and a shift to a more favorable species can result from the greater availability of food organisms.
• Favorable changes in algal populations occur with a decrease in undesirable blue-green species.
• Evaporation rates are reduced in summer with reduction in surface water temperatures.
• There is an increase in water clarity.
• Winter fish kills may be prevented by maintaining sufficient oxygen levels under ice.
The following are some disadvantages.
• The heat budget in the lake is increased.
• There is a temporary increase in water turbidity resulting from resuspension of bottom sediments.
• Artificial destratification may induce foaming.
• The oxygen demand of resuspended anaerobic mud may result in a decrease in oxygen concentrations, temporarily at least, that may kill fish.
As during the initial investigation of aeration in Lake Catherine, Channel Lake was used as control for comparative purposes. Both lakes stratify thermally during summer months, and water strata below the 15- to 18-foot level are devoid of dissolved oxygen. The morphometric details of the two lakes are shown in table 1.
Table 1. Morphometric Details of Lake Catherine and Channel Lake
Parameters Normal lake elevation, msl Volume, acre-feet Surface, acres Mean depth, feet Maximum depth, feet Normal lake length, feet Normal lake width, feet Length of shoreline, miles
Lake Catherine 736.5 2460 147 16.7 39
4200 2200
1.84
Channel Lake 736.5
4370 320 13.7 35
7800 2800
3.37
4

MATERIALS AND METHODS
The details of the initial installation of the AECC units, principles of its operation, and the hydrodynamic mixing of the upwelled hypolimnetic waters with the epilimnetic waters are discussed in detail in an earlier report (Kothandaraman, et al., 1979). Figure 2 shows the completely assembled AECC unit prior to installation.
The length of cable supplying power from the onshore control panel to the aerator in the lake was originally 800 feet. Before the beginning of the operation in 1979, the cable was spliced to extend its length an additional 300 feet and the aerator was relocated at a depth of 34 feet. Soon it was found that the lake bottom was too soft to sustain the weight of the aerator without causing it to settle unevenly. Subsequently, the bearing area of the mounting skid on which the aerator is carried was increased by inserting four 2-inch by 12-inch by 10-foot boards under the skid, nearly doubling the bearing area. The increase in bearing area distributed the weight of the aerator adequately over the soft lake bottom and prevented any undue sinking of the aerator.
The aerator was started on May 10, 1979. The vacuum on the air suction hoses was 24.5 inches of mercury as against 27.5 inches of mercury when the aerator was installed at the 28-foot depth in 1978. As the amount of air aspirated through the aerator is related to the vacuum developed by the aerator, the amount of air drawn from the atmosphere through the aerator was less than when the aerator was operating at a depth of 28 feet. However, the fine bubble air plume had a longer rise through the water column in 1979 than in 1978. As will be discussed later, the location at a 34-foot depth was found unsatisfactory and the aerator was relocated at the 28-foot depth. Attempts to measure the air flow through the suction hoses using a rotoflow meter proved futile because of the vigorous pulsating nature of the air flow-through system. This caused the flow meter indicator to oscillate at a very rapid rate between zero and maximum scale readings.
To evaluate the efficacy of the destratification of Lake Catherine in combination with periodic chemical treatment (with copper sulfate chelated with citric acid and followed subsequently by the application of potassium permanganate), certain physical, chemical, and biological observations were made at least at biweekly intervals starting from May 9, 1979.
In-situ observations of temperature, dissolved oxygen, and secchi disc readings were made during each field trip, and samples were collected for chemical and biological evaluations. Figure 3 shows the sampling stations established for Lake Catherine and Channel Lake. These sampling sites were selected at the deepest part of the lakes. In addition, in-situ observations for DO, temperature, and secchi disc readings were made in the vicinity of the aerator, about 100 feet south of it.
For measuring secchi disc transparencies, an 8-inch diameter secchi disc with black and white quadrant markings attached to a calibrated line was used. The disc was lowered until it disappeared from view, and the depth of
5

Figure 2. Aerator used in Lake Catherine
Figure 3. Location of the aeration device in Lake Catherine and sampling stations
6

immersion of the disc was noted. The disc was lowered farther and then raised slowly until it appeared. Again the depth of immersion was noted. The average of these two observations was recorded as the secchi disc reading.
In-situ dissolved oxygen and temperature measurements were made with a galvanic cell oxygen analyzer equipped with a thermister. An oxygen meter, Yellow Spring Instrument Company model 54, with a 50-foot probe was standardized in lake surface water in which dissolved oxygen content was determined by the modified Winkler method as outlined by the American Public Health Association (1976). Temperature and dissolved oxygen measurements were obtained in the water column at 2-foot intervals commencing from the surface of the lake.
Water samples for chemical analyses were collected at three different depths from both lakes, i.e., from the surface, mid-depth, and 1 foot from the bottom, designated here as the deep sample. For ammonia determinations, water samples were filtered through 0.45 micrometer ( m) millipore filters to prevent biomodification of the dissolved nitrogen form in the water samples.
Water samples in a volume of 380 ml were collected for algal identification and enumeration. These samples were preserved with 20 ml of formalin at the time of collection and stored at room temperature until examined.
Water samples for chemical and algal analyses representative of desired depths of the water column were obtained with a Kemmerer water sampler. Water samples for chlorine demand determinations were collected from surface, mid-depth, and deep locations using 300 ml BOD bottles in Juday samplers. The bottles were immediately stoppered and stored in ice along with chemical sample bottles. These sample bottles were kept refrigerated until analyses were performed.
Twenty liters of lake surface water samples from station 1 of Lake Catherine and the Channel Lake station were also obtained during each field trip to determine the ash-free weight of lake surface plankton biomass. Procedures outlined in the Standard Methods (APHA, 1976) for the determination of standing crop biomass were used.
The following chemical determinations were made on water samples in the laboratory: pH, alkalinity, hardness, sulfate, silica, chlorine demand, total phosphorus, dissolved phosphorus, ammonia-N, nitrate-N, and total iron. The methods and procedures involved in these determinations are given in table 2. For determining chlorine demand, a 200-ml sample was dosed with a chlorine solution to provide an initial chlorine residual of 25 to 30 mg/l. After a contact period of 30 minutes at room temperature, the residual chlorine concentration of the sample was determined. The difference between the initial chlorine concentration and the residual concentration after 30 minutes was taken as the chlorine demand of the sample.
For algal identification and enumeration, the sample was thoroughly mixed and a 1-ml aliquot pipetted into a Sedgwick-Rafter cell. A differen-
7
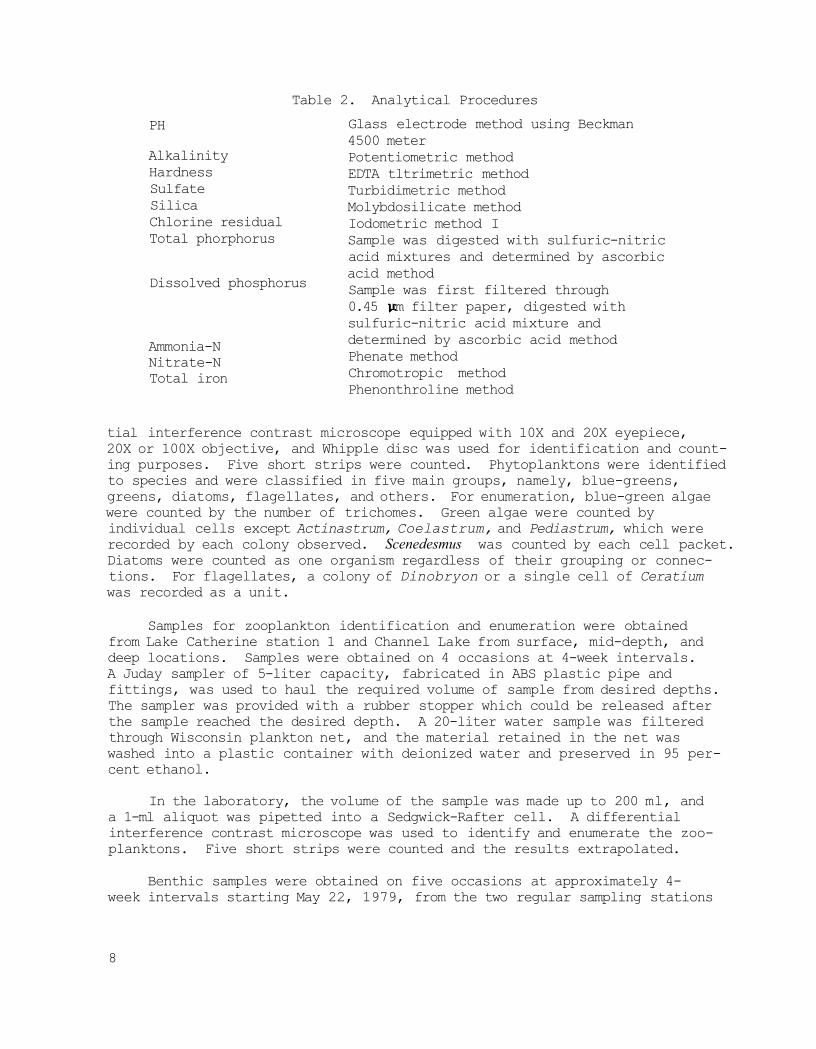
Table 2. Analytical Procedures PH Alkalinity Hardness Sulfate Silica Chlorine residual Total phorphorus
Dissolved phosphorus
Ammonia-N Nitrate-N Total iron
Glass electrode method using Beckman 4500 meter Potentiometric method EDTA tltrimetric method Turbidimetric method Molybdosilicate method Iodometric method I Sample was digested with sulfuric-nitric acid mixtures and determined by ascorbic acid method Sample was first filtered through 0.45 m filter paper, digested with sulfuric-nitric acid mixture and determined by ascorbic acid method Phenate method Chromotropic method Phenonthroline method
tial interference contrast microscope equipped with 10X and 20X eyepiece, 20X or 100X objective, and Whipple disc was used for identification and counting purposes. Five short strips were counted. Phytoplanktons were identified to species and were classified in five main groups, namely, blue-greens, greens, diatoms, flagellates, and others. For enumeration, blue-green algae were counted by the number of trichomes. Green algae were counted by individual cells except Actinastrum, Coelastrum, and Pediastrum, which were recorded by each colony observed. Scenedesmus was counted by each cell packet. Diatoms were counted as one organism regardless of their grouping or connections. For flagellates, a colony of Dinobryon or a single cell of Ceratium was recorded as a unit.
Samples for zooplankton identification and enumeration were obtained from Lake Catherine station 1 and Channel Lake from surface, mid-depth, and deep locations. Samples were obtained on 4 occasions at 4-week intervals. A Juday sampler of 5-liter capacity, fabricated in ABS plastic pipe and fittings, was used to haul the required volume of sample from desired depths. The sampler was provided with a rubber stopper which could be released after the sample reached the desired depth. A 20-liter water sample was filtered through Wisconsin plankton net, and the material retained in the net was washed into a plastic container with deionized water and preserved in 95 percent ethanol.
In the laboratory, the volume of the sample was made up to 200 ml, and a 1-ml aliquot was pipetted into a Sedgwick-Rafter cell. A differential interference contrast microscope was used to identify and enumerate the zoo-planktons. Five short strips were counted and the results extrapolated.
Benthic samples were obtained on five occasions at approximately 4-week intervals starting May 22, 1979, from the two regular sampling stations
8

of Lake Catherine and Channel Lake and from the vicinity of the aerator. Also, two additional benthic sampling stations at depths of 18 to 20 feet and 12 to 15 feet were established in each of the two lakes. These two additional locations and the regular sampling location lie in an east-west transect passing through the regular stations.
Three grabs with an Ekman dredge (6 × 6 inches) were taken at each sampling location. These samples were then washed in a 30-mesh screen bucket, placed in quart jars, and preserved in 95 percent ethyl alcohol. In the laboratory, the samples were again washed in a 30-mesh sieve. The organisms were picked from the bottom detritus, identified and counted, and preserved in 70 percent ethyl alcohol.
Lake bottom sediment samples were also collected in conjunction with benthic samples from the two regular lake sampling stations and from the vicinity of the aerator. Water consistency (percent water) and percent fixed and volatile solids were determined. Consistency was determined by first decanting the supernate from the stored sediment sample and thoroughly mixing the sample. Loss of weight from the wet sample at 103°C overnight expressed as percent of original weight was taken as a measure of the consistency of the mud sample. The fixed and volatile solid fractions were determined according to the Standard Methods (APHA, 1976).
A thousand pounds of copper sulfate was applied on each of four occasions (June 21, July 5, August 2, and August 23, 1979) with the aid of the aerator. The amount of copper sulfate applied was based on a concentration of 1 mg/l for the top 2 feet of the lake volume. As the chemical was applied using the aerator, with the aid of the upwelling mixture of air and hypolimnetic water, the dosage was increased by 25 percent to allow for the dilution effect. Copper sulfate only was applied on June 21, 1979. For the subsequent three copper sulfate applications, citric acid in the ratio of 2 copper sulfate to 1 citric was used as a chelating agent. A slurry of copper sulfate and citric acid was prepared in 55 gallon drums using lake water, and this slurry was then applied with the aerator by immersing one of the air suction hoses in the slurry. Soon after completing the chemical applications, water samples were collected from seven locations in Lake Catherine (figure 4) in order to examine the distribution of copper in the lake. Water samples were also collected the following day at these seven locations.
Following the copper sulfate-citric acid applications on July 5 and August 2, 1979, 220 pounds of potassium permanganate were applied on July 11 and August 7, respectively. This was done primarily to oxidize the decaying algae after copper sulfate application and to avoid possible depression of dissolved oxygen concentration in the lake. Potassium permanganate also is known to have algicidal properties (Carr, 1975). As was done for copper sulfate applications, water samples were collected soon after and the day after application of potassium permanganate.
All pertinent data developed during the study are included in the appendix.
9
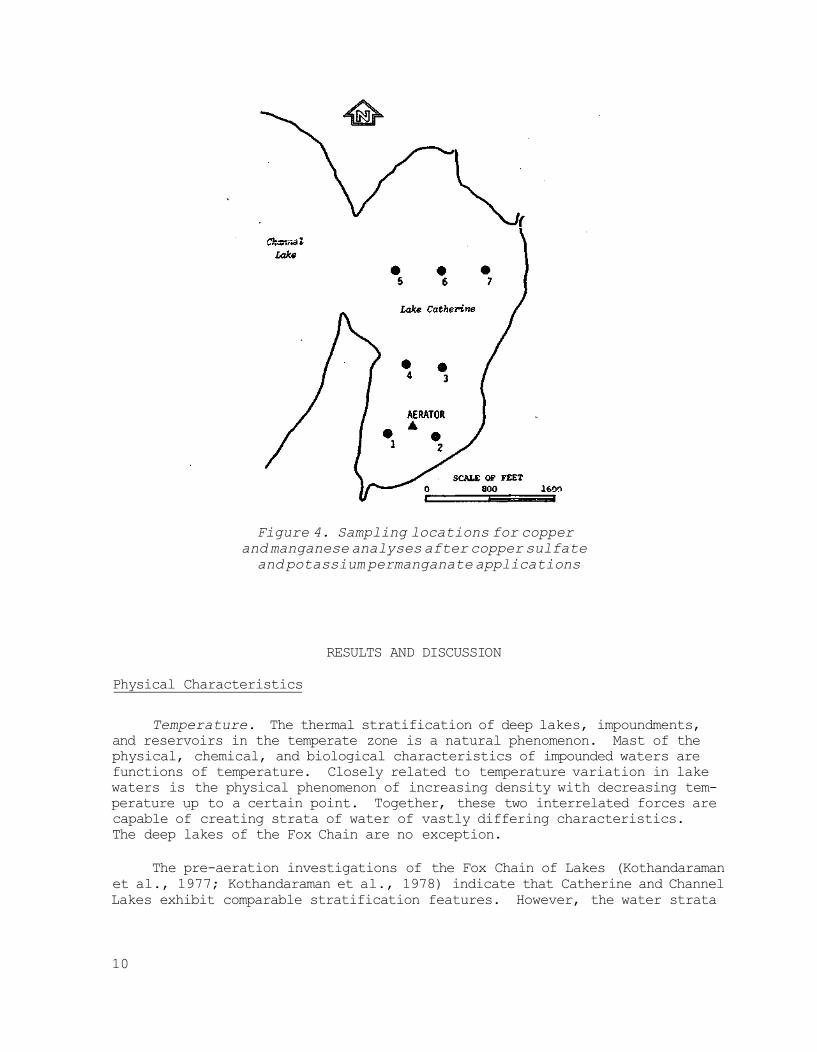
Figure 4. Sampling locations for copper and manganese analyses after copper sulfate and potassium permanganate applications
RESULTS AND DISCUSSION
Physical Characteristics
Temperature. The thermal stratification of deep lakes, impoundments, and reservoirs in the temperate zone is a natural phenomenon. Mast of the physical, chemical, and biological characteristics of impounded waters are functions of temperature. Closely related to temperature variation in lake waters is the physical phenomenon of increasing density with decreasing temperature up to a certain point. Together, these two interrelated forces are capable of creating strata of water of vastly differing characteristics. The deep lakes of the Fox Chain are no exception.
The pre-aeration investigations of the Fox Chain of Lakes (Kothandaraman et al., 1977; Kothandaraman et al., 1978) indicate that Catherine and Channel Lakes exhibit comparable stratification features. However, the water strata
10

Figure 5. Isothermal plots in °C for Lake Catherine station 2
of Lake Catherine are colder than those of Channel Lake at depths 15 feet below the water surface. During 1975 and 1977, surface water temperatures in these two lakes attained a maximum of about 27.5°C. The peak period of stratification occurred during July and August with the epilimnetic zones extended to 15 feet from the water surface in both lakes.
The isothermal plots for Lake Catherine near the aerator (station 2), at station 1, and for Channel Lake are shown, respectively, in figures 5, 6, and 7. The periods of aerator shutdown either because of power failure, control panel malfunctioning, or vandalism are marked in figures 5 and 6.
The results indicate that the aerator kept Lake Catherine destratified, whereas Channel Lake stratified with the epilimnetic zone extending to only 15 feet from surface during July and August. During the extended period of shutdown (July 14 to July 26, 1979) of the aerator, Lake Catherine exhibited a tendency to stratify again. However, when the aerator was restarted, the lake destratified soon after.
Selected vertical temperature profiles for the two lakes during 1979 are shown in figure 8. Prior to the start of aeration in Lake Catherine, water temperatures for the two lakes were similar to a depth of about 12 feet, below which waters of Lake Catherine were colder than for Channel Lake. With the start of aeration on May 10, 1979, water temperature in both the lakes became almost identical on May 22, 1979. Thereafter, the deeper waters of Lake Catherine became progressively warmer. The surface water temperatures
11

Figure 6. Isothermal plots in °C for Lake Catherine station 1
Figure 7. Isothermal plots in °C for Channel Lake
12

Figure 8. Temperature profiles in Lake Catherine station 1 and Channel Lake on selected dates
13
in Lake Catherine were only slightly cooler than the water temperatures in Channel Lake because of the mixing of cooler hypolimnetic waters with the epilimnetic waters in Lake Catherine. Both lakes were isothermal by October 4, 1979, when the aerator was shut off.
The temporal variations in the lake stability factor for Lake Catherine are shown in figure 9. Similar plots for the year 1978, representing the first year of operation of the aerator, and for the year 1977, representing the pre-aeration period, are also shown in the figure. Lake stability is defined as the energy of resistance which a lake offers to oppose the upset of density stratification. Symons (1969) has discussed in detail the procedure for computing the stability factor for lakes using vertical temperature profiles. The stability curves for 1978 and 1979 appear to be comparable from mid-July onward. The aerator began to perform adequately in 1978 only from July 6. Until that time, lake stability was much higher in 1978 than in 1979.
Dissolved Oxygen. Where the depth of an impoundment or a lake is considerable, the thermal stratification acts as an effective barrier for wind-induced mixing. The oxygen transfer to the deep waters is essentially confined to the molecular diffusion mechanism. As a result, when the benthic sediments exert a high demand, as is the case with eutrophic lakes, the oxygen resources of the hypolimnetic zone are quickly exhausted. Anoxic conditions prevail during most of the warm summer months.
Observations in 1975 and 1977 (Kothandaraman et al., 1977, 1978) of Lake Catherine and Channel Lake showed that the volume of the water column below the 15-foot depth was devoid of oxygen during summer stratification. July was the most critical month. Decomposition of algal silt in the pro-fundal regions of these deep lakes and the subsequent oxygen demand of the products of decomposition are major causes of oxygen depletion in the hypo-limnion. In-situ sediment oxygen demand determinations carried out in 1975 (Kothandaraman et al., 1977) indicated that a demand rate of about 16.5 g/m2/day prevailed in these two lakes. For comparison, sediment oxygen demand rates in Lake Meredosia and in the Illinois Waterway were on the order of 3.5 to 5.0 g/m2/day.
The effects of artificial destratification and aeration on the oxygen resources of Lake Catherine are shown in figures 10 and 11. Even though the aerator was started on May 10, 1979, and operated continuously for 2 months, with only a brief shutdown due to power failure, it is apparent that the oxygen demand exerted by lake sediments is much higher than the oxygen replenishment provided by aerator operation in the deeper layers. The anaerobic zone gradually extended upward. However, the rate of upward encroachment of the anoxic zone in Lake Catherine was very gradual and far less abrupt than that occurring in Channel Lake (figure 12).
Because of the extended period of shutdown of the aerator during the last half of July, the anoxic zone extended to about 14 feet from the surface. It was during this period of shutdown that the aerator was brought ashore, checked, and reinstalled at 28 feet (depth) as in 1978. Oxygen levels increased in the deeper waters (below 14 feet) with the resumption of aerator
14

Figure 9. Comparison of lake stabilities in Lake Catherine, May-October of 1977 and 1979
Figure 10. Isopleths of dissolved oxygen concentrations in mg/l
for Lake Catherine station 2
15

Figure 11. Isopleths of dissolved oxygen in mg/l for Lake Catherine station 1
Figure 12. Isopleths of dissolved oxygen in mg/l for Channel Lake
16

operation. Again, the onset of anaerobic conditions was pronounced when the breakdown of the aerator occurred (August 11-16) due to vandalism. Figures 10, 11, and 12 clearly demonstrate that the month of July is the most critical month for oxygen resources.
The upward mobility of the anoxic zone in Channel Lake during 1979 was abrupt and occurred in May. In contrast, during 1978 (Kothandaraman et al., 1979) it occurred more gradually in June. This is attributable to the water movement through the lake system. The differences in the hydrologic regimes to which the lake system was subjected can be gauged by referring to figure 13 which shows the hydrographs for the Fox River at Wilmot, Wisconsin. The Fox River experienced periodic pulses of floods during May through September 1978. The Fox River flow from June to mid-August of 1979 was much less compared with the previous year, and nearly uniform.
Selected dissolved oxygen profiles for Lake Catherine station 1 and Channel Lake for 1979 are shown in figure 14. The zone and the extent of oxygen resources supplemented by the aerator are indicated in figures 14b through 14j. Dissolved oxygen profiles in these lakes on July 17, 1979, were nearly identical. In Lake Catherine, oxygen levels at depths below 15 feet from the surface were reduced to zero just two days after the aerator system broke down on July 14, 1979. Up to that time at least 1 mg/l of dissolved oxygen was being maintained at the 25-30 foot depth.
Temporal variations in dissolved oxygen at different depths are shown in figure 15 for 1979 in Lake Catherine and Channel Lake. Though there is a perceptible improvement in oxygen concentrations at depths between 15 and 25 feet from the surface, it is not as pronounced as during the first year of operation of the aerator (Kothandaraman et al., 1979). This is most likely due to the breakdown in the aerator system during the critical period of operation, namely July 14 to July 26, 1979. Figure 16 shows the variations in percent DO saturations at different depths in Catherine and Channel lakes. These again are not as significant as for the earlier year.
Secchi Disc Transparency. Secchi disc transparency is a measure of the lake water clarity or its ability to allow light transmission. Among the lakes of the Fox Chain, Lake Catherine exhibited the highest secchi disc
Figure 13. Hydrograph for Fox River at Wilmot, Wisconsin
17

Figure 14. Dissolved oxygen concentration profiles in Lake Catherine station 1 and Channel Lake on selected dates
18

Figure 15. Temporal variations in dissolved oxygen concentrations in Lake Catherine station 1 and Channel Lake
readings (Kothandaraman et al., 1977). The minimum, mean, and maximum secchi disc readings observed in Lake Catherine during 1979 are, respectively, 27, 44, and 84 inches. The corresponding values for Channel Lake are 24, 36, and 81 inches. The temporal variations in secchi disc observations in these two lakes for the year 1979 are shown in figure 17. The days of chemical treatment in Lake Catherine to control algae are also noted on the figure. Secchi disc observations in Lake Catherine appear to increase after each copper sulfate application. These improvements in clarity could not be sustained for long because of the probable ingress of wind-swept algae from Channel Lake. Occurrences of this nature have masked the beneficial effects of controlling blue-green algae by copper sulfate in combination with aeration. Generally, the differences in lake transparencies of these two lakes observed during 1979 are not significantly different from those observed in the past.
19

Figure 16. Percent oxygen saturation concentrations at different depths in Lake Catherine station 1 and Channel Lake
Figure 17. Transparencies in Lake Catherine and Channel Lake
20
Biological Characteristics
Phytoplankton. One of the major objectives in the water quality management of the Fox Chain of Lakes is to control the proliferation of the problem causing blue-green algae. The total productivity of the lakes cannot be reduced by aeration alone until the nutrient input to them, both from external and internal sources, is controlled and reduced drastically. However, there are cases reported in the literature which suggest that one of the beneficial effects of aeration is the shifting of the dominant algal species from problem causing blue-greens to greens and diatoms, and in a few instances a decrease in the lake productivity (New England Regional Commission, 1971, 1973a, 1973b; Steichen et al., 1979; Symons, 1969).
The total algal counts and the species distribution of algae found at three different depths in each lake are shown in table 3. The temporal variations in the total algal densities in these two lakes are shown in figure 18. Algal densities at the surface and mid-depth in Lake Catherine are generally less than in Channel Lake. Observations made in these lakes during 1977 (Kothandaraman et al., 1978) as presented in table 4 indicate that the algal densities are generally comparable prior to aeration in Lake Catherine. The data presented for 1979 clearly indicate a reduction in total algal counts in Lake Catherine. This is not just due to the redistribution of algae throughout the water column. If that were the case, there would have been an increase in algal densities in the deeper water samples of Lake Catherine compared with those of Channel Lake. The increasing or decreasing trends in the algal densities in Lake Catherine very closely follow the trends in Channel Lake (figure 18). These trends in Lake Catherine sometimes go counter to the anticipated effects of copper sulfate application. Thus it can be concluded that the algal blooms in Channel Lake overwhelm the beneficial effects of aeration and chemical treatment in Lake Catherine. Nevertheless, there is a discernible trend in the decrease in algae (figure 18) and a decrease in the dominance of blue-green algae in Lake Catherine (figure 19).
Details of observations of plankton biomass and percent ash-free weights in the surface water samples of Catherine and Channel Lakes are shown in table 5. Until the early part of August, the biomass in Lake Catherine is comparable or much less than in Channel Lake, but the trend reverses later. The mean percent ash-free weight of the biomass in Lake Catherine was observed to be 39.3 as opposed to a value of 50.0 for Channel Lake. Similar analyses were not performed during the pre-aeration periods in these lakes, and consequently a comparison with earlier periods could not be made.
Table 6 shows the zooplankton data for Lake Catherine and Channel Lake. The species diversity in these two lakes appears similar. Total zooplankton counts in Lake Catherine were higher on two occasions and less on two occasions than in Channel Lake. No clear cut differences could be identified largely because of the location of sampling station 1 in Lake Catherine with respect to Channel Lake. No observation for phytoplankton or zooplankton was made near the aerator. Sport fishing activities around the aerator were very intense throughout the season, and fishing was reported to be good. It
21

T a b l e 3 . A l g a l Types and D e n s i t i e s f o r Lake C a t h e r i n e S t a t i o n 1 and Channel L a k e , 1979 ( D e n s i t y i n c o u n t s p e r m i l l i l i t e r )
Dates Surface Mid-depth Deep BG G D F 0 T BG G D F 0 T BG G D F 0 T
Lake Catherine Station 1
5/9 0 40 2040 0 0 2080 0 70 2680 0 0 2750 0 0 1690 0 0 1690 5/22 0 0 2010 330 0 2340 0 0 1770 170 0 1940 0 0 1500 30 0 1530 6/5 650 1340 0 170 0 2170 1350 270 90 0 0 1710 1060 140 0 0 0 1200 6/21 4750 230 70 250 0 5300 2060 120 300 180 0 2660 0 10 10 0 0 20 7/2 6110 170 60 0 0 6340 2180 90 70 240 0 2580 60 40 20 0 0 120 7/11 4570 120 200 0 0 4890 2710 20 20 0 0 2750 90 0 30 0 0 120 7/17 4330 40 0 210 0 4580 3160 0 50 190 0 3300 130 0 50 0 0 180 8/1 3090 0 430 300 0 3820 1120 0 80 330 0 1530 40 0 30 0 0 70 8/16 4170 40 510 1060 0 5780 2160 0 0 0 0 2160 70 0 20 0 0 90 8/23 4080 0 1300 1470 0 6850 2160 0 0 0 0 2160 60 0 10 10 0 80 8/29 150 0 1350 0 0 1500 0 80 340 0 0 420 10 0 20 0 0 30 9/5 1710 0 1560 0 0 3270 900 0 770 0 0 1670 30 10 100 0 0 140 9/20 290 0 30 190 0 510 0 120 50 70 0 240 0 10 10 10 0 30 10/4 340 10 0 650 0 1000 170 0 40 230 0 440 0 0 20 20 0 40
Channel Lake 5/9 0 0 1290 0 0 1290 0 0 1490 0 0 1490 50 20 1810 10 0 1890 5/22 0 0 1340 0 0 1340 0 0 1490 30 0 1520 0 0 1660 0 0 1660 6/5 220 340 50 290 0 900 400 360 0 0 0 760 370 10 0 0 0 380 6/21 5100 0 70 170 0 5340 2400 0 10 80 0 2490 10 0 0 20 0 30 7/2 7960 0 140 0 0 8100 2730 180 0 0 0 2910 40 0 50 10 0 100 7/11 3270 0 290 60 0 3620 2520 0 0 330 0 2850 170 0 30 40 0 240 7/17 6070 0 0 270 0 6340 3800 190 0 490 0 4480 160 0 10 60 0 230 8/1 4840 140 80 480 0 5540 3020 0 0 560 0 3580 200 0 20 40 0 260 8/16 5930 0 0 350 0 6280 810 0 120 460 0 1390 170 0 0 10 0 180 8/23 8960 0 0 810 0 9770 3610 0 210 740 60 4620 760 0 70 110 0 940 8/29 5170 0 0 1710 0 6880 2350 0 280 130 0 2760 130 0 0 20 0 150 9/5 4260 80 220 1380 0 5940 2540 0 30 870 0 3440 190 0 0 0 0 190 9/20 830 0 130 980 0 1940 270 0 0 390 0 660 30 0 10 30 0 70 10/4 1300 70 0 820 0 2190 670 0 60 380 0 1110 50 0 0 40 0 90
Note: BG = Blue Greens; G = Greens; D = Diatoms; F = F l a g e l l a t e s ; 0 = Other ; and T = Tota l

Table 4. Total Surface Algal Densities (counts/ml) in Lake Catherine and Channel Lake during 1977
Dates Lake Catherine Channel Lake 5/6 2570 980 5/23 3090 2790 5/31 2290 3500 6/6 570 780 6/13 3100 3340 6/20 6110 3690 6/27 3140 3590 7/5 3030 740 7/11 2790 2690 7/18 2180 1900 7/26 2940 8/1 4180 3670 8/8 2590 2410 8/17 3410 800 8/22 4880 5190 8/30 620 820 9/6 700 200
Figure 18. Total algal densities in Lake Catherine station 1 and Channel Lake
is presumed that, in addition to higher oxygen levels in the vicinity of the aerator, fish food organisms would have been adequate. Zooplankton form an important and significant link in the food chain.
23

Figure 19. Relative dominance of blue-green algae in Lake Catherine and Channel Lake
Table 5. Plankton Biomass in Cather ine and Channel Lakes, Surface Samples
Lake Catherine Date Plankton Percent 1979 biomass, mg/l ash-free weight
Channel Lake Plankton Percent
biomass, mg/l ash-free weight 5/22 0.795 39.6 6/5 0.820 48.8 6/21 1.675 40.6 7/2 1.355 30.3 7/17 1.180 36.9 8/1 1.100 35.0 8/22 1.905 37.8 9/5 1.315 39.9 9/20 3.365 50.5 10/4 2.660 33.5
0.735 38.8 1.085 44.2 1.695 41.0 2.830 52.5 2.555 36.6 1.200 45.4 1.040 55.2 2.850 77.7 2.090 72.2 2.190 36.3
24

Table 6. Zooplanktons in Lake Cather ine and Channel Lake, c o u n t s / l i t e r
Lake Catherine, station 1 Bosmina langirostris 250 Ceriodaphnia lacustris Cyclops verndlis Daphnia dubia D. longiremis 850 300 D. longi8pina D. pulex Diaptomus pallidus 150 D. sp. Senecella calanoides
Total 1100 450 Channel Lake station Bosmina langirostris 50 300 Ceriodaphnia lacustris Cyclops vernalis Daphnia dubia 50 D. longiremis D. longispina D. pulex Diaptomus pallidus 150 250 D. sp. Seneaella calanoides
Total 250 550
6/21/79 7/17/79 8/22/79 9/19/79 Sur- Mid- Sur- Mid- Sur- Mid- Sur- Mid-face depth Deep face depth Deep face depth Deep face depth Deep
350 100 450 300 150 200 150
150 400 300 200
200
150 150 100 250
150 300 350 250 1200 450 300 400 200 0
450 100 200 100 400 100 300
200 150 50 250 150
450 300 200 150 50
50 500 300
350 700 150 150 750 650 350 700 550 100

Figure 20. Large-sized Chironomus (center) found in Lake Catherine
compared with normal size
Benthic Macroinvertebrates. The population of the benthic macroinvertebrate communities in sediments from the two lakes is given in table 7. The benthic population in Lake Catherine was found to be composed of 58 percent Chaoborus, 37 percent Chironomidae, 4 percent Hyalella, and 1 percent Ceratopogonidae. In Channel Lake the benthos consisted of 94 percent Chao-borus and 6 percent Chironomidae. Hyalella and Ceratopogonidae were found only in Lake Catherine.
The well-oxygenated, shallow stations (A stations) in both lakes were characteristically dominated by the Chironomidae and the deep, nearly anoxic stations (C stations) were dominated by Chaoborus. The majority of the samples at the 8 stations were dominated by Chironomidae in Lake Catherine and Chaoborus in Channel Lake.
The overall average number of benthic organisms in Lake Catherine and Channel Lake was 608 and 904 per square meter, respectively. A more complex macroinvertebrate benthic community with a healthier proportion of Chironomidae was found in Lake Catherine. Several extremely large Chironomus individuals (figure 20) were found in Lake Catherine samples, particularly near the aerator. Only one such individual was found in all the samples from Channel Lake. Increased dissolved oxygen concentration, increased water temperatures in the hypolimnetic zone of Lake Catherine, and other altered environmental factors caused by aeration might have been responsible for the very large growth of the Chironomus organisms.
26

T a b l e 7 . B e n t h i c M a c r o i n v e r t e b r a t e s Found i n Lake C a t h e r i n e and Channe l L a k e , c o u n t s / m e t e r 2
5/22/79 6/22/79 7/18/79 8/22/79 9/19/79 Aer_ Aer_ Aer_ Aer_ Aer_
A B C ator A B C ator A B C ator A B C ator A B C ator
Lake Catherine DO n e a r bo t tom 6 .9 4 . 3 1.0 0 .8 7.9 6.9 0 . 1 0 . 1 7.9 0 .2 0 . 1 0 . 1 5.2 4 . 2 0 . 2 1.6 6 .9 7 .1 6 .0 8 .1 Depth ( f t ) 15 25 34 32 15 20 38 34 11 20 34. 32 10 20 38 26 12 18 36 26
Organism Chironomidae 86 14 29 115 1263 1335 14 301 459 72 72 72 72 287 14 43 Chaoborus 545 1636 402 344 617 459 388 29 43 316 689 2440 1234 Ceratopogonidae 29 14 Hyalella 43 14 43 273 14 57
T o t a l organisms 86 559 1665 517 1306 1349 344 631 344 459 531 460 374 115 316 1005 28 57 2440 1291
Channel Lake DO nea r bot tom 6.1 2 .2 0 .2 NS NS 0 .1 7.2 0 . 1 0 . 1 5.6 2 .5 0.2 NS 6.6 0 .3 Depth ( f t ) 15 25 34 34 12 20 34 12 18 36 18 34
Organism Chironomidae 388 43 29 14 14 72 29 14 Chaoborus 1005 3043 804 29 703 86 43 919 14 3602 T o t a l organisms 388 1048 3072 804 14 43 703 158 72 919 28 3602
Note: Sampling l o c a t i o n s A, B, C in each l a k e l i e on an e a s t - w e s t t r a n s e c t through t h e r e g u l a r sampling s t a t i o n NS = No Sample
Chemical Characteristics
The thermal stratification occurring in deep lakes and impoundments creates generally three distinct zones with widely differing physical, chemical, and biological characteristics. In the epilimnetic zone, the water is of chemical quality comparable to other surface waters in the area. On the other hand, the waters of the hypolimnetic zone deteriorate in quality after thermal stratification is established. The concentrations of reduced sub-stances like iron (Fe++), manganese (Mn++), ammonia, hydrogen sulfide, and other micronutrients like phosphorus, silica, etc., increase in the oxygen-deprived layers of the impounded waters.
The temporal variations in the chemical parameters monitored for Lake Catherine and Channel Lake at three different water depths are shown in figures 21 through 23.
Figure 21 indicates that the surface water chemical characteristics of the two lakes are very similar, particularly with respect to pH, sulfate, chlorine demand, total and dissolved phosphorus, ammonia-N, nitrate-N, and total iron. The overall mean and range of values (table 8) are alike except for silica, which is more than double in Channel Lake compared with Lake Catherine. Similar observations hold true for mid-depth water samples (figure 22).
However, the deep water samples of these two lakes are distinctly different as evidenced by figure 23 and table 8. Products of decomposition like alkalinity, silica, ammonia-N, and total and dissolved phosphorus were much lower in Lake Catherine than in Channel Lake. By the same token, chemical constituents of higher oxidative status like sulfate and nitrate were higher in Lake Catherine. Chlorine demand values of Channel Lake samples were also higher than the values for Lake Catherine.
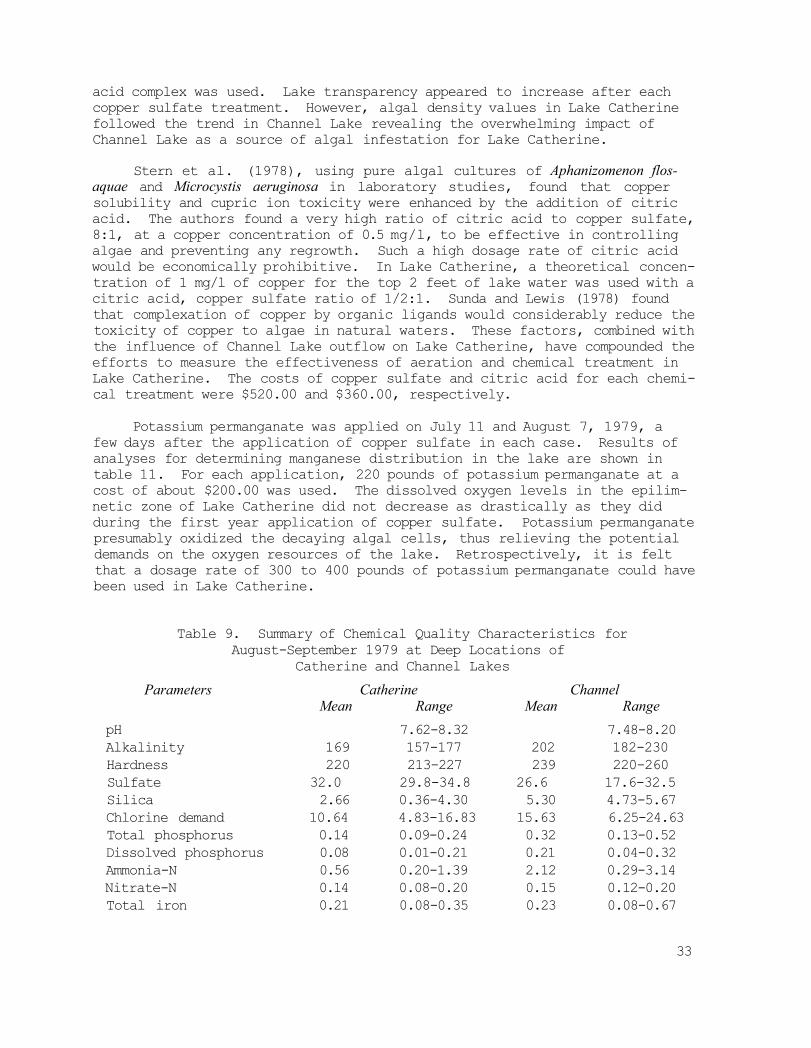
It was mentioned earlier that the aerator was shut down (because of equipment failure) during the critical period of aeration, namely, from July 14 to July 26, 1979. If the chemical quality observations at the deep locations of these two lakes are considered for the period of August through September, immediately after the resumption of aeration after the prolonged shutdown, the results are more convincing. A summary of the chemical quality characteristics for this period is given in table 9. The releases of phosphorus, nitrogen, and silica from bottom sediments were all reduced by half or more in Lake Catherine. Chlorine demand, which is a measure of the oxygen demand potential, had also been significantly reduced in Lake Catherine due to aeration.
Chemical Treatment. Copper sulfate was applied to Lake Catherine on four separate occasions during June through August 1979. The very first lake chemical treatment on June 21, 1979, was only with copper sulfate, whereas for the remaining three applications, copper sulfate was chelated with citric acid prior to lake application. Results of copper analyses are shown in table 10. Copper concentrations in the lake water samples were much higher, and copper in solution persisted much longer when the copper sulfate-citric
28

Figure 21. Chemical quality characteristics at the surface of Lake Catherine station 1 and Channel Lake
29

Figure 22. Chemical quality characteristics at mid-depth of Lake Catherine station 1 and Channel Lake
30

Figure 23. Chemical quality characteristics at deep location of Lake Catherine station 1 and Channel Lake
31

T a b l e 8 . Summary of Water Q u a l i t y C h a r a c t e r i s t i c s f o r Lake C a t h e r i n e and Channel Lake ( C o n c e n t r a t i o n s i n m i l l i g r a m s p e r l i t e r )
pH Alkalinity Hardness Sulfate Silica Range Mean Range Mean Range Mean Range Mean Range
1979 Catherine
Surface 8.10-8.67 174 144-185 230 213-247 33.6 30.4-38.4 1.14 0.13-2.86 Mid-depth 8.03-8.47 176 161-186 231 217-240 33.4 30.7-37.8 1.32 0.26-3.26 Deep 7.63-8.32 179 157-194 228 213-240 33.0 29.8-37.4 2.17 0.36-4.30
Channel Surface 8.15-8.79 175 160-186 227 211-240 38.2 28 .0-37 .8 2.47 0.07-4.55 Mid-depth 7.82-8.48 174 162-185 226 188-239 33.9 30.4-38.6 2.53 0 .03-4.61 Deep 7.46-8.28 195 177-230 235 220-260 30.3 17.6-36.0 3.63 1.11-5.67
Chlorine demand T. Phosphorus D. Phosphorus Mean Range Mean Range Mean Range
Catherine Surface 5.35 3.30-6.78 0.06 0.04-0.08 0.02 0 .01-0 .03 Mid-depth 5.51 3.90-7.18 0.06 0.03-0.09 0.02 0 .02-0 .03 Deep 10.15 4 .6-16 .83 0.15 0 .08-0 .28 0.11 0.01-0.27
Channel Surface 5.66 3.10-9.21 0.06 0.04-0.10 0.02 0.01-0.04 Mid-depth 5.63 3.80-7.76 0.06 0 .04-0.09 0.02 0 .00-0 .05 Deep 11.71 4 .88-24.63 0.26 0.12-0.52 0.17 0.01-0.32
Ammonia-N Nitrate-N Total iron Mean Range Mean Range Mean Range
Catherine Surface 0.13 0.01-0.21 0.22 0 .11-0.43 0.12 0.04-0.42 Mid-depth 0.19 0 .10-0.33 0.21 0.08-0.55 0.13 0 .06-0.43 Deep 0.75 0.20-1.85 0.24 0.08-0.64 0.20 0 .08-0.53
Channel Surface 0.16 0.10-0.27 0.21 0.09-0.42 0.09 0 .03-0 .13 Mid-depth 0.14 0.00-0.29 0.20 0.09-0.54 0.10 0 .02-0 .21 Deep 1.52 0.29-3.14 0.18 0.09-0.44 0.35 0.08-2.00
acid complex was used. Lake transparency appeared to increase after each copper sulfate treatment. However, algal density values in Lake Catherine followed the trend in Channel Lake revealing the overwhelming impact of Channel Lake as a source of algal infestation for Lake Catherine.
Stern et al. (1978), using pure algal cultures of Aphanizomenon flos-aquae and Microcystis aeruginosa in laboratory studies, found that copper solubility and cupric ion toxicity were enhanced by the addition of citric acid. The authors found a very high ratio of citric acid to copper sulfate, 8:1, at a copper concentration of 0.5 mg/l, to be effective in controlling algae and preventing any regrowth. Such a high dosage rate of citric acid would be economically prohibitive. In Lake Catherine, a theoretical concentration of 1 mg/l of copper for the top 2 feet of lake water was used with a citric acid, copper sulfate ratio of 1/2:1. Sunda and Lewis (1978) found that complexation of copper by organic ligands would considerably reduce the toxicity of copper to algae in natural waters. These factors, combined with the influence of Channel Lake outflow on Lake Catherine, have compounded the efforts to measure the effectiveness of aeration and chemical treatment in Lake Catherine. The costs of copper sulfate and citric acid for each chemical treatment were $520.00 and $360.00, respectively.
Potassium permanganate was applied on July 11 and August 7, 1979, a few days after the application of copper sulfate in each case. Results of analyses for determining manganese distribution in the lake are shown in table 11. For each application, 220 pounds of potassium permanganate at a cost of about $200.00 was used. The dissolved oxygen levels in the epilim-netic zone of Lake Catherine did not decrease as drastically as they did during the first year application of copper sulfate. Potassium permanganate presumably oxidized the decaying algal cells, thus relieving the potential demands on the oxygen resources of the lake. Retrospectively, it is felt that a dosage rate of 300 to 400 pounds of potassium permanganate could have been used in Lake Catherine.
Table 9. Summary of Chemical Quality Characteristics for August-September 1979 at Deep Locations of
Catherine and Channel Lakes Parameters Catherine Channel
Mean Range Mean Range pH 7.62-8.32 7.48-8.20 Alkalinity 169 157-177 202 182-230 Hardness 220 213-227 239 220-260 Sulfate 32.0 29.8-34.8 26.6 17.6-32.5 Silica 2.66 0.36-4.30 5.30 4.73-5.67 Chlorine demand 10.64 4.83-16.83 15.63 6.25-24.63 Total phosphorus 0.14 0.09-0.24 0.32 0.13-0.52 Dissolved phosphorus 0.08 0.01-0.21 0.21 0.04-0.32 Ammonia-N 0.56 0.20-1.39 2.12 0.29-3.14 Nitrate-N 0.14 0.08-0.20 0.15 0.12-0.20 Total iron 0.21 0.08-0.35 0.23 0.08-0.67
33

Table 10. Copper Concentrations in Lake Catherine (Concentrations in milligram per liter)
Locations 6/21/79* 6/22/79 7/5/79* 7/6/79 7/11/79 1A 0.08 C.03 0.82 0.11 0.03 1B 0.23 0.08 0.07 0.15 0.07 2A 0.08 0.02 0.02 0.13 0.03 2B 0.29 0.03 0.11 0.15 0.05 3A 0.00 0.02 0.28 0.10 0.02 3B 0.25 0.03 0.07 0.19 0.02 4A 0.00 0.03 0.04 0.02 0.02 4B 0.02 0.02 0.12 0.15 0.05 5A 0.00 0.00 0.02 0.07 0.02 5B 0.10 0.02 0.07 0.07 0.02 6A 0.02 0.02 0.06 0.03 0.00 6B 0.04 0.02 0.07 0.07 0.06 7A 0.00 0.00 0.09 0.15 0.02 7B 0.04 0.02 0.09 0.10 0.05
8/2/79* 8/3/79 8/7/79 8/23/79* 8/24/79 1A 0.23 0.10 0.04 0.07 0.08 1B 0.29 0.12 0.22 0.09 2A 0.16 0.09 0.01 0.03 2B 0.26 0.11 0.05 0.21 0.12 3A 0.06 0.07 0.02 0.08 0.02 3B 0.80 0.07 0.14 0.10 0.08 4A 0.02 0.00 0.01 0.02 0.07 4B 0.12 0.11 0.07 0.06 5A 0.03 0.01 0.02 0.02 0.02 5B 0.22 0.06 0.09 0.10 0.10 6A 0.00 0.02 0.02 0.02 0.02 6B 0.12 0.05 0.09 0.08 0.08 7A 0.01 0.04 0.03 0.06 0.02 7B 0.06 0.05 0.06 0.04 0.13
Note: 1A = surface sample at station 1 1B = sample at 5 feet depth in station 1 and so on * = date of copper sulfate application
Sediment Characteristics. The results of sediment analysis are shown in table 12. The water content of the sediments taken from Lake Catherine was less than for samples from Channel Lake. Volatile organic solids were also less in Lake Catherine. Comparison of the values for Lake Catherine stations 1 and 2 confirms that the degree of sediment stabilization is slightly higher near the vicinity of the aerator (station 2) than at station 1, which is located in the deepest part of the lake. There appears to be a definite trend in the stabilization of the bottom sediments in Lake Catherine as a result of the aeration-destratification of the lake.
34

Table 11. Manganese Concentrations in Lake Catherine (Concentrations in milligrams per liter)
Locations 7/11/79* 7/12/79 8/7/79* 8/8/79 1A 0.11 0.03 0.04 0.03 1B 0.06 0.07 0.06 0.06 2A 0.04 0.04 0.05 0.05 2B 0.04 0.04 0.04 0.05 3A 0.03 0.04 0.05 0.05 3B 0.08 0.03 0.05 0.06 4A 0.03 0.01 0.03 0.05 4B 0.11 0.07 0.03 0.04 5A 0.01 0.03 0.04 0.03 5B 0.03 0.03 0.04 0.01 6A 0.01 0.01 0.04 0.04 6B 0.01 0.03 0.04 0.02 7A 0.01 0.01 0.04 0.08 7B 0.01 0.03 0.04 0.04
Note: 1A = surface sample at station 1 1B = sample at 5 feet depth in station 1 and so on * = date of potassium permanganate application
Table 12. Bottom Sediments Composition for Lake Catherine and Channel Lake
(Composition in percent) Date Water Volatile Fixed 1979 Location content solids solids 5/22 Catherine station 1 77.0 11.2 88.8
Catherine station 2 73.9 12.0 88.0 Channel 80.9 15.1 84.9
6/25 Catherine station 1 77.2 11.2 88.8 Catherine station 2 75.5 10.7 89.3 Channel 80.0 14.3 85.7
7/18 Catherine station 1 77.1 9.2 90.8 Catherine station 2 73.4 9.8 90.2 Channel 80.2 13.5 86.5
8/22 Catherine station 1 77.6 11.7 88.3 Catherine station 2 60.0 9.9 90.1 Channel 77.4 13.9 86.1
9/19 Catherine station 1 76.1 9.8 90.2 Catherine station 2 69.9 8.3 91.7 Channel 80.4 12.3 87.7
35

SUMMARY
The aeration-destratification of Lake Catherine was continued for the second year during 1979. The aerator was reinstalled at a depth of 34 feet and the operation was started on May 10, 1979. The aerator was able to de-stratify to a depth of 32 feet. However, the oxygen demand of the bottom sediments was much higher than the rate of oxygen replenishment by the aerator. Consequently, the anaerobic zone in Lake Catherine progressed upward, gradually. In contrast, the anaerobic zone in Channel Lake expanded abruptly during mid-June.
Because of an extended period of aerator shutdown during July 14 to July 26, 1979, stratification in Lake Catherine, especially dissolved oxygen depletion, became as intense as in Channel Lake. Dissolved oxygen conditions recovered in the deeper waters of Lake Catherine after the aerator system was repaired and restarted.
The temperature regime of Lake Catherine waters produced by the mixing conditions created by the aerator was more stable and thus less subject to deterioration during downtime of the aeration unit. Generally the influence of the aerator was limited to about 18 feet below the water surface. As shown in figure 24, the water temperature differences between the two lakes magnified with increasing water depth. Earlier measurements (1977) in Lake Cath-
Figure 24. Temporal variations in water temperatures in Lake Catherine station 1 and Channel Lake
at three water depths
36

erine showed that water temperatures at the 30 foot depth during summer stratification varied from 10.6° to 12.2°C. During most of the summer of 1979, the water temperature at the 30 foot water depth was equal to 20°C or greater. The significant increase in the heat budget of lower strata waters, as shown in figure 24, reflects the mixing capability of the aeration. However, this increase in bottom water temperatures probably stimulated increased biological activity at the lake bottom leading to demand for dissolved oxygen in excess of the aeration's capability to furnish it. Thus during aeration unit downtime, the stability of the thermal regime most likely contributed to the instability of the dissolved oxygen regime.
Chemical control of algae using copper sulfate was tried on four occasions during the second year of aerator operation. Except during the first application, copper sulfate was chelated with citric acid prior to lake application. Copper sulfate in the amount of 1000 pounds and citric acid of 500 pounds were used for each treatment. Higher concentrations of copper ions were detected in the lake and for a longer duration when copper sulfate was chelated with citric acid than when copper sulfate was applied without the chelating agent. Shortly after the second and third applications of copper sulfate, 220 pounds of potassium permanganate were applied to the lake, mainly to oxidize the decaying algal matter after copper sulfate treatment, thereby reducing the demand on oxygen resources of the lake.
Secchi disc readings improved significantly after each copper sulfate application but decreased after a week or 10 days. Though the algal densities were smaller in Lake Catherine than in Channel Lake, the temporal variations in total algal counts in Lake Catherine closely paralleled those in Channel Lake. In spite of the overwhelming influence of Channel Lake on Lake Catherine, a shift in the dominance of blue-green algae to greens and diatoms was detected in Lake Catherine.
A significant increase in the number of taxa was found in the benthic macroinvertebrate community in Lake Catherine. Several very large Chironomus were found in Lake Catherine which were never found in the lake in the previous three years of monitoring.
There was a significant change in chemical quality characteristics of the deep waters in Lake Catherine. Concentrations of the products of anaerobic decomposition of lake bottom sediments like ammonia, phosphorus, silica, etc. were markedly less in Lake Catherine than in the control lake.
In general, the aeration system demonstrated its capability to destrat-ify the thermal regime and induce oxygenation of Lake Catherine waters down to its location level. Aeration in combination with chemical treatment of Lake Catherine is an effective means of controlling blue-green algae and improving the fish habitat. There is evidence also that increased water temperatures and allied dissolved oxygen have stabilized to some degree the organic content of the bottom sediments.
37

ACKNOWLEDGMENTS
The investigation of the Fox Chain of Lakes reported herein, as well as the investigations carried out in 1975, 1977, and 1978, was sponsored and funded by the Illinois Institute for Environmental Quality, which is now a part of the Illinois Institute of Natural Resources.
The work was carried out under the general supervision of Dr. William C. Ackermann, Chief Emeritus, State Water Survey. Many Water Survey personnel contributed to the successful completion of this particular segment of the Fox Chain of Lakes investigation. Special mention must be made of Davis Beuscher for his competent scuba diving efforts. Others who assisted in the field operations were Thomas Hill, Scott Bell, Paula Reed, and Laurie Hebel. David Hullinger, Dana Shackleford, and Curtis Pulliam performed chemical analyses; Davis Beuscher performed the algal identification and enumeration; and Thomas Hill and Scott Bell identified the benthic organisms. Ms. Linda Johnson typed the initial draft. Illustrations were prepared by the Graphic Arts Section under the supervision of John W. Brother, Jr. Editorial assistance was provided by J. Loreena Ivens and Tony Fitzpatrick.
Mr. Robert Palm, owner-operator of Bob's Marina, was very generous in providing space for storing chemicals and loaning a raft and crane-mounted barge needed in the operation and maintenance of the aeration system. His whole-hearted assistance is gratefully acknowledged.
REFERENCES
American Public Health Association, American Water Works Association, and Water Pollution Control Federation. 1976. Standard methods for the examination of water and wastewater. American Public Health Association, 1015 Eighteenth Street NW, Washington D.C. 20036, 1193 p., 14th edition.
Carr, Jerome B. 1975. Prevention of blue-green algae blooms—field verification—Morses Pond, Wellesley, Massachusetts. Carr Research Laboratory, Inc., 17 Waban Street, Wellesley, Massachusetts 02181, 7 p.
Dunst, Russell C, S. M. Born, Paul Uttormark, S. A. Smith, Stanley Nichols, James Peterson, Douglas R. Knauer, Steven Serns, Donald Winter, and Tom Wirth. 1974. Survey of lake rehabilitation techniques and experiences. Department of Natural Resources Technical Bulletin No. 75, Madison, Wisconsin, 179 p.
Kothandaraman, V., Ralph L. Evans, Nani G. Bhowmik, John B. Stall, David L. Gross, Jerry A. Lineback, and Gary B. Dreher. 1977. Fox Chain of Lakes investigation and water quality management plan. Illinois State Water Survey and Illinois Geological Survey, Cooperative Resources Report 5, 200 p.
Kothandaraman, V., Donald Roseboom, and Ralph L. Evans. 1978. Pilot lake
38

restoration investigations in the Fox Chain of Lakes. Illinois State Water Survey Contract Report 198, 44 p.
Kothandaraman, V., D. Roseboom, and R. L. Evans. 1979. Pilot lake restoration investigations—aeration and destratification in Lake Catherine. Illinois State Water Survey Contract Report 212, 54 p.
New England Regional Commission. 1971. Algae control by mixing. Boston, Massachusetts, 103 p.
New England Regional Commission. 1973a. Algae control by mixing. Boston, Massachusetts, 131 p.
New England Regional Commission. 1973b. Algae control by mixing. Boston, Massachusetts, 103 p.
Steichen, James M., J. E. Garton, and C. E. Rice. 1979. The effect of lake destratifioation on water quality. American Water Works Association Journal, April, v. 71(4):219-225.
Stern, Michele S., D. H. Stern, and L. L. Ray. 1978. Citric acid enhancement of copper sulfate toxicity to blue-green algae and other nuisance organisms. Department of Biology, University of Missouri—Kansas City, 84 p.
Sunda, William G., and JoAnn M. Lewis. 1978. Effect of complexation by natural organic ligands on the toxicity of copper to unicellular alga, Monochrysis lutheri. Limnology and Oceanography, v. 23(5):870-876.
Symons, James M. 1969. Water quality behavior in reservoirs. Public Health Service, U.S. Department of Health, Education, and Welfare, Cincinnati, Ohio 45213, 616 p.
U.S. Environmental Protection Agency. 1973. Measures for the restoration and enhancement of freshwater lakes. Washington D.C., 238 p.
39

Appendix A. Channel Lake S t a t i o n Depth 5/9/79 5/22/79 6/5/79 6/21/79 6/27/79 7/2/79 7/11/79 7/12/79 7/17/79
DO Temp DO Temp DO Temp DO Temp DO Temp DO Temp DO Temp DO Temp DO Temp 0 10 .6 15.4 6.9 18 .0 9.0 20 .6 8.4 22 .0 12 .8 23.2 1 0 . 8 24 .0 11.4 26.2 11.4 26 .0 7.8 24 .8 2 1 0 . 6 15.4 6.7 18 .0 9.0 20.5 8.4 22 .0 12 .8 23 .0 11 .8 24 .0 1 1 . 6 26.2 ].0.6 25 .8 7.8 24 .8 4 10 .6 15.4 6.7 1 7 . 8 9.0 20.5 8.2 22 .0 12.6 22 .8 10.4 22 .8 11 .8 26 .0 10 .1 25.6 7.8 24 .8 6 10 .7 15.4 6.6 17 .8 9 .0 20 .5 8.1 22 .0 9.7 21 .8 9 .1 22.4 11 .8 26 .0 5 .3 24.5 7.6 24 .8 8 10 .8 15 .2 6 .6 1 7 . 8 9 .0 20 .5 7 .9 22 .0 9.7 21 .7 8 .3 22.2 4 . 1 23.0 3.2 23.4 7 .5 24.6
10 10.8 1 5 . 1 6 .6 1 7 . 8 9.0 20 .5 7 .8 22 .0 9.6 21.5 8 .3 2 2 . 1 2 . 1 22.0 0 .3 22 .6 7 .5 24 .6 12 10 .8 1 5 . 0 6.6 1 7 . 8 9.0 20.4 7.8 22 .0 7.6 21 .2 7 .6 22 .0 1.4 21 .8 0.2 21 .8 7.2 24 .6 14 10 .7 1 5 . 0 6 .1 17 .2 7.5 1 9 . 1 7.8 22 .0 7.2 21 .0 6.7 22 .0 0 .1 21.6 0 . 1 21 .5 0 .6 22 .0 16 10 .7 1 4 . 9 6 .1 17 .0 5.2 1 7 . 1 7.7 22 .0 5.6 20.8 4 . 6 21 .8 0 .1 21.2 0 . 1 21.0 0.2 21 .3 18 10 .7 1 4 . 8 5 .3 16 .8 4 . 6 16 .5 7.5 2 1 . 9 2 . 9 19 .9 3.2 21 .0 0 .1 20.6 0 .1 20.7 0 .1 20 .9 20 10.7 14 .7 5 .3 16 .2 3 .8 15 .7 6 .0 21 .0 0.4 18 .8 2 . 1 21 .0 0 .1 20 .0 0 .1 19 .9 0 .1 20 .1 22 10 .7 14 .7 5 .3 16 .0 3 .3 15 .2 0 . 8 18 .0 0.2 17 .8 0.4 1 9 . 8 0 .1 1 7 . 9 0 . 1 18 .0 0 . 1 1 9 . 2 24 10 .7 1 3 . 6 2 .9 15 .0 2 .5 1 5 . 0 0 .6 16 .2 0 .1 1 6 . 0 0.2 1 8 . 1 0 .1 16 .9 0 . 1 17 .2 0 .1 18 .8 26 10 .7 1 2 . 9 1.5 13 .8 1.7 1 4 . 8 0.2 15.4 0 .1 14 .8 0 .1 1 7 . 1 0 .1 16 .0 0 .1 1 5 . 5 0 . 1 17 .2 28 1 0 . 9 12 .8 0 .8 1 3 . 0 0 .5 1 4 . 5 0 .1 14 .9 0 .1 14 .0 0 . 1 15 .0 0 .1 1 4 . 1 0 .1 14.4 0 . 1 1 5 . 5 30 10 .8 1 2 . 5 0.4 12 .2 0 .1 1 4 . 3 0 . 1 1 4 . 9 0 .1 1 3 . 8 0 . 1 1 4 . 3 0 . 1 13 .4 0 . 1 13 .9 0 . 1 1 4 . 5 32 10 .8 11 .2 0 .3 11 .0 <0.1 1 4 . 1 0 . 1 1 3 . 8 0 .1 13.4 0 . 1 1 3 . 8 0 .1 1 3 . 2 0 . 1 13 .5 0 . 1 1 4 . 0 34 8.2 10 .2 0.2 1 1 . 0 <0.1 1 4 . 0 0 .1 13 .5 0 .1 13 .2 0 .1 13 .2 0 . 1 13 .5 36 5 .6 9 .0 38 4 . 9 8 .9 40
Secchi inches 44 81 75 36 27 27 24 24 24
Note . DO in m i l l i g r a m s per l i t e r ; t empera tu re in °C
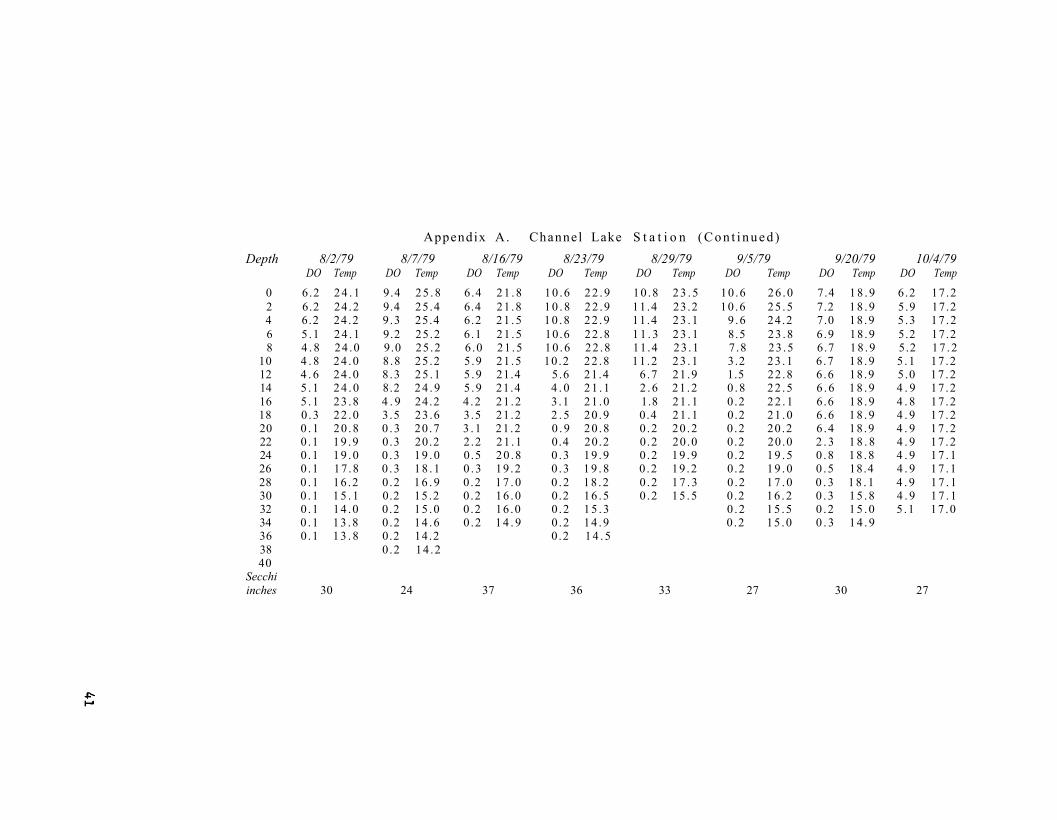
Appendix A. Channel Lake S t a t i o n ( C o n t i n u e d ) Depth 8/2/79 8/7/79 8/16/79 8/23/79 8/29/79 9/5/79 9/20/79 10/4/79
DO Temp DO Temp DO Temp DO Temp DO Temp DO Temp DO Temp DO Temp 0 6.2 2 4 . 1 9.4 25 .8 6.4 21 .8 10 .6 2 2 . 9 10 .8 2 3 . 5 10 .6 26 .0 7.4 1 8 . 9 6.2 17 .2 2 6.2 24 .2 9.4 25.4 6.4 21 .8 1 0 . 8 22 .9 11.4 23.2 10 .6 25 .5 7.2 1 8 . 9 5.9 17.2 4 6.2 24 .2 9 .3 25.4 6.2 2 1 . 5 10 .8 22 .9 11.4 23 .1 9 .6 24 .2 7.0 18 .9 5 .3 17 .2 6 5 .1 2 4 . 1 9.2 25.2 6.1 21 .5 10.6 22 .8 1 1 . 3 2 3 . 1 8.5 23 .8 6.9 18 .9 5.2 17.2 8 4 . 8 24 .0 9.0 25 .2 6 .0 21 .5 10 .6 22 .8 11.4 23 .1 7 .8 23 .5 6.7 18 .9 5.2 17 .2
10 4 . 8 24 .0 8 .8 25 .2 5 .9 21 .5 10.2 22 .8 11 .2 23 .1 3.2 23 .1 6.7 18 .9 5 .1 17 .2 12 4 . 6 24 .0 8 .3 25 .1 5 .9 21.4 5.6 21.4 6 .7 21 .9 1.5 22 .8 6 .6 18 .9 5 .0 17 .2 14 5 .1 24 .0 8.2 2 4 . 9 5 .9 21.4 4 . 0 2 1 . 1 2 . 6 21 .2 0 .8 22 .5 6 .6 1 8 . 9 4 . 9 17 .2 16 5 .1 23 .8 4 . 9 24.2 4 .2 21 .2 3 .1 21 .0 1.8 21 .1 0 .2 2 2 . 1 6.6 18 .9 4 . 8 17 .2 18 0 .3 22 .0 3.5 23.6 3.5 21 .2 2 . 5 20 .9 0.4 21 .1 0.2 21 .0 6 .6 1 8 . 9 4 . 9 17 .2 20 0 . 1 20 .8 0 .3 20 .7 3 .1 21 .2 0 . 9 20 .8 0 .2 20 .2 0 .2 20 .2 6 .4 18 .9 4 . 9 17 .2 22 0 .1 19 .9 0.3 20.2 2 .2 21 .1 0.4 20.2 0 .2 20.0 0.2 20.0 2 . 3 1 8 . 8 4 . 9 17 .2 24 0 .1 19 .0 0 .3 19 .0 0 .5 20 .8 0 .3 19 .9 0 .2 19 .9 0 .2 1 9 . 5 0 .8 18 .8 4 . 9 1 7 . 1 26 0 .1 17 .8 0 .3 1 8 . 1 0 .3 19 .2 0 .3 1 9 . 8 0 .2 19 .2 0 .2 19 .0 0 .5 18.4 4 . 9 1 7 . 1 28 0 .1 16 .2 0 .2 1 6 . 9 0 .2 1 7 . 0 0 .2 18 .2 0 .2 1 7 . 3 0 .2 1 7 . 0 0 . 3 1 8 . 1 4 . 9 1 7 . 1 30 0 .1 1 5 . 1 0.2 15 .2 0 .2 16 .0 0.2 16 .5 0 .2 15 .5 0 .2 16 .2 0 .3 15 .8 4 . 9 1 7 . 1 32 0 .1 14 .0 0.2 15 .0 0 .2 16 .0 0 .2 15 .3 0 .2 15 .5 0 .2 15 .0 5 .1 17 .0 34 0 .1 13 .8 0 .2 14 .6 0 .2 1 4 . 9 0 .2 14 .9 0 .2 15 .0 0 . 3 1 4 . 9 36 0 .1 1 3 . 8 0.2 14.2 0 .2 1 4 . 5 38 0 .2 14 .2 40
Secchi inches 30 24 37 36 33 27 30 27

Appendix B. Lake C a t h e r i n e S t a t i o n 1 Depth 5/9/79 5/22/79 6/5/79 6/21/79 6/27/79 7/2/79 -7/11/79 7/12/79 7/17/79
DO Temp DO Temp DO Temp DO Temp DO Temp DO Temp DO Temp DO Temp DO Temp
0 1 1 . 8 15 .4 8 .0 17 .9 8.4 20 .3 8.4 22 .0 10 .5 23 .8 9.2 24 .9 7 .3 25 .9 7 .5 25.4 8.6 25 .2 2 12 .2 15.4 8 .0 1 7 . 9 8.4 20 .3 8.4 22 .0 10.4 23 .8 9.2 24 .8 7.4 25.9 7.2 25.4 8.4 25 .0 4 12 .2 15.4 7 .9 17 .8 8.4 20 ,2 8.4 22 .0 10.2 23 .0 9 .3 23.6 7.4 25 .8 5.0 25 .0 8 .5 25.0 6 12 .2 15 .4 7 .9 1 7 . 6 8 .4 20 .2 8 .3 22 .0 7 .3 21 .8 8 .1 22 .8 4 . 5 24 .8 4 . 2 24 .0 8.4 25 .0 8 12 .2 15.4 7.8 1 7 . 5 8.4 20 .2 8.3 22 .0 6 .5 21.4 7.7 22 .3 3 .3 23.2 3.0 23.6 8.1 24.9
10 12.2 15 .2 7 .8 17 .2 8.4 20 .1 8.2 22.0 6.2. 21.4 6.8 22 .1 2 .7 23 .0 2.6 23.2 7.9 24 .9 12 12.4 1 5 . 0 7.2 1 6 . 9 7.5 19 .2 8.2 22 .0 5.5 21 .0 6 .5 22.0 2 .5 22.8 2 . 3 23.0 7 .9 24 .9 14 12 .8 14 .0 6 .9 1 6 . 9 7 .1 18 .7 8.2 21 .8 5 .1 20 .9 5 .8 21 .9 2 . 1 22 .2 2 . 1 22.8 1.2 23 .5 16 12 .9 1 3 . 9 6 .9 16 .8 6.5 18 .0 7.6 21.6 4 . 9 20 .9 5 .8 21 .9 1.8 22.0 1.7 22 .2 0 .5 23 .0 18 12 .9 13 .8 6 .9 16 .6 6.1 17.4 7.4 21 .2 4 . 8 20 .8 4 . 2 21.4 1.9 21 .8 1.6 22.0 0 .3 22 .8 20 13 .0 13.2 6 .8 16 .2 5.7 1 7 . 0 6 .9 21 .0 4 .4 2 0 . 6 3.6 2 1 . 1 1.8 21 .5 1.6 21 .9 0 .2 22 .1 22 13 .0 11 .9 6 .0 15 .6 5 .3 1 6 . 6 5 .6 20 .0 3 .8 .20.4 3.0 21.0 1.7 21.4 1.6 21 .8 0.2 22 .0 24 1 2 . 0 10 .9 4 . 6 14 .7 4 . 8 1 5 . 9 4 .4 19 .8 2 .8 20.2 2 .1 20 .9 1.7 20 .6 0 .5 21.6 0.2 21.8 26 9.8 9.2 4 . 1 1 4 . 0 4 . 1 1 5 . 7 3 .5 1 9 . 0 1.6 1 9 . 8 i . 4 20.4 0 . 1 20 .1 0 .1 21 .0 0 .1 21.4 28 8.4 8.2 3 .9 1 3 . 5 3 .8 15 .4 1.3 1 8 . 0 0 .3 19 .0 0 .5 20 .1 0 . 1 20 .0 0 .1 20 .8 0 .1 21.0 30 8.2 8.0 3 .5 1 2 . 9 1.4 14 .8 0 .3 17 .2 0 .3 1 7 . 8 0.4 1 9 . 9 0 . 1 19 .9 0 .1 19 .8 0 . 1 20 .3 32 7.4 8 .0 2 .9 12 .2 0 .3 1 4 . 1 0.2 1 6 . 8 0 .1 15 .5 0.2 19 .2 0 .1 19 .9 0 .1 18 .0 0 . 1 19 .9 34 6 .6 7.5 1.0 9.2 0.2 1 4 . 0 0 .1 15 .9 0 . 1 1 4 . 1 0.2 17 .2 0 .1 19 .9 0 .1 1 5 . 9 0 .1 18 .2 36 6 .1 7.2 <0.1 1 3 . 3 0 .1 14.2 0 . 1 13 .8 0 .1 15 .1 0 .1 19 .9 38 6 .0 7.2 <0.1 1 2 . 9 0 .1 13 .9 0 .1 1 4 . 0 40 5.4 7 .0 0 . 1 1 3 . 9
Secchi inches 33 78 84 36 33 42 48 42 39
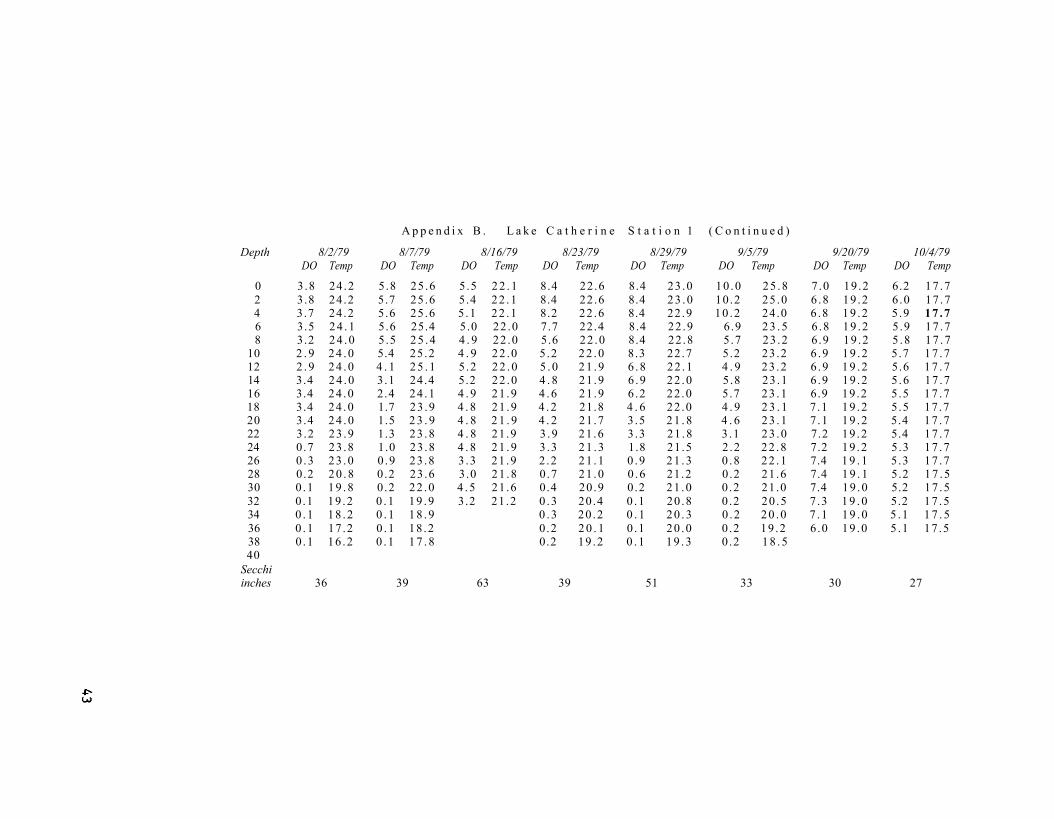
A p p e n d i x B . L a k e C a t h e r i n e S t a t i o n 1 ( C o n t i n u e d )
Depth 8/2/79 8/7/79 8/16/79 8/23/79 8/29/79 9/5/79 9/20/79 10/4/79 DO Temp DO Temp DO Temp DO Temp DO Temp DO Temp DO Temp DO Temp
0 3 .8 24.2 5.8 25.6 5 .5 2 2 . 1 8.4 22.6 8.4 23 .0 10 .0 25 .8 7 .0 19 .2 6.2 17 .7 2 3.8 24 .2 5.7 25.6 5.4 22 .1 8.4 22.6 8.4 23 .0 10.2 25 .0 6 .8 19 .2 6 .0 17 .7 4 3.7 24 .2 5.6 25.6 5 .1 22 .1 8.2 22 .6 8.4 22 .9 10 .2 24.0 6 .8 19 .2 5 .9 17 .7 6 3.5 2 4 . 1 5.6 25.4 5.0 22 .0 7.7 22.4 8.4 22 .9 6.9 2 3 . 5 6 .8 19 .2 5 .9 17 .7 8 3.2 24 .0 5 .5 25 .4 4 . 9 22 .0 5.6 22 .0 8.4 22 .8 5 .7 23 .2 6.9 19 .2 5 .8 17 .7
10 2 . 9 24 .0 5.4 25 .2 4 . 9 22 .0 5 .2 22 .0 8.3 22 .7 5.2 23 .2 6 .9 19 .2 5.7 17 .7 12 2 . 9 24 .0 4 . 1 2 5 . 1 5 .2 22 .0 5 . 0 2 1 . 9 6 .8 22 .1 4 . 9 23 .2 6 .9 1 9 . 2 5.6 1 7 . 7 14 3.4 24 .0 3.1 24.4 5.2 22 .0 4 . 8 21 .9 6 .9 22 .0 5.8 23 .1 6 .9 19 .2 5 .6 17 .7 16 3.4 24 .0 2.4 24 .1 4 . 9 21 .9 4 . 6 21 .9 6 .2 22 .0 5.7 23 .1 6.9 19 .2 5 .5 17 .7 18 3.4 24 .0 1.7 23 .9 4 . 8 21 .9 4 . 2 21.8 4 . 6 22 .0 4 . 9 2 3 . 1 7 .1 19 .2 5 .5 17 .7 20 3.4 24 .0 1.5 2 3 . 9 4 . 8 2 1 . 9 4 . 2 21 .7 3 .5 2 1 . 8 4 . 6 23 .1 7 .1 19 .2 5.4 17 .7 22 3.2 23 .9 1.3 23 .8 4 . 8 21 .9 3 .9 21 .6 3 .3 21 .8 3 .1 23 .0 7.2 19 .2 5.4 17 .7 24 0.7 23 .8 1.0 23 .8 4 . 8 21 .9 3 .3 21 .3 1.8 21.5 2 .2 22 .8 7.2 19 .2 5.3 17 .7 26 0 .3 23 .0 0 .9 23 .8 3 .3 21 .9 2 .2 21 .1 0 .9 21 .3 0 .8 22 .1 7.4 1 9 . 1 5.3 17 .7 28 0.2 20 .8 0 .2 23.6 3.0 21 .8 0 .7 21 .0 0 .6 21.2 0 .2 21.6 7.4 1 9 . 1 5.2 1 7 . 5 30 0 .1 19 .8 0 .2 22 .0 4 . 5 21.6 0.4 20 .9 0 .2 21 .0 0 .2 21.0 7.4 19 .0 5.2 17 .5 32 0.1 19 .2 0 .1 19 .9 3.2 21 .2 0 .3 20.4 0 .1 20 .8 0 .2 20 .5 7 .3 1 9 . 0 5.2 17 .5 34 0 .1 18 .2 0 . 1 1 8 . 9 0 .3 20 .2 0 . 1 20 .3 0 .2 20 .0 7 .1 19 .0 5 .1 1 7 . 5 36 0 .1 17 .2 0 .1 18 .2 0 .2 2 0 . 1 0 .1 20 .0 0 .2 19 .2 6 .0 19 .0 5 .1 17 .5 38 0 .1 16 .2 0 .1 1 7 . 8 0.2 19 .2 0 . 1 19 .3 0 .2 1 8 . 5 40
Secchi inches 36 39 63 39 51 33 30 27

Appendix C. Lake C a t h e r i n e S t a t i o n 2 (Near A e r a t o r )
Depth 5/9/79 5/22/79 6/5/79 6/21/79 6/27/79 7/2/79 7/11/79 7/12/79 7/17/79 DO Temp DO Temp DO Temp DO Temp DO Temp DO Temp DO Temp DO Temp DO Temp
0 12 .8 1 5 . 0 7 .9 18 .0 9.0 20 .9 8 .5 22 .0 9 .3 23 .0 9.8 25 .0 6 .7 25 .2 7.5 25.6 9.8 24 .9 2 1 2 . 8 1 4 . 9 8 .0 18 .0 9.0 20 .9 8.6 22 .0 9 .3 23 .0 10.4 24 .2 5 .7 24 .8 6 .2 2 5 . 0 9.6 25 .0 4 12 .8 1 4 . 9 7 .9 1 7 . 6 8.8 20 .5 8.6 22 .0 8 .3 21 .9 10 .2 24 .0 5.5 24.2 4 . 8 24 .6 9.4 25.0 6 12 .8 14 .8 7 .5 16 .8 8.7 20.5 8.8 21 .8 7.6 21 .9 8.2 22.4 5.2 24 .2 4 . 1 24.0 9.6 24 .9 8 12 .8 14 .2 7.2 1 6 . 5 8.4 2 0 . 1 8.4 21 .8 6 .8 21.5 6 .8 2 2 . 1 3.8 23 .1 3.6 23 .8 9 .3 24 .9
10 12 .8 14.2 7 .0 16.5 8 .3 20.0 8.4 21 .6 6 .1 21.5 6.7 22 .1 3.2 23 .0 2 .9 23 .2 8 .8 24 .9 12 1 2 . 9 14 .0 6 .8 16 .5 8 .3 1 9 . 9 8.2 21 .5 5 .9 21.2 5 .9 22 .0 2 .6 22 .8 2.7 23 .0 7 .1 24.9 14 1 2 . 9 1 4 . 0 6.7 16 .3 7 .9 19 .5 8.2 2 1 . 5 5 .6 2 1 . 1 5 .6 21 .8 2 . 3 22.2 2.4 22.6 0.4 24.2 16 12 .9 1 3 . 9 6.5 16 .2 7 .1 1 8 . 6 8 .0 21.4 5.2 21 .0 5 .3 21.2 1.9 22 .0 1.9 22 .2 0.2 22.4 18 1 2 . 9 1 3 . 8 6.5 1 6 . 1 6 .3 18 .0 6 .9 21 .0 4 .5 20 .7 4 . 0 21.2 1.6 21 .9 1.4 22 .0 0 .2 22.0 20 12 .9 13 .8 6.2 16 .0 5.7 17 .2 6.5 20 .9 4 . 4 20 .6 3.6 21 .1 1.6 21.6 1.2 21.8 0 .2 21 .9 22 1 2 . 9 13.4 6 .0 16 .0 5 .1 16 .5 5.2 20 .0 3 .8 20.4 3 .3 21 .0 1.0 21 .3 1.2 21.6 0 .2 21 .8 24 11 .2 10 .0 5 .6 15 .8 5.0 16 .3 3.6 1 9 . 1 3.5 20 .2 2 .2 20 .8 1.0 21.2 0 .5 21.6 0 .1 21.5 26 10 .8 10 .0 4 . 6 14 .5 4 . 8 1 6 . 1 2 .9 1 8 . 8 2 . 1 19 .9 1.4 20.4 0 .7 21 .2 0 .3 21 .3 0 . 1 21 .0 28 8 .8 8 .8 4 . 1 14 .2 2 .7 15 .0 2 .1 1 8 . 5 0 .3 18 .5 0 .6 20 .0 0.4 21.0 0 . 1 21 .0 0 .1 21 .0 30 8.2 8 .1 3.2 14 .2 1.5 1 4 . 6 0.7 1 7 . 3 0 .3 17 .0 0.4 20 .0 0.2 20 .2 0 .1 20 .1 0 .1 20.4 32 7.4 7.8 0.8 10.4 0.4 14 .2 0.2 16 .2 0 . 1 16 .0 0 .3 19 .0 0 .1 18 .8 0 .1 19 .0 0 . 1 19 .9 34 0.1 1 5 . 6 36
Secchi inches 33 69 72 43 36 30 48 42 27

Appendix C. Lake C a t h e r i n e S t a t i o n 2 (Near A e r a t o r ) ( C o n t i n u e d )
Depth 8/2/79 8/7/79 8/16/79 8/23/79 8/29/79 9/5/79 9/20/79 10/4/79 DO Temp DO Temp DO Temp DO Temp DO Temp DO Temp DO Temp DO Temp
0 5 .8 24 .2 4 . 7 25.4 5.4 22 .0 7.2 22 .5 9 .8 25 .0 9.6 26 .2 8 .1 1 9 . 0 6 .8 1 7 . 5 2 5.7 24.2 4 . 3 25 .2 5.4 22 .1 5.2 21 .9 9.8 23 .9 7.0 24.4 8 .1 19 .0 6.5 17 .5 4 5 .0 24 .0 4 . 1 25 .0 5.4 2 2 . 1 5 .2 21 .9 9.2 23 .5 6.4 23 .8 8 .1 19 .0 6 .3 1 7 . 5 6 4 . 9 24 .0 3.9 2 4 . 9 5.4 22 .0 5 .1 21 .9 7.6 23 .0 6 .3 23.5 8 .1 19 .0 6.2 17 .5 8 4 . 9 24 .0 3.4 24 .7 5.2 22 .0 5 .3 22 .0 6 .8 22 .8 6 .1 23.5 8 .1 19 .0 6 .1 17 .5
10 4 . 8 2 4 . 0 3 .1 24 .6 5 . 1 22 .0 5 . 3 22 .0 6 .5 22 .6 6 .3 23.4 8 .1 19 .0 5 .9 1 7 . 5 12 4 . 9 24 .0 3 .1 24 .6 5.4 22 .0 5.4 22 .0 6.5 22 .6 5 .7 23 .2 8.1 19 .0 5.9 1 7 . 5 14 4 .9 24 .0 3 .1 24 .6 5 .4 22 .0 5.2 21 .9 6 .8 22.2 5.4 2 3 . 1 8.1 19 .0 5.8 17 .5 16 4 . 7 2 4 . 0 2 .4 2 4 . 1 5 . 3 22 .0 4 . 1 21 .8 6.7 2 2 . 1 5 .0 23 .1 8 .1 1 9 . 0 5 .8 1 7 . 5 18 4 . 6 24.0 2 . 1 24 .0 5.2 22 .0 3.7 21 .6 6.4 22 .0 4 . 9 23 .0 8 .1 19 .0 5.7 17 .5 20 4 .5 24 .0 2 . 1 24 .0 5 .2 22 .0 2.4 21 .5 5 .8 22 .0 4 . 5 23 .1 8 .1 19 .0 5.7 17 .5 22 4 . 6 24 .0 1.7 24 .0 5 .3 22 .0 2 .2 21.2 3 .6 21 .9 1.3 22 .5 8.1 19 .0 6 .0 17 .0 24 4 . 6 24 .0 1.7 2 3 . 9 5.4 22 .0 1.8 2 1 . 1 1.7 21.5 1.1 22 .1 8 .1 19 .0 6 .0 17.0 26 0.4 2 3 . 8 1.2 23 .8 5.4 22 .0 1.6 21 .1 0 . 3 2 1 . 3 0 .8 22 .0 8 .1 19 .0 28 30 32 34 36
Secchi inches 27 54 59 39 45 33 27 27

Appendix D. Water Qual i ty C h a r a c t e r i s t i c s , Lake Cather ine Chlorine Phosphorus
Date Trans. Alka Sulfate Hardness Silica demand Total Diss. Ammonia-N Nitrate-N T. Iron 1979 inches pH mg/l mg/l mg/l mg/l mg/l mg/l mg/l mg/l mg/l Lake Catherine, surface 5/9 33 8.51 169 33.8 230 0.13 4.83 0.06 0.02 0.14 0.43 0.42 5/22 78 8.10 180 36.0 240 0.79 4.90 0.04 0.02 0.19 0.36 0.16 6/5 84 8.22 185 35.0 227 0.39 3.30 0.04 0.03 0.15 0.25 0.06 6/21 36 8.45 183 38.4 227 0.69 5.30 0.08 0.02 0.01 0.18 0.10 7/2 42 8.52 184 30.4 233 1.81 4.34 0.06 0.02 0.01 0.11 0.04 7/17 39 8.47 185 33.2 235 1.04 6.78 0.04 0.01 0.20 0.26 0.06 8/2 36 8.21 178 34.0 224 2.86 5.76 0.07 0.02 0.16 0.20 0.06 8/23 39 8.38 161 30.0 213 2.22 6.78 0.08 0.02 0.20 0.19 0.10 9/5 33 8.67 144 31.6 217 0.92 6.20 0.04 0.01 0.03 0.16 0.07 9/20 30 8.22 173 32.6 247 0.40 4.96 0.07 0.01 0.14 0.17 0.11 10/4 27 8.21 170 30.9 240 1.26 5.72 0.08 0.01 0.21 0.07 0.15 Lake Catherine, mid-depth 5/9 8.47 168 33.0 227 0.26 4.34 0.05 0.02 0.10 0.55 0.43 5/22 8.13 180 37.8 238 0.77 4.90 0.04 0.03 0.17 0.31 0.10 6/5 8.12 185 35.7 232 0.30 3.90 0.06 0.03 0.23 0.25 0.06 6/21 8.35 185 36.0 233 1.73 4.40 0.04 0.02 0.10 0.16 0.11 7/2 8.33 185 30.7 233 1.86 6.29 0.06 0.02 0.19 0.10 0.12 7/17 8.03 186 31.2 240 1.73 6.91 0.07 0.02 0.33 0.15 0.06 8/2 8.24 177 32.8 227 3.26 5.76 0.07 0.03 0.16 0.18 0.08 8/23 8.39 161 31.9 229 1.92 7.18 0.08 0.03 0.20 0.21 0.11 9/5 8.12 163 33.2 217 1.15 6.56 0.03 0.00 0.25 0.13 0.14 9/20 8.25 171 32.2 229 0.30 4.92 0.05 0.01 0.14 0.17 0.11 10/4 8.16 174 33.2 233 1.22 5.41 0.09 0.02 0.22 0.08 0.11 Lake Catherine, deep 5/9 7.80 179 31.8 232 0.72 5.54 0.08 0.04 0.56 0.64 0.25 5/22 8.11 178 37.4 233 0.45 6.20 : 0.05 0.03 0.33 0.42 0.12 6/5 7.79 187 33.8 233 1.20 4 .6 0.16 0.15 0.68 0.22 0.08 6/21 7.80 194 34.8 233 1.89 11.0 0.22 0.21 1.85 0.33 0.10 7/2 7.93 192 31.9 237 2.45 14.54 0.19 0.13 0.97 0.14 0.09 7/17 7.81 198 33.6 240 3.89 16.53 0.28 0.27 1.04 0.14 0.53 8/2 8.11 177 34.8 227 3.15 14.00 0.08 0.03 0.20 0.12 0.08 8/23 7.84 157 31.0 213 4.18 12.01 0.20 0.14 0.80 0.16 0.35 9/5 7.62 166 29.8 213 4.30 16.83 0.24 0.21 1.39 0.20 0.21 9/20 8.32 172 32.6 225 0.36 4.83 0.09 0.01 0.20 0.15 0.12 10/4 8.19 172 31.9 223 1.30 5.54 0.09 0.02 0.21 0.08 0.29

Appendix E. Water Qual i ty C h a r a c t e r i s t i c s , Channel Lake
Chlorine Phosphorus Date Trans. Alka Sulfate Hardness Silica demand Total Diss. Ammonia-N Nitrate-N T. Iron 1979 inches pH mg/l mg/l mg/l mg/l mg/l mg/l mg/l mg/l mg/l Channel Lake, surface 5/9 44 8.15 170 32.2 228 0.07 4.65 0.10 0.02 0.12 0.42 0.12 5/22 81 8.17 183 36.2 240 0.60 5.80 0.04 0.03 0.23 0.31 0.09 6/5 75 8.30 186 33.5 227 0.47 3.10 0.04 0.01 0.11 0.25 0.06 6/21 36 8.37 185 37.8 230 0.94 5.60 0.06 0.01 0.10 0.09 0.09 7/2 27 8.79 179 33.0 230 1.99 4.88 0.07 0.03 0.16 0.13 0.12 7/17 24 8.48 175 35.6 223 2.67 6.34 0.06 0.01 0.23 0.28 0.13 8/2 30 8.51 173 32.8 221 3.91 5.18 0.07 0.04 0.06 0.22 0.04 8/23 36 8.71 165 28.0 220 3.84 5.80 0.06 0.03 0.14 0.14 0.03 9/5 27 8.74 160 32.2 211 3.82 9.21 0.05 0.01 0.23 0.16 0.05 9/20 30 8.16 177 31.0 239 4.34 5.45 0.06 0.01 0.19 0.16 0.10 10/4 27 8.14 176 32.5 227 4.55 6.20 0.09 0.03 0.27 0.13 0.12 Channel Lake, mid-depth 5/9 8.25 170 32.9 232 0.03 4.65 0.04 0.02 0.12 0.54 0.13 5/22 8.16 180 37.8 239 0.51 6.20 0.07 0.04 0.17 0.32 0.17 6/5 7.98 185 35.0 233 0.60 3.80 0.08 0.05 0.28 0.25 0.07 6/21 8.08 181 38.6 233 0.94 5.10 0.06 0.01 0.06 0.09 0.07 7/2 8.38 181 33.8 233 2.05 4.88 0.06 0.02 0.12 0.12 0.09 7/17 8.48 173 34.8 227 2.56 7.76 0.07 0.02 0.05 0.19 0.12 8/2 8.41 172 33.6 227 3.82 5.76 0.07 0.02 0.07 0.13 0.06 8/23 8.17 167 31.6 227 4.22 5.89 0.04 0.03 0.29 0.13 0.02 9/5 7.82 162 30.4 188 4.20 6.20 0.04 0.00 0.00 0.20 0.16 9/20 8.17 174 31.0 227 4.34 5.36 0.07 0.01 0.11 0.15 0.06 10/4 8.21 172 33.6 227 4 .61 6.38 0.09 0.01 0.28 0.10 0.21 Channel Lake, deep 5/9 8.09 188 33.8 228 1.58 4 .88 0.19 0.07 0.35 0.44 2.00 5/22 7.98 183 33.0 233 1.11 10.20 0.13 0.09 0.88 0.21 0.15 6/5 7.83 187 33.7 233 1.44 6.00 0.16 0.12 0.82 0.19 0.07 6/21 7.61 198 34.2 234 3.10 18.90 0.29 0.27 2.29 0.16 0.12 7/2 7.80 199 29.6 240 3.72 14.23 0.36 0.26 1.47 0.09 0.10 7/17 8.28 177 36.0 227 2.48 11.35 0.12 0.01 0.28 0.17 0.30 8/2 7.67 230 17.6 220 5.16 24.63 0.52 0.23 3.14 0.12 0.11 8/23 7.85 211 26.2 260 5.41 22.15 0.41 0.32 2.65 0.14 0.18 9/5 7.48 192 26.1 233 5.52 16.30 0.26 0.25 2.35 0.16 0.10 9/20 7.46 196 30.7 252 5.67 6.25 0.27 0.21 2.19 0.20 0.08 10/4 8.20 182 32.5 230 4.73 8.85 0.13 0.04 0.29 0.12 0.67