Piet: a GIS-OLAP Implementation - Aalborg Universitetdolap07.cs.aau.dk/escribano.pdf · Piet: a...
63
DOLAP 2007 1 Piet: a GIS-OLAP Implementation Leticia I. Gomez Instituto Tecnologico de Buenos Aires [email protected] Joint work with Ariel Escribano, Bart Kuijpers and Alejandro A. Vaisman
Transcript of Piet: a GIS-OLAP Implementation - Aalborg Universitetdolap07.cs.aau.dk/escribano.pdf · Piet: a...
DOLAP 2007 1
Piet: a GIS-OLAP Implementation
Leticia I. GomezInstituto Tecnologico de Buenos Aires
Joint work with Ariel Escribano, Bart Kuijpers and Alejandro A. Vaisman
DOLAP 2007 2
Outline
• GIS-OLAP motivation
• Query Language
• Data Model
• Implementation Details
• Experimental Results
• Conclusion
DOLAP 2007 3
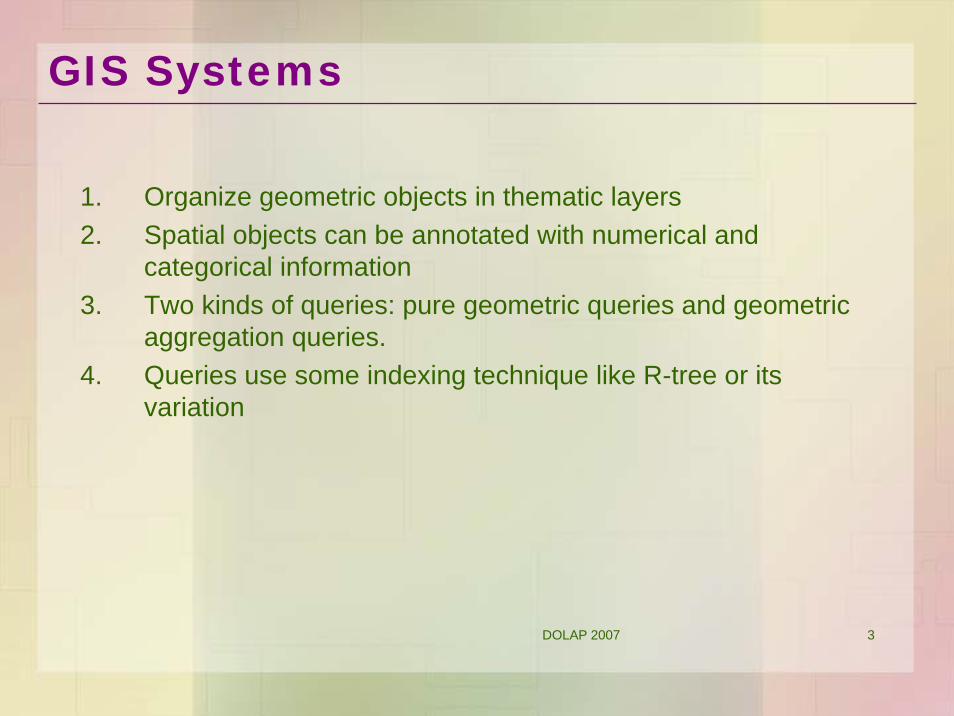
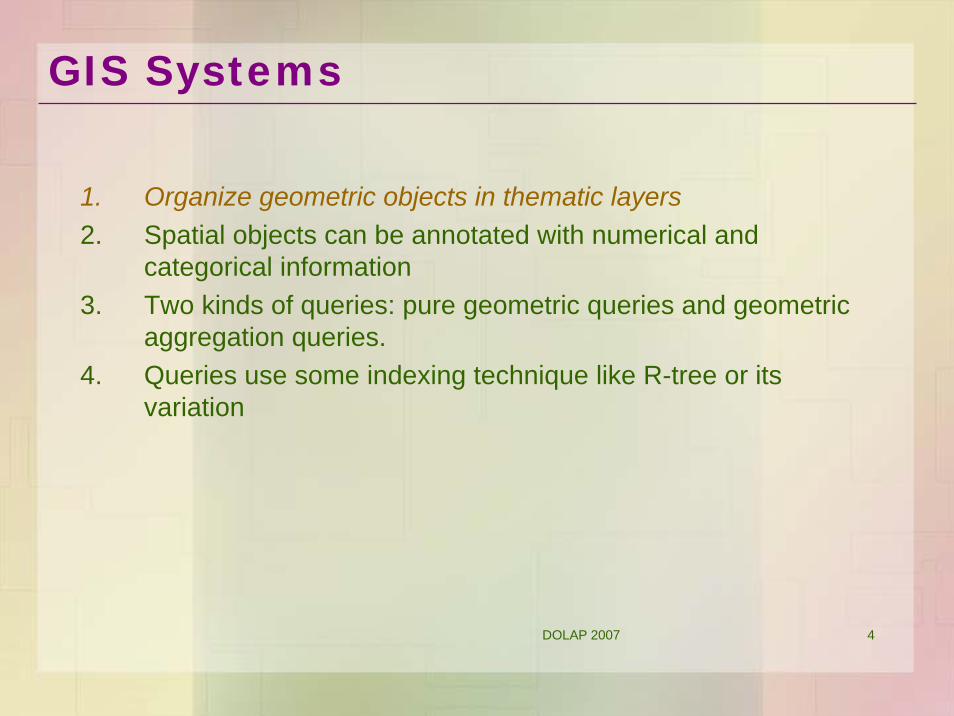
1. Organize geometric objects in thematic layers2. Spatial objects can be annotated with numerical and
categorical information3. Two kinds of queries: pure geometric queries and geometric
aggregation queries.4. Queries use some indexing technique like R-tree or its
variation
GIS Systems
DOLAP 2007 4
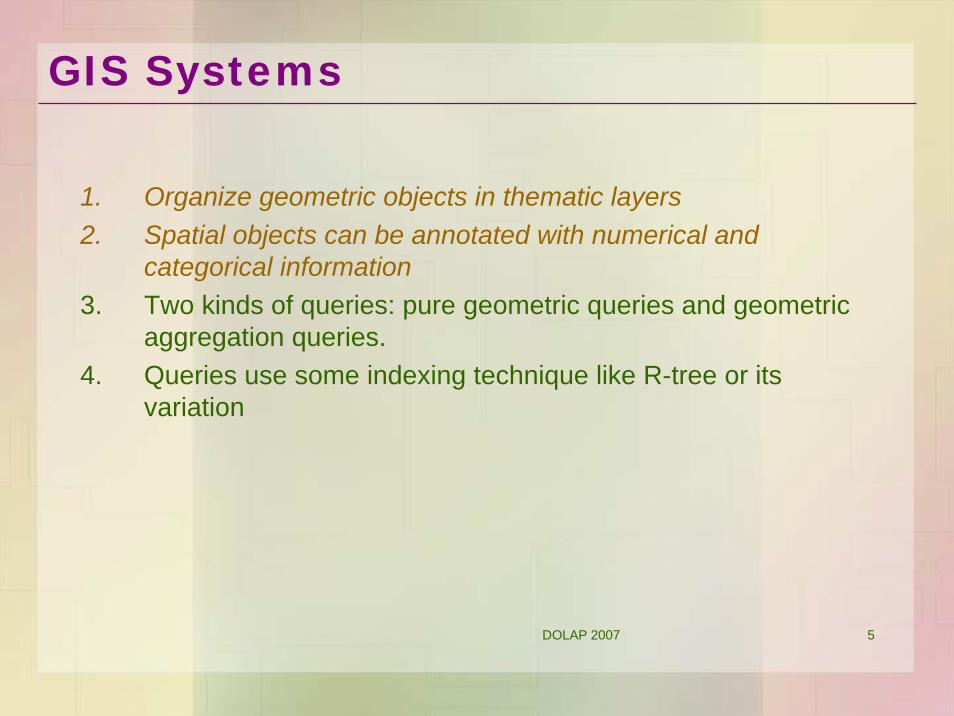
1. Organize geometric objects in thematic layers2. Spatial objects can be annotated with numerical and
categorical information3. Two kinds of queries: pure geometric queries and geometric
aggregation queries.4. Queries use some indexing technique like R-tree or its
variation
GIS Systems
DOLAP 2007 5
1. Organize geometric objects in thematic layers2. Spatial objects can be annotated with numerical and
categorical information3. Two kinds of queries: pure geometric queries and geometric
aggregation queries.4. Queries use some indexing technique like R-tree or its
variation
GIS Systems
DOLAP 2007 6
Example: Map of Belgium organized in 5 layers with demographic and economic information
GIS Systems
DOLAP 2007 7
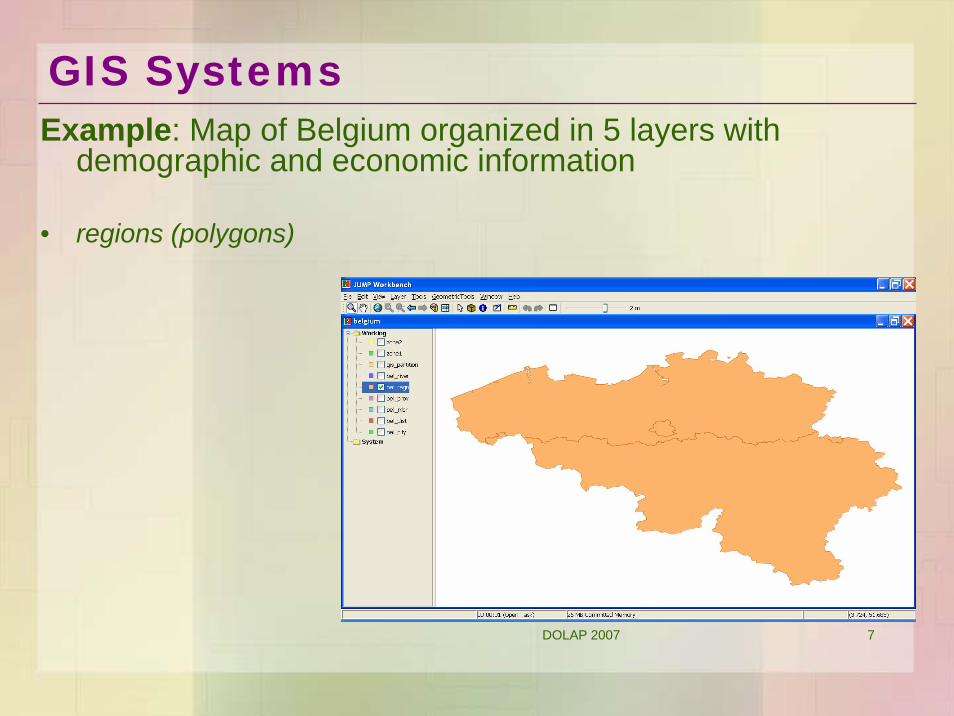
Example: Map of Belgium organized in 5 layers with demographic and economic information
• regions (polygons)
GIS Systems
DOLAP 2007 8
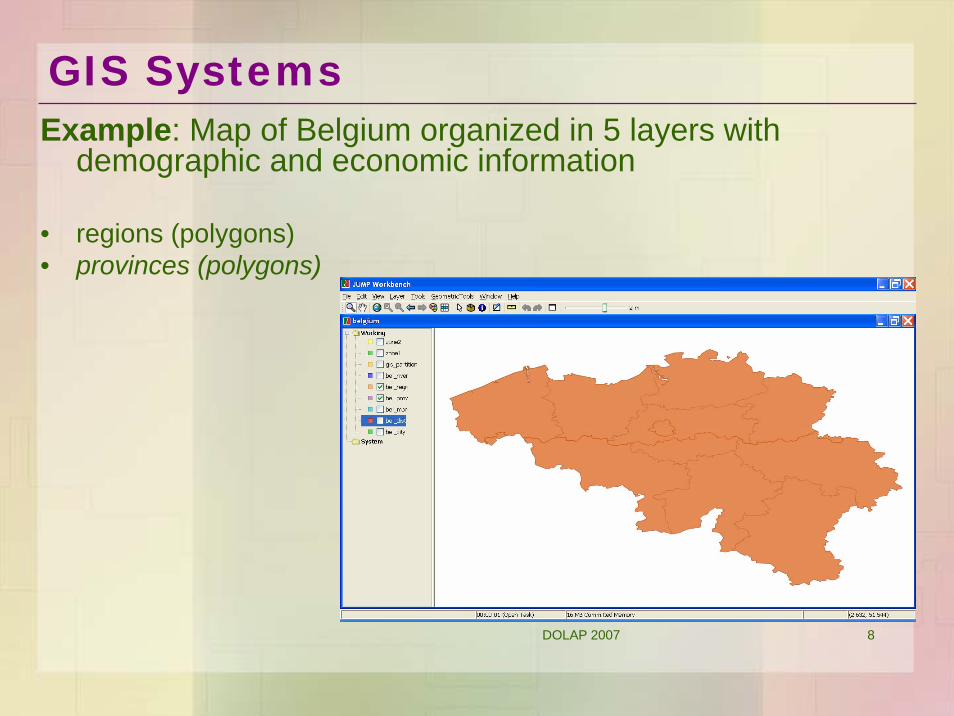
Example: Map of Belgium organized in 5 layers with demographic and economic information
• regions (polygons)• provinces (polygons)
GIS Systems

DOLAP 2007 9
Example: Map of Belgium organized in 5 layers with demographic and economic information
• regions (polygons)• provinces (polygons)• districts (polygons)
GIS Systems

DOLAP 2007 10
GIS SystemsExample: Map of Belgium organized in 5 layers with
demographic and economic information
• regions (polygons)• provinces (polygons)• districts (polygons)• cities (points)
DOLAP 2007 11
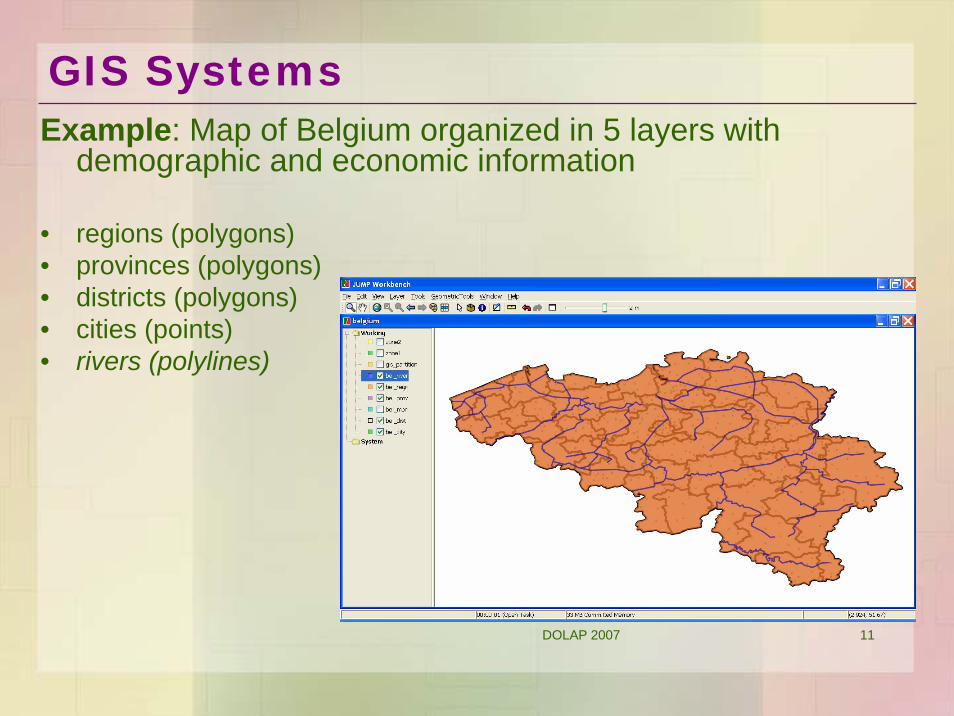
Example: Map of Belgium organized in 5 layers with demographic and economic information
• regions (polygons)• provinces (polygons)• districts (polygons)• cities (points)• rivers (polylines)
GIS Systems

DOLAP 2007 12
1. Organize geometric objects in thematic layers2. Spatial objects can be annotated with numerical and
categorical information3. Two kinds of queries: pure geometric queries and geometric
aggregation queries.4. Queries use some indexing technique like R-tree or its
variation
GIS Systems
DOLAP 2007 13
1. Organize geometric objects in thematic layers2. Spatial objects can be annotated with numerical and
categorical information3. Two kinds of queries: pure geometric queries and geometric
aggregation queries.4. Queries use some indexing technique like R-tree or its
variation
GIS Systems
DOLAP 2007 14
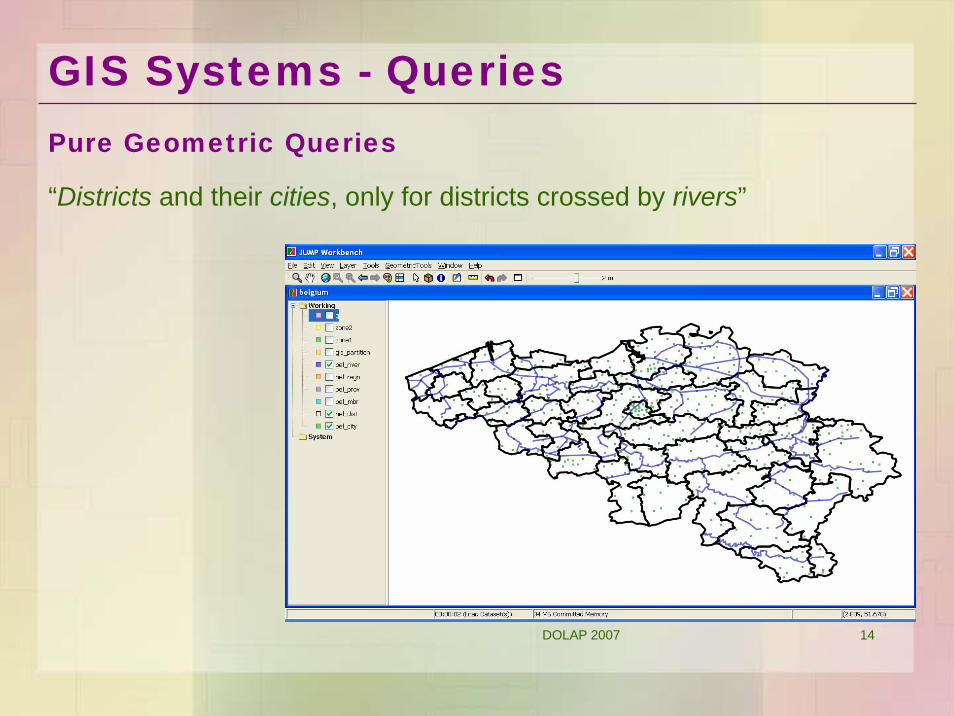
“Districts and their cities, only for districts crossed by rivers”
GIS Systems - QueriesPure Geometric Queries
DOLAP 2007 15
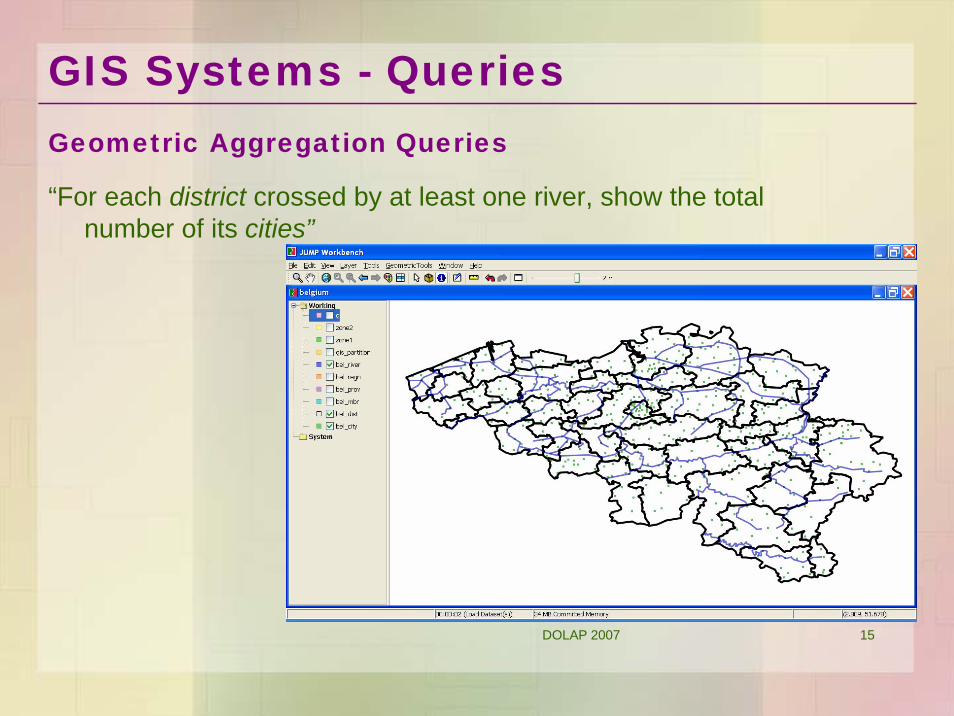
“For each district crossed by at least one river, show the total number of its cities”
GIS Systems - QueriesGeometric Aggregation Queries
DOLAP 2007 16
1. Organize geometric objects in thematic layers2. Spatial objects can be annotated with numerical and
categorical information3. Two kinds of queries: pure geometric queries and geometric
aggregation queries.4. Queries use some indexing technique like R-tree or its
variation
GIS Systems
DOLAP 2007 17
1. We assume that non-spatial information resides in data warehouses.
2. Data perceived as a cube, where the dimensions provide contextual information and the cells contain measures of facts.
3. OLAP tools used to exploit multidimensional databases.
OLAP & Multidimensional Databases
DOLAP 2007 18
1. We assume that non-spatial information resides in data warehouses.
2. Data perceived as a cube, where the dimensions provide contextual information and the cells contain measures of facts.
3. OLAP tools used to exploit multidimensional databases.
OLAP & Multidimensional Databases

DOLAP 2007 19
1. We assume that non-spatial information resides in data warehouses.
2. Data perceived as a cube, where the dimensions provide contextual information and the cells contain measures of facts.
3. OLAP tools used to exploit multidimensional databases.
OLAP & Multidimensional Databases
DOLAP 2007 20
1. We assume that non-spatial information resides in data warehouses.
2. Data perceived as a cube, where the dimensions provide contextual information and the cells contain measures of facts.
3. OLAP tools used to exploit multidimensional databases.
OLAP & Multidimensional Databases
DOLAP 2007 21
Example: Information about stores and sales in Belgium
OLAP & Multidimensional Databases
OLAP Queries
“Unit Sales, Store Cost and Store Sales for products and promotion media offered by stores in provinces, during 1997”
DOLAP 2007 22
Motivation for GIS-OLAP
• Data aggregation marginally present in commercial GIS
• Light integration between spatial and non-spatial data
• A single framework for GIS and OLAP is needed.
• This requires a formal data model and query language

DOLAP 2007 23
• Based on a solid formal model (see “Spatial aggregation: Data model and implementation” [Gomez,Haesevoets, Kuijpers, and Vaisman]).
• Allows expressing a wide range of aggregation queries over a GIS map and a data warehouse.
• Implements a novel query evaluation technique, called “sub-poligonization” that go beyond the typical R-tree-basedstrategies
GIS-OLAP: Our Proposal
Classical Solution:For Geometric Queries => database spatial extenders, such as R-trees
For Geometric Aggregation Queries => techniques not implemented in commercial DBMS like aR-trees
DOLAP 2007 24
Outline
• GIS-OLAP motivation
• Query Language
• Data Model
• Implementation Details
• Experimental Results
• Conclusion
DOLAP 2007 25
Query Language
“Districts and their cities, only for districts crossed by rivers”
Pure Geometric Queries (SQL Approach)
DOLAP 2007 26
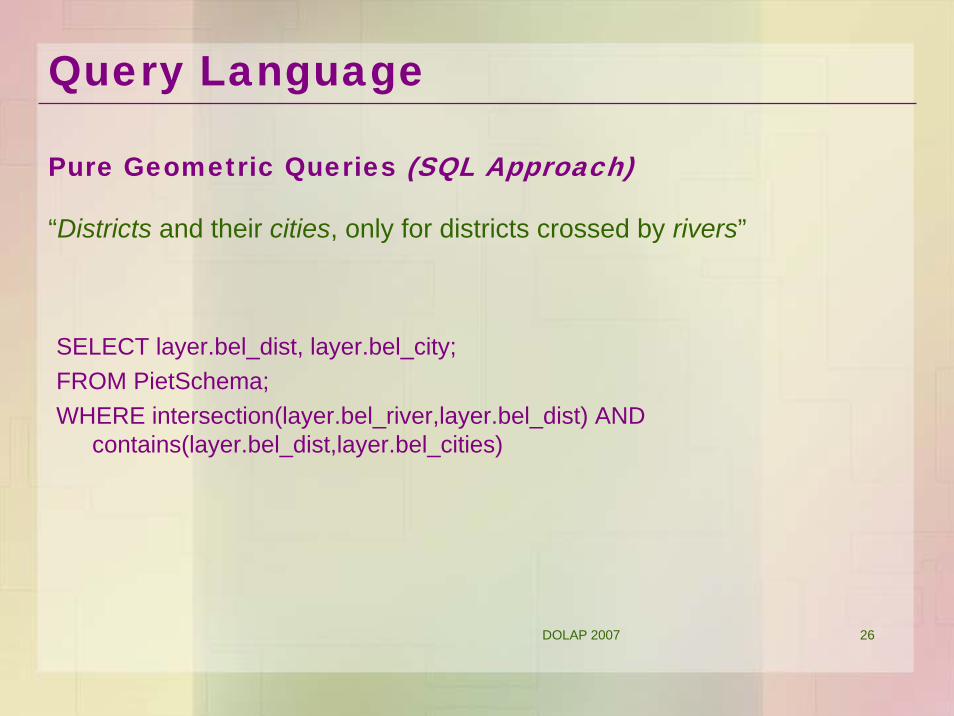
SELECT layer.bel_dist, layer.bel_city;FROM PietSchema;WHERE intersection(layer.bel_river,layer.bel_dist) AND
contains(layer.bel_dist,layer.bel_cities)
Query Language
“Districts and their cities, only for districts crossed by rivers”
Pure Geometric Queries (SQL Approach)
DOLAP 2007 27
Query Language
“For each district crossed by at least one river, show the total number of its cities”
Geometric Aggregation Queries (SQL Approach)
DOLAP 2007 28
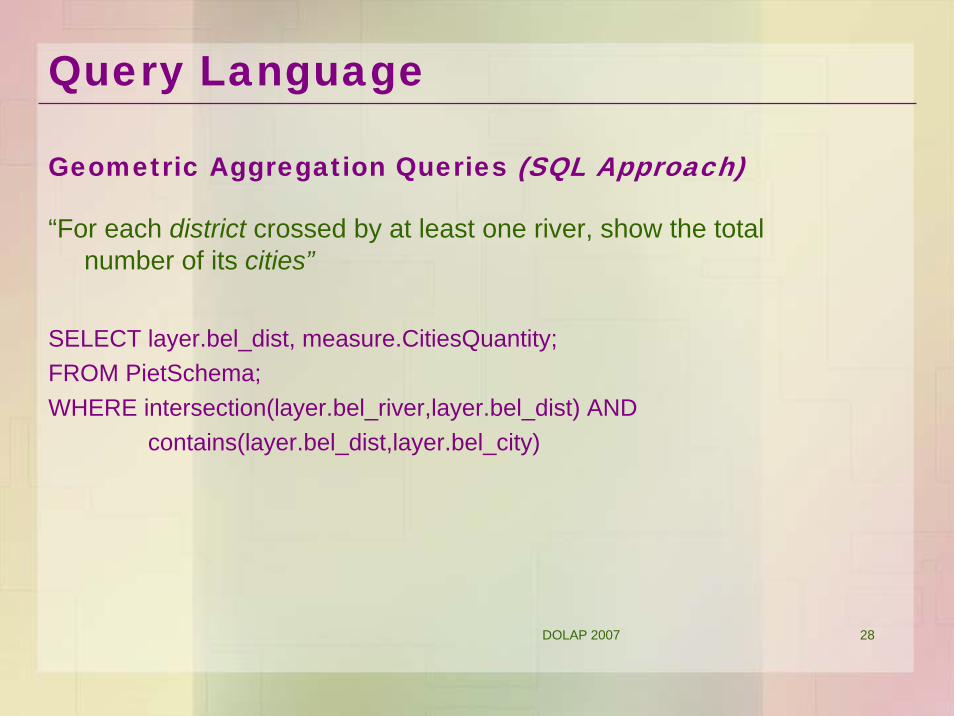
SELECT layer.bel_dist, measure.CitiesQuantity;FROM PietSchema;WHERE intersection(layer.bel_river,layer.bel_dist) AND
contains(layer.bel_dist,layer.bel_city)
Query Language
“For each district crossed by at least one river, show the total number of its cities”
Geometric Aggregation Queries (SQL Approach)
DOLAP 2007 29
Query Language
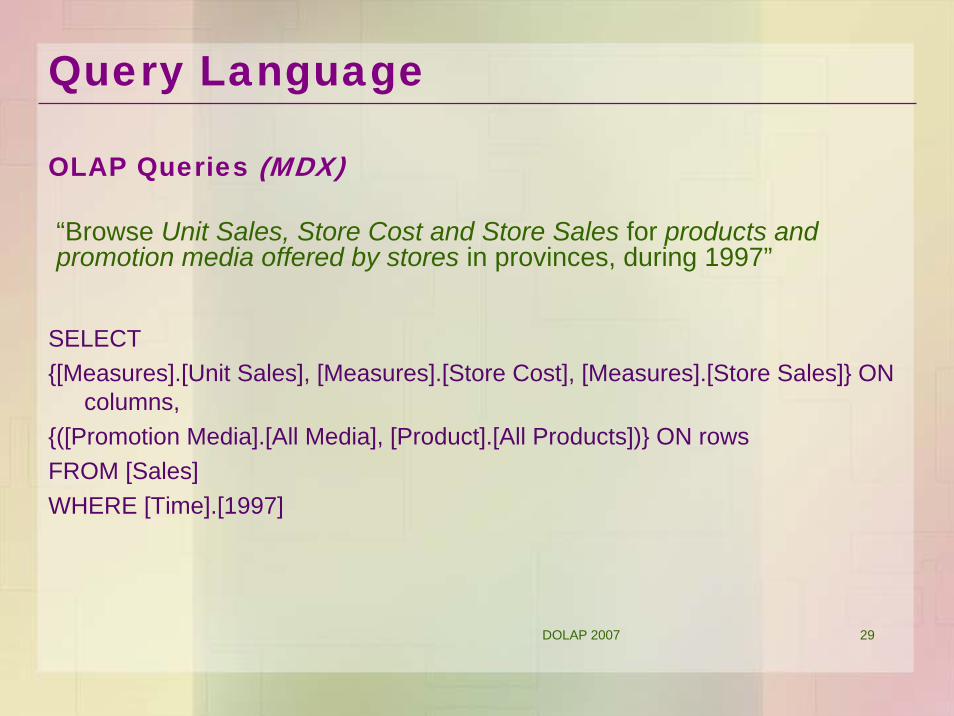
OLAP Queries (MDX)
“Browse Unit Sales, Store Cost and Store Sales for products and promotion media offered by stores in provinces, during 1997”
SELECT {[Measures].[Unit Sales], [Measures].[Store Cost], [Measures].[Store Sales]} ON
columns,{([Promotion Media].[All Media], [Product].[All Products])} ON rowsFROM [Sales] WHERE [Time].[1997]

DOLAP 2007 30
“Browse Unit Sales, Store Cost and Store Sales for products and promotion media offered by stores in provinces crossed by rivers, during 1997”
Query Language
GIS-OLAP Queries (SQL Approach + MDX)
SQL Approach
|
MDX

DOLAP 2007 31
SELECT layer.bel_prov;FROM PietSchema;WHERE intersection(layer.bel_river,layer.bel_prov);|SELECT {[Measures].[Unit Sales], [Measures].[Store Cost], [Measures].[Store
Sales]} ON columns,{([Promotion Media].[All Media], [Product].[All Products])} ON rowsFROM [Sales] WHERE [Time].[1997]
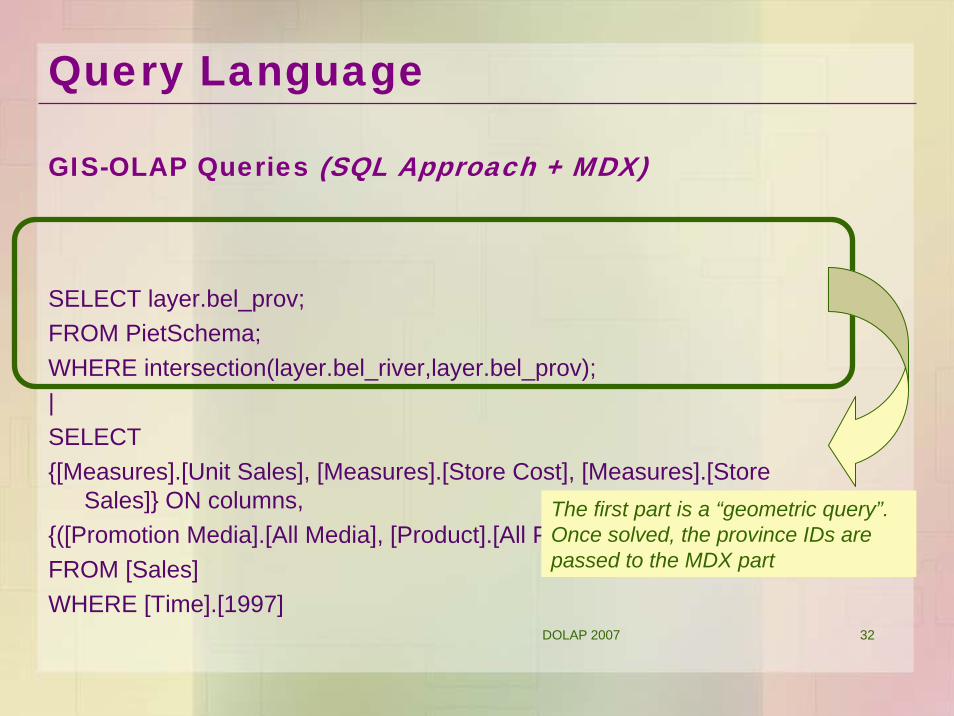
Query Language
GIS-OLAP Queries (SQL Approach + MDX)
DOLAP 2007 32
SELECT layer.bel_prov;FROM PietSchema;WHERE intersection(layer.bel_river,layer.bel_prov);|SELECT {[Measures].[Unit Sales], [Measures].[Store Cost], [Measures].[Store
Sales]} ON columns,{([Promotion Media].[All Media], [Product].[All Products])} ON rows FROM [Sales] WHERE [Time].[1997]
The first part is a “geometric query”. Once solved, the province IDs are passed to the MDX part
Query Language
GIS-OLAP Queries (SQL Approach + MDX)
DOLAP 2007 33
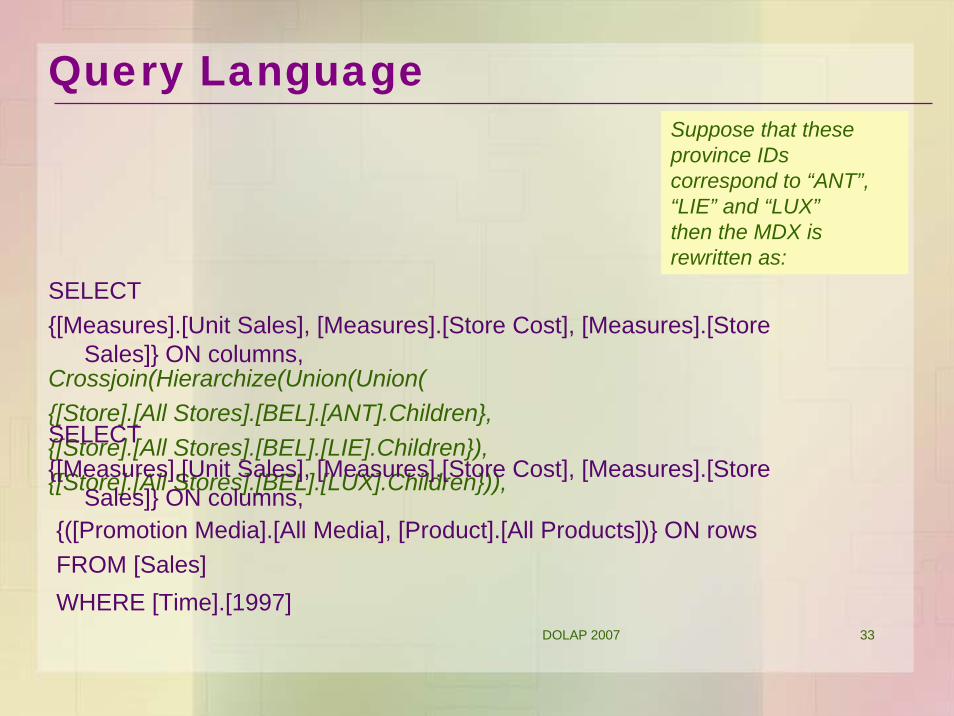
{([Promotion Media].[All Media], [Product].[All Products])} ON rows FROM [Sales] WHERE [Time].[1997]
SELECT {[Measures].[Unit Sales], [Measures].[Store Cost], [Measures].[Store
Sales]} ON columns,Crossjoin(Hierarchize(Union(Union({[Store].[All Stores].[BEL].[ANT].Children}, {[Store].[All Stores].[BEL].[LIE].Children}), {[Store].[All Stores].[BEL].[LUX].Children})),
Suppose that these province IDs correspond to “ANT”, “LIE” and “LUX”then the MDX is rewritten as:
Query Language
SELECT {[Measures].[Unit Sales], [Measures].[Store Cost], [Measures].[Store
Sales]} ON columns,
DOLAP 2007 34
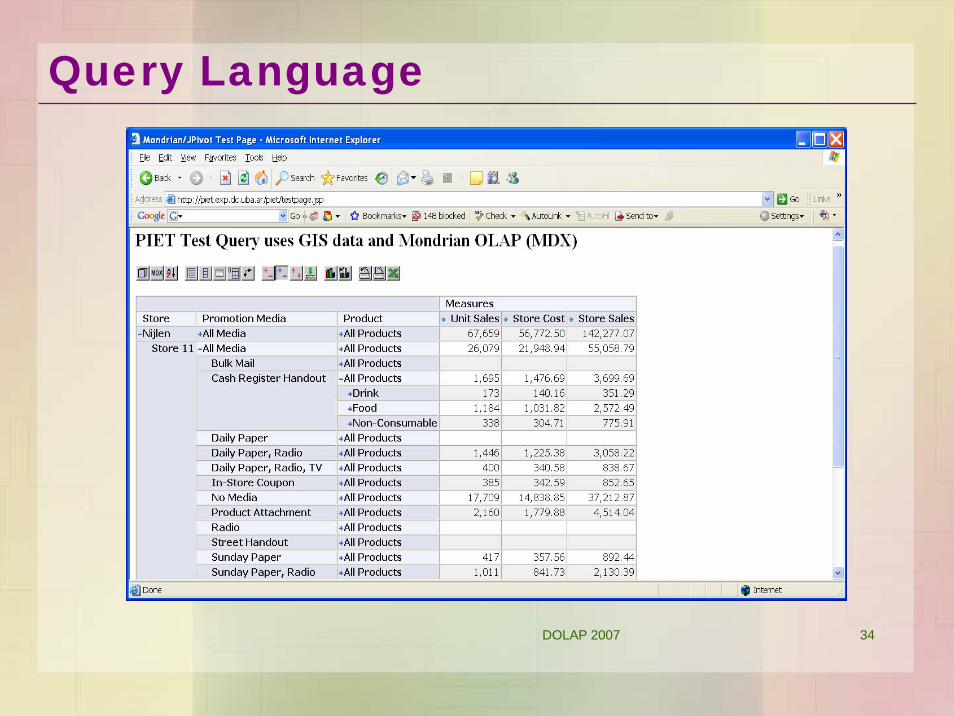
Query Language
DOLAP 2007 35
Outline
• GIS-OLAP motivation
• Query Language
• Data Model
• Implementation Details
• Experimental Results
• Conclusion

DOLAP 2007 36
The GIS dimension schema has three parts
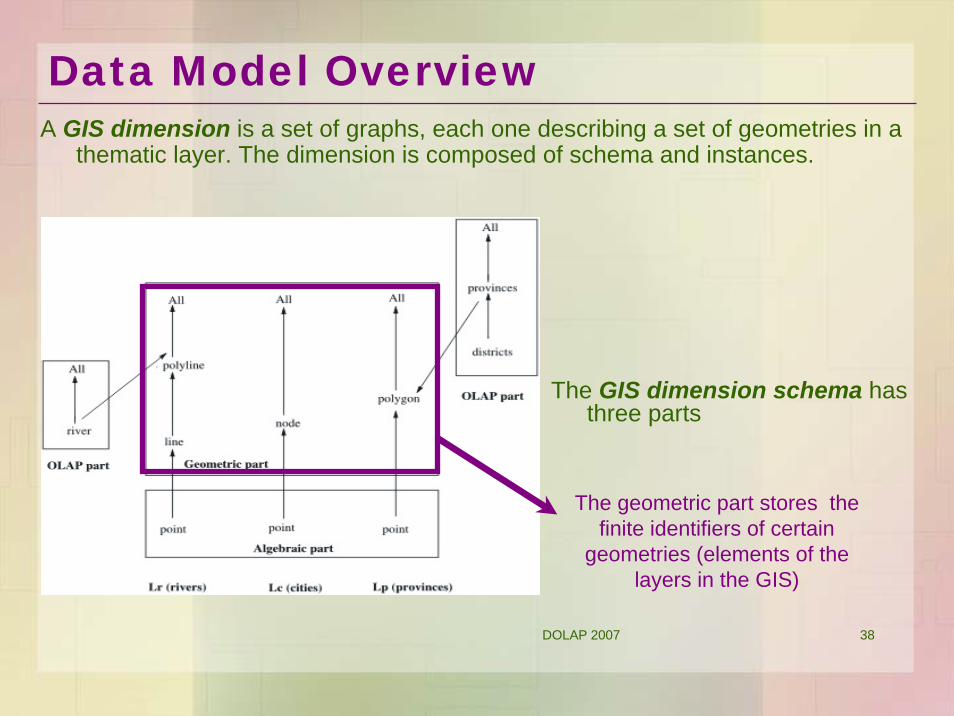
A GIS dimension is a set of graphs, each one describing a set of geometries in a thematic layer. The dimension is composed of schema and instances.
Data Model Overview

DOLAP 2007 37
Data Model Overview
The GIS dimension schema has three parts
The algebraic part contains the infinite points in a layer and could be described by means of linear
algebraic equalities and inequalities
A GIS dimension is a set of graphs, each one describing a set of geometries in a thematic layer. The dimension is composed of schema and instances.
DOLAP 2007 38
Data Model Overview
The GIS dimension schema has three parts
The geometric part stores the finite identifiers of certain
geometries (elements of the layers in the GIS)
A GIS dimension is a set of graphs, each one describing a set of geometries in a thematic layer. The dimension is composed of schema and instances.

DOLAP 2007 39
Data Model Overview
The GIS dimension schema has three parts
The OLAP part stores non-spatial data
A GIS dimension is a set of graphs, each one describing a set of geometries in a thematic layer. The dimension is composed of schema and instances.
DOLAP 2007 40
Data Model Overview
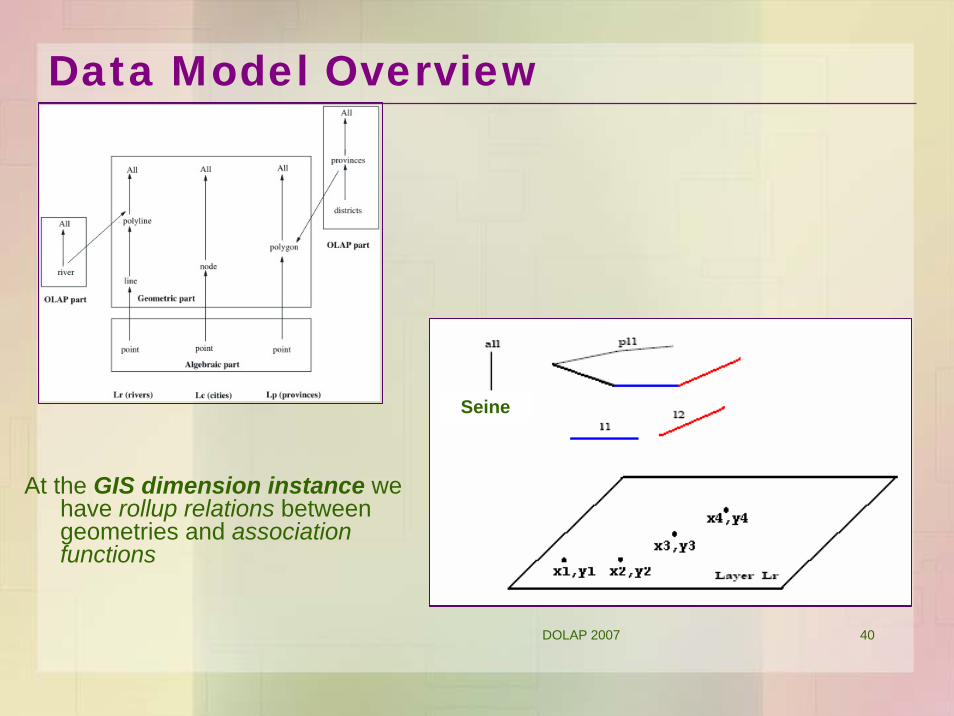
At the GIS dimension instance we have rollup relations between geometries and association functions
Seine

DOLAP 2007 41
Seine
At the GIS dimension instance we have rollup relations between geometries and association functions
Data Model Overview

DOLAP 2007 42
Seine
At the GIS dimension instance we have rollup relations between geometries and association functions
Data Model Overview

DOLAP 2007 43
Seine
At the GIS dimension instance we have rollup relations between geometries and association functions
Data Model Overview
DOLAP 2007 44
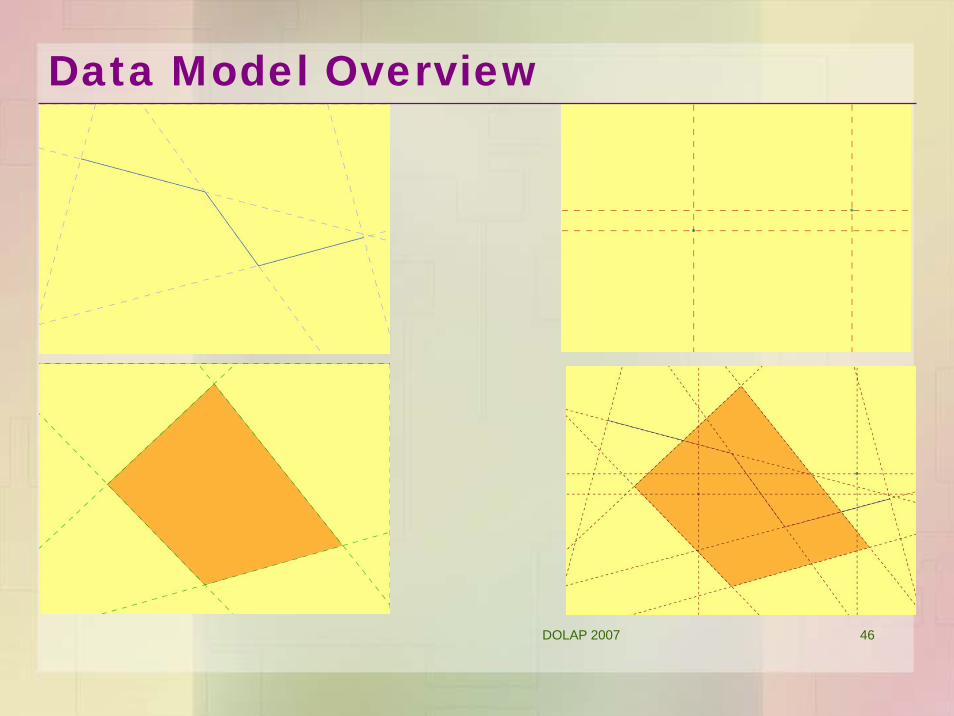
1) The sub-polygonization strategyDecomposes each thematic GIS layer into sub-geometries (open convex
polygons, open line segments and points) using the concept of carrier lines.
Piet processing technique
Data Model Overview

DOLAP 2007 45
Example
Data Model Overview
DOLAP 2007 46
Data Model Overview
DOLAP 2007 47
Data Model Overview
DOLAP 2007 48
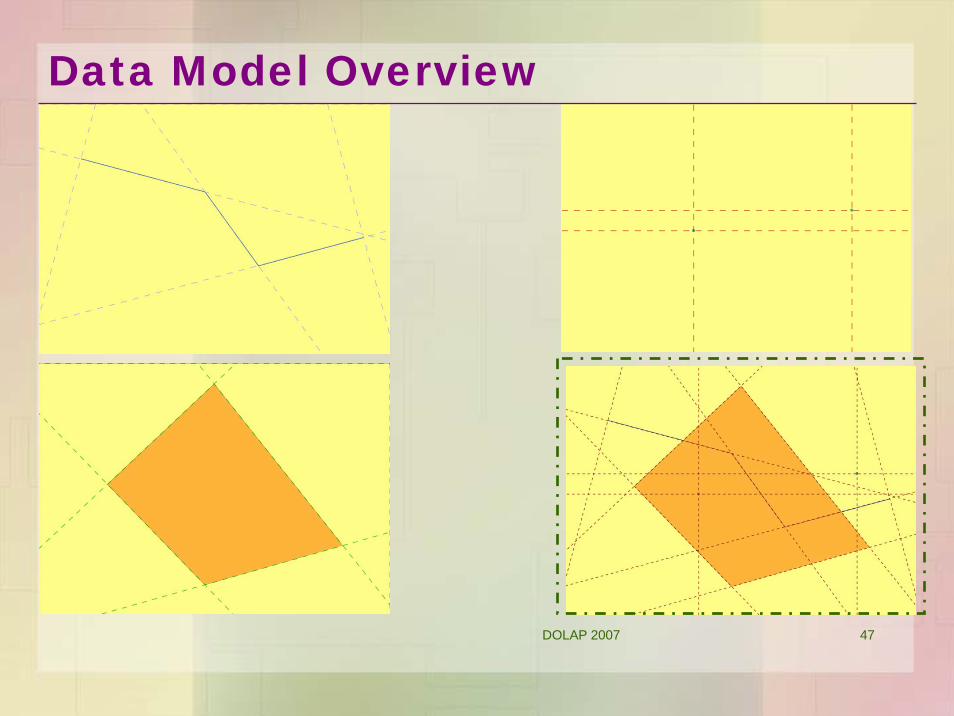
1) The sub-polygonization strategyDecomposes each thematic GIS layer into sub-geometries (open convex
polygons, open line segments and points) using the concept of carrier lines.
Piet processing technique
Data Model Overview
2) Preoverlay of layers
All geometries in common are pre-computed and stored in the database.
3) Evaluate queries using the pre-computed geometries in commonThese shared geometries between layers are used to solve queries.
DOLAP 2007 49
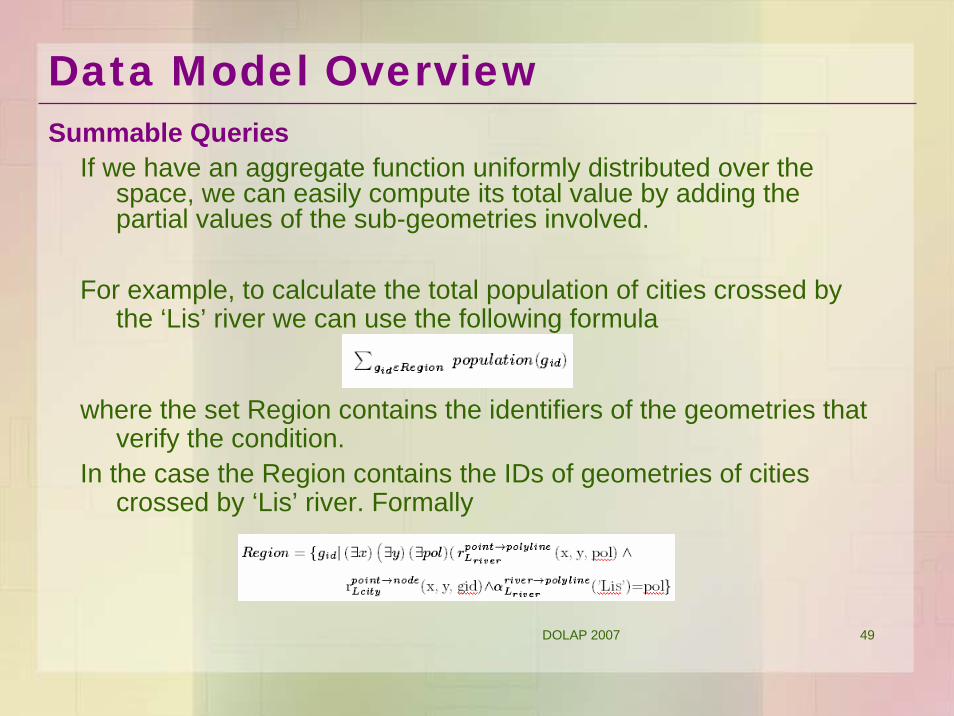
If we have an aggregate function uniformly distributed over the space, we can easily compute its total value by adding the partial values of the sub-geometries involved.
For example, to calculate the total population of cities crossed by the ‘Lis’ river we can use the following formula
where the set Region contains the identifiers of the geometries that verify the condition.
In the case the Region contains the IDs of geometries of cities crossed by ‘Lis’ river. Formally
Data Model OverviewSummable Queries
DOLAP 2007 50
Outline
• GIS-OLAP motivation
• Query Language
• Data Model
• Implementation Details
• Experimental Results
• Conclusion

DOLAP 2007 51
• PostgreSQL 8.2.3 database with Postgis 1.2 spatial extensions
• Java 1.5
• OLAP Mondrian (MDX query language)
• Xerces
• Castor
• Tomcat Apache 5.5 WebServer (for Web version)
• Jump 1.2 (for stand-alone version)
Implementation Details

DOLAP 2007 52
ScalabilityReal-world maps present irregularities: holes, bays, gulfs
Implementation Details

DOLAP 2007 53
ScalabilityReal-world maps present irregularities: holes, bays, gulfs
The number of carrier lines induced would become huge, and their interaction become unnecessary as they produce irrelevant partitions and increase the
computational cost of algorithms
Implementation Details

DOLAP 2007 54
Partitioning
Implementation Details

DOLAP 2007 55
Benefits of Partitioning1) Reduce the density of carrier lines, and database volume.2) Partitions that contain no geometries, would not have carrier lines,
therefore they do not produce unnecessary storage.3) The algorithm can easily run in a parallelized environment.4) Only zones with high density of carrier lines can be further divided into
smaller partitions, instead of dividing the entire map in more zones5) If some zone changes over time, it can be re-computed without affecting
the calculated previous zones.
Implementation Details
DOLAP 2007 56
Outline
• GIS-OLAP motivation
• Query Language
• Data Model
• Implementation Details
• Experimental Results
• Conclusion
DOLAP 2007 57
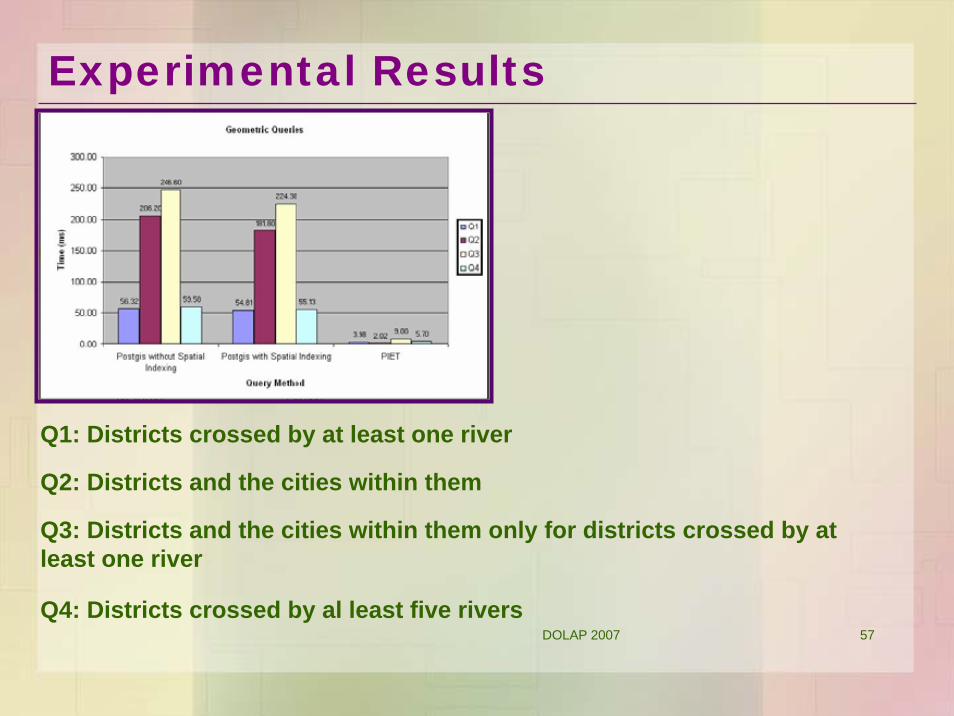
Experimental Results
Q1: Districts crossed by at least one river
Q2: Districts and the cities within them
Q3: Districts and the cities within them only for districts crossed by at least one river
Q4: Districts crossed by al least five rivers
DOLAP 2007 58
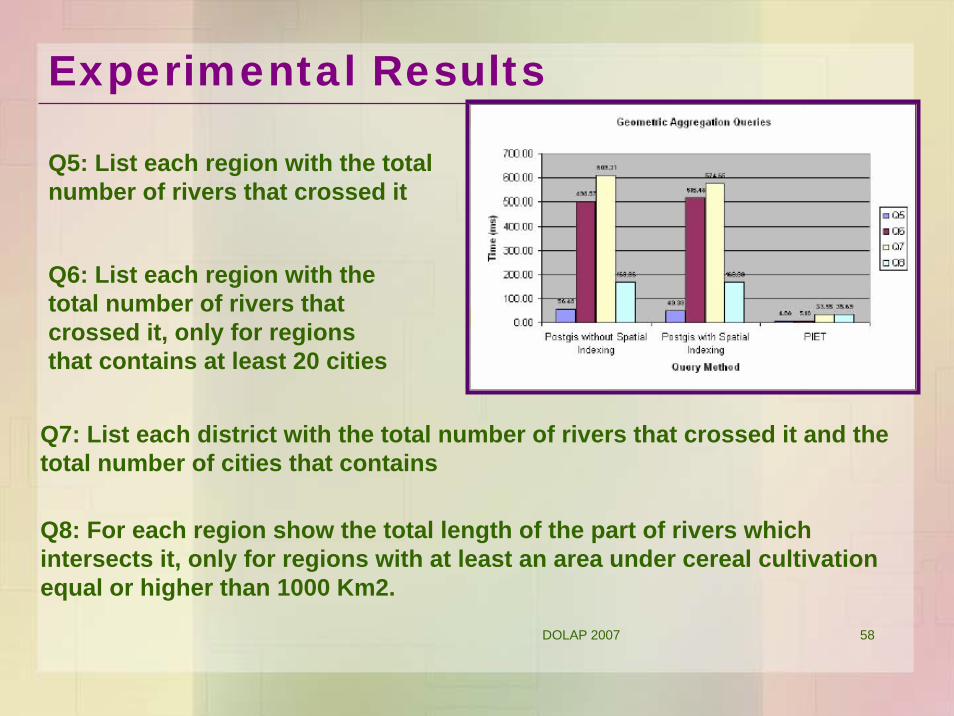
Experimental Results
Q5: List each region with the total number of rivers that crossed it
Q6: List each region with the total number of rivers that crossed it, only for regions that contains at least 20 cities
Q7: List each district with the total number of rivers that crossed it and the total number of cities that contains
Q8: For each region show the total length of the part of rivers which intersects it, only for regions with at least an area under cereal cultivation equal or higher than 1000 Km2.
DOLAP 2007 59
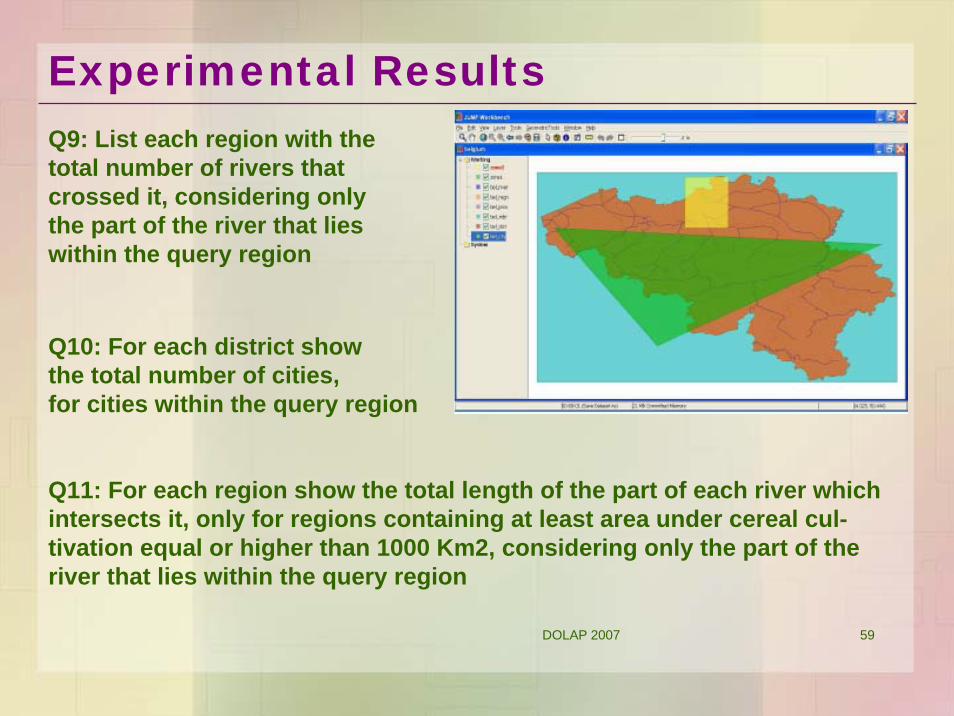
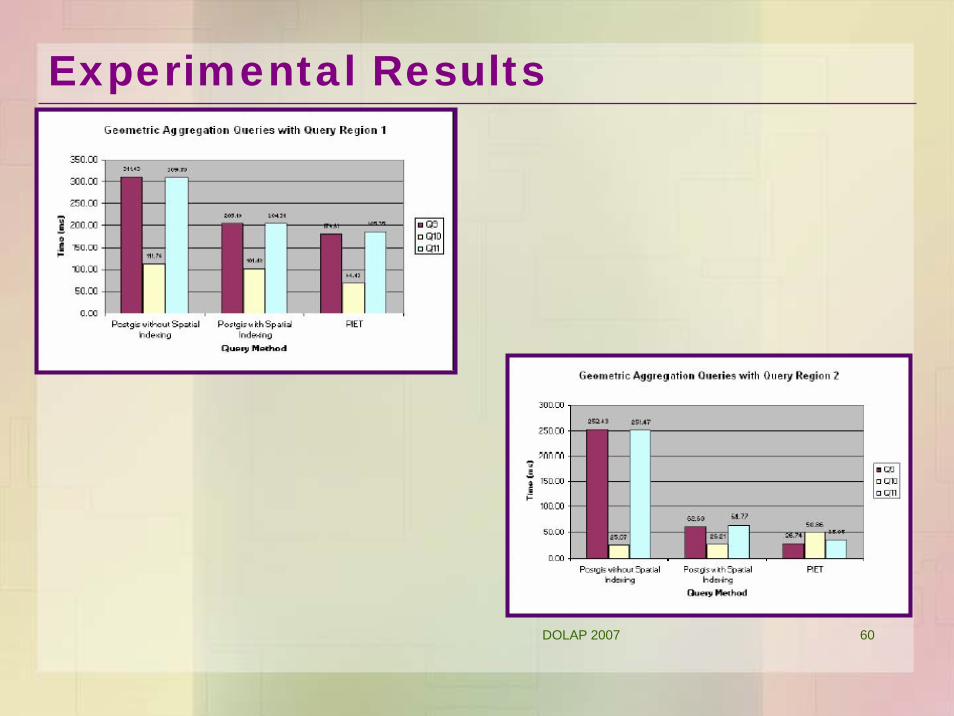
Experimental ResultsQ9: List each region with the total number of rivers that crossed it, considering only the part of the river that lies within the query region
Q10: For each district show the total number of cities, for cities within the query region
Q11: For each region show the total length of the part of each river which intersects it, only for regions containing at least area under cereal cul-tivation equal or higher than 1000 Km2, considering only the part of theriver that lies within the query region
DOLAP 2007 60
Experimental Results

DOLAP 2007 61
Outline
• GIS-OLAP motivation
• Query Language
• Data Model
• Implementation Details
• Experimental Results
• Conclusion

DOLAP 2007 62
1) The data model provides a unified view of GIS and OLAP data
2) This data model can be efficiently implemented
4) Our experiments show that summable queries can be solved without using special indexing techniques.
We can implement all these features, without waiting for extenders to be incorporated in databases. Using tables and B-trees we can reach very good performance
Conclusion
3) The GIS-OLAP Query Language introduced is simple and uses well-known sub-query syntax.
5) Visit our site http://piet.exp.dc.uba.ar/piet
DOLAP 2007 63
Not only integrating OLAP and GIS, but also spatio-temporal data, in the form of trajectories of moving
objects
We are developing specific techniques to reduce the huge volume of the data obtained by sensors without losing relevant information (“Aggregation Languages for Moving Object and Places of Interest Data”[Leticia Gomez,Haesevoets, Bart Kuijpers, and Alejandro Vaisman]).
Ongoing Work