Piedmont Stream Survey – Broad River Basin Completion Report
117
Piedmont Stream Survey – Broad River Basin Completion Report February 28, 2006 Submitted by Jason Bettinger, John Crane, and James Bulak South Carolina Department of Natural Resources
Transcript of Piedmont Stream Survey – Broad River Basin Completion Report

Piedmont Stream Survey – Broad River Basin
Completion Report February 28, 2006
Submitted by
Jason Bettinger, John Crane, and James Bulak
South Carolina Department of Natural Resources

ii
EXECUTIVE SUMMARY
1. We collected 49 fish samples from 45 sites in the upper and lower Broad River drainages during the study. Thirty-eight samples were collected from least impacted sites and 11 samples were collected from randomly chosen sites in the upper Broad River drainage.
2. More than 20,000 fish representing 8 families and 45 species were collected. No
federally-listed threatened or endangered species were collected; however, we did collect 12 fish species of conservation concern. The most commonly collected species included bluehead chub, rosyside dace, yellowfin shiner, sandbar shiner, creek chub, and redbreast sunfish.
3. Macroinvertebrate samples were collected from 37 sites during the study. Those
samples resulted in the collection of more than 11,000 specimens, representing 323 taxa. No federally-listed threatened or endangered taxa were collected; however, we did collect 2 crayfish species and 4 mussel species that are of conservation concern in South Carolina.
4. Basic information on habitat and water quality was collected at each sample
location and a suite of watershed characteristics were calculated for the drainage area of each sample site.
5. The most influential predictors of fish community composition at the sites we
sampled in the Broad River drainages were those associated with natural habitat variation (i.e., stream size and stream topography).
6. Fish community condition index values were calculated for each of the sites
sampled during the current study plus 28 historical sites sampled by the SCDNR. Nine of the sites sampled had “Excellent” fish communities based on our fish condition index and are considered prime candidates for conservation efforts and use as reference sites in future work. Twenty-two sites were identified has having “Poor” fish communities that would likely benefit from appropriate stream restoration activities.

iii
TABLE OF CONTENTS
EXECUTIVE SUMMARY .............................................................................................. ii TABLE OF CONTENTS ................................................................................................ iii LIST OF TABLES........................................................................................................... iv LIST OF FIGURES .......................................................................................................... v Introduction....................................................................................................................... 1 Methods.............................................................................................................................. 2
Site Selection .................................................................................................................. 2 Fish Sampling ................................................................................................................. 3 Macroinvertebrate Sampling........................................................................................... 4 Habitat............................................................................................................................. 5 Statistical Analysis......................................................................................................... 6
Results .............................................................................................................................. 10 Fish................................................................................................................................ 10 Macroinvertebrates ....................................................................................................... 12 Habitat........................................................................................................................... 13
Discussion ........................................................................................................................ 14 Significant deviations...................................................................................................... 22 Recommendations........................................................................................................... 24 Literature Cited .............................................................................................................. 25 APPENDIX 1................................................................................................................... 49
iv
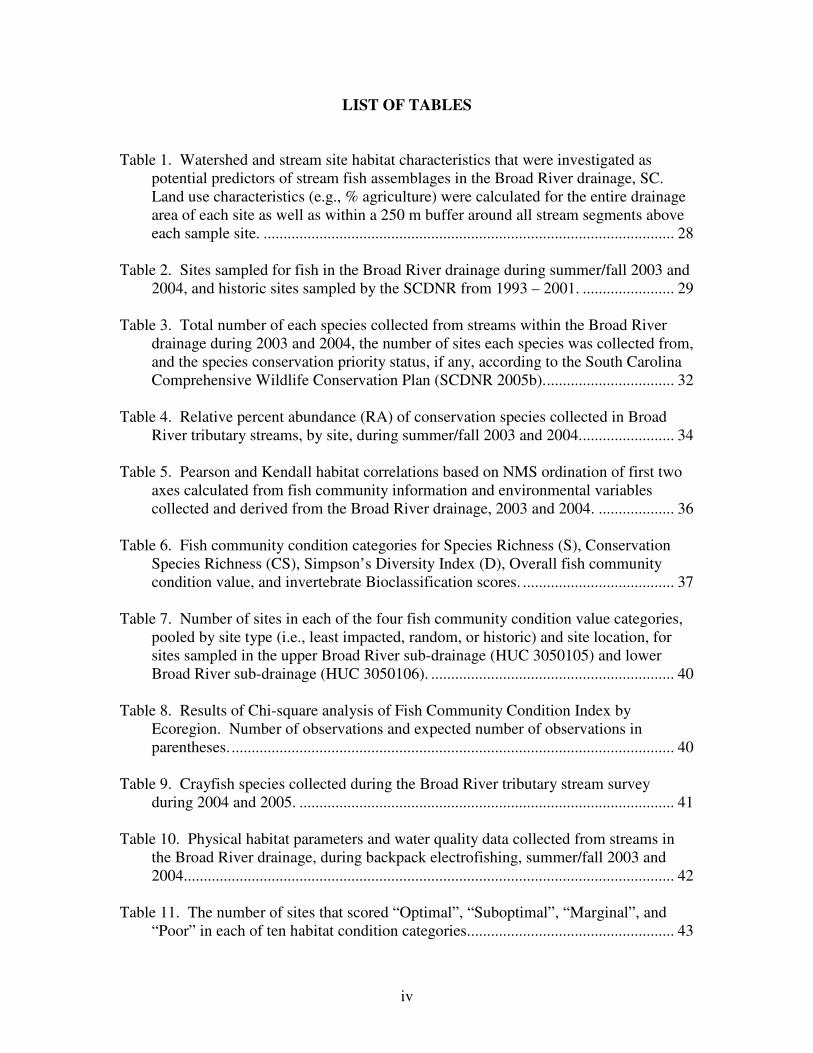
LIST OF TABLES Table 1. Watershed and stream site habitat characteristics that were investigated as
potential predictors of stream fish assemblages in the Broad River drainage, SC. Land use characteristics (e.g., % agriculture) were calculated for the entire drainage area of each site as well as within a 250 m buffer around all stream segments above each sample site. ....................................................................................................... 28
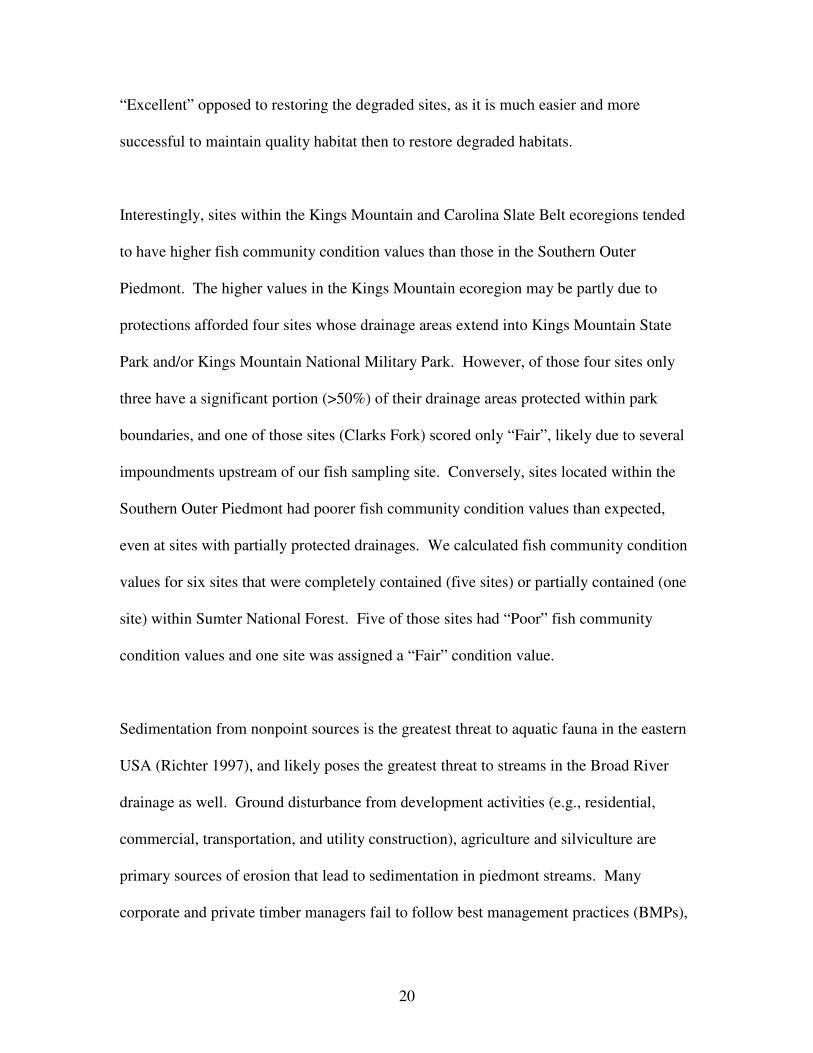
Table 2. Sites sampled for fish in the Broad River drainage during summer/fall 2003 and
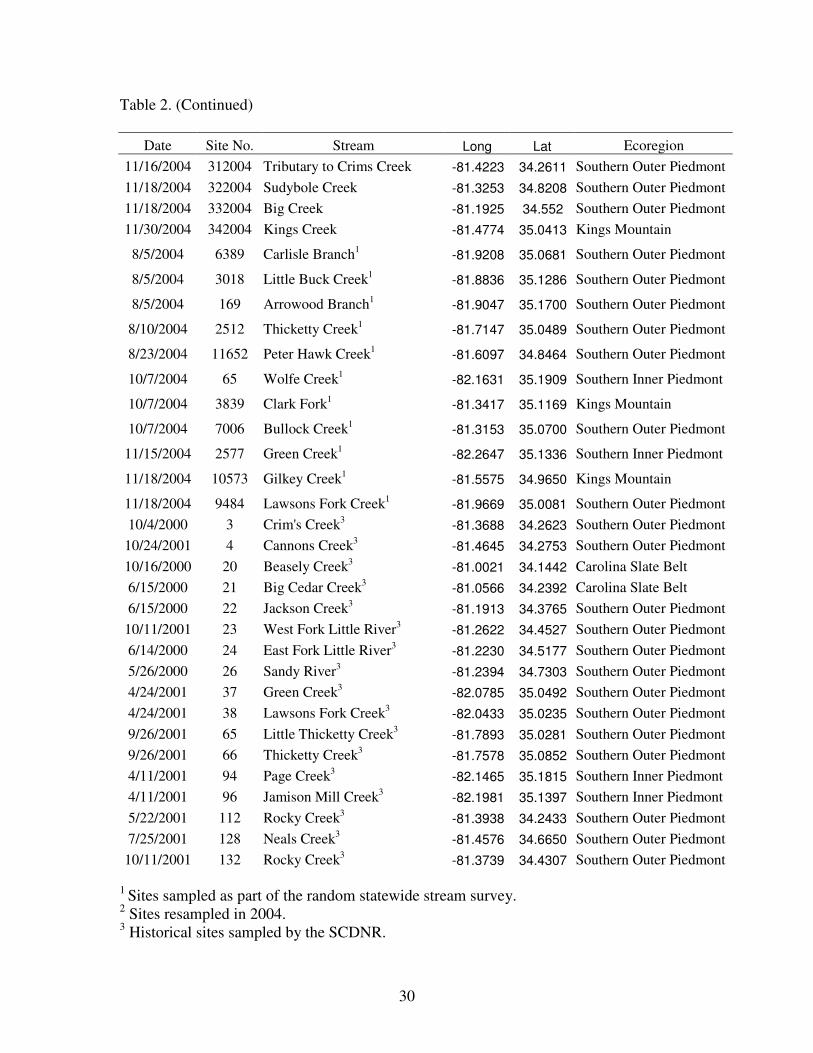
2004, and historic sites sampled by the SCDNR from 1993 – 2001. ....................... 29 Table 3. Total number of each species collected from streams within the Broad River
drainage during 2003 and 2004, the number of sites each species was collected from, and the species conservation priority status, if any, according to the South Carolina Comprehensive Wildlife Conservation Plan (SCDNR 2005b)................................. 32
Table 4. Relative percent abundance (RA) of conservation species collected in Broad
River tributary streams, by site, during summer/fall 2003 and 2004........................ 34 Table 5. Pearson and Kendall habitat correlations based on NMS ordination of first two
axes calculated from fish community information and environmental variables collected and derived from the Broad River drainage, 2003 and 2004. ................... 36
Table 6. Fish community condition categories for Species Richness (S), Conservation
Species Richness (CS), Simpson’s Diversity Index (D), Overall fish community condition value, and invertebrate Bioclassification scores. ...................................... 37
Table 7. Number of sites in each of the four fish community condition value categories,
pooled by site type (i.e., least impacted, random, or historic) and site location, for sites sampled in the upper Broad River sub-drainage (HUC 3050105) and lower Broad River sub-drainage (HUC 3050106). ............................................................. 40
Table 8. Results of Chi-square analysis of Fish Community Condition Index by
Ecoregion. Number of observations and expected number of observations in parentheses. ............................................................................................................... 40
Table 9. Crayfish species collected during the Broad River tributary stream survey
during 2004 and 2005. .............................................................................................. 41 Table 10. Physical habitat parameters and water quality data collected from streams in
the Broad River drainage, during backpack electrofishing, summer/fall 2003 and 2004........................................................................................................................... 42
Table 11. The number of sites that scored “Optimal”, “Suboptimal”, “Marginal”, and
“Poor” in each of ten habitat condition categories.................................................... 43

v
LIST OF FIGURES Figure 1. Random and least impacted sites sampled during 2003 and 2004 and historic
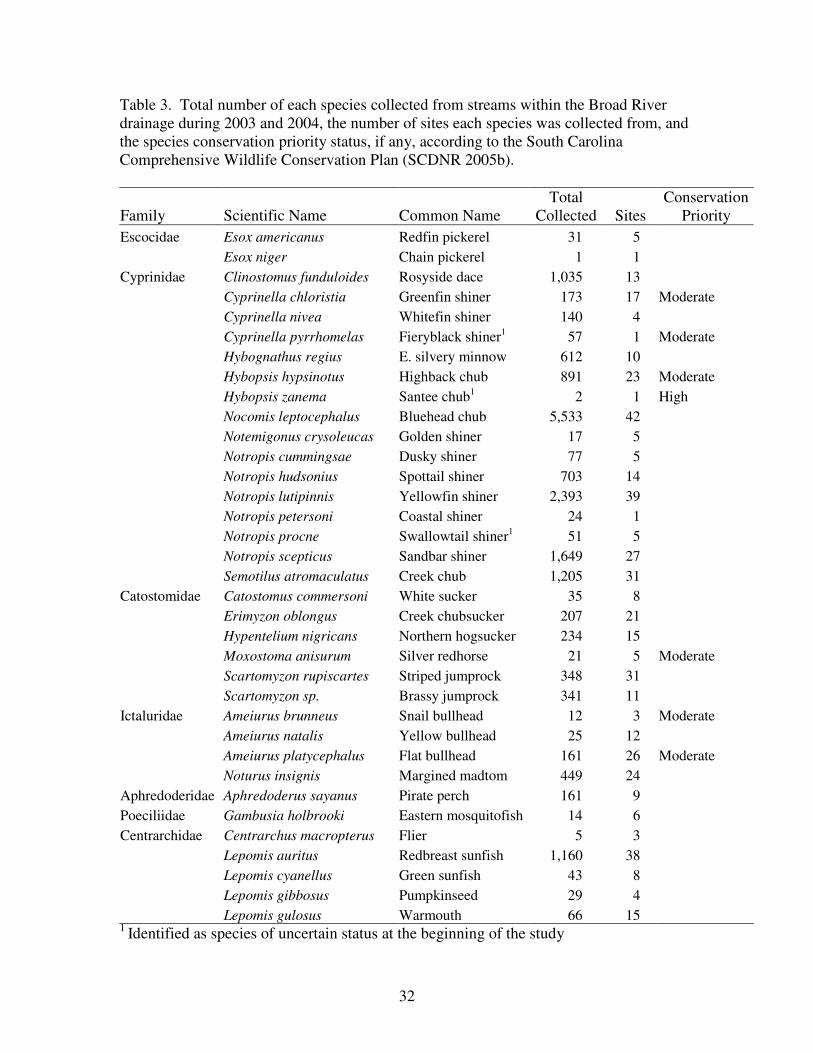
sites sampled from 1993 – 2001 by the SCDNR in the Broad River drainage......... 44 Figure 2. Similarity of fish communities sampled from the Broad River drainage during
2003 and 2004. ........................................................................................................ 45 Figure 3. Similarity of fish communities at sites sampled during both 2003 and 2004 in
Broad River drainage. .............................................................................................. 46 Figure 4. NMS ordination of fish communities sampled from the Broad River drainage
during 2003 and 2004. Sites in close proximity to each other have similar fish communities. Habitat variables that were most strongly correlated to the axes are overlaid. .................................................................................................................... 47
Figure 5. Fish Community Condition Index for sites sampled during the current study, as
well as 28 historic sites sampled from 1993 – 2001 in the Broad River drainage by the SCDNR. .............................................................................................................. 48

Introduction The Piedmont region of South Carolina has undergone extensive development during the
last century and a half. Early on, forests gave way to cropland and pastures. More
recently farmland has been transformed at an accelerating rate by urban, suburban,
commercial, and industrial development. Agricultural development of lands of moderate
slope with erodible soils led to substantial sedimentation in Piedmont streambeds. Runoff
from fields contributed to nutrient loading in streams. Modern soil conservation practices
have reduced those impacts, but pasturage of cattle and other farm animals on lands
adjacent to streams continues to degrade stream banks and channels and affect water
quality. Timber harvest, instream sand and gravel mining, road and bridge construction,
and dam construction are similarly destructive of Piedmont stream habitat, and have
potentially adverse effects on fish and other aquatic organisms. These and other practices
have altered the natural ecological conditions of Piedmont streams and rivers and placed
considerable stress on fish and other biological aquatic resources.
A comprehensive survey of Piedmont streams was needed to define the present status of
their biotic resources. Fish species of uncertain status in Broad River drainage streams
included thicklip chub Cyprinella labrosa, fieryblack shiner C. pyrrhomelas, Santee chub
C. zanema, whitemouth shiner Notropis alborus, greenhead shiner Notropis
chlorocephalus, swallowtail shiner N. procne, V-lip redhorse Moxostoma pappillosum,
robust redhorse M. robustum, Carolina darter Etheostoma collis, fantail darter E.
flabellare, and Piedmont darter Percina crassa. Additional information was needed to
adequately characterize their current population status. Information obtained on species

2
distribution and relative abundance, combined with an inventory of ecological conditions
and an assessment of habitat quality, will provide resource managers and planners with a
sound baseline for making future management and conservation decisions. The
information will also be useful in identifying least impacted habitats that should be
protected, as well as targeting habitat restoration activities in areas that have degraded
aquatic communities.
This survey concentrated on the Broad River drainage. The Broad River drainage was
selected because of ongoing hydroelectric re-licensing activities and its relatively high
conservation potential. The primary objectives for this study were to: (1) conduct a
comprehensive fish community inventory of wadeable streams of the upper Broad (U.S.
Geological Survey hydrologic unit 3050105) and lower Broad (hydrologic unit 3050106)
sub-drainages; (2) obtain basic information on habitat and water quality at the study sites;
(3) compile all new and pertinent historic data into a publicly accessible geographic
database; (4) develop a preliminary list of species having the greatest conservation need;
and (5) identify opportunities for conducting habitat conservation and/or restoration
activities expected to have a beneficial effect on aquatic communities generally and on
those fish species of special concern in particular.
Methods
Site Selection
Fish sample locations were chosen that were perceived to have the greatest chance of
harboring species of conservation concern (i.e., least impacted sites). A GIS database for

3
the two Broad River sub-drainages was constructed to aid in the selection of least
impacted sites and to ensure that sites were selected proportionally among ecoregions and
basins. The database included information on land use, point-source discharge sites,
stream order, ecoregions, drainage basins, and roads. We divided all 1st though 3rd order
streams in the Broad River drainage into 100 m sampling units. Using the GIS we
eliminated sampling units that were in close proximity to urban areas (within 2 km),
agricultural operations (within 0.5 km), roads (within 50 m), and NPDES discharge sites
(3 km). Sample sites were then randomly selected from the remaining least impacted
sample units. Ultimately, a site was sampled if, after a visual inspection, it appeared to
have relatively good habitat and reasonable access. Several of the least impacted sites
were sampled in both years of the study to explore temporal variability and sampling
precision. In addition, a group of entirely randomly selected sites in the upper Broad
River sub-drainage was sampled as part of an ongoing statewide stream inventory.
Fish Sampling
Streams were sampled following South Carolina Department of Natural Resources
(SCDNR) protocols for sampling fish in wadeable streams (Thomason et al. 2002) during
the summer and fall of 2003 and 2004. At each sample site a stream reach of at least 100
m, depending on stream width, that contained representative habitat was selected for
sampling. Block nets were placed at the upper and lower limits of the sample reach. One
to four Smith-Root™ 24-volt battery-powered backpack electrofishing units were used to
make three consecutive upstream passes through the sample reach. One unit was used for
every 3 m of stream width. If a new species was encountered on the third electrofishing
4
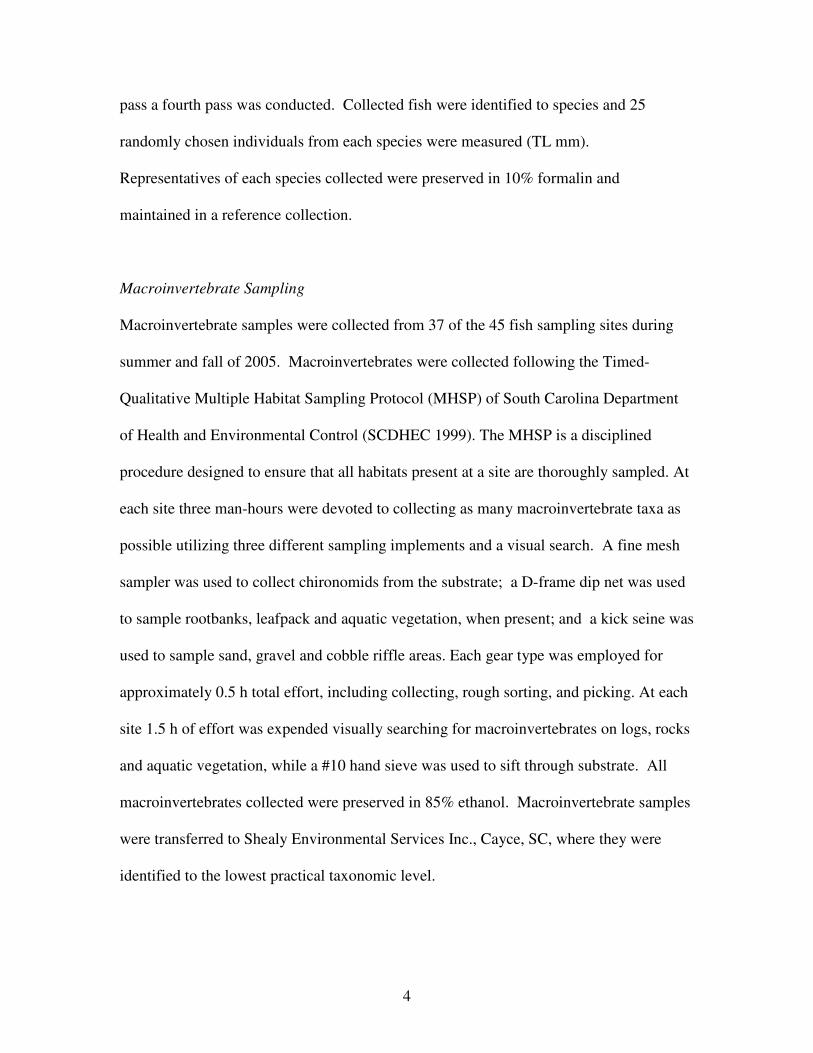
pass a fourth pass was conducted. Collected fish were identified to species and 25
randomly chosen individuals from each species were measured (TL mm).
Representatives of each species collected were preserved in 10% formalin and
maintained in a reference collection.
Macroinvertebrate Sampling
Macroinvertebrate samples were collected from 37 of the 45 fish sampling sites during
summer and fall of 2005. Macroinvertebrates were collected following the Timed-
Qualitative Multiple Habitat Sampling Protocol (MHSP) of South Carolina Department
of Health and Environmental Control (SCDHEC 1999). The MHSP is a disciplined
procedure designed to ensure that all habitats present at a site are thoroughly sampled. At
each site three man-hours were devoted to collecting as many macroinvertebrate taxa as
possible utilizing three different sampling implements and a visual search. A fine mesh
sampler was used to collect chironomids from the substrate; a D-frame dip net was used
to sample rootbanks, leafpack and aquatic vegetation, when present; and a kick seine was
used to sample sand, gravel and cobble riffle areas. Each gear type was employed for
approximately 0.5 h total effort, including collecting, rough sorting, and picking. At each
site 1.5 h of effort was expended visually searching for macroinvertebrates on logs, rocks
and aquatic vegetation, while a #10 hand sieve was used to sift through substrate. All
macroinvertebrates collected were preserved in 85% ethanol. Macroinvertebrate samples
were transferred to Shealy Environmental Services Inc., Cayce, SC, where they were
identified to the lowest practical taxonomic level.

5
Although we did not use any methods that specifically targeted mussels and crayfish, live
native unionids were noted when encountered during visual macroinvertebrate searches.
Representative crayfish samples were collected when encountered during both
macroinvertebrate and fish sampling. Crayfish were identified to species when practical
by John Cooper (North Carolina Museum of Natural Sciences), Jennifer Price (SCDNR)
or Shealy Environmental Services.
Habitat
Physical and chemical habitat data were collected at each site. We measured water
temperature, dissolved oxygen, conductivity, and pH using a YSI Model 556 multi-probe
meter, and turbidity using a LaMotte Model 2020 turbidimeter at each fish and
macroinvertebrate sampling site. We also calculated average stream width and average
depth at each sampling site. Average stream width was determined by measuring the
wetted stream width at the downstream limit of each sample reach and then every 25 m to
the upstream limit of the sample reach. Average depth was determined by measuring
water depth at three positions along each transect where wetted width was measured.
Stream habitat quality was assessed with the U.S. Environmental Protection Agency’s
(EPA) Rapid Bioassessment Visual Estimation Technique (Barbour 1999). That habitat
assessment technique involves scoring 10 habitat parameters (e.g., sediment deposition)
from 1 – 20 and then classifying the scoring for each habitat parameter as “Optimal”,
“Suboptimal”, “Marginal” or “Poor” by quartile. We calculated an overall habitat
condition score by summing the scores of each habitat parameter by site and classifying
those scores into one of the four classifications (e.g., “Optimal”) by quartile. In addition

6
to collecting habitat data at the site level we also collected habitat information at the
watershed level using ArcGIS® (ArcMapTM 9.1, Environmental Systems Research
Institute, Redlands, California). For each sample location we delineated the drainage
area using the Spatial Analyst Extension in ArcGIS. We then calculated numerous
watershed characteristics for each of the sampled sites (Table 1). Land use characteristics
(e.g., % agriculture) were derived from SCGAP data, which is based on 30-m resolution
satellite imagery collected from 1991 through 1993 (SCGAP 2001). Land use
characteristics were calculated for the entire drainage area of each site as well as within a
250 m buffer around all stream segments above the sample site.
Statistical Analysis
A cluster analysis was used to group sites based on the similarity of their fish
communities (McCune et al. 2002). Fish catch data from sites that were sampled during
both years were pooled across years and averaged to eliminate the potential influence of
repetitive sampling on the subsequent analysis of the association between fish community
composition and environmental variables. Three sites considered to be outliers were
eliminated from the analysis to remove their impact on the hierarchical classification of
groups. Two of the eliminated sites (82003 and 42003) had extremely small drainage
areas with depauperate fish populations where only 2 and 11 fish were collected,
respectively. The third site (222004) was impacted by a beaver pond and contained a
drastically different fish community than the other sites. A fourth root power
transformation was applied to the fish catch data to minimize large differences in

7
abundance among sites (Clarke 1993). The Sorensen (Bray-Curtis) distance equation was
used to calculate similarity, and groups were linked with the flexible beta method (-0.25).
Cluster analysis was also used to investigate temporal variation and sampling precision at
sites that were sampled during both 2003 and 2004. That cluster analysis included only
those sites that were sampled during both years and followed the same methods described
above, except fish catch data was not pooled across years.
In addition to cluster analysis, we also used the non-metric multidimensional scaling
(NMS) method (Clarke 1993) to ordinate the sample sites. NMS is useful in ecological
data analysis because it is appropriate for data sets that are non-normal, discontinuous or
contain many zeros (Clarke 1993; McCune and Mefford 1999). The NMS was
performed on the same transformed data set as the cluster analysis and used the same
Sorensen distance equation. The NMS ordination was plotted and coded for the site
groupings determined in the cluster analysis to highlight similarities between the two
methods.
To investigate the association between environmental variables (Table 1) and fish
community composition a habitat matrix was constructed and plotted against the NMS
ordinations.
To identify sites that contained “high quality” fish communities we calculated an overall
fish community condition value for each of the sites we sampled, as well as 28 additional

8
sites previously sampled by the SCDNR in the Broad River drainage. The fish
community condition value was based on three metrics: species richness, conservation
species richness, and Simpson’s diversity index. Three conservation species (snail
bullhead, flat bullhead and highback chub) were removed from the conservation species
richness metric. The two bullhead species were removed because they are of conservation
concern more because of nonnative species introductions (i.e., flathead catfish) than
habitat sensitivities (SCDNR 2005a). Highback chub was removed because it was so
prevalent in our samples that it did not seem to be a good indicator of habitat quality.
Because species richness (and potentially conservation species richness) is highly
correlated with drainage size (Karr 1981), linear regression was used to correct those two
metrics for drainage area. Simpson’s diversity index was calculated as
�=
��
���
�
−−
=s
i
ii
NNnn
1 )1()1(
D ,
where ni = Number of individuals of species i in the sample
N = Total number of individuals in the sample
s = Number of species in the sample.
Each of the metrics was classified by site into one of four classes and assigned a
numerical value (poor = 1, fair = 2, good = 3, or excellent = 4), using ArcGIS® based on
the Natural Breaks classification method (also known as Jenks’ Method) (Jenks 1977).
The Natural Breaks method assigns data into classes so that the variances within all
classes are minimized, while variances among classes are maximized. The three
classified metrics were then averaged and those values were again classified using the
Natural Breaks method to assign an overall fish community condition value to each site.
A Wilcoxon Two-Sample Test was used to investigate differences in fish community
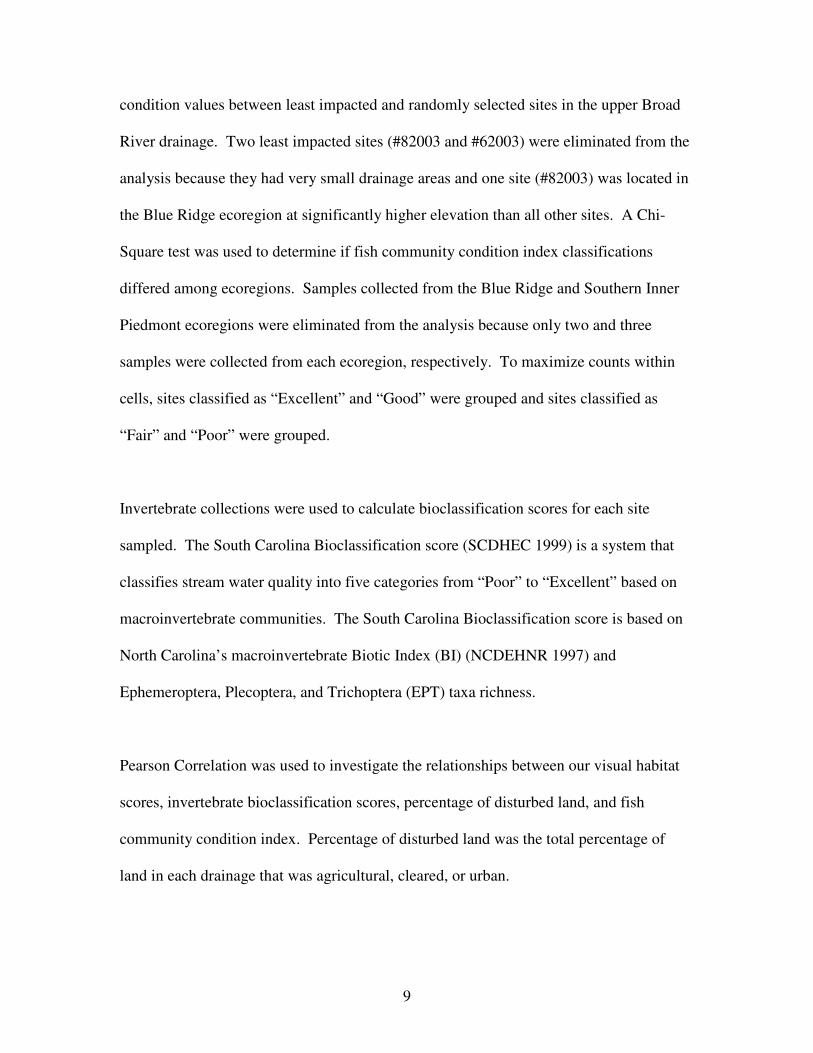
9
condition values between least impacted and randomly selected sites in the upper Broad
River drainage. Two least impacted sites (#82003 and #62003) were eliminated from the
analysis because they had very small drainage areas and one site (#82003) was located in
the Blue Ridge ecoregion at significantly higher elevation than all other sites. A Chi-
Square test was used to determine if fish community condition index classifications
differed among ecoregions. Samples collected from the Blue Ridge and Southern Inner
Piedmont ecoregions were eliminated from the analysis because only two and three
samples were collected from each ecoregion, respectively. To maximize counts within
cells, sites classified as “Excellent” and “Good” were grouped and sites classified as
“Fair” and “Poor” were grouped.
Invertebrate collections were used to calculate bioclassification scores for each site
sampled. The South Carolina Bioclassification score (SCDHEC 1999) is a system that
classifies stream water quality into five categories from “Poor” to “Excellent” based on
macroinvertebrate communities. The South Carolina Bioclassification score is based on
North Carolina’s macroinvertebrate Biotic Index (BI) (NCDEHNR 1997) and
Ephemeroptera, Plecoptera, and Trichoptera (EPT) taxa richness.
Pearson Correlation was used to investigate the relationships between our visual habitat
scores, invertebrate bioclassification scores, percentage of disturbed land, and fish
community condition index. Percentage of disturbed land was the total percentage of
land in each drainage that was agricultural, cleared, or urban.

10
All multivariate analysis was conducted with PC-ORD software for the analysis of
ecological data (McCune and Mefford 1999). All other statistical tests were performed in
SAS (SAS 1988).
Results
Fish
Forty-nine fish samples were collected from 45 sites during the study (Table 2, Figure 1).
Thirty-eight samples were collected from least impacted sites and 11 were collected from
random sites in the upper Broad River drainage as part of the statewide stream sampling
program. Four of the least impacted sites were sampled during both 2003 and 2004.
More than 20,000 fish representing 8 families and 45 species were collected (Table 3).
The most abundant fish was bluehead chub, accounting for nearly 28% of all fish
collected and present at 42 of the 45 sampling locations. Other commonly encountered
fish included rosyside dace, yellowfin shiner, sandbar shiner, creek chub, and redbreast
sunfish. Each species represented more than 5% of all fish collected. The rarest fish in
our samples included chain pickerel, Santee chub, flier, and black crappie. Four species -
fieryblack shiner, Santee chub, chain pickerel and coastal shiner - were collected at only
one site.
Six of the eleven species identified as species of uncertain status at the beginning of this
project and 12 species of conservation concern (SCDNR 2005b) were collected from
streams in the Broad River drainage (Table 3). Five of the species of uncertain status

11
collected were also conservation species. Only swallowtail shiner was not on both lists.
Five species identified as species of uncertain status at the beginning of the study were
not collected during our survey. Those species included whitemouth shiner, greenhead
shiner, thicklip chub, V-lip redhorse and robust redhorse. The number of conservation
species at each site ranged from 0 at seven sites to 8 at site 342004 (Table 4). Most sites
(82%) where conservation species were encountered contained three or fewer
conservation species. Total relative abundance (RA) of species of conservation concern
varied by site, from 0 at seven sample sites to 32% at site 182003. Species of
conservation concern accounted for nearly 9% of all fish collected and at least one
species of conservation concern was collected at 38 of the 45 sample sites. Highback
chub was, by far, the most abundant species of conservation concern, occurring at 23
sites and accounting for nearly half the RA of all conservation species. Most other
species of conservation concern accounted for less than 1% of the total fish collected.
Cluster analysis indicated there were five main fish community types in the Broad River
sub-drainages (Figure 2). Cluster analysis of sites that were sampled in both 2003 and
2004 indicated that there was little temporal variation and high sampling precision
between years (Figure 3). All four of the sites sampled during both years clustered close
together with 90% or more of the information remaining between them.
NMS ordination produced similar groupings as the cluster analysis (Figure 4). The NMS
analysis resulted in a three-dimensional solution with a final stress of 12.0. Based on
Monte Carlo simulations, each dimension obtained in the analysis was significant (P =

12
0.032). The three ordination axes together explained 89.9% of the variation in the
dissimilarity matrix. Axis 1 accounted for most of the variation (66.7%) while axis 2 and
3 explained 17.3% and 5.8%, respectively. Stream width, depth, gradient, elevation, and
drainage area (ha) were the most influential predictors of the ordination axes (Table 5,
Figure 4).
Fish community condition values were assigned to each of the sites sampled during 2003
and 2004 as well as 28 historic sites sampled by the SCDNR between 1993 and 2001
(Table 6, Figure 5). The only sites that scored “Excellent” were least impacted locations
sampled during the current study (Table 7). Least impacted sites in the upper Broad
River sub-drainage had significantly higher fish community condition values than
randomly selected sites in the same sub-drainage (Wilcoxon; P = 0.02).
There was a significant difference in fish community condition classifications among
ecoregions (Chi-Square; P = 0.002) (Table 8). The Kings Mountain and Carolina Slate
Belt ecoregions had more sites classified as “Excellent – Good” and fewer sites classified
as “Fair – Poor” than expected. Conversely, the Southern Outer Piedmont had fewer sites
classified as “Excellent – Good” and more sites classified as “Fair – Poor” than expected.
Macroinvertebrates
Macroinvertebrate samples were collected from 37 sites; the results of those collections
are included in a report prepared by Shealy Environmental Services, attached as

13
Appendix 1. Bioclassification scores ranged from Fair to Good, with the majority of sites
classified as “Good” or “Good-Fair” (Table 6 ).
Live crayfish were collected from 26 sites during the fish and macroinvertebrate surveys
(Table 9, Appendix 1). Twelve species or forms of crayfish were identified (Table 9).
Two of those species (Cambarus howardi and Cambarus spicatus) are considered to be
of conservation concern in South Carolina (SCDNR 2005b). Live native unionids were
observed at only one site (3839, Clarks Fork) during our survey. Live mussels at the site
were abundant. We identified four species: Elliptio producta, Elliptio angustata, Elliptio
complanata, and Villosa delumbis. All four of the mussel species we collected are
considered to be of conservation concern in South Carolina (SCDNR 2005b).
Habitat
The water quality and physical parameters we measured at each site are reported in Table
10. Mean widths of our sample sites ranged from 1.4 m to 14.2 m and averaged 5 m.
The average stream depth was 0.18 m (range, 0.05 – 0.39 m). Dissolved oxygen ranged
from 4.5 to 12.0 mg/L, pH values ranged from 4.6 to 7.3, conductivity ranged from 17 to
227 ΦS and turbidity ranged from 0.7 to 11.1 NTU. When water quality data were
plotted spatially in our GIS no spatial relationships were observed. However, there was a
negative linear relationship between conductivity and elevation (as elevation increased
conductivity decreased). Visual habitat scoring resulted in optimal overall habitat
condition for 21 of the 45 sites surveyed. Eighteen sites had suboptimal overall habitat
condition and six sites had marginal overall habitat condition (Table 11).

14
Pearson correlation analysis indicated that there was a significant relationship (P < 0.05)
between our visual habitat scores and fish community condition index, invertebrate
bioclassification and percentage of disturbed land. A positive relationship was observed
between visual habitat scores and fish community condition index (r = 0.38) and between
visual habitat scores and bioclassification (r = 0.48). A negative relationship was
observed between visual habitat scores and percentage of disturbed land in the drainage
area (r = -0.24). There was not a significant relationship between fish community
condition index and invertebrate bioclassification.
Discussion
Six of the eleven species identified as species of uncertain status at the beginning of this
project and 12 species of conservation concern (SCDNR 2005b) were collected from
streams in the Broad River drainage. In general, our survey collections of streams in the
Broad River drainage support the conservation status of fishes outlined in the South
Carolina Comprehensive Wildlife Conservation Plan (SCCWCP) (SCDNR 2005b).
Fieryblack shiner is restricted to the to the Santee and Pee Dee River systems above the
Fall Line in North Carolina and South Carolina. We only collected fieryblack shiner at
one site during our survey; its limited distribution throughout South Carolina and North
Carolina coupled with its rarity in our survey support its inclusion in the list of
conservation concern species. Only two individuals of Santee chub were collected from
one site during our survey. The Santee chub is restricted to the Broad and Saluda River
drainages in the upper Santee basin. Like the fieryblack shiner, the restricted distribution

15
of Santee chub and its rarity in our collections support its inclusion in the list of
conservation concern species. Swallowtail shiner was listed as a species of uncertain
status at the beginning or our study, but was not identified as a species of conservation
concern in the SCCWCP (SCDNR 2005b). Swallowtail shiner in South Carolina is
considered by NatureServe (2004) to be imperiled and was relatively rare in our
collections (51 individuals were collected from 5 sites). As such it may warrant inclusion
in the list of conservation concern species.
Each of the darter species identified as species of uncertain status at the beginning of this
study are included in the SCCWCP list of species of conservation concern (SCDNR
2005b); based on the current survey that status is warranted. There are, however, some
taxonomic discrepancies with two of the species. The broader Carolina darter
Etheostoma collis does not occur in the Broad River drainage, but is restricted, in South
Carolina, to the Catawba River drainage (Fred Rohde, personal communication). We did,
however, collect the Saluda form of the Carolina darter, Etheostoma saludae, which is
considered to be an evolutionary significant unit of the broader Carolina darter (Joe
Quattro, personal communication). That species/form was more common than
anticipated. We collected 96 individuals from eight different locations. However, based
on its narrow range endemism, restricted to the upper Congaree, Saluda and Broad River
drainages, its status as a species of conservation concern is warranted. The form of
fantail darter we collected has been named the “Carolina” fantail darter Etheostoma
flabellare brevispina (Warren et al. 2000) and may warrant species level differentiation
from the broader fantail darter (Blanton 2001). The E. f. brevispina form is endemic to

16
the Piedmont and Blue Ridge sections of the upper Pee Dee and Santee River drainages
in South Carolina (Warren et al. 2000). We collected 51 individuals of the “Carolina”
fantail darter from four sites in the upper Broad River drainage. Its limited global
distribution and rarity in our survey of the Broad River drainage support its status as a
species of conservation concern in South Carolina. Those species identified in Table 3 as
species of conservation concern, plus swallowtail shiner, should be considered species of
conservation concern within the Broad River drainage.
Five species identified as species of uncertain status at the beginning of this project were
not collected. Two of those species, whitemouth shiner and greenhead shiner, are likely
not currently present in the Broad River drainage. In South Carolina, whitemouth shiner
is apparently restricted to the slate belt region of the upper Lynches and Pee Dee systems
(SCDNR 2005a), and greenhead shiner is endemic and thus restricted to the Catawba
River drainage (Rohde et al. 1994). Although V-lip redhorse is present, although
uncommon, in the mainstem of the Broad River (Bettinger et al. 2003) we did not collect
any in its tributary streams. V-lip redhorse typically inhabit larger streams and medium-
sized rivers (Jenkins and Burkhead 1993) so its absence in our survey of small to
medium-sized streams was not unexpected. Naturally-reproducing populations of robust
redhorse in South Carolina are currently known only from the Savannah River and Pee
Dee River (SCDNR 2005a). While it has recently been stocked into the mainstem of the
Broad River, its potential utilization of smaller streams in the Broad River drainage is
unknown. We did not collect any thicklip chub during our survey which was surprising.

17
Thicklip chub are common in the mainstem of the Broad River (Bettinger et al. 2003) and
may prefer larger streams.
Although our crayfish and mussel survey were not quantitative, they do give a
preliminary indication of the species inhabiting streams in the Broad River drainage.
Two of the crayfish we collected, Cambarus howardi and Cambarus spicatus, were
identified in the SCCWCP (SCDNR 2005b) as species of conservation concern.
Ccambarus spicatus (Broad River spiny crayfish) is endemic to the Broad River drainage
and is currently considered vulnerable to imperilment (S3) in South Carolina
(NatureServe 2004). The only site where we collected the Broad River spiny crayfish
was Wateree Creek (#242004), which also had an excellent fish community. Cambarus
howardi was more common in our collections; it was collected from four sites, all of
which had good to excellent fish community condition indices. Live native mussels were
only observed at one of our sample locations (Clarks Fork). We did not specifically target
mussels during fish sampling so we cannot rule out their occurrence at the other sites;
however, our inability to find live mussels during our macroinvertebrate visual searches
does indicate the scarcity of mussels in the streams we surveyed. All four of the mussel
species we collected from Clarks Fork are considered to be of moderate conservation
priority in the SCCWCP (SCDNR 2005b).
In general, the water quality and physical parameters we measured were consistent with
expected values for piedmont streams in the Broad River drainage. Channel alteration,
vegetative protection, and riparian width were not problematic at most sites because those

18
with severe, localized anthropogenic influences were eliminated through our selection of
least impacted sites. Three of the four sites that scored less than optimal for channel
alteration, all four sites that scored less than optimal for vegetative protection, and both
sites that scored less than suboptimal for riparian width were included as part of the
random statewide stream survey. Although many of our sites scored as “Optimal”
overall, the habitat at most sites, including least impacted sites, was impaired in at least
one of the habitat condition categories. At more than 75% of sites surveyed, bank
stability, sediment deposition, and embeddedness were less than optimal.
The multivariate analysis of our fish sampling of least impacted sites and a small set of
random sites indicated that the most significant predictors of fish community composition
in the Broad River drainage are those associated with natural habitat variation. Stream
size (width, depth, and drainage area) and stream topography (gradient and elevation)
were more influential predictors of fish community composition than any of the
anthropogenic variables we measured. However, that is not an indication that
anthropogenic impacts have had little effect on stream biota in the Broad River drainage.
Our study design was primarily focused on identifying the locations and condition of
species of conservation concern and their habitats; therefore, we directed our sampling
effort toward least impacted sites. If a completely random design had been employed, a
larger range of anthropogenic impacts would have been encountered and the results of
our analysis may have differed. In addition to the sample design being focused on least
impacted sites, the land cover data (SCGAP 2001) we used may not be current enough to
accurately quantify present conditions. Although the GAP data is the best data we had

19
available, it is 10 – 13 years old and may not reflect recent and current landuse activities
in the Broad River drainage. During our site reconnaissance and sampling we
encountered numerous instances of recent and current land clearing activity in the
drainage that would not have been captured in our analysis.
Our procedure for selecting least impacted sites seemed effective given that our fish
community condition index scores were significantly higher at our least impacted sites
than randomly selected sites in the upper Broad River drainage.
We identified 30 sites from our current survey and historic data that had “Excellent” or
“Good” fish communities, based on our fish community condition index. Sites that
scored “Excellent” could be used as reference sites in future work. They should also be
considered prime candidates for future conservation efforts. Sites that scored “Good”
should be considered the second tier for stream conservation efforts. The Clarks Fork
site should also be considered as a conservation candidate, even though it only had a
“Fair” fish community rating, as it was the only site we sampled that had an obvious
native mussel community.
Forty-three sites from our current survey and historic data had “Fair” or “Poor” fish
communities based on our fish community condition index. Those sites, especially those
that scored “Poor”, could be considered candidates for stream restoration efforts.
However, priority should be given to protecting/conserving those sites that scored
20
“Excellent” opposed to restoring the degraded sites, as it is much easier and more
successful to maintain quality habitat then to restore degraded habitats.
Interestingly, sites within the Kings Mountain and Carolina Slate Belt ecoregions tended
to have higher fish community condition values than those in the Southern Outer
Piedmont. The higher values in the Kings Mountain ecoregion may be partly due to
protections afforded four sites whose drainage areas extend into Kings Mountain State
Park and/or Kings Mountain National Military Park. However, of those four sites only
three have a significant portion (>50%) of their drainage areas protected within park
boundaries, and one of those sites (Clarks Fork) scored only “Fair”, likely due to several
impoundments upstream of our fish sampling site. Conversely, sites located within the
Southern Outer Piedmont had poorer fish community condition values than expected,
even at sites with partially protected drainages. We calculated fish community condition
values for six sites that were completely contained (five sites) or partially contained (one
site) within Sumter National Forest. Five of those sites had “Poor” fish community
condition values and one site was assigned a “Fair” condition value.
Sedimentation from nonpoint sources is the greatest threat to aquatic fauna in the eastern
USA (Richter 1997), and likely poses the greatest threat to streams in the Broad River
drainage as well. Ground disturbance from development activities (e.g., residential,
commercial, transportation, and utility construction), agriculture and silviculture are
primary sources of erosion that lead to sedimentation in piedmont streams. Many
corporate and private timber managers fail to follow best management practices (BMPs),

21
which contribute significant siltation and other nonpoint source pollution within the
Broad River drainage. Stream bank erosion due to loss of riparian areas, livestock
grazing, and altered hydrology also contribute to sedimentation in piedmont streams.
Therefore, conservation efforts within the Broad River drainage should focus on
educating land owners of proper soil conservation practices, responsible riparian
management, and enforcing the South Carolina Forestry Commission’s BMPs for
silviculture operations. Several opportunities exist to partner with federal agencies
(United States Forest Service, Natural Resources Conservation Service, United States
Fish and Wildlife Service), state agencies (South Carolina Department of Health and
Environmental Control, South Carolina Forestry Commission), nonprofit organizations
(The Nature Conservancy), corporate entities (Duke Power, SCE&G, Lockhart Power
Company), and citizen-based groups (Broad River Advisory Council) to plan, fund and
carry out restoration activities.
Within the confines of Sumter National Forest, other strategies may be implemented to
restore the condition of aquatic communities through localized habitat enhancement.
Although most of the land within the National Forest is currently forested, the streams we
sampled and encountered during reconnaissance had very poor aquatic habitats that likely
contributed to their “Poor” fish community condition scores. Most sites we visited had
extremely homogenous habitat, characterized by long straight stretches of shallow “runs”
with substrates consisting of shifting sand and fine sediments. The sites we visited also
lacked instream structure (e.g., large woody debris). The degraded habitat conditions we
observed in the Sumter National Forest are likely the result of historic land clearing and

22
timbering of riparian forests that retarded the recruitment of large woody debris to the
stream channel. Assuming that BMPs for silviculture operations are followed, additional
sedimentation and channel degradation of USFS streams should not be a major concern.
There is a long history of implementing stream restoration projects on forested lands
aimed at improving stream habitat for coldwater fisheries (Hunt 1988; Binns 1994;
Kaufmann et al. 1997). Those projects often include the introduction of large woody
debris and other structures to improve fish habitat by restoring channel complexity
(Cederholm et al. 1997; Martin 2001). It would seem appropriate to apply such methods
to streams in the Sumter National Forest to improve aquatic habitat in general for all
aquatic biota.
Significant deviations
Some modifications were made to the sample selection procedure. Instead of randomly
selecting sites, we selected sites that had the greatest chance of harboring species of
conservation concern (i.e., least impacted areas). Least impacted sites were chosen using
our GIS database. Sites near industrial effluent, large agricultural operations, and urban
areas were eliminated from the selection procedure. During 2004 eleven completely
random sites from the upper Broad River sub-drainage were added to the study because
that basin was included in the annual statewide stream survey; however, no completely
random sites were sampled from the lower Broad River sub-drainage during either year.
In our report we highlighted potential areas that may be in need of restoration based on
the condition of their fish communities. We intended to identify individual streams that

23
needed restoration, based on physical habitat data, and recommend specific remedies for
those streams; however, those recommendations were dependent on the completion of a
Rosgen habitat inventory that was to be carried out in a companion project.
Unfortunately that companion project was never initiated and as a result we are unable to
provide specific habitat enhancement recommendations.
A publicly accessible geographic database has not yet been developed, although the data
are available upon request. The SCDNR is currently developing a geographic database
that will contain fish distribution information. That database will be accessible to the
public and contain the data collected during this study.

24
Recommendations
1. Conservation fish species: Based on fish data collected during this study and the information compiled in the SCWCCP (SCDNR 2005b) we recommend that the following species be considered species of conservation concern in the Broad River drainage; greenfin shiner, fieryblack shiner, highback chub, Santee chub, swallowtail shiner, silver redhorse, V-lip redhorse, robust redhorse, snail bullhead, flat bullhead, “Carolina” fantail darter, Saluda darter, seagreen darter, and Piedmont darter.
2. Freshwater mussels: Native mussels in the Broad River drainage are a poorly
understood resource. Their scarcity in our qualitative survey suggests that a concentrated study is needed to better define their distribution and status within the Broad River drainage.
3. Habitat conservation/protection: Several of the streams we sampled had
“Excellent” fish communities and should be considered candidates for habitat conservation and protection efforts. Ideal candidates for conservation/protection efforts would include; Sites Creek (22003), Harmon Creek (32003), Obed Creek (52003), Wolf Creek (142003), Big Cedar Creek (162003), Wateree Creek (242004), Jumping Run Creek (282004), Little Cedar Creek (292004), Kings Creek (342004), John’s Creek (112003), Blue Branch (122003), and Long Branch (172003). Clark Fork (3839) is also a prime conservation target due to the presence of a large population of native mussels.
4. Habitat restoration: Streams within the Sumter National Forest could benefit
from stream restoration activities. Based on current and historic data collected from streams within the Sumter National Forest in the Broad River drainage several streams may benefit from restoration activities. Those streams include Rocky Creek (102003), Gregory Creek (212004), Terrible Creek (222004), McClures Creek (232004), Neals Creek (128) and Hellers Creek (158).

25
Literature Cited
Barbour, M.T., J. Gerritsen, B.D. Snyder, and J.B. Stribling. 1999. Rapid bioassement protocols for use in streams and wadeable rivers: periphyton, benthic macroinvertebrates and fish, Second Edition. EPA 841-B-99-002. U.S. Environmental Protection Agency; Office of Water; Washington, D.C. Bettinger, J. M., J. S. Crane and J. S. Bulak. 2003. Broad River Aquatic Resources Inventory Completion Report. South Carolina Department of Natural Resources, Columbia, SC. Binns, N.A. 1994. Long-term responses of trout and macrohabitats to habitat management in a Wyoming headwater stream. North American Journal of Fisheries Management 14:87-98. Blanton, R.E. 2001. Examination of morphological variation among populations of fantail darters (Percidae: Etheostoma: Catonotus) from river drainages of North Carolina, South Carolina, Tennessee, and Virginia, with a redescription of the subspecies Etheostoma flabellare brevispina (Coker). Eastern Kentucky University Thesis. Richmond, Kentucky. Cederholm, C.J., R.E., Bilby, P.A. Bisson, T.W. Bumstead, B.R. Fransen, W.J., Scarlett, and J.W. Ward. 1997. Response of juvenile coho salmon and steelhead to placement of large woody debris in a coastal Washington stream. North American Journal of Fisheries Management 17:947-963. Clark, K.R. 1993. Non-parametric multivariate analyses of changes in community structure. Australian Journal of Ecology 18:117-143. Hunt, R.L. 1988. A compendium of 45 trout stream habitat development evaluations in Wisconsin during 1953-1985. Technical Bulletin No. 126. Wisconsin Department of Natural Resources, Madison, Wisconsin. Jenkins, R. E., and N. M. Burkhead. 1993. Freshwater Fishes of Virginia. American Fisheries Society. Bethesda, Maryland. Jenks, G. F. 1977. Optimal data classification for choropleth maps, Occasional paper No. 2. Lawrence, Kansas: University of Kansas, Department of Geography. Karr, J.R., 1981. Assessment of biotic integrity using fish communities: Fisheries 6(6): 21-27. Kauffman, J.B., R.L. Beschta, N. Otting, and D. Lytjen. 1997. An ecological perspective of riparian and stream restoration in the western United States. Fisheries 22(5):12-24.

26
Martin, D.J. 2001. The influence of geomorphic factors and geographic region on large woody debris loading and fish habitat in Alaska coastal streams. North American Journal of Fisheries Management 21:429-440. McCune, B., and M.J. Mefford. 1999. PC-ORD. Multivariate Analysis of Ecological Data, Version 4. MjM Software Design, Gleneden Beach, Oregon, USA. McCune, B., James B. Grace, and Dean L. Urban. 2002. Analysis of Ecological Communities. MjM Software Design, Gleneden Beach, Oregon, U.S.A. NatureServe. 2004. NatureServe Explorer: An online encyclopedia of life [web application]. Version 4.0. NatureServe, Arlington, Virginia. Available http://www.natureserve.org/explorer. North Carolina Department of Environment, Health and Natural Resources. 1997. Standard operating procedures: biological monitoring. State of North Carolina. Division of Water Quality, North Carolina Department of Environment, Health and Natural Resources, Raleigh, North Carolina. Richter, BD, DP Braun, MA Mendelson, and LL. Master. 1998. Threats to imperiled freshwater fauna: Conservation Biology 11:1081–1093. Rohde, F. C., R. G., Arndt, D. G. Lindquist, and J. F. Parnell. 1994. Freshwater Fishes of the Carolinas, Virginia, Maryland, & Delaware. The University of North Carolina Press. Chapel Hill, North Carolina. SAS Institute. 1988. SAS/STAT user’s guide, release 6.03. SAS Institute, Cary, North Carolina. South Carolina Department of Health and Environmental Control. 1999. Standard operating and quality control procedures for macroinvertebrate sampling. Technical Report No. 004-98. Bureau of Water, Division of Water Monitoring, Assessment, and Protection, Aquatic Biology Section. SCDHEC, Columbia, SC. South Carolina Department of Natural Resources. 2005a. South Carolina Comprehensive Wildlife Conservation Strategy Supplemental Document 2005-2010. South Carolina Department of Natural Resources, Columbia, South Carolina. South Carolina Department of Natural Resources. 2005b. South Carolina Comprehensive Wildlife Conservation Strategy 2005-2010. South Carolina Department of Natural Resources, Columbia, South Carolina. South Carolina GAP Analysis Project. 2001. Accessed online on February 13, 2006 at http://www.dnr.sc.gov/GIS/gap/SCReport.pdf

27
Thomason, C., J. Bettinger, D. Rankin, D. Crochet, L. Rose and H. Beard. 2002. The South Carolina standard operating procedures for sampling fish in wadeable streams. South Carolina Department of Natural Resources, Columbia, SC. Warren, M. L., Jr., B.M. Burr, S.J. Walsh, H.L. Bart, Jr., R.C. Cashner, D.A. Etnier, B.J. Freeman, B.R. Kuhajda, R.L. Mayden, H.W. Robison, S.T. Ross, and W.C. Starnes. 2000. Diversity, distribution, and conservation status of the native freshwater fishes of the southern United States. Fisheries 25(10):7-31.

28
Table 1. Watershed and stream site habitat characteristics that were investigated as potential predictors of stream fish assemblages in the Broad River drainage, SC. Land use characteristics (e.g., % agriculture) were calculated for the entire drainage area of each site as well as within a 250 m buffer around all stream segments above each sample site.
Habitat Characteristics Watershed Scale Site Scale
% Agriculture Elevation (m) % Forest Mean width (m) % Open Mean depth (m) % Scrub Dissolved oxygen (mg/L) % Urban pH % Water Conductivity (ΦS) Drainage area (ha) Turbidity (NTU) Road density (km/ha) Temperature (C°) Stream road intersection density (No./km2) EPA rapid bioassessment habitat score Dam density (No./km2) NPDES density (No./km2) Stream gradient (m/m) Ecoregion (level III) Lentic area (m2) Lentic density (No. impoundments/ha)

29
Table 2. Sites sampled for fish in the Broad River drainage during summer/fall 2003 and 2004, and historic sites sampled by the SCDNR from 1993 – 2001.
Date Site No. Stream Long Lat Ecoregion 9/9/2003 12003 Crims Creek -81.3674 34.2605 Southern Outer Piedmont
9/23/2003 22003 Site’s Creek -81.2706 34.183 Carolina Slate Belt 9/24/2003 32003 Harmon Creek -81.0977 34.1644 Carolina Slate Belt
10/22/2004 32004 Harmon Creek2 -81.0976 34.1643 Carolina Slate Belt 9/24/2003 42003 Crooked Creek -81.3163 34.1653 Carolina Slate Belt 9/29/2003 52003 Obed Creek -81.9958 35.1223 Southern Outer Piedmont 9/29/2003 62003 Tributary to N. Pacolet River -82.0778 35.1741 Southern Outer Piedmont 9/30/2003 72003 Vaughn Creek -82.2503 35.1825 Southern Inner Piedmont 9/30/2003 82003 Tributary to Vaughn Creek -82.2723 35.1949 Blue ridge 10/2/2003 92003 Weir Creek -81.2662 34.5587 Southern Outer Piedmont
10/19/2004 92004 Weir Creek2 -81.2661 34.5586 Southern Outer Piedmont 10/9/2003 102003 Rocky Creek -81.3722 34.4307 Southern Outer Piedmont 10/9/2003 112003 Johns Creek -81.3831 34.5836 Southern Outer Piedmont
10/13/2003 122003 Blue Branch -81.3558 34.8600 Southern Outer Piedmont
10/21/2004 122004 Blue Branch2 -81.3559 34.8600 Southern Outer Piedmont 10/14/2003 132003 Guyon-Moore Creek -81.4466 34.9968 Southern Outer Piedmont 10/15/2003 142003 Wolf Creek -81.4614 35.0418 Kings Mountain 10/15/2003 152003 Garner Branch -81.4194 35.1006 Kings Mountain 10/20/2003 162003 Big Cedar Creek -81.0571 34.2401 Carolina Slate Belt 10/22/2003 172003 Long Branch -81.3575 35.1361 Kings Mountain
10/28/2004 172004 Long Branch2 -81.3574 35.1361 Kings Mountain 10/22/2003 182003 Rocky Branch -81.3347 35.0468 Southern Outer Piedmont 10/7/2004 192004 Gilky Creek -81.6197 35.0200 Kings Mountain 10/7/2004 202004 Cowcastle Creek -81.7570 35.0053 Southern Outer Piedmont 10/8/2004 212004 Gregory Creek -81.5306 34.6938 Southern Outer Piedmont
10/11/2004 222004 Terrible Creek -81.3671 34.3885 Southern Outer Piedmont 10/11/2004 232004 McClures Creek -81.3888 34.4998 Southern Outer Piedmont 10/15/2004 242004 Wateree Creek -81.2839 34.1899 Carolina Slate Belt 10/19/2004 252004 West Fork Little River -81.2631 34.4533 Southern Outer Piedmont 10/21/2004 262004 Dry Fork -81.3063 34.9610 Southern Outer Piedmont 10/27/2004 272004 Sandy River -81.3219 34.6573 Southern Outer Piedmont 11/3/2004 282004 Jumping Run Creek -81.6968 34.8692 Southern Outer Piedmont 11/5/2004 292004 Little Cedar Creek -81.0975 34.2415 Carolina Slate Belt 11/5/2004 302004 Horse Creek -81.0870 34.2125 Carolina Slate Belt
1 Sites sampled as part of the random statewide stream survey. 2 Sites resampled in 2004
30
Table 2. (Continued)
Date Site No. Stream Long Lat Ecoregion 11/16/2004 312004 Tributary to Crims Creek -81.4223 34.2611 Southern Outer Piedmont 11/18/2004 322004 Sudybole Creek -81.3253 34.8208 Southern Outer Piedmont 11/18/2004 332004 Big Creek -81.1925 34.552 Southern Outer Piedmont 11/30/2004 342004 Kings Creek -81.4774 35.0413 Kings Mountain
8/5/2004 6389 Carlisle Branch1 -81.9208 35.0681 Southern Outer Piedmont
8/5/2004 3018 Little Buck Creek1 -81.8836 35.1286 Southern Outer Piedmont
8/5/2004 169 Arrowood Branch1 -81.9047 35.1700 Southern Outer Piedmont
8/10/2004 2512 Thicketty Creek1 -81.7147 35.0489 Southern Outer Piedmont
8/23/2004 11652 Peter Hawk Creek1 -81.6097 34.8464 Southern Outer Piedmont
10/7/2004 65 Wolfe Creek1 -82.1631 35.1909 Southern Inner Piedmont
10/7/2004 3839 Clark Fork1 -81.3417 35.1169 Kings Mountain
10/7/2004 7006 Bullock Creek1 -81.3153 35.0700 Southern Outer Piedmont
11/15/2004 2577 Green Creek1 -82.2647 35.1336 Southern Inner Piedmont
11/18/2004 10573 Gilkey Creek1 -81.5575 34.9650 Kings Mountain
11/18/2004 9484 Lawsons Fork Creek1 -81.9669 35.0081 Southern Outer Piedmont 10/4/2000 3 Crim's Creek3 -81.3688 34.2623 Southern Outer Piedmont
10/24/2001 4 Cannons Creek3 -81.4645 34.2753 Southern Outer Piedmont 10/16/2000 20 Beasely Creek3 -81.0021 34.1442 Carolina Slate Belt 6/15/2000 21 Big Cedar Creek3 -81.0566 34.2392 Carolina Slate Belt 6/15/2000 22 Jackson Creek3 -81.1913 34.3765 Southern Outer Piedmont
10/11/2001 23 West Fork Little River3 -81.2622 34.4527 Southern Outer Piedmont 6/14/2000 24 East Fork Little River3 -81.2230 34.5177 Southern Outer Piedmont 5/26/2000 26 Sandy River3 -81.2394 34.7303 Southern Outer Piedmont 4/24/2001 37 Green Creek3 -82.0785 35.0492 Southern Outer Piedmont 4/24/2001 38 Lawsons Fork Creek3 -82.0433 35.0235 Southern Outer Piedmont 9/26/2001 65 Little Thicketty Creek3 -81.7893 35.0281 Southern Outer Piedmont 9/26/2001 66 Thicketty Creek3 -81.7578 35.0852 Southern Outer Piedmont 4/11/2001 94 Page Creek3 -82.1465 35.1815 Southern Inner Piedmont 4/11/2001 96 Jamison Mill Creek3 -82.1981 35.1397 Southern Inner Piedmont 5/22/2001 112 Rocky Creek3 -81.3938 34.2433 Southern Outer Piedmont 7/25/2001 128 Neals Creek3 -81.4576 34.6650 Southern Outer Piedmont
10/11/2001 132 Rocky Creek3 -81.3739 34.4307 Southern Outer Piedmont 1 Sites sampled as part of the random statewide stream survey. 2 Sites resampled in 2004. 3 Historical sites sampled by the SCDNR.

31
Table 2. (Continued)
Date Site No. Stream Long Lat Ecoregion 5/23/2000 148 Bullock Creek3 -81.3561 34.9829 Southern Outer Piedmont 6/27/2000 150 Cherokee Creek3 -81.6802 35.1187 Southern Outer Piedmont 6/27/2000 154 Goforth Creek3 -81.6417 35.1580 Southern Outer Piedmont 11/3/1993 157 Harmon Creek3 -81.0803 34.1618 Carolina Slate Belt 2/19/1998 158 Hellers Creek3 -81.4690 34.3795 Southern Outer Piedmont 10/4/1993 160 Horse Creek3 -81.0883 34.2123 Carolina Slate Belt 5/23/2000 162 Kings Creek3 -81.4366 35.1182 Kings Mountain 4/16/1998 168 Peters Creek3 -81.8719 34.9957 Southern Outer Piedmont 4/16/1998 169 Peters Creek3 -81.8965 35.0172 Southern Outer Piedmont 6/20/2000 176 Turkey Creek3 -81.3251 34.9075 Southern Outer Piedmont 2/20/1998 177 West Fork Little River3 -81.2973 34.5444 Southern Outer Piedmont
1 Sites sampled as part of the random statewide stream survey. 2 Sites resampled in 2004. 3 Historic sites sampled by SCDNR.
32
Table 3. Total number of each species collected from streams within the Broad River drainage during 2003 and 2004, the number of sites each species was collected from, and the species conservation priority status, if any, according to the South Carolina Comprehensive Wildlife Conservation Plan (SCDNR 2005b).
Family Scientific Name Common Name Total
Collected Sites Conservation
Priority Escocidae Esox americanus Redfin pickerel 31 5 Esox niger Chain pickerel 1 1 Cyprinidae Clinostomus funduloides Rosyside dace 1,035 13 Cyprinella chloristia Greenfin shiner 173 17 Moderate Cyprinella nivea Whitefin shiner 140 4 Cyprinella pyrrhomelas Fieryblack shiner1 57 1 Moderate Hybognathus regius E. silvery minnow 612 10 Hybopsis hypsinotus Highback chub 891 23 Moderate Hybopsis zanema Santee chub1 2 1 High Nocomis leptocephalus Bluehead chub 5,533 42 Notemigonus crysoleucas Golden shiner 17 5 Notropis cummingsae Dusky shiner 77 5 Notropis hudsonius Spottail shiner 703 14 Notropis lutipinnis Yellowfin shiner 2,393 39 Notropis petersoni Coastal shiner 24 1 Notropis procne Swallowtail shiner1 51 5 Notropis scepticus Sandbar shiner 1,649 27 Semotilus atromaculatus Creek chub 1,205 31 Catostomidae Catostomus commersoni White sucker 35 8 Erimyzon oblongus Creek chubsucker 207 21 Hypentelium nigricans Northern hogsucker 234 15 Moxostoma anisurum Silver redhorse 21 5 Moderate Scartomyzon rupiscartes Striped jumprock 348 31 Scartomyzon sp. Brassy jumprock 341 11 Ictaluridae Ameiurus brunneus Snail bullhead 12 3 Moderate Ameiurus natalis Yellow bullhead 25 12 Ameiurus platycephalus Flat bullhead 161 26 Moderate Noturus insignis Margined madtom 449 24 Aphredoderidae Aphredoderus sayanus Pirate perch 161 9 Poeciliidae Gambusia holbrooki Eastern mosquitofish 14 6 Centrarchidae Centrarchus macropterus Flier 5 3 Lepomis auritus Redbreast sunfish 1,160 38 Lepomis cyanellus Green sunfish 43 8 Lepomis gibbosus Pumpkinseed 29 4 Lepomis gulosus Warmouth 66 15 1 Identified as species of uncertain status at the beginning of the study

33
Table 3 (Continued).
Family Scientific Name Common Name Total
Collected Sites Conservation
Priority Lepomis macrochirus Bluegill 822 29 Lepomis microlophus Redear sunfish 31 8 Micropterus dolomieu Smallmouth bass 29 1 Micropterus salmoides Largemouth bass 195 34 Pomoxis nigromaculatus Black crappie 9 4 Percidae Etheostoma flabellare Fantail darter1 51 4 High Etheostoma olmstedi Tessellated darter 666 27 Etheostoma saludae Saluda darter1 96 8 Highest Etheostoma thalassinum Seagreen darter 203 20 High Percina crassa Piedmont darter1 66 8 High Total Fish 20,073 Total species 45 1 Identified as species of uncertain status at the beginning of the study

34
Table 4. Relative percent abundance (RA) of conservation species collected in Broad River tributary streams, by site, during summer/fall 2003 and 2004. Site N
umber
Greenfin shiner
Fieryblack shiner
Highback chub
Santee chub
Swallow
tail shiner
Silver redhorse
Snail bullhead
Flat bullhead
Fantail darter
Saluda darter
Seagreen darter
Piedmont darter
Overall R
A
12003 4.58 5.54 0.25 1.25 0.25 0.25 12.48 22003 1.23 1.23 32003 5.96 0.79 1.18 7.87 32004 4.12 6.87 0.34 0.34 11.68 42003 52003 0.82 11.63 0.48 0.48 0.25 6.94 0.61 21.25 62003 72003 5.69 5.69 82003 92003 21.58 0.72 22.32 92004 12.91 12.91 102003 0.47 4.35 4.82 112003 0.64 11.67 0.72 0.86 0.52 13.74 122003 1.72 0.43 3.86 6.86 122004 5.77 0.64 2.56 8.97 132003 1.49 1.50 2.25 4.80 142003 0.22 18.82 0.44 3.23 22.62 152003 0.44 0.88 1.33 2.65 162003 0.23 1.87 5.15 0.47 7.73 172003 3.96 0.16 4.11 172004 3.24 0.73 0.42 4.39 182003 31.93 31.93 192004 5.64 1.25 6.90 202004 2.60 0.87 2.39 5.84 212004 2.90 2.90 222004 232004 242004 0.21 1.72 4.72 1.71 0.17 7.82 252004 0.75 7.47 0.75 8.89 262004 0.66 5.96 1.99 4.64 13.25 272004 6.97 0.19 3.39 0.56 0.56 0.19 11.86 282004 0.59 2.68 1.19 4.45 292004 0.85 0.57 0.28 0.28 0.28 0.85 3.13 302004 1.67 1.67 312004 1.21 0.45 1.62 322004 0.38 0.38 0.75 332004 0.49 3.28 3.28 0.66 0.33 8.46 342004 3.90 0.11 0.11 0.17 0.96 0.67 1.57 2.70 9.38

35
Table 4 (Continued). Site N
umber
Greenfin shiner
Fieryblack shiner
Highback chub
Santee chub
Swallow
tail shiner
Silver redhorse
Snail bullhead
Flat bullhead
Fantail darter
Saluda darter
Seagreen darter
Piedmont darter
Overall R
A
6389 3018 1691 2.51 2.51 2512 0.39 0.97 0.97 0.77 1.35 3.57 11652 1.54 1.54 651 6.34 0.24 6.75 13.29 3839 1.47 1.47 7006 2.55 1.26 21.55 2577 0.62 0.62 10573 5.16 7.23 0.43 1.49 14.26 9484 0.45 2.56 2.50 Total No. Collected 173 57 891 2 51 21 12 161 51 96 203 66 Total RA 0.86 0.28 4.44 0.01 0.25 0.10 0.06 0.80 0.25 0.48 1.01 0.33 8.89 No. sites 17 1 23 1 5 5 3 26 4 8 20 8

36
Table 5. Pearson and Kendall habitat correlations based on NMS ordination of first two axes calculated from fish community information and environmental variables collected and derived from the Broad River drainage, 2003 and 2004. Axis 1 2 r r2 tau r r2 tau Mean width (m) 0.68 0.47 0.60 -0.38 0.14 -0.32 Mean depth (m) 0.63 0.40 0.46 -0.58 0.34 -0.38 Drainage area (ha) 0.53 0.28 0.53 -0.28 0.08 -0.15 Stream gradient (m/m) -0.53 0.28 -0.36 -0.07 0.01 -0.09 Elevation (m) -0.48 0.23 -0.33 -0.36 0.13 -0.28 Water (%) 0.45 0.21 0.34 0.16 0.02 0.13 pH 0.42 0.18 0.22 -0.05 0.00 0.01 Lentic area (m2) 0.42 0.17 0.40 -0.23 0.06 -0.18 Scrub (%) -0.35 0.12 -0.24 -0.03 0.00 0.01 Water buffer (%) 0.32 0.10 0.27 0.21 0.05 0.15 Conductivity 0.32 0.10 0.26 0.27 0.07 0.14 Scrub buffer (%) -0.30 0.09 -0.21 0.02 0.00 0.01 Forest buffer (%) 0.20 0.04 0.10 0.01 0.00 0.06 Forest (%) 0.18 0.03 0.09 0.07 0.01 0.08 Agriculture (%) -0.18 0.03 -0.11 -0.04 0.00 -0.06 Lentic density (No./ha) 0.16 0.03 0.31 -0.17 0.03 -0.18 Temperature (Cº) -0.13 0.02 -0.05 0.07 0.00 0.06 Open (%) -0.12 0.01 0.05 0.14 0.02 0.17 Urban (%) 0.11 0.01 0.19 -0.23 0.05 -0.11 Dissolved oxygen (mg/L) -0.11 0.01 -0.10 -0.13 0.02 -0.12 Stream road density (No./km2) 0.10 0.01 0.16 -0.12 0.02 -0.17 Urban buffer (%) 0.09 0.01 0.18 -0.20 0.04 -0.14 Open buffer (%) -0.09 0.01 0.06 0.20 0.04 0.20 NPDES density (No./km2) 0.05 0.00 0.23 -0.21 0.04 -0.25 Agriculture buffer (%) -0.04 0.00 0.02 -0.09 0.01 -0.12 Road density (km/ha) -0.03 0.00 0.06 -0.15 0.02 -0.08 Dam density (No./km2) -0.01 0.00 0.37 0.04 0.00 -0.15

37
Table 6. Fish community condition categories for Species Richness (S), Conservation Species Richness (CS), Simpson’s Diversity Index (D), Overall fish community condition value, and invertebrate Bioclassification scores. Site No. S CS D Overall Bioclassification 12003 Good Excellent Good Good Good-Fair 22003 Excellent Excellent Good Excellent Good-Fair 32003 Excellent Excellent Excellent Excellent Good-Fair 42003 Poor Poor Poor Poor Good-Fair 52003 Excellent Excellent Excellent Excellent Good 62003 Fair Poor Poor Poor Good 72003 Poor Good Fair Fair Good 82003 Poor Poor Poor Poor Good 92003 Excellent Poor Excellent Good Good
102003 Poor Poor Good Poor Good 112003 Good Good Good Good Good-Fair 122003 Good Good Excellent Good Good 132003 Good Poor Fair Fair Good 142003 Excellent Excellent Excellent Excellent Good 152003 Good Excellent Poor Good Good 162003 Good Excellent Excellent Excellent Good-Fair 172003 Good Good Good Good Good 182003 Good Poor Good Fair Good 192004 Good Good Good Good Good 202004 Good Fair Fair Fair Good 212004 Poor Good Fair Fair Good-Fair 222004 Poor Poor Good Poor Fair 232004 Poor Poor Fair Poor Fair 242004 Excellent Excellent Excellent Excellent Good-Fair 252004 Fair Poor Excellent Fair Good-Fair 262004 Good Excellent Good Good Good-Fair 272004 Fair Excellent Excellent Good Good 282004 Excellent Excellent Good Excellent Good-Fair 292004 Excellent Excellent Good Excellent Good 302004 Fair Poor Good Fair Good-Fair 312004 Good Poor Good Fair Good 322004 Fair Good Poor Fair Good

38
Table 6 (Continued). Site No. S CS D Overall Bioclassification 332004 Good Excellent Good Good Good 342004 Excellent Excellent Excellent Excellent Good
6389 Fair Poor Poor Poor 3018 Fair Poor Good Fair 1691 Fair Excellent Fair Good 2512 Good Poor Good Fair
11652 Poor Good Poor Poor Good-Fair 651 Good Poor Good Fair
3839 Good Poor Good Fair Good 7006 Good Poor Excellent Good 2577 Poor Good Fair Fair Good
10573 Good Fair Excellent Good
9484 Poor Poor Fair Poor
3 Good Poor Good Fair 4 Fair Poor Excellent Fair
20 Fair Poor Fair Poor 21 Fair Good Good Good 22 Fair Poor Good Fair 23 Poor Poor Excellent Fair 24 Good Good Excellent Good 26 Poor Poor Poor Poor 37 Fair Poor Poor Poor 38 Poor Poor Fair Poor 65 Good Poor Good Fair 66 Fair Poor Poor Poor 94 Fair Fair Poor Poor 96 Good Good Fair Good
112 Fair Poor Good Fair 128 Poor Good Poor Poor 132 Poor Poor Good Poor 148 Good Poor Excellent Good 150 Poor Poor Poor Poor 154 Fair Good Excellent Good 157 Fair Good Good Good

39
Table 6 (Continued). Site No. S CS D Overall Bioclassification
158 Poor Poor Poor Poor 160 Poor Poor Poor Poor 162 Good Excellent Fair Good 168 Fair Good Fair Fair 169 Fair Poor Poor Poor 176 Fair Good Fair Fair 177 Fair Poor Fair Poor

40
Table 7. Number of sites in each of the four fish community condition value categories, pooled by site type (i.e., least impacted, random, or historic) and site location, for sites sampled in the upper Broad River sub-drainage (HUC 3050105) and lower Broad River sub-drainage (HUC 3050106). Fish Community Condition Value Pooled Sites Poor Fair Good Excellent Total Upper Broad River - Least Impacted 2 4 5 4 15 Upper Broad River - Random 3 4 4 11 Lower Broad River - Least Impacted 4 5 5 5 19 Current Study - Total 9 13 14 9 45 Upper Broad River - historic 6 2 4 12 Lower Broad River - historic 7 6 3 16 Grand Total 22 21 21 9 73 Table 8. Results of Chi-square analysis of Fish Community Condition Index by Ecoregion. Number of observations and expected number of observations in parentheses.
Fish Community Condition
Index Ecoregion Excellent - Good Fair - Poor Total Sites
Carolina Slate Belt 7
(4.59) 4
(6.40) 11
Kings Mountain 7
(3.34) 1
(4.66) 8
Southern Outer Piedmont 14
(20.06) 34
(27.94) 48 Total Sites 28 39 67

41
Table 9. Crayfish species collected during the Broad River tributary stream survey during 2004 and 2005. Site Number Species 32004 62003 92004 122004 172004 192004 202004 232004 242004 272004 312004 342004Cambarus howardi1 x x x x Cambarus cf. latimanus x Cambarus latimanus x x x Cambarus spp. x x Cambarus striatus x Cambarus robustus x Cambarus spp. C (acuminatus complex) x x x x Cambarus spicatus1 x Cambarus asperimanus2 x Cambarus robustus2 x Procambarus cf. acutus x Procambarus troglodytes x Total Species 2 1 1 1 2 4 1 1 4 1 1 2 1 Identified as species of conservation concern in the SCDNR CWCP. 2 Identified by Shealy Environmental Services, Inc., Cayce, South Carolina.

42
Table 10. Physical habitat parameters and water quality data collected from streams in the Broad River drainage, during backpack electrofishing, summer/fall 2003 and 2004.
Date Site No. Width
(m) Depth
(m) Length
(m) DO
(mg/L) pH Cond. (ΦS)
Turb. (NTU)
Temp (C°)
9/9/2003 12003 4.5 0.1500 100 6.0 7.2 132 -- 20.3 9/23/2003 22003 2.2 0.0559 100 4.5 6.5 151 4.4 21.1 9/24/2003 32003 4.6 0.1355 100 8.3 7.4 88 6.9 20.4
10/22/2004 32004 5.1 0.1389 100 8.5 6.3 80 1.9 18.0 9/24/2003 42003 2.4 0.0466 100 6.1 7.3 82 11.1 20.6 9/29/2003 52003 5.6 0.3360 115 9.4 7.3 36 7.6 16.4 9/29/2003 62003 1.8 0.0700 100 9.0 4.8 37 1.7 15.7 9/30/2003 72003 4.6 0.1775 106 9.5 6.7 24 2.6 15.2 9/30/2003 82003 2.6 0.0947 100 9.6 4.9 17 -- 14.8 10/2/2003 92003 4.6 0.0931 100 9.8 6.7 90 3.0 14.8
10/19/2004 92004 4.1 0.1278 100 7.6 5.3 81 4.2 17.3 10/9/2003 102003 3.3 0.1077 100 7.7 6.6 150 2.3 17.6 10/9/2003 112003 6.0 0.2134 109 7.7 6.5 156 2.4 18.7
10/13/2003 122003 3.9 0.1101 100 7.8 4.9 227 0.7 17.8 10/21/2004 122004 3.7 0.1092 100 7.8 7.4 176 1.0 16.7 10/14/2003 132003 5.9 0.1101 100 8.2 7.2 127 2.2 18.9 10/15/2003 142003 6.8 0.2540 135 9.0 6.8 87 2.1 14.8 10/15/2003 152003 4.3 0.2269 100 8.9 5.3 55 6.7 16.7 10/20/2003 162003 7.9 0.2794 142 8.1 6.4 104 4.8 13.9 10/22/2003 172003 4.6 0.1676 108 8.3 6.1 46 1.3 14.6 10/28/2004 172004 5.1 0.1609 100 7.7 6.9 46 1.9 16.1 10/22/2003 182003 6.0 0.2354 105 7.0 -- 110 1.2 15.4
10/7/2004 192004 3.0 0.1405 100 7.8 6.3 62 4.0 18.3 10/7/2004 202004 4.2 0.1783 100 7.8 5.8 66 5.2 18.1 10/8/2004 212004 3.3 0.0821 100 8.8 7.3 76 5.9 15.5
10/11/2004 222004 3.6 0.2616 100 7.6 6.0 112 6.5 17.5 10/11/2004 232004 3.2 0.0931 100 8.2 5.0 109 4.7 19.1 10/15/2004 242004 10.4 0.2535 181 5.0 6.9 101 6.7 16.6 10/19/2004 252004 6.3 0.3378 100 7.7 5.2 110 6.2 17.1 10/21/2004 262004 2.7 0.0643 100 6.7 7.1 154 2.1 17.2 10/27/2004 272004 7.6 0.2942 137 7.1 6.5 148 5.4 17.5
11/3/2004 282004 3.3 0.2440 110 6.4 4.6 117 2.9 19.9 11/5/2004 292004 5.0 0.2152 108 7.3 7.5 83 5.8 16.6 11/5/2004 302004 5.9 0.2074 125 6.7 7.6 95 2.2 16.4
11/16/2004 312004 3.0 0.1207 111 12.0 6.4 73 6.1 8.1 11/18/2004 322004 3.8 0.0917 103 11.1 5.3 77 3.8 10.0 11/18/2004 332004 5.1 0.1693 100 11.2 5.5 78 3.5 11.3 11/30/2004 342004 11.3 0.3852 200 9.0 5.9 87 3.1 8.8
8/5/2004 6389 1.4 0.0700 100 7.9 6.1 48 -- 20.7 8/5/2004 3018 5.4 0.2400 100 4.8 6.8 68 -- 21.4 8/5/2004 1691 2.6 0.1000 100 8.6 6.9 33 -- 21.1
8/10/2004 2512 8.5 0.2000 169 8.1 6.8 50 -- 20.9

43
Table 10 (Continued).
Date Site No. Width
(m) Depth
(m) Length
(m) DO
(mg/L) pH Cond. (ΦS)
Turb. (NTU)
Temp (C°)
8/23/2004 11652 3.2 0.0700 100 7.8 6.8 30 -- 20.3 10/7/2004 651 5.8 0.1800 116 8.9 6.6 48 4.7 16.6 10/7/2004 3839 5.8 0.2700 100 7.3 7.0 54 -- 19.2 10/7/2004 7006 5.4 0.2200 100 9.1 7.5 84 -- 16.5
11/15/2004 2577 3.3 0.2400 100 11.0 5.9 20 4.1 10.4 11/18/2004 10573 6.0 0.3600 119 11.2 7.1 71 3.3 9.2 11/18/2004 9484 14.2 0.2800 150 11.0 6.7 52 7.1 10.6
Table 11. The number of sites that scored “Optimal”, “Suboptimal”, “Marginal”, and “Poor” in each of ten habitat condition categories. Score Habitat Category Optimal Suboptimal Marginal Poor Epifaunal Substrate 14 17 9 5 Embeddedness 7 22 15 1 Velocity/Depth Regime 14 20 10 1 Sediment Deposition 11 18 10 6 Flow Status 11 22 12 Channel Alteration 41 4 Freq. Of Riffles 25 10 6 4 Bank Stability 10 17 13 5 Vegetative Protection 41 2 1 1 Riparian Width 32 11 2 Overall Score 21 18 6

44
82003
72003
651
62003
5200396
94 16913018
37
38
9484
6389
169
168
154
150
66
2512
202004
65192004
162172003
38397006
182003
152003
132003
10573
142003
148262004
176
122003
322004
282004
11652
26
272004128
212004
112003
232004
92003
177332004
24
252004
102003
158
22200422
4
312004112
12003
292004 162003
302004
42003
24200422003
32003 15720
342004
25
3
132 23
�
Legend
0 10 20 30 405Kilometers
EcoregionSouthern Inner Piedmont
Southern Outer Piedmont
Carolina Slate Belt
Kings Mountain
Sand Hills
Blue Ridge
Random
Least impacted
Historic
11 digit HUC
Sample Sites
Figure 1. Random and least impacted sites sampled during 2003 and 2004 and historic sites sampled from 1993 – 2001 by the SCDNR in the Broad River drainage.

45
NMS
Distance (Objective Function)
Information Remaining (%)
2.1E-02
100
1E+00
75
2.1E+00
50
3.1E+00
25
4.1E+00
0
DR2577GH1691JB62003GH6389JB232004DR651JB192004JB172003JB72003GH11652JB212004JB322004GH10573GH2512JB272004JB342004GH3839JB162003JB32003JB292004JB242004GH9484JB52003JB252004GH3018GH7006JB182003JB142003JB152003JB102003JB282004JB112003JB132003JB12003JB202004JB332004JB92003JB122003JB262004JB312004JB22003JB302004
Gr5
1 2 3 7 15
Figure 2. Similarity of fish communities sampled from the Broad River drainage during 2003 and 2004.
46
Cluster Dendogram
Distance (Objective Function)
Information Remaining (%)
7.2E-03
100
1.5E-01
75
2.9E-01
50
4.3E-01
25
5.7E-01
0
JB122003JB122004JB92003JB92004JB172003JB172004JB32003JB32004
Group
1 3 5 7
Figure 3. Similarity of fish communities at sites sampled during both 2003 and 2004 in Broad River drainage.

47
DR2577
DR651
GH10573
GH11652
GH1691
GH2512GH3018
GH3839
GH6389
GH7006
GH9484
JB102003
JB112003
JB12003
JB122003
JB132003
JB142003
JB152003
JB162003
JB172003
JB182003
JB192004JB202004
JB212004
JB22003
JB232004
JB242004
JB252004
JB262004
JB272004
JB282004
JB292004
JB302004
JB312004
JB32003
JB322004
JB332004
JB342004
JB52003
JB62003
JB72003
JB92003
Drainage area (ha)
Gradient
Elevation Width
Depth
-2.5
-1.0
-1.5 -0.5 0.5 1.5
0.0
1.0
Axis 1
Axi
s 2
Cluster Groupings123715
Figure 4. NMS ordination of fish communities sampled from the Broad River drainage during 2003 and 2004. Sites in close proximity to each other have similar fish communities. Habitat variables that were most strongly correlated to the axes are overlaid.

48
�
��
��
�
�� ��
�
�
�
���
�
�
�
�
�
�
�
�
�
��
�
�
��
�
��
�
��
�
�
�
��
�
�
�
�
�
�
�
�
�
�
�
�
�
�
�
�
�
�
�
�
�
�
�
�
�
�
�
�
�
��
���
Legend� Sample Sites
Fish Community ConditionExcellent
Good
Fair
Poor
HUC codes (14-digit)
�
0 9 18 27 364.5Kilometers
Figure 5. Fish Community Condition Index for sites sampled during the current study, as well as 28 historic sites sampled from 1993 – 2001 in the Broad River drainage by the SCDNR.

49
APPENDIX 1

MACROINVERTEBRATE ASSESSMENT OF WADEABLE STREAMS IN THE BROAD RIVER DRAINAGE
SOUTH CAROLINA
AUGUST 2005
Submitted To:
SOUTH CAROLINA DEPARTMENT OF NATURAL RESOURCES
Eastover, South Carolina
Submitted by:
SHEALY ENVIRONMENTAL SERVICES, INC. 106 Vantage Point Drive Cayce, South Carolina
(803)791-9700
SCDHEC Laboratory Certification No. 32010

i
TABLE OF CONTENTS
Page
LIST OF TABLES ii
I SUMMARY 1
II INTRODUCTION 2
III DESCRIPTION OF STUDY AREA 2
IV METHODS 2
A. Sample Processing 2
B. Data Analysis 2
V RESULTS-Macroinvetebrate Community Analysis 6
VI REFERENCES 15

ii
LIST OF TABLES
Table Page
1 SCDNR sample numbers, sampled creek, and the dates on which they were sampled.
3
2 Procedures used in the calculation of selected metrics used in this report.
6
3 Macroinvertebrates, their North Carolina biotic index tolerance values (TV), functional feeding groups (FG), and abundance collected from the Broad River drainage, South Carolina, 13 July-19 August 2005.
10
4 Dominant taxa (>5% of the collection) for the sampling locations in the Broad River drainage South Carolina, 13 July-19 August 2005.
48
5 Rapid bioassessment metrics calculated for the sampling locations in the
Broad River drainage, South Carolina, 13 July-19 August 2005.
53
6 Community Loss Index (CLI) calculated for the samling locations in the Broad River drainage, South Carolina, 13 July-19 August 2005.
55
7 Jaccard Coefficient of Similarity (JCS) calculated for the samling locations
in the Broad River drainage, South Carolina, 13 July-19 August 2005.
57
8 Sörensen Coefficient (CS) calculated for the samling locations in the Broad River drainage, South Carolina, 13 July-19 August 2005.
59

1
I. SUMMARY
From 13 July 2005 to 19 August 2005, personnel from SOUTH CAROLINA DEPARTMENT OF NATURAL RESOURCES conducted a benthic macroinvertebrate community assessment on various creeks in the Broad River drainage, South Carolina. These samples were then sorted and identified by personnel at SHEALY ENVIRONMENTAL SERVICES, INC. The objective of this assessment was to determine the condition of the river’s macroinvertebrate community throughout the drainage.
2
II. INTRODUCTION
From 13 July 2005 to 19 August 2005, a benthic macroinvertebrate community assessment was conducted in various creeks in the Broad River drainage, South Carolina by personnel of South Carolina Department of Natural Resources (SCDNR). The objective of this assessment was to determine the conditions of aquatic macroinvertebrate communities throughout the drainage.
III. DESCRIPTION OF STUDY AREA
Collections of aquatic macroinvertebrates were made from thirty seven sampling locations in the Broad River drainage. The SCDNR sample numbers, the creek from which the samples were taken, and the dates on which they were collected are found in Table 1.
IV. METHODS
A. Sample Processing At the SHEALY ENVIRONMENTAL SERVICES, INC. laboratory, macroinvertebrates were sorted from debris with the aid of an Aus Jena GSZ stereomicroscope. The macroinvertebrates were enumerated and identified to the lowest positive taxonomic level with the aide of appropriate microscopic techniques and taxonomic keys. All specimens will be maintained in SHEALY ENVIRONMENTAL SERVICES, INC. voucher collection for five years. B. Data Analysis Comparisons of the macroinvertebrate communities were based on the known tolerance levels and life history strategies of the organisms encountered and on changes in taxonomic composition between sampling stations. Changes in taxonomic composition were determined using metrics outlined in Rapid Bioassessment Protocol III of the US EPA's Rapid Bioassessment Protocols for Use in Streams and Rivers (Plafkin et al. 1989) and other works. These metrics included the following:
1) Taxa richness - The number of different taxa found at a particular location is an indication of diversity. Reductions in community diversity have been positively associated with various forms of environmental pollution, including nutrient loading, toxic substances, and sedimentation (Barbour et al., 1996; Fore et al., 1996; Rosenberg and Resh, 1993; Shackleford, 1988).

3
Table 1. SCDNR sample numbers, sampled creeks, and the dates on which they were sampled.
SCDNR Sample #
Creek Date Collected
2005001 Harmon Creek 13 July 2005 2005002 Horse Creek 13 July 2005 2005003 Big Cedar Creek 19 July 2005 2005004 Little Cedar Creek 19 July 2005 2005005 Big Creek 19 July 2005 2005006 Weir Creek 19 July 2005 2005007 Terrible Creek 20 July 2005 2005008 Rocky Creek 20 July 2005 2005009 McClures Creek 20 July 2005 2005010 Johns Creek 20 July 2005 2005011 Crooked Creek 27 July 2005 2005012 Sites Creek 27 July 2005 2005013 Wateree Creek 27 July 2005 2005014 West Fork Little River 28 July 2005 2005015 Sandy River 28 July 2005 2005016 Blue Branch 28 July 2005 2005017 Susybole Creek 28 July 2005 2005018 Guyonmoore Creek 04 Aug 2005 2005019 Wolf Creek 04 Aug 2005 2005020 Kings Creek 04 Aug 2005 2005021 Rocky Branch 04 Aug 2005 2005022 Dry Fork 10 Aug 2005 2005023 Garner Branch 10 Aug 2005 2005024 Clark Fork 10 Aug 2005 2005025 Long Branch 10 Aug 2005 2005026 Peter Hawks Creek 12 Aug 2005 2005027 Jumping Run Creek 12 Aug 2005 2005028 Gregorys Creek 12 Aug 2005 2005029 Obed Creek 17 Aug 2005 2005030 Cowpens Creek 17 Aug 2005 2005031 Gilkey Creek 17 Aug 2005 2005032 Green Creek 18 Aug 2005 2005033 Vaughn Creek 18 Aug 2005
2005034 Tributary to Vaughn Creek 18 Aug 2005
2005035 Crims Creek 19 Aug 2005
2005036 Tributary to Crims Creek 19 Aug 2005
2005037 Tributary to the Pacolet River 17 Aug 2005
4
2) EPT Index - EPT Index is the number of taxa from the insect orders Ephemeroptera, Plecoptera and Trichoptera found at a station. These three insect orders are considered to be intolerant of adverse changes in water quality, especially temperature and dissolved oxygen, and therefore, a reduction in these taxa is indicative of reduced water quality (Barbour et al., 1996; Lenat, 1988).
3) Chironomidae taxa and abundance - The Chironomidae are a taxonomically and ecologically diverse group with many taxa which are tolerant of various forms of pollution. The chironomids are often the dominant group encountered at impacted or stressed sites (Rosenberg and Resh, 1993).
4) Ratio of EPT and Chironomidae abundance - The relative abundance of these four indicator groups is a measure of community balance. When compared to a reference site, good biotic conditions are reflected in a fairly even distribution among these four groups (Plafkin et al., 1989). The value of this ratio is reduced by impact due to the general reduction of the more sensitive EPT taxa and an increase in the more tolerant chironomid taxa.
5) Ratio of scraper/scraper and filtering collectors - When compared to a reference site, shifts in the dominance of a particular feeding type may indicate a community responding to an over-abundance of a particular food source or toxicants bound to a particular food source (Rosenberg and Resh, 1993).
6) Shredder/total number of specimens collected - When compared to a reference site, reductions in the relative abundance of shredders can indicate changes in the quality or quantity of riparian zone vegetation or the presence of toxic substances bound to organic carbon contained in the leaf and woody material which comprises their food source (Plafkin et al., 1989).
7) Percent contribution of dominant taxon - This measures the redundancy and evenness of the community structure. It assumes a highly redundant community reflects an impaired community because as the more sensitive taxa are eliminated, there is often a significant increase in the remaining tolerant forms (Barbour et al., 1996; Shackleford, 1988).
8) Dominant taxa in common - When compared to a reference site, major shifts in the composition and abundance of dominant taxa can indicate environmental stress (Barbour et al., 1996; Shackleford, 1988).
11) Community loss index (Table 6) - This index measures the loss of taxa between a reference or control station and a study site. It is an index of dissimilarity, with values

5
increasing as the degree of dissimilarity from the reference station increases (Courtemanch and Davies, 1987; Plafkin et al., 1989).
12) Jaccard coefficient of community similarity (Table 7) - This coefficient represents the degree of similarity in taxonomic composition between two stations in terms of taxon presence or absence. Values range from 0 to 1.0, increasing as the degree of similarity increases (Jaccard, 1912; Plafkin et al., 1989).
13) Sörensen coefficient (Table 8) - This coefficient represents the degree of similarity in taxonomic composition between two stations in terms of taxon presence or absence. Values range from 0 to 1.0, increasing as the degree of similarity increases (Breitenmoser-Würsten and Satori, 1995).

6
Table 2. Procedures used in the calculation of selected metrics used in this report.
Metric Procedure Community Loss Index
CLI = d-a/e Where: a = number of taxa common to both samples. d = total number of taxa present in sample A. e = total number of taxa present in sample B.
Jaccard Coefficient of Similarity
JCS = a/a+b+c Where: a = number of taxa common to both samples. b = number of taxa present in sample B but not A. c = number of taxa present in sample A but not B.
Sörensen Coefficient
CS= 2a/(d+e) Where: a = number of taxa common to both samples. d = the number of taxa present in sample A. e = the number of taxa present in sample B.
V. RESULTS-Macroinvertebrate Community Analysis
A total of 11,306 specimens representing 309 taxa were collected from the Broad River drainage during this assessment. The taxa list, number of specimens, and relative abundance for each taxon are presented in Table 3. Table 4 lists the dominant taxa for each sampling station. Bioassessment metrics for each sampling station are presented in Tables 5-7. The sampling effort at Harmon Creek (2005001) yielded 338 specimens representing 55 taxa (Table 3). An EPT index of 10 was calculated for this station (Table 5). The Chironomidae were represented by 16 taxa and contributed 38% of the total specimens collected. The SCDHEC bioclassification value of 3.0 resulted in a water quality rating of “good-fair” for this station. The dominant functional feeding group was the collector-gatherers, contributing 47% of the collection. The dominant taxon was Caenis sp., which contributed 18% of the collection (Table 4). Horse Creek (2005002) yielded 447 specimens representing 65 taxa (Table 3). An EPT index of 16 was calculated for this station (Table 5). The Chironomidae were represented by 18 taxa and contributed 17% of the total specimens collected. The SCDHEC bioclassification value of 3.3 results in a water quality rating of “good-fair” for this station. The dominant functional feeding group was the collector-filterers, which contributed 38% of the collection. The dominant taxon was Chimarra sp., which contributed 18% of the specimens collected (Table 4).

7
Big Cedar Creek (2005003) yielded 422 specimens representing 62 taxa (Table 3). An EPT index of 15 was calculated for this station (Table 5). The Chironomidae were represented by 13 taxa and contributed 12% of the total specimens collected. The SCDHEC bioclassification value of 3.2 results in a water quality rating of “good-fair” for this station. The dominant functional feeding group was the scrapers, which contributed 26% of the collection. The dominant taxon was Stenonema modestum, which contributed 15% of the specimens collected (Table 4). Little Cedar Creek (2005004) yielded 317 specimens representing 49 taxa (Table 3). An EPT index of 19 was calculated for this station (Table 5). The Chironomidae were represented by 13 taxa and contributed 16% of the total specimens collected. The SCDHEC bioclassification value of 4.0 results in a water quality rating of “good” for this station. The dominant functional feeding group was the collector-filterers, which contributed 35% of the collection. The dominant taxon was Cheumatopsyche sp., which contributed 21% of the specimens collected (Table 4). Big Creek (2005005) yielded 340 specimens representing 62 taxa (Table 3). An EPT index of 23 was calculated for this station (Table 5). The Chironomidae were represented by 14 taxa and contributed 16% of the total specimens collected. The SCDHEC bioclassification value of 3.7 results in a water quality rating of “good” for this station. The dominant functional feeding group was the scrapers, which contributed 34% of the collection. The dominant taxon was Stenonema modestum, which contributed 18% of the specimens collected (Table 4). Weir Creek (2005006) yielded 403 specimens representing 70 taxa (Table 3). An EPT index of 21 was calculated for this station (Table 5). The Chironomidae were represented by 26 taxa and contributed 20% of the total specimens collected. The SCDHEC bioclassification value of 3.5 results in a water quality rating of “good” for this station. The dominant functional feeding group was the collector-filterers, which contributed 32% of the collection. The dominant taxon was Stenonema modestum, which contributed 10% of the specimens collected (Table 4). Terrible Creek (2005007) yielded 273 specimens representing 51 taxa (Table 3). An EPT index of 7 was calculated for this station (Table 5). The Chironomidae were represented by 20 taxa and contributed 31% of the total specimens collected. The SCDHEC bioclassification value of 2.2 results in a water quality rating of “fair” for this station. The
8
dominant functional feeding group was the predators, which contributed 37% of the collection. The dominant taxon was Stenonema modestum, which contributed 26% of the specimens collected (Table 4). Rocky Creek (2005008) yielded 425 specimens representing 57 taxa (Table 3). An EPT index of 20 was calculated for this station (Table 5). The Chironomidae were represented by 20 taxa and contributed 19% of the total specimens collected. The SCDHEC bioclassification value of 3.5 results in a water quality rating of “good” for this station. The dominant functional feeding group was the scrapers, which contributed 27% of the collection. The dominant taxon was Stenonema modestum, which contributed 23% of the specimens collected (Table 4). McClures Creek (2005009) yielded 209 specimens representing 50 taxa (Table 3). An EPT index of 9 was calculated for this station (Table 5). The Chironomidae were represented by 17 taxa and contributed 27% of the total specimens collected. The SCDHEC bioclassification value of 2.3 results in a water quality rating of “fair” for this station. The dominant functional feeding group was the scrapers, which contributed 31% of the collection. The dominant taxon was Stenonema modestum, which contributed 25% of the specimens collected (Table 4). Johns Creek (2005010) yielded 338 specimens representing 56 taxa (Table 3). An EPT index of 14 was calculated for this station (Table 5). The Chironomidae were represented by 18 taxa and contributed 18% of the total specimens collected. The SCDHEC bioclassification value of 3.2 results in a water quality rating of “good-fair” for this station. The dominant functional feeding group was the scrapers, which contributed 34% of the collection. The dominant taxon was Stenacron interpunctatum, which contributed 12% of the specimens collected (Table 4). Crooked Creek (2005011) yielded 307 specimens representing 46 taxa (Table 3). An EPT index of 11 was calculated for this station (Table 5). The Chironomidae were represented by 10 taxa and contributed 8% of the total specimens collected. The SCDHEC bioclassification value of 3.0 results in a water quality rating of “good-fair” for this station. The dominant functional feeding group was the scrapers, which contributed 42% of the collection. The dominant taxon was Stenonema modestum, which contributed 21% of the specimens collected (Table 4).

9
Sites Creek (2005012) yielded 271 specimens representing 48 taxa (Table 3). An EPT index of 12 was calculated for this station (Table 5). The Chironomidae were represented by 15 taxa and contributed 20% of the total specimens collected. The SCDHEC bioclassification value of 3.0 results in a water quality rating of “good-fair” for this station. The dominant functional feeding group was the scrapers, which contributed 37% of the collection. The dominant taxon was Stenonema modestum, which contributed 30% of the specimens collected (Table 4). Wateree Creek (2005013) yielded 400 specimens representing 56 taxa (Table 3). An EPT index of 21 was calculated for this station (Table 5). The Chironomidae were represented by 15 taxa and contributed 8% of the total specimens collected. The SCDHEC bioclassification value of 3.0 results in a water quality rating of “good-fair” for this station. The dominant functional feeding group was the scrapers, which contributed 38% of the collection. The dominant taxon was Stenacron interpunctatum, which contributed 15% of the specimens collected (Table 4). The West Fork of Little River (2005014) yielded 353 specimens representing 57 taxa (Table 3). An EPT index of 12 was calculated for this station (Table 5). The Chironomidae were represented by 16 taxa and contributed 19% of the total specimens collected. The SCDHEC bioclassification value of 2.5 results in a water quality rating of “good-fair” for this station. The dominant functional feeding group was the scrapers, which contributed 31% of the collection. The dominant taxon was Stenonema modestum, which contributed 14% of the specimens collected (Table 4). Sandy River (2005015) yielded 332 specimens representing 47 taxa (Table 3). An EPT index of 18 was calculated for this station (Table 5). The Chironomidae were represented by 8 taxa and contributed 6% of the total specimens collected. The SCDHEC bioclassification value of 3.5 results in a water quality rating of “good” for this station. The dominant functional feeding group was the scrapers, which contributed 34% of the collection. The dominant taxon was Stenacron interpunctatum, which contributed 15% of the specimens collected (Table 4). Blue Branch (2005016) yielded 346 specimens representing 55 taxa (Table 3). An EPT index of 18 was calculated for this station (Table 5). The Chironomidae were represented by 19 taxa and contributed 20% of the total specimens collected. The SCDHEC bioclassification value of 3.5 results in a water quality rating of “good” for this station. The

10
dominant functional feeding group was the scrapers, which contributed 53% of the collection. The dominant taxon was Stenonema modestum, which contributed 15% of the specimens collected (Table 4). Susybole Creek (2005017) yielded 238 specimens representing 38 taxa (Table 3). An EPT index of 16 was calculated for this station (Table 5). The Chironomidae were represented by 6 taxa and contributed 5% of the total specimens collected. The SCDHEC bioclassification value of 3.8 results in a water quality rating of “good” for this station. The dominant functional feeding group was the predators, which contributed 31% of the collection. The dominant taxon was Stenonema modestum, which contributed 17% of the specimens collected (Table 4). Guyonmoore Creek (2005018) yielded 348 specimens representing 54 taxa (Table 3). An EPT index of 19 was calculated for this station (Table 5). The Chironomidae were represented by 11 taxa and contributed 3% of the total specimens collected. The SCDHEC bioclassification value of 4.0 results in a water quality rating of “good” for this station. The dominant functional feeding group was the scrapers, which contributed 40% of the collection. The dominant taxon was Chimarra sp., which contributed 12% of the specimens collected (Table 4). Wolf Creek (2005019) yielded 173 specimens representing 45 taxa (Table 3). An EPT index of 19 was calculated for this station (Table 5). The Chironomidae were represented by 7 taxa and contributed 10% of the total specimens collected. The SCDHEC bioclassification value of 4.0 results in a water quality rating of “good” for this station. The dominant functional feeding group was the scrapers, which contributed 44% of the collection. The dominant taxon was Stenonema modestum, which contributed 12% of the specimens collected (Table 4). Kings Creek (2005020) yielded 202 specimens representing 52 taxa (Table 3). An EPT index of 24 was calculated for this station (Table 5). The Chironomidae were represented by 10 taxa and contributed 12% of the total specimens collected. The SCDHEC bioclassification value of 4.3 results in a water quality rating of “good” for this station. The dominant functional feeding group was the scrapers, which contributed 29% of the collection. The dominant taxon was Corydalus cornutus, which contributed 12% of the specimens collected (Table 4).

11
Rocky Branch (2005021) yielded 316 specimens representing 50 taxa (Table 3). An EPT index of 18 was calculated for this station (Table 5). The Chironomidae were represented by 12 taxa and contributed 11% of the total specimens collected. The SCDHEC bioclassification value of 3.7 results in a water quality rating of “good” for this station. The dominant functional feeding group was the collector-filterers, which contributed 37% of the collection. The dominant taxon was Chimarra sp., which contributed 16% of the specimens collected (Table 4). Dry Fork (2005022) yielded 179 specimens representing 41 taxa (Table 3). An EPT index of 14 was calculated for this station (Table 5). The Chironomidae were represented by 7 taxa and contributed 7% of the total specimens collected. The SCDHEC bioclassification value of 2.7 results in a water quality rating of “good-fair” for this station. The dominant functional feeding group was the scrapers, which contributed 40% of the collection. The dominant taxon was Stenonema modestum, which contributed 22% of the specimens collected (Table 4). Garner Branch (2005023) yielded 232 specimens representing 51 taxa (Table 3). An EPT index of 21 was calculated for this station (Table 5). The Chironomidae were represented by 11 taxa and contributed 13% of the total specimens collected. The SCDHEC bioclassification value of 3.7 results in a water quality rating of “good” for this station. The dominant functional feeding group was the scrapers, which contributed 42% of the collection. The dominant taxon was Stenonema modestum, which contributed 21% of the specimens collected (Table 4). Clark Fork (2005024) yielded 299 specimens representing 42 taxa (Table 3). An EPT index of 14 was calculated for this station (Table 5). The Chironomidae were represented by 9 taxa and contributed 5% of the total specimens collected. The SCDHEC bioclassification value of 4.0 results in a water quality rating of “good” for this station. The dominant functional feeding group was the scrapers, which contributed 55% of the collection. The dominant taxon was Leucrocuta sp., which contributed 16% of the specimens collected (Table 4). Long Branch (2005025) yielded 230 specimens representing 48 taxa (Table 3). An EPT index of 21 was calculated for this station (Table 5). The Chironomidae were represented by 7 taxa and contributed 9% of the total specimens collected. The SCDHEC bioclassification value of 4.0 results in a water quality rating of “good” for this station. The

12
dominant functional feeding group was the scrapers, which contributed 45% of the collection. The dominant taxon was Stenonema modestum, which contributed 15% of the specimens collected (Table 4). Peter Hawks Creek (2005026) yielded 159 specimens representing 39 taxa (Table 3). An EPT index of 12 was calculated for this station (Table 5). The Chironomidae were represented by 13 taxa and contributed 15% of the total specimens collected. The SCDHEC bioclassification value of 3.0 results in a water quality rating of “good-fair” for this station. The dominant functional feeding group was the predators, which contributed 38% of the collection. The dominant taxon was Cheumatopsyche sp., which contributed 12% of the specimens collected (Table 4). Jumping Run Creek (2005027) yielded 428 specimens representing 49 taxa (Table 3). An EPT index of 16 was calculated for this station (Table 5). The Chironomidae were represented by 11 taxa and contributed 10% of the total specimens collected. The SCDHEC bioclassification value of 3.3 results in a water quality rating of “good-fair” for this station. The dominant functional feeding group was the collector-filterers, which contributed 52% of the collection. The dominant taxon was Isonychia sp., which contributed 27% of the specimens collected (Table 4). Gregorys Creek (2005028) yielded 319 specimens representing 52 taxa (Table 3). An EPT index of 14 was calculated for this station (Table 5). The Chironomidae were represented by 12 taxa and contributed 14% of the total specimens collected. The SCDHEC bioclassification value of 3.0 results in a water quality rating of “good-fair” for this station. The dominant functional feeding group was the predators, which contributed 41% of the collection. The dominant taxon was Beloneuria sp., which contributed 17% of the specimens collected (Table 4). Obed Creek (2005029) yielded 390 specimens representing 51 taxa (Table 3). An EPT index of 22 was calculated for this station (Table 5). The Chironomidae were represented by 12 taxa and contributed 7% of the total specimens collected. The SCDHEC bioclassification value of 4.2 results in a water quality rating of “good” for this station. The dominant functional feeding group was the scrapers, which contributed 38% of the collection. The dominant taxon was Stenonema modestum, which contributed 17% of the specimens collected (Table 4).

13
Cowpens Creek (2005030) yielded 290 specimens representing 53 taxa (Table 3). An EPT index of 19 was calculated for this station (Table 5). The Chironomidae were represented by 12 taxa and contributed 8% of the total specimens collected. The SCDHEC bioclassification value of 4.0 results in a water quality rating of “good” for this station. The dominant functional feeding group was the scrapers, which contributed 43% of the collection. The dominant taxon was Stenonema modestum, which contributed 16% of the specimens collected (Table 4). Gilkey Creek (2005031) yielded 366 specimens representing 48 taxa (Table 3). An EPT index of 19 was calculated for this station (Table 5). The Chironomidae were represented by 9 taxa and contributed 11% of the total specimens collected. The SCDHEC bioclassification value of 4.0 results in a water quality rating of “good” for this station. The dominant functional feeding group was the scrapers, which contributed 55% of the collection. The dominant taxon was Elimia sp., which contributed 19% of the specimens collected (Table 4). Green Creek (2005032) yielded 158 specimens representing 40 taxa (Table 3). An EPT index of 20 was calculated for this station (Table 5). The Chironomidae were represented by 4 taxa and contributed 3% of the total specimens collected. The SCDHEC bioclassification value of 4.0 results in a water quality rating of “good” for this station. The dominant functional feeding group was the predators, which contributed 35% of the collection. The dominant taxon was Beloneuria sp., which contributed 12% of the specimens collected (Table 4). Vaughns Creek (2005033) yielded 241 specimens representing 41 taxa (Table 3). An EPT index of 25 was calculated for this station (Table 5). The Chironomidae were represented by 2 taxa and contributed 1% of the total specimens collected. The SCDHEC bioclassification value of 4.3 results in a water quality rating of “good” for this station. The dominant functional feeding group was the scrapers, which contributed 24% of the collection. The dominant taxon was Epeorus sp., which contributed 10% of the specimens collected (Table 4). Tributary to Vaughns Creek (2005034) yielded 284 specimens representing 28 taxa (Table 3). An EPT index of 19 was calculated for this station (Table 5). The Chironomidae were represented by 1 taxa and contributed 1% of the total specimens collected. The SCDHEC bioclassification value of 4.0 results in a water quality rating of “good” for this station. The

14
dominant functional feeding group was the shredders, which contributed 28% of the collection. The dominant taxon was Tallaperla sp., which contributed 24% of the specimens collected (Table 4). Crims Creek (2005035) yielded 279 specimens representing 42 taxa (Table 3). An EPT index of 11 was calculated for this station (Table 5). The Chironomidae were represented by 12 taxa and contributed 10% of the total specimens collected. The SCDHEC bioclassification value of 3.0 results in a water quality rating of “good-fair” for this station. The dominant functional feeding group was the scrapers, which contributed 38% of the collection. The dominant taxon was Stenonema modestum, which contributed 33% of the specimens collected (Table 4). Tributary to Crims Creek (2005036) yielded 340 specimens representing 53 taxa (Table 3). An EPT index of 18 was calculated for this station (Table 5). The Chironomidae were represented by 10 taxa and contributed 13% of the total specimens collected. The SCDHEC bioclassification value of 3.5 results in a water quality rating of “good” for this station. The dominant functional feeding group was the collector-filterers, which contributed 40% of the collection. The dominant taxon was Chimarra sp., which contributed 24% of the specimens collected (Table 4). Tributary of the Pacolet River (2005037) yielded 314 specimens representing 44 taxa (Table 3). An EPT index of 17 was calculated for this station (Table 5). The Chironomidae were represented by 11 taxa and contributed 9% of the total specimens collected. The SCDHEC bioclassification value of 3.8 results in a water quality rating of “good” for this station. The dominant functional feeding group was the scrapers, which contributed 31% of the collection. The dominant taxon was Tallaperla sp., which contributed 16% of the specimens collected (Table 4).

15
VI. REFERENCES
Barbour, M. T., J. Gerritsen, B. D. Snyder, and J. B. Stribling. 1999. Rapid bioassessment protocols
for use in streams and wadeable rivers: periphyton, benthic macroinvertebrates, and fish, Second Edition. EPA 841-B-99-002. U.S. Environmental Protection Agency, Office of Water, Washington, D.C.
Barbour, M.T.; J. Gerritsen; G.E. Griffith; R. Frydenborg; E. McCarron; J.S. White; and M.L.
Bastian. 1996. A framework for biological criteria for Florida streams using benthic macroinvertebrates. J. N. Am. Benthol. Soc. 15:185-211.
Breitenmoser-Würsten, C. and M. Satori. 1995. Distribution, diversity, life cycle and growth of a
mayfly community in a prealpine stream (Insecta, Ephemeroptera). Hydrobiol. 308: 85-101. Courtemanch, D.L. and S.P. Davies. 1987. A coefficient of community loss to assess detrimental
change in aquatic communities. Water Research 21:217-222. Fore, L.S.; J.R. Karr; and R.W. Wisseman. 1996 Assessing invertebrate responses to human
activities: evaluation of alternative approaches. J. N. Am. Benthol. Soc. 15:212-232. Jaccard, P. 1912. The distribution of flora in the alpine zone. New Phytologist 11: 37-50. Lenat, D.R. 1988. Water quality assessment of streams using a qualitative collection method for
benthic macroinvertebrates. J. N. Am. Benthol. Soc. 7: 222-233. North Carolina Department of Environment, Health and Natural Resources. 1997. Standard
operating procedures: biological monitoring. State of North Carolina. Division of Water Quality, North Carolina Department of Environment, Health and Natural Resources, Raleigh, NC, 65 pp.
Plafkin, J.L., M.T. Barbour, K.D. Porter, S.K. Gross and, R.M. Hughes. 1989. Rapid bioassessment
protocols for use in streams and rivers. US EPA Assessment and Watershed Protection Division, Washington, D.C. EPA/444/4-89/001.
Rosenberg, D.M. and V.H. Resh (eds.) 1993. Freshwater biomonitoring and benthic
macroinvertebrates. Chapman and Hall, New York, New York. 488pp. Shackleford, B. 1988. Rapid bioassessment of lotic macroinvertebrate communities: Biocriteria
development. Biomonitoring Section, Arkansas Dept. Poll. Contl. And Ecol. Little Rock, Ark. 45pp.
South Carolina Department of Health and Environmental Control. 1999. Standard Operating and
Quality Control Procedures for Macroinvertebrate Sampling. Technical Report No. 004-98. Bureau of Water, Division of Water Monitoring, Assessment, and Protection, Aquatic Biology Section. SC DHEC, Columbia, SC. 18+ pp.
South Carolina Department of Health and Environmental Control. 1998. Water classifications and
standards (Regulation 61-68), Classified waters (Regulation 61-69) State of South Carolina. Office of Environmental Quality Control, SC DHEC, Columbia, SC.

16
Table 3. Macroinvertebrates, their North Carolina biotic index tolerance values (TV), functional feeding groups (FG), and abundance collected from the Broad River drainage, South Carolina, 13 July-19 August 2005.
Seq Taxon TV FG 2005
001
2005
002
2005
003
2005
004
2005
005
2005
006
2005
007
2005
008
2005
009
2005
010
2005
011
2005
012
2005
013
2005
014
2005
015
2005
016
2005
017
2005
018
2005
019
Annelida Hirudinea Rhynchobdellida Glossiphoniidae
1 Placobdella papillifera 8.96 P 1 1 Oligochaeta Haplotaxida Haplotaxidae
2 Haplotaxidae cf. Haplotaxis sp. SC 1 Lumbricidae
3 Oligochaeta cf. Enchytraeidae Genus species SC 1 Lumbriculida Branchiobdellidae
4 Branchiobdellidae Genus species P 28 1 6 Lumbriculidae
5 Lumbriculidae Genus species 7.03 SC 3 5 1 6 Pristinella sp. 7.03 SC 2
Tubificida Naididae
7 Naididae cf. Pristina sp. SC 1 8 Naididae cf. Slavina sp. SC 2 9 Naididae Genus species SC 1 7 1 1
10 Pristina sp. SC 2 5 1 1 1 11 Slavina appendiculata 7.06 CG 2 12 Stylaria sp. SC
Tubificidae 13 Tubificidae Genus species 7.11 SC 1
* CG = collector-gatherer, CF = collector-filterer, OM = omnivore, P = predator, SH = shredder, SC = scraper

17
Table 3. Continued.
Seq Taxon TV FG 2005
020
2005
021
2005
022
2005
023
2005
024
2005
025
2005
026
2005
027
2005
028
2005
029
2005
030
2005
031
2005
032
2005
033
2005
034
2005
035
2005
036
2005
037
Annelida Hirudinea Rhynchobdellida Glossiphoniidae
1 Placobdella papillifera 8.96 P Oligochaeta Haplotaxida Haplotaxidae
2 Haplotaxidae cf. Haplotaxis sp. SC Lumbricidae
3 Oligochaeta cf. Enchytraeidae Genus species SC Lumbriculida Branchiobdellidae
4 Branchiobdellidae Genus species P 6 4 1 28 32 5 29 1 8 Lumbriculidae
5 Lumbriculidae Genus species 7.03 SC 1 3 3 1 2 2 2 3 6 Pristinella sp. 7.03 SC
Tubificida Naididae
7 Naididae cf. Pristina sp. SC 8 Naididae cf. Slavina sp. SC 9 Naididae Genus species SC 4 4 1
10 Pristina sp. SC 11 Slavina appendiculata 7.06 CG 12 Stylaria sp. SC 1
Tubificidae 13 Tubificidae Genus species 7.11 SC 1 1
* CG = collector-gatherer, CF = collector-filterer, OM = omnivore, P = predator, SH = shredder, SC = scraper

18
Table 3. Continued.
Seq Taxon TV FG 2005
001
2005
002
2005
003
2005
004
2005
005
2005
006
2005
007
2005
008
2005
009
2005
010
2005
011
2005
012
2005
013
2005
014
2005
015
2005
016
2005
017
2005
018
2005
019
Arthropoda Arachnoidea Acariformes
14 Acariformes Genus species 5.53 P 2 5 1 1 1 Arrenuridae
15 Arrenurus sp. 5.53 P 1 1 1 Aturidae
16 Aturus sp. 5.53 P 1 Hydrachnidae
17 Hydrachna sp. 5.53 P 10 2 5 4 6 Hygrobatidae
18 Hygrobates sp. 5.53 P 1 2 1 Krendowskiidae
19 Geayia sp. 5.53 P 2 2 2 Lebertiidae
20 Lebertia sp. 5.53 P 7 3 4 15 1 9 1 1 Limnesiidae
21 Limnesia sp. 5.53 P 2 1 Mideopsidae
22 Mideopsis sp. 5.53 P 3 9 Sperchonidae
23 Sperchon sp. 5.53 P 1 Torrenticolidae
24 Torrenticola sp. 5.53 P 1 Unionicolidae
25 Neumania sp. 5.53 P 1 1 1
* CG = collector-gatherer, CF = collector-filterer, OM = omnivore, P = predator, SH = shredder, SC = scraper

19
Table 3. Continued.
Seq Taxon TV FG 2005
020
2005
021
2005
022
2005
023
2005
024
2005
025
2005
026
2005
027
2005
028
2005
029
2005
030
2005
031
2005
032
2005
033
2005
034
2005
035
2005
036
2005
037
Arthropoda Arachnoidea Acariformes
14 Acariformes Genus species 5.53 P Arrenuridae
15 Arrenurus sp. 5.53 P 1 1 Aturidae
16 Aturus sp. 5.53 P Hydrachnidae
17 Hydrachna sp. 5.53 P 1 1 2 1 Hygrobatidae
18 Hygrobates sp. 5.53 P Krendowskiidae
19 Geayia sp. 5.53 P Lebertiidae
20 Lebertia sp. 5.53 P Limnesiidae
21 Limnesia sp. 5.53 P Mideopsidae
22 Mideopsis sp. 5.53 P Sperchonidae
23 Sperchon sp. 5.53 P Torrenticolidae
24 Torrenticola sp. 5.53 P Unionicolidae
25 Neumania sp. 5.53 P
* CG = collector-gatherer, CF = collector-filterer, OM = omnivore, P = predator, SH = shredder, SC = scraper

20
Table 3. Continued. Seq
Taxon TV FG 2005
001
2005
002
2005
003
2005
004
2005
005
2005
006
2005
007
2005
008
2005
009
2005
010
2005
011
2005
012
2005
013
2005
014
2005
015
2005
016
2005
017
2005
018
2005
019
Crustacea Amphipoda Talitridae
26 Hyalella azteca 7.75 OM 10 10 9 1 27 Hyalella sp. OM 2 8 10
Cladocera Daphnidae
28 Ceriodaphnia sp. CF 4 Decapoda Cambaridae
29 Cambaridae Genus species OM 1 2 1 3 3 30 Cambarus asperimanus 7.62 OM 31 Cambarus robustus 7.62 OM
Eucopepoida Cyclopidae
32 Eucyclops agilis OM 2 Isopoda Asellidae
33 Lirceus sp. 7.85 SC 1 Hexapoda Coleoptera
34 Coleoptera Genus species CG 1 Carabidae
35 Carabidae Genus species P 1
* CG = collector-gatherer, CF = collector-filterer, OM = omnivore, P = predator, SH = shredder, SC = scraper

21
Table 3. Continued.
Seq Taxon TV FG 2005
020
2005
021
2005
022
2005
023
2005
024
2005
025
2005
026
2005
027
2005
028
2005
029
2005
030
2005
031
2005
032
2005
033
2005
034
2005
035
2005
036
2005
037
Crustacea Amphipoda Talitridae
26 Hyalella azteca 7.75 OM 1 27 Hyalella sp. OM
Cladocera Daphnidae
28 Ceriodaphnia sp. CF Decapoda Cambaridae
29 Cambaridae Genus species OM 3 1 9 1 2 2 5 10 1 7 2 1 2 9 30 Cambarus asperimanus 7.62 OM 3 9 31 Cambarus robustus 7.62 OM 4
Eucopepoida Cyclopidae
32 Eucyclops agilis OM Isopoda Asellidae
33 Lirceus sp. 7.85 SC Hexapoda Coleoptera
34 Coleoptera Genus species CG Carabidae
35 Carabidae Genus species P 1
* CG = collector-gatherer, CF = collector-filterer, OM = omnivore, P = predator, SH = shredder, SC = scraper

22
Table 3. Continued.
Seq Taxon TV FG 2005
001
2005
002
2005
003
2005
004
2005
005
2005
006
2005
007
2005
008
2005
009
2005
010
2005
011
2005
012
2005
013
2005
014
2005
015
2005
016
2005
017
2005
018
2005
019
Dryopidae 36 Helichus basalis 4.63 SC 5 3 37 Helichus fastigiatus 4.63 SC 1 4 1 6 3 5 4 4 3 5 5 1 3 1 38 Helichus lithophilus 4.63 SC 2
Dytiscidae 39 Coptotomus sp. 9.26 P 1 1 40 Dytiscidae cf. Hydrocolus sp. P 2 5 1 1 3 1 2 41 Dytiscidae cf. Lioporeus sp. P 3 2 2 4 1 42 Hydroporini Genus species P 2
Elmidae 43 Ancyronyx variegatus 6.49 CG 1 15 1 3 4 2 9 2 44 Dubiraphia sp. 5.93 CG 6 33 3 5 4 1 1 1 1 8 3 2 2 45 Macronychus glabratus 4.58 CG 11 5 2 1 1 1 1 25 16 33 4 2 46 Stenelmis sp. 5.1 SC 4 3 1 1 4 30 3 29 2 15 1
Gyrinidae 47 Dineutus ciliatus 5.54 P 48 Dineutus discolor 5.54 P 1 49 Dineutus sp. 5.54 P 4 3 3 3 4 1 50 Gyrinus sp. 6.17 P 2
Hydrophilidae 51 Cymbiodyta sp. CG 5 52 Sperchopsis tessellatus 6.13 CG 1
Noteridae 53 Suphisellus sp. P
Psephenidae 54 Ectopria sp. SC 1 1 3 2 55 Psephenus herricki 2.35 SC 2 1 1 11 24 7
* CG = collector-gatherer, CF = collector-filterer, OM = omnivore, P = predator, SH = shredder, SC = scraper

23
Table 3. Continued.
Seq Taxon TV FG 2005
020
2005
021
2005
022
2005
023
2005
024
2005
025
2005
026
2005
027
2005
028
2005
029
2005
030
2005
031
2005
032
2005
033
2005
034
2005
035
2005
036
2005
037
Dryopidae 36 Helichus basalis 4.63 SC 6 37 Helichus fastigiatus 4.63 SC 1 2 3 6 11 1 5 2 2 5 2 38 Helichus lithophilus 4.63 SC
Dytiscidae 39 Coptotomus sp. 9.26 P 40 Dytiscidae cf. Hydrocolus sp. P 41 Dytiscidae cf. Lioporeus sp. P 42 Hydroporini Genus species P
Elmidae 43 Ancyronyx variegatus 6.49 CG 2 1 2 1 1 5 1 1 3 44 Dubiraphia sp. 5.93 CG 2 5 2 1 1 1 6 8 1 45 Macronychus glabratus 4.58 CG 8 3 16 2 6 1 11 3 5 4 12 2 46 Stenelmis sp. 5.1 SC 2 1 1 41 2 1 3 1 1 1
Gyrinidae 47 Dineutus ciliatus 5.54 P 1 48 Dineutus discolor 5.54 P 49 Dineutus sp. 5.54 P 1 1 1 3 1 1 1 50 Gyrinus sp. 6.17 P
Hydrophilidae 51 Cymbiodyta sp. CG 52 Sperchopsis tessellatus 6.13 CG 1 1
Noteridae 53 Suphisellus sp. P 1
Psephenidae 54 Ectopria sp. SC 1 1 2 55 Psephenus herricki 2.35 SC 3 3 8 4 15
* CG = collector-gatherer, CF = collector-filterer, OM = omnivore, P = predator, SH = shredder, SC = scraper

24
Table 3. Continued.
Seq Taxon TV FG 2005
001
2005
002
2005
003
2005
004
2005
005
2005
006
2005
007
2005
008
2005
009
2005
010
2005
011
2005
012
2005
013
2005
014
2005
015
2005
016
2005
017
2005
018
2005
019
Ptilodactylidae 56 Anchytarsus bicolor 3.64 SH 1
Scirtidae 57 Scirtes sp. SC 1
Staphylinidae 58 Staphylinidae Genus species P
Collembola 59 Collembola Genus species CG 1
Entomobryidae 60 Entomobryidae Genus species CG 1
Isotomidae 61 Isotomidae cf. Semicerura sp. CG 1 1
Diptera Athericidae
62 Atherix lantha 2.07 P Ceratopogonidae
63 Atrichopogon sp. 6.49 CG 5 64 Bezzia/Palpomyia sp. 6.86 P 1 1 1 1 1 1 2 1 1 1 65 Dasyhelea sp. 6.76 CG 1 66 Probezzia sp. 6.76 P 1
Chironomidae 67 Ablabesmyia janta 7.2 P 3 68 Ablabesmyia mallochi 7.19 P 2 1 1 3 3 3 3 2 1 1 69 Ablabesmyia peleensis 9.67 P 70 Ablabesmyia rhamphe gr. 7.2 P 4 1 1 1 1 1 1 71 Brillia flavifrons 5.18 SH 72 Brillia sp. 5.18 SH 5 1 73 Chironomidae cf. Diplocladius sp. CG 1 74 Chironomidae cf. Phaenopsectra punctipes gr. SC 4 1 1 2 5 75 Chironomidae cf. Polypedilum scalanum gr. SH 1
* CG = collector-gatherer, CF = collector-filterer, OM = omnivore, P = predator, SH = shredder, SC = scraper

25
Table 3. Continued.
Seq Taxon TV FG 2005
020
2005
021
2005
022
2005
023
2005
024
2005
025
2005
026
2005
027
2005
028
2005
029
2005
030
2005
031
2005
032
2005
033
2005
034
2005
035
2005
036
2005
037
Ptilodactylidae 56 Anchytarsus bicolor 3.64 SH 2 5 1
Scirtidae 57 Scirtes sp. SC
Staphylinidae 58 Staphylinidae Genus species P 1 1
Collembola 59 Collembola Genus species CG
Entomobryidae 60 Entomobryidae Genus species CG
Isotomidae 61 Isotomidae cf. Semicerura sp. CG
Diptera Athericidae
62 Atherix lantha 2.07 P 5 Ceratopogonidae
63 Atrichopogon sp. 6.49 CG 64 Bezzia/Palpomyia sp. 6.86 P 1 2 1 1 1 1 65 Dasyhelea sp. 6.76 CG 66 Probezzia sp. 6.76 P
Chironomidae 67 Ablabesmyia janta 7.2 P 3 2 1 2 1 68 Ablabesmyia mallochi 7.19 P 1 1 1 1 1 2 69 Ablabesmyia peleensis 9.67 P 1 1 70 Ablabesmyia rhamphe gr. 7.2 P 1 1 71 Brillia flavifrons 5.18 SH 1 72 Brillia sp. 5.18 SH 73 Chironomidae cf. Diplocladius sp. CG 74 Chironomidae cf. Phaenopsectra punctipes gr. SC 75 Chironomidae cf. Polypedilum scalanum gr. SH
* CG = collector-gatherer, CF = collector-filterer, OM = omnivore, P = predator, SH = shredder, SC = scraper
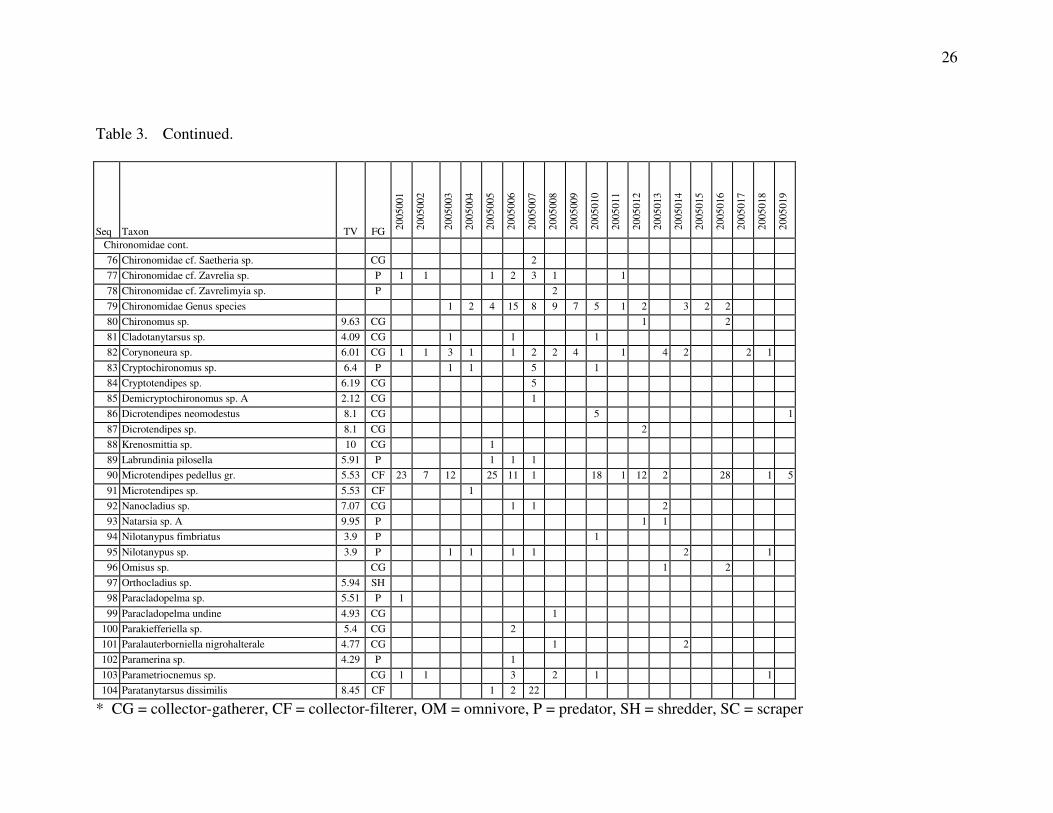
26
Table 3. Continued.
Seq Taxon TV FG 2005
001
2005
002
2005
003
2005
004
2005
005
2005
006
2005
007
2005
008
2005
009
2005
010
2005
011
2005
012
2005
013
2005
014
2005
015
2005
016
2005
017
2005
018
2005
019
Chironomidae cont. 76 Chironomidae cf. Saetheria sp. CG 2 77 Chironomidae cf. Zavrelia sp. P 1 1 1 2 3 1 1 78 Chironomidae cf. Zavrelimyia sp. P 2 79 Chironomidae Genus species 1 2 4 15 8 9 7 5 1 2 3 2 2 80 Chironomus sp. 9.63 CG 1 2 81 Cladotanytarsus sp. 4.09 CG 1 1 1 82 Corynoneura sp. 6.01 CG 1 1 3 1 1 2 2 4 1 4 2 2 1 83 Cryptochironomus sp. 6.4 P 1 1 5 1 84 Cryptotendipes sp. 6.19 CG 5 85 Demicryptochironomus sp. A 2.12 CG 1 86 Dicrotendipes neomodestus 8.1 CG 5 1 87 Dicrotendipes sp. 8.1 CG 2 88 Krenosmittia sp. 10 CG 1 89 Labrundinia pilosella 5.91 P 1 1 1 90 Microtendipes pedellus gr. 5.53 CF 23 7 12 25 11 1 18 1 12 2 28 1 5 91 Microtendipes sp. 5.53 CF 1 92 Nanocladius sp. 7.07 CG 1 1 2 93 Natarsia sp. A 9.95 P 1 1 94 Nilotanypus fimbriatus 3.9 P 1 95 Nilotanypus sp. 3.9 P 1 1 1 1 2 1 96 Omisus sp. CG 1 2 97 Orthocladius sp. 5.94 SH 98 Paracladopelma sp. 5.51 P 1 99 Paracladopelma undine 4.93 CG 1
100 Parakiefferiella sp. 5.4 CG 2 101 Paralauterborniella nigrohalterale 4.77 CG 1 2 102 Paramerina sp. 4.29 P 1 103 Parametriocnemus sp. CG 1 1 3 2 1 1 104 Paratanytarsus dissimilis 8.45 CF 1 2 22
* CG = collector-gatherer, CF = collector-filterer, OM = omnivore, P = predator, SH = shredder, SC = scraper

27
Table 3. Continued.
Seq Taxon TV FG 2005
020
2005
021
2005
022
2005
023
2005
024
2005
025
2005
026
2005
027
2005
028
2005
029
2005
030
2005
031
2005
032
2005
033
2005
034
2005
035
2005
036
2005
037
Chironomidae cont. 76 Chironomidae cf. Saetheria sp. CG 77 Chironomidae cf. Zavrelia sp. P 78 Chironomidae cf. Zavrelimyia sp. P 79 Chironomidae Genus species 80 Chironomus sp. 9.63 CG 2 1 1 81 Cladotanytarsus sp. 4.09 CG 82 Corynoneura sp. 6.01 CG 1 1 1 1 1 3 83 Cryptochironomus sp. 6.4 P 1 1 1 1 1 1 84 Cryptotendipes sp. 6.19 CG 85 Demicryptochironomus sp. A 2.12 CG 86 Dicrotendipes neomodestus 8.1 CG 1 87 Dicrotendipes sp. 8.1 CG 88 Krenosmittia sp. 10 CG 89 Labrundinia pilosella 5.91 P 90 Microtendipes pedellus gr. 5.53 CF 7 1 1 13 3 2 13 9 1 91 Microtendipes sp. 5.53 CF 1 92 Nanocladius sp. 7.07 CG 7 1 1 2 93 Natarsia sp. A 9.95 P 94 Nilotanypus fimbriatus 3.9 P 95 Nilotanypus sp. 3.9 P 96 Omisus sp. CG 1 1 97 Orthocladius sp. 5.94 SH 1 1 5 1 1 1 98 Paracladopelma sp. 5.51 P 99 Paracladopelma undine 4.93 CG
100 Parakiefferiella sp. 5.4 CG 101 Paralauterborniella nigrohalterale 4.77 CG 102 Paramerina sp. 4.29 P 103 Parametriocnemus sp. CG 1 1 2 1 2 104 Paratanytarsus dissimilis 8.45 CF 1
* CG = collector-gatherer, CF = collector-filterer, OM = omnivore, P = predator, SH = shredder, SC = scraper

28
Table 3. Continued.
Seq Taxon TV FG 2005
001
2005
002
2005
003
2005
004
2005
005
2005
006
2005
007
2005
008
2005
009
2005
010
2005
011
2005
012
2005
013
2005
014
2005
015
2005
016
2005
017
2005
018
2005
019
Chironomidae cont. 105 Paratanytarsus sp. 8.45 CF 4 1 106 Paratendipes albimanus 5.11 CG 14 1 2 1 11 107 Paratendipes dissimilis 5.11 CG 2 108 Paratendipes sp. 5.11 CG 3 1 5 1 109 Phaenopsectra obediens gr. 6.5 SC 4 1 3 2 3 4 1 28 6 11 1 8 110 Phaenopsectra punctipes gr. 6.5 SC 8 1 1 1 111 Polypedilum aviceps 3.65 SH 112 Polypedilum fallax gr. 6.39 SH 3 2 4 13 1 4 1 113 Polypedilum flavum 5.78 SH 1 2 5 11 2 7 1 6 9 4 10 2 1 4 1 114 Polypedilum halterale gr. 7.31 SH 2 2 115 Polypedilum illinoense gr. 9 SH 5 1 5 1 1 1 2 2 116 Polypedilum scalaenum gr. 8.4 SH 2 1 1 4 1 4 1 2 1 1 1 1 117 Polypedilum sp. 5.78 SH 2 118 Procladius sp. 9.1 P 1 119 Pseudochironomus sp. 5.36 CG 1 1 1 1 120 Rheocricotopus robacki 7.28 CG 1 1 1 121 Rheotanytarsus exiguus gr. 5.89 CF 3 3 10 3 10 12 3 3 1 1 1 122 Rheotanytarsus sp. 5.89 CF 1 123 Saetheria sp. CG 124 Stenochironomus sp. 6.45 CG 1 1 125 Stictochironomus sp. 6.52 CG 5 1 3 1 1 126 Sublettia coffmani 1.6 CG 2 127 Synorthocladius sp. 4.36 CG 1 128 Tanypodinae Genus species P 1 1 129 Tanytarsus sp. 6.76 CF 7 3 2 2 4 11 2 1 1 1 2 1 130 Thienemanniella sp. 5.86 CG 2 1 4 1 131 Thienemanniella xena 5.86 CG 132 Thienemannimyia gr. 8.42 P 2 2 2 3 13 1 2 1 5 9 7 1 1 1 133 Tribelos jacundum 6.3 CG 59 36 22 26 1 1 1 8 6 1 3 6 1
* CG = collector-gatherer, CF = collector-filterer, OM = omnivore, P = predator, SH = shredder, SC = scraper

29
Table 3. Continued.
Seq Taxon TV FG 2005
020
2005
021
2005
022
2005
023
2005
024
2005
025
2005
026
2005
027
2005
028
2005
029
2005
030
2005
031
2005
032
2005
033
2005
034
2005
035
2005
036
2005
037
Chironomidae cont. 105 Paratanytarsus sp. 8.45 CF 106 Paratendipes albimanus 5.11 CG 107 Paratendipes dissimilis 5.11 CG 108 Paratendipes sp. 5.11 CG 1 1 2 7 109 Phaenopsectra obediens gr. 6.5 SC 1 11 1 6 5 8 2 1 1 14 1 7 18 4 110 Phaenopsectra punctipes gr. 6.5 SC 4 3 1 1 4 3 1 111 Polypedilum aviceps 3.65 SH 2 1 112 Polypedilum fallax gr. 6.39 SH 1 1 5 5 13 6 2 6 1 3 113 Polypedilum flavum 5.78 SH 2 1 1 8 1 3 3 114 Polypedilum halterale gr. 7.31 SH 115 Polypedilum illinoense gr. 9 SH 6 3 2 1 12 1 116 Polypedilum scalaenum gr. 8.4 SH 1 3 1 117 Polypedilum sp. 5.78 SH 118 Procladius sp. 9.1 P 1 119 Pseudochironomus sp. 5.36 CG 120 Rheocricotopus robacki 7.28 CG 1 1 1 2 121 Rheotanytarsus exiguus gr. 5.89 CF 3 2 2 1 1 1 3 7 6 122 Rheotanytarsus sp. 5.89 CF 123 Saetheria sp. CG 1 124 Stenochironomus sp. 6.45 CG 125 Stictochironomus sp. 6.52 CG 126 Sublettia coffmani 1.6 CG 127 Synorthocladius sp. 4.36 CG 2 128 Tanypodinae Genus species P 129 Tanytarsus sp. 6.76 CF 2 1 1 1 3 2 130 Thienemanniella sp. 5.86 CG 131 Thienemanniella xena 5.86 CG 1 1 1 1 132 Thienemannimyia gr. 8.42 P 1 4 1 2 1 3 1 2 2 133 Tribelos jacundum 6.3 CG 3 1 1 3 1 1 1 2
* CG = collector-gatherer, CF = collector-filterer, OM = omnivore, P = predator, SH = shredder, SC = scraper

30
Table 3. Continued.
Seq Taxon TV FG 2005
001
2005
002
2005
003
2005
004
2005
005
2005
006
2005
007
2005
008
2005
009
2005
010
2005
011
2005
012
2005
013
2005
014
2005
015
2005
016
2005
017
2005
018
2005
019
Chironomidae cont. 134 Xylotopus par 5.99 CG 4 1 4 1 4 3 3 2 1 135 Zavrelimyia sp. 9.11 P 1 2 1
Culicidae 136 Anopheles sp. 8.58 CF 1 4 2 1 3 1 137 Culicidae Genus species CF 1
Dixidae 138 Dixa sp. 2.55 CG 1 1 139 Dixella sp. CG 4 11 2 3 1 1 5 5 1 5 5 6 1 8 4
Empididae 140 Empididae Genus species P 2 1 2 141 Hemerodromia sp. 7.57 P 1
Simuliidae 142 Simulium sp. 4 CF 1 2 4 1 3 3 8 2 3 1
Syrphidae 143 Syrphidae Genus species CG
Tipulidae 144 Antocha sp. 4.25 CG 1 1 1 145 Dicranota sp. SH 146 Hexatoma sp. 4.31 P 4 1 4 1 147 Limonia sp. 9.64 SH 148 Pseudolimnophila sp. 7.22 SH 1 149 Tipula sp. 7.33 SH 2 1 1 2 150 Tipulidae cf. Hexatoma sp. P 3 1
Ephemeroptera 151 Ephemeroptera Genus species 2
Baetidae 152 Acentrella ampla 3.61 CG 153 Acerpenna macdunnoughi CG 1 154 Baetidae Genus species CG 4 2 1 3 6 1 2 2
* CG = collector-gatherer, CF = collector-filterer, OM = omnivore, P = predator, SH = shredder, SC = scraper

31
Table 3. Continued.
Seq Taxon TV FG 2005
020
2005
021
2005
022
2005
023
2005
024
2005
025
2005
026
2005
027
2005
028
2005
029
2005
030
2005
031
2005
032
2005
033
2005
034
2005
035
2005
036
2005
037
Chironomidae cont. 134 Xylotopus par 5.99 CG 9 1 3 1 20 5 3 1 1 135 Zavrelimyia sp. 9.11 P
Culicidae 136 Anopheles sp. 8.58 CF 2 1 137 Culicidae Genus species CF
Dixidae 138 Dixa sp. 2.55 CG 1 1 2 139 Dixella sp. CG 3 4 1 2 1 1
Empididae 140 Empididae Genus species P 141 Hemerodromia sp. 7.57 P 2
Simuliidae 142 Simulium sp. 4 CF 3 11 2 3 20 1 2 17 3 1
Syrphidae 143 Syrphidae Genus species CG 9 1
Tipulidae 144 Antocha sp. 4.25 CG 1 1 1 145 Dicranota sp. SH 1 1 146 Hexatoma sp. 4.31 P 1 1 4 1 3 2 1 3 1 8 1 147 Limonia sp. 9.64 SH 1 148 Pseudolimnophila sp. 7.22 SH 149 Tipula sp. 7.33 SH 1 1 6 2 1 1 1 3 150 Tipulidae cf. Hexatoma sp. P
Ephemeroptera 151 Ephemeroptera Genus species
Baetidae 152 Acentrella ampla 3.61 CG 1 2 153 Acerpenna macdunnoughi CG 154 Baetidae Genus species CG 2 1
* CG = collector-gatherer, CF = collector-filterer, OM = omnivore, P = predator, SH = shredder, SC = scraper

32
Table 3. Continued.
Seq Taxon TV FG 2005
001
2005
002
2005
003
2005
004
2005
005
2005
006
2005
007
2005
008
2005
009
2005
010
2005
011
2005
012
2005
013
2005
014
2005
015
2005
016
2005
017
2005
018
2005
019
Baetidae cont. 155 Baetis brunneicolor CG 156 Baetis intercalaris 4.99 CG 2 1 6 1 11 4 1 5 157 Baetis pluto 4.28 CG 4 13 3 2 4 5 4 3 4 5 2 3 16 158 Baetis sp. 4.71 CG 4 4 159 Centroptilum sp. 6.6 CG 1 160 Labiobaetis frondalis 7.46 CG 161 Labiobaetis propinquus 5.77 CG 1 3 9 2 1 1 162 Procloeon sp. 5 OM 1 2 3 4 2 163 Pseudocloeon sp. 4.02 SC
Baetiscidae 164 Baetisca gibbera 1.43 CG 165 Baetisca sp. CG 1
Caenidae 166 Brachycercus sp. CG 1 4 167 Caenidae cf. Brachycercus sp. CG 2 168 Caenis sp. 7.41 CG 60 30 59 3 1 6 3 6 1 38 22 19 11 27 3 14 2
Ephemerellidae 169 Drunella tuberculata CG 170 Serratella deficiens 2.75 CG 1 1 9 3 171 Serratella sp. CG 8 172 Timpanoga simplex 3.61 CG 1
Ephemeridae 173 Hexagenia limbata 4.9 CG 5 5
Heptageniidae 174 Epeorus sp. 1.27 CG 4 2 1 175 Heptagenia marginalis 2.26 SC 16 1 1 4 176 Heptagenia sp. 2.57 SC 177 Heptageniidae Genus species SC 19 11 2 1 2 5 1 1 2 4 3
* CG = collector-gatherer, CF = collector-filterer, OM = omnivore, P = predator, SH = shredder, SC = scraper

33
Table 3. Continued.
Seq Taxon TV FG 2005
020
2005
021
2005
022
2005
023
2005
024
2005
025
2005
026
2005
027
2005
028
2005
029
2005
030
2005
031
2005
032
2005
033
2005
034
2005
035
2005
036
2005
037
Baetidae cont. 155 Baetis brunneicolor CG 3 156 Baetis intercalaris 4.99 CG 1 1 2 1 2 1 4 1 3 3 157 Baetis pluto 4.28 CG 3 7 1 9 4 9 1 23 3 1 2 12 2 3 2 158 Baetis sp. 4.71 CG 159 Centroptilum sp. 6.6 CG 160 Labiobaetis frondalis 7.46 CG 1 1 161 Labiobaetis propinquus 5.77 CG 14 1 4 3 3 162 Procloeon sp. 5 OM 1 1 1 1 163 Pseudocloeon sp. 4.02 SC 1 2
Baetiscidae 164 Baetisca gibbera 1.43 CG 2 165 Baetisca sp. CG
Caenidae 166 Brachycercus sp. CG 1 1 2 1 167 Caenidae cf. Brachycercus sp. CG 168 Caenis sp. 7.41 CG 10 32 6 1 1 2 3 5 2 1
Ephemerellidae 169 Drunella tuberculata CG 2 170 Serratella deficiens 2.75 CG 5 2 1 2 17 6 6 1 5 171 Serratella sp. CG 172 Timpanoga simplex 3.61 CG
Ephemeridae 173 Hexagenia limbata 4.9 CG 4 1 1 1 1
Heptageniidae 174 Epeorus sp. 1.27 CG 23 4 175 Heptagenia marginalis 2.26 SC 1 3 176 Heptagenia sp. 2.57 SC 1 1 7 7 177 Heptageniidae Genus species SC 2 1 2 4 1 2 1 1
* CG = collector-gatherer, CF = collector-filterer, OM = omnivore, P = predator, SH = shredder, SC = scraper

34
Table 3. Continued.
Seq Taxon TV FG 2005
001
2005
002
2005
003
2005
004
2005
005
2005
006
2005
007
2005
008
2005
009
2005
010
2005
011
2005
012
2005
013
2005
014
2005
015
2005
016
2005
017
2005
018
2005
019
Heptageniidae cont. 178 Leucrocuta sp. 2.4 SC 6 10 6 1 30 2 35 2 179 Stenacron interpunctatum 6.87 SC 23 46 14 2 43 20 42 12 1 59 17 51 37 31 10 180 Stenacron pallidum 2.72 SC 181 Stenacron sp. SC 2 1 3 3 182 Stenonema femoratum 7.18 SC 15 4 2 1 183 Stenonema modestum 5.5 SC 1 12 63 39 62 41 71 99 52 22 63 81 39 51 49 52 41 24 21 184 Stenonema sp. 3.45 SC 20 14 19 1 5 6 1
Isonychiidae 185 Isonychia sp. 3.45 CF 3 11 11 12 34 26 2 23 6 10 1 22 23 4
Leptohyphidae 186 Tricorythodes sp. 5.06 CG 3 2 14 32 3 7 13 5 2 1
Leptophlebiidae 187 Habrophlebiodes sp. CG 4 5 4 8 188 Leptophlebiidae Genus species CG 1 2 189 Paraleptophlebia moerens 0.94 CG
Neoephemeridae 190 Neoephemera purpurea 1.57 CG
Heteroptera Belostomatidae
191 Belostoma sp. 9.8 P 1 Gelastocoridae
192 Gelastocoris oculatus P 1 Gerridae
193 Gerris sp. P 1 194 Trepobates sp. P
Notonectidae 195 Notonecta irrorata 8.71 P 2
* CG = collector-gatherer, CF = collector-filterer, OM = omnivore, P = predator, SH = shredder, SC = scraper
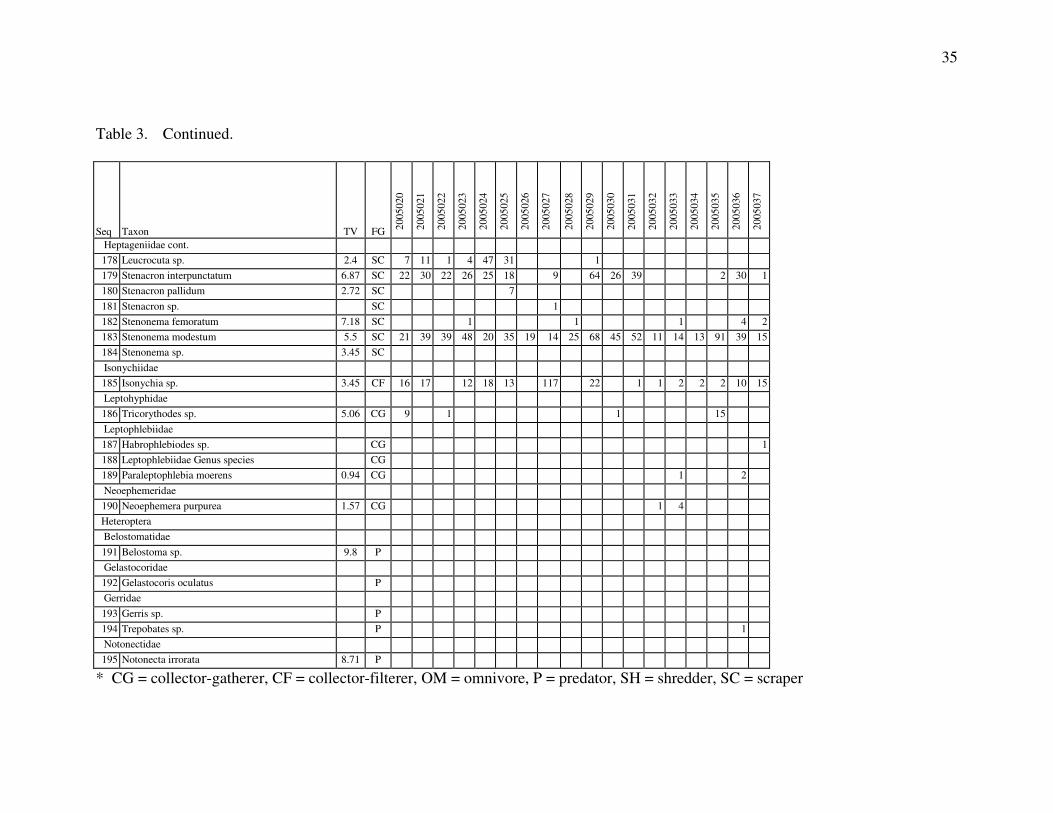
35
Table 3. Continued.
Seq Taxon TV FG 2005
020
2005
021
2005
022
2005
023
2005
024
2005
025
2005
026
2005
027
2005
028
2005
029
2005
030
2005
031
2005
032
2005
033
2005
034
2005
035
2005
036
2005
037
Heptageniidae cont. 178 Leucrocuta sp. 2.4 SC 7 11 1 4 47 31 1 179 Stenacron interpunctatum 6.87 SC 22 30 22 26 25 18 9 64 26 39 2 30 1 180 Stenacron pallidum 2.72 SC 7 181 Stenacron sp. SC 1 182 Stenonema femoratum 7.18 SC 1 1 1 4 2 183 Stenonema modestum 5.5 SC 21 39 39 48 20 35 19 14 25 68 45 52 11 14 13 91 39 15 184 Stenonema sp. 3.45 SC
Isonychiidae 185 Isonychia sp. 3.45 CF 16 17 12 18 13 117 22 1 1 2 2 2 10 15
Leptohyphidae 186 Tricorythodes sp. 5.06 CG 9 1 1 15
Leptophlebiidae 187 Habrophlebiodes sp. CG 1 188 Leptophlebiidae Genus species CG 189 Paraleptophlebia moerens 0.94 CG 1 2
Neoephemeridae 190 Neoephemera purpurea 1.57 CG 1 4
Heteroptera Belostomatidae
191 Belostoma sp. 9.8 P Gelastocoridae
192 Gelastocoris oculatus P Gerridae
193 Gerris sp. P 194 Trepobates sp. P 1
Notonectidae 195 Notonecta irrorata 8.71 P
* CG = collector-gatherer, CF = collector-filterer, OM = omnivore, P = predator, SH = shredder, SC = scraper

36
Table 3. Continued.
Seq Taxon TV FG 2005
001
2005
002
2005
003
2005
004
2005
005
2005
006
2005
007
2005
008
2005
009
2005
010
2005
011
2005
012
2005
013
2005
014
2005
015
2005
016
2005
017
2005
018
2005
019
Veliidae 196 Microvelia sp. P 1 3 197 Rhagovelia obesa P 3 1 2 1
Lepidoptera Cossidae
198 Cossidae cf. Prionoxystus sp. SH 1 Megaloptera Corydalidae
199 Corydalus cornutus 5.16 P 1 1 3 1 1 2 4 1 8 2 4 2 3 200 Nigronia serricornis 4.95 P 1 11 3 14 1 14 4 11 6 3 1 2 2 4 10 5 8 2
Sialidae 201 Sialis sp. 7.17 P 2 1 1
Odonata Aeshnidae
202 Basiaeschna janata 7.35 P 2 6 203 Boyeria vinosa 5.89 P 1 2 7 7 10 6 15 2 11 2 7 6 20 1 23 6 1 204 Gomphaeschna cf. furcillata 6 P 1
Calopterygidae 205 Calopterygidae Genus species P 6 206 Calopteryx maculata 7.78 P 3 8 4 1 16 5 207 Calopteryx sp. 7.78 P 1 1 7 11 1 15 1 1 7
Coenagrionidae 208 Argia bipunctulata 8.17 P 2 209 Argia sp. 8.17 P 4 210 Coenagrionidae Genus species P 1 211 Enallagma sp. 8.91 P 1 2
Cordulegastridae 212 Cordulegaster erronea 5.73 P 1 1 213 Cordulegaster maculata 5.7 P 1 214 Cordulegaster sp. 5.73 P 4 3 1 2 3
* CG = collector-gatherer, CF = collector-filterer, OM = omnivore, P = predator, SH = shredder, SC = scraper

37
Table 3. Continued.
Seq Taxon TV FG 2005
020
2005
021
2005
022
2005
023
2005
024
2005
025
2005
026
2005
027
2005
028
2005
029
2005
030
2005
031
2005
032
2005
033
2005
034
2005
035
2005
036
2005
037
Veliidae 196 Microvelia sp. P 1 1 3 1 1 2 197 Rhagovelia obesa P 1 1 1 10
Lepidoptera Cossidae
198 Cossidae cf. Prionoxystus sp. SH Megaloptera Corydalidae
199 Corydalus cornutus 5.16 P 24 13 3 5 3 5 5 1 200 Nigronia serricornis 4.95 P 3 5 2 7 10 4 5 9 6 6 11 3 3 30 4
Sialidae 201 Sialis sp. 7.17 P 1 3
Odonata Aeshnidae
202 Basiaeschna janata 7.35 P 203 Boyeria vinosa 5.89 P 1 3 7 4 16 6 9 4 4 10 9 2 11 4 7 4 3 204 Gomphaeschna cf. furcillata 6 P
Calopterygidae 205 Calopterygidae Genus species P 206 Calopteryx maculata 7.78 P 207 Calopteryx sp. 7.78 P 2 3 1 1 1 12 9 3 3 4 7 1 3 4
Coenagrionidae 208 Argia bipunctulata 8.17 P 9 209 Argia sp. 8.17 P 2 210 Coenagrionidae Genus species P 1 211 Enallagma sp. 8.91 P
Cordulegastridae 212 Cordulegaster erronea 5.73 P 213 Cordulegaster maculata 5.7 P 2 3 1 7 3 4 1 1 1 7 6 214 Cordulegaster sp. 5.73 P 6 35 4 3
* CG = collector-gatherer, CF = collector-filterer, OM = omnivore, P = predator, SH = shredder, SC = scraper

38
Table 3. Continued.
Seq Taxon TV FG 2005
001
2005
002
2005
003
2005
004
2005
005
2005
006
2005
007
2005
008
2005
009
2005
010
2005
011
2005
012
2005
013
2005
014
2005
015
2005
016
2005
017
2005
018
2005
019
Gomphidae 215 Gomphidae Genus species P 1 1 1 5 1 4 3 1 216 Gomphus lividus 5.8 P 1 217 Gomphus sp. 5.8 P 1 3 2 1 5 3 2 1 3 218 Hagenius brevistylus 3.99 P 1 1 1 1 219 Ophiogomphus mainensis P 7 2 4 9 4 2 220 Ophiogomphus sp. 5.54 P 6 4 14 2 6 3 2 221 Progomphus cf. obscurus P 29 12 222 Progomphus obscurus 8.22 P 7 10 16 4 4 1 223 Progomphus sp. P 4 4 2 224 Stylogomphus albistylus 4.72 P 12 2 2 5
Libellulidae 225 Libellula semifasciata 9.64 P 226 Libellulidae cf. Neurocordulia sp. P 3 227 Libellulidae Genus species. P 5 1 1 228 Macromia alleghaniensis 6.16 P 1 229 Macromia margarita 6.16 P 1 230 Macromia sp. 6.16 P 231 Macromiinae Genus species P 3 2 4 1 232 Perithemis sp. 9.85 P 1 1 1
Plecoptera 233 Plecoptera Genus species 1
Chloroperlidae 234 Haploperla brevis 0.98 SC
Leuctridae 235 Leuctra sp. 0.67 SH 1 236 Leuctridae cf. Leuctra sp. SH 3 1 237 Plecoptera cf. Leuctridae Genus species SH 17 4
* CG = collector-gatherer, CF = collector-filterer, OM = omnivore, P = predator, SH = shredder, SC = scraper

39
Table 3. Continued.
Seq Taxon TV FG 2005
020
2005
021
2005
022
2005
023
2005
024
2005
025
2005
026
2005
027
2005
028
2005
029
2005
030
2005
031
2005
032
2005
033
2005
034
2005
035
2005
036
2005
037
Gomphidae 215 Gomphidae Genus species P 1 216 Gomphus lividus 5.8 P 217 Gomphus sp. 5.8 P 2 2 3 1 3 12 2 1 6 1 1 3 218 Hagenius brevistylus 3.99 P 1 219 Ophiogomphus mainensis P 7 1 6 1 4 4 2 2 1 8 220 Ophiogomphus sp. 5.54 P 1 221 Progomphus cf. obscurus P 222 Progomphus obscurus 8.22 P 1 1 5 2 2 7 3 223 Progomphus sp. P 224 Stylogomphus albistylus 4.72 P 3 3 2 3 2 1 1 1 1 2 2 6
Libellulidae 225 Libellula semifasciata 9.64 P 1 226 Libellulidae cf. Neurocordulia sp. P 227 Libellulidae Genus species. P 228 Macromia alleghaniensis 6.16 P 229 Macromia margarita 6.16 P 230 Macromia sp. 6.16 P 1 1 1 1 231 Macromiinae Genus species P 232 Perithemis sp. 9.85 P
Plecoptera 233 Plecoptera Genus species
Chloroperlidae 234 Haploperla brevis 0.98 SC 1
Leuctridae 235 Leuctra sp. 0.67 SH 4 1 2 1 30 1 2 7 3 9 236 Leuctridae cf. Leuctra sp. SH 237 Plecoptera cf. Leuctridae Genus species SH
* CG = collector-gatherer, CF = collector-filterer, OM = omnivore, P = predator, SH = shredder, SC = scraper

40
Table 3. Continued.
Seq Taxon TV FG 2005
001
2005
002
2005
003
2005
004
2005
005
2005
006
2005
007
2005
008
2005
009
2005
010
2005
011
2005
012
2005
013
2005
014
2005
015
2005
016
2005
017
2005
018
2005
019
Peltoperlidae 238 Peltoperla sp. SH 239 Tallaperla sp. 1.19 SH
Perlidae 240 Acroneuria abnormis 2.06 P 241 Acroneuria carolinensis P 242 Agnetina sp. P 1 3 7 1 243 Attaneuria ruralis P 244 Beloneuria sp. P 13 11 1 245 Neoperla sp. 1.49 P 3 1 246 Paragnetina fumosa 3.36 P 1 247 Paragnetina immarginata 1.38 P 4 248 Paragnetina kansensis 1.99 P 1 249 Perlesta sp. 4.7 P 1 7 1 250 Perlidae cf. Acroneuria sp. P 2 23 251 Perlidae cf. Perlinella sp. P 4 252 Perlidae Genus species P 2 8 253 Perlinella sp. P 3 1
Perlodidae 254 Malirekus hastatus 1.15 P
Pteronarcyidae 255 Pteronarcys sp. 1.67 SH 13 1 2 14
Trichoptera Brachycentridae
256 Brachycentrus sp. 2.08 CF Calamoceratidae
257 Heteroplectron americanum 3.23 SH Glossosomatidae
258 Glossosoma sp. 1.55 SC
* CG = collector-gatherer, CF = collector-filterer, OM = omnivore, P = predator, SH = shredder, SC = scraper

41
Table 3. Continued.
Seq Taxon TV FG 2005
020
2005
021
2005
022
2005
023
2005
024
2005
025
2005
026
2005
027
2005
028
2005
029
2005
030
2005
031
2005
032
2005
033
2005
034
2005
035
2005
036
2005
037
Peltoperlidae 238 Peltoperla sp. SH 5 239 Tallaperla sp. 1.19 SH 1 4 13 1 16 5 68 50
Perlidae 240 Acroneuria abnormis 2.06 P 3 2 1 4 15 9 17 15 241 Acroneuria carolinensis P 1 242 Agnetina sp. P 5 243 Attaneuria ruralis P 7 244 Beloneuria sp. P 5 4 1 6 16 7 54 3 4 4 19 8 9 1 19 245 Neoperla sp. 1.49 P 246 Paragnetina fumosa 3.36 P 247 Paragnetina immarginata 1.38 P 248 Paragnetina kansensis 1.99 P 3 249 Perlesta sp. 4.7 P 1 250 Perlidae cf. Acroneuria sp. P 251 Perlidae cf. Perlinella sp. P 252 Perlidae Genus species P 253 Perlinella sp. P
Perlodidae 254 Malirekus hastatus 1.15 P 3
Pteronarcyidae 255 Pteronarcys sp. 1.67 SH 5 1 5 6 3
Trichoptera Brachycentridae
256 Brachycentrus sp. 2.08 CF 1 Calamoceratidae
257 Heteroplectron americanum 3.23 SH 1 Glossosomatidae
258 Glossosoma sp. 1.55 SC 3 14 1
* CG = collector-gatherer, CF = collector-filterer, OM = omnivore, P = predator, SH = shredder, SC = scraper
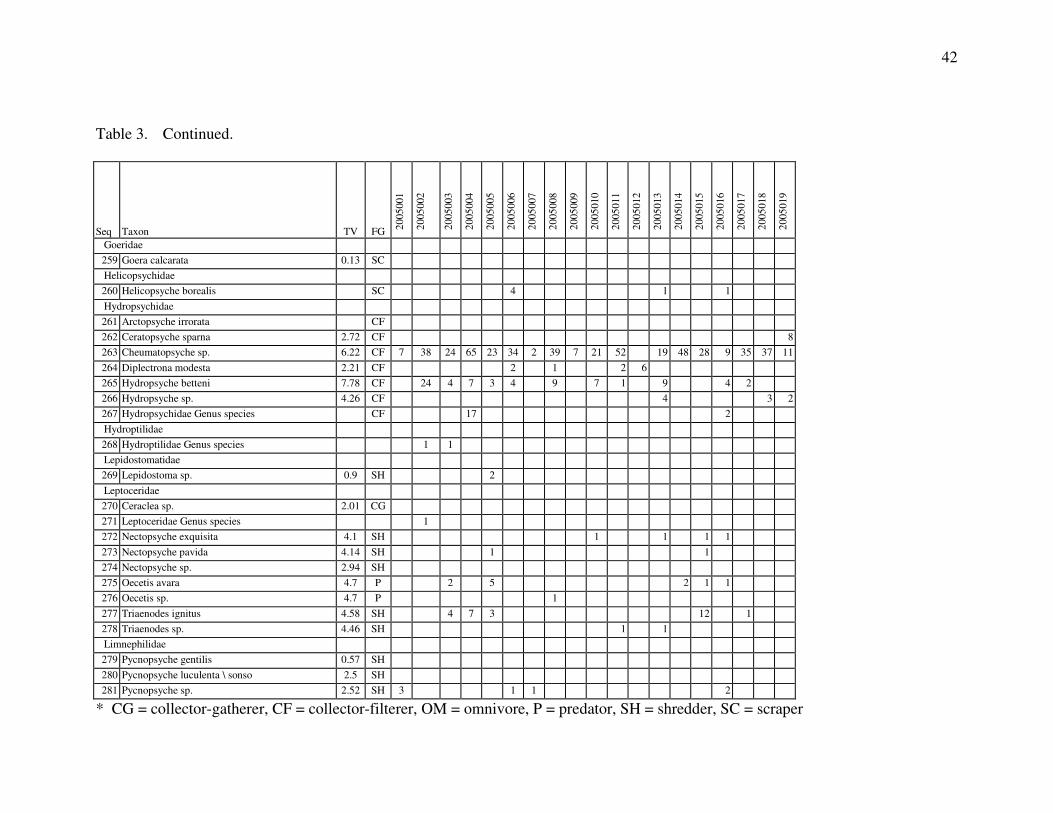
42
Table 3. Continued.
Seq Taxon TV FG 2005
001
2005
002
2005
003
2005
004
2005
005
2005
006
2005
007
2005
008
2005
009
2005
010
2005
011
2005
012
2005
013
2005
014
2005
015
2005
016
2005
017
2005
018
2005
019
Goeridae 259 Goera calcarata 0.13 SC
Helicopsychidae 260 Helicopsyche borealis SC 4 1 1
Hydropsychidae 261 Arctopsyche irrorata CF 262 Ceratopsyche sparna 2.72 CF 8 263 Cheumatopsyche sp. 6.22 CF 7 38 24 65 23 34 2 39 7 21 52 19 48 28 9 35 37 11 264 Diplectrona modesta 2.21 CF 2 1 2 6 265 Hydropsyche betteni 7.78 CF 24 4 7 3 4 9 7 1 9 4 2 266 Hydropsyche sp. 4.26 CF 4 3 2 267 Hydropsychidae Genus species CF 17 2
Hydroptilidae 268 Hydroptilidae Genus species 1 1
Lepidostomatidae 269 Lepidostoma sp. 0.9 SH 2
Leptoceridae 270 Ceraclea sp. 2.01 CG 271 Leptoceridae Genus species 1 272 Nectopsyche exquisita 4.1 SH 1 1 1 1 273 Nectopsyche pavida 4.14 SH 1 1 274 Nectopsyche sp. 2.94 SH 275 Oecetis avara 4.7 P 2 5 2 1 1 276 Oecetis sp. 4.7 P 1 277 Triaenodes ignitus 4.58 SH 4 7 3 12 1 278 Triaenodes sp. 4.46 SH 1 1
Limnephilidae 279 Pycnopsyche gentilis 0.57 SH 280 Pycnopsyche luculenta \ sonso 2.5 SH 281 Pycnopsyche sp. 2.52 SH 3 1 1 2
* CG = collector-gatherer, CF = collector-filterer, OM = omnivore, P = predator, SH = shredder, SC = scraper

43
Table 3. Continued. Seq Taxon TV FG
2005
020
2005
021
2005
022
2005
023
2005
024
2005
025
2005
026
2005
027
2005
028
2005
029
2005
030
2005
031
2005
032
2005
033
2005
034
2005
035
2005
036
2005
037
Goeridae 259 Goera calcarata 0.13 SC 1
Helicopsychidae 260 Helicopsyche borealis SC
Hydropsychidae 261 Arctopsyche irrorata CF 13 262 Ceratopsyche sparna 2.72 CF 4 32 7 263 Cheumatopsyche sp. 6.22 CF 8 34 2 11 5 14 19 44 45 17 39 6 16 14 43 16 2 264 Diplectrona modesta 2.21 CF 1 3 33 10 265 Hydropsyche betteni 7.78 CF 1 9 2 3 2 17 6 2 6 9 266 Hydropsyche sp. 4.26 CF 1 2 1 1 1 267 Hydropsychidae Genus species CF 1 1
Hydroptilidae 268 Hydroptilidae Genus species
Lepidostomatidae 269 Lepidostoma sp. 0.9 SH 4 3 17
Leptoceridae 270 Ceraclea sp. 2.01 CG 1 271 Leptoceridae Genus species 272 Nectopsyche exquisita 4.1 SH 5 3 1 273 Nectopsyche pavida 4.14 SH 274 Nectopsyche sp. 2.94 SH 1 275 Oecetis avara 4.7 P 1 1 1 276 Oecetis sp. 4.7 P 277 Triaenodes ignitus 4.58 SH 1 2 1 5 3 278 Triaenodes sp. 4.46 SH 2 1 1 2
Limnephilidae 279 Pycnopsyche gentilis 0.57 SH 1 280 Pycnopsyche luculenta \ sonso 2.5 SH 1 2 4 1 3 2 281 Pycnopsyche sp. 2.52 SH
* CG = collector-gatherer, CF = collector-filterer, OM = omnivore, P = predator, SH = shredder, SC = scraper

44
Table 3. Continued.
Seq Taxon TV FG 2005
001
2005
002
2005
003
2005
004
2005
005
2005
006
2005
007
2005
008
2005
009
2005
010
2005
011
2005
012
2005
013
2005
014
2005
015
2005
016
2005
017
2005
018
2005
019
Philopotamidae 282 Chimarra sp. 2.76 CF 79 1 1 13 29 7 18 39 26 57 10 7 41 3 283 Dolophilodes sp. 0.81 CF 284 Philopotamidae Genus species CF 1 1
Polycentropodidae 285 Neureclipsis crepuscularis 4.19 CF 286 Paranyctiophylax sp. 0.85 P 1 287 Phylocentropus sp. 6.2 CF 1 288 Polycentropus sp. 3.53 P 1
Psychomyiidae 289 Lype diversa 4.05 SC
Rhyacophilidae 290 Rhyacophila fuscula 1.88 P 291 Rhyacophila sp. P 292 Rhyacophila tuberculata P
Uenoidae 293 Neophylax consimilis 2.2 SC 294 Neophylax mitchelli 2.2 SC 16 7 295 Neophylax oligius 2.2 SC 31 296 Neophylax sp. 2.2 SC
Mollusca Bivalvia Unionoida Corbiculidae
297 Corbicula sp. CF 3 2 2 8 5 1 8 10 6 2 Sphaeriidae
298 Sphaerium sp. CF 3 1
* CG = collector-gatherer, CF = collector-filterer, OM = omnivore, P = predator, SH = shredder, SC = scraper
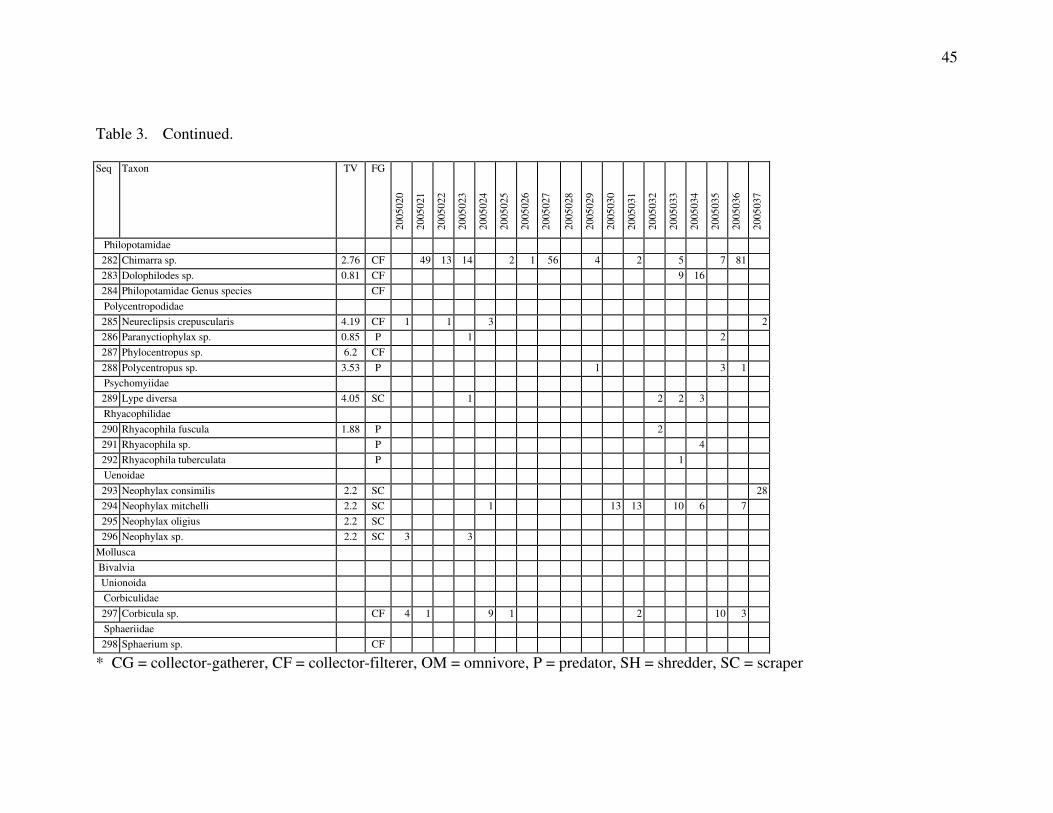
45
Table 3. Continued. Seq Taxon TV FG
2005
020
2005
021
2005
022
2005
023
2005
024
2005
025
2005
026
2005
027
2005
028
2005
029
2005
030
2005
031
2005
032
2005
033
2005
034
2005
035
2005
036
2005
037
Philopotamidae 282 Chimarra sp. 2.76 CF 49 13 14 2 1 56 4 2 5 7 81 283 Dolophilodes sp. 0.81 CF 9 16 284 Philopotamidae Genus species CF
Polycentropodidae 285 Neureclipsis crepuscularis 4.19 CF 1 1 3 2 286 Paranyctiophylax sp. 0.85 P 1 2 287 Phylocentropus sp. 6.2 CF 288 Polycentropus sp. 3.53 P 1 3 1
Psychomyiidae 289 Lype diversa 4.05 SC 1 2 2 3
Rhyacophilidae 290 Rhyacophila fuscula 1.88 P 2 291 Rhyacophila sp. P 4 292 Rhyacophila tuberculata P 1
Uenoidae 293 Neophylax consimilis 2.2 SC 28 294 Neophylax mitchelli 2.2 SC 1 13 13 10 6 7 295 Neophylax oligius 2.2 SC 296 Neophylax sp. 2.2 SC 3 3
Mollusca Bivalvia Unionoida Corbiculidae
297 Corbicula sp. CF 4 1 9 1 2 10 3 Sphaeriidae
298 Sphaerium sp. CF
* CG = collector-gatherer, CF = collector-filterer, OM = omnivore, P = predator, SH = shredder, SC = scraper
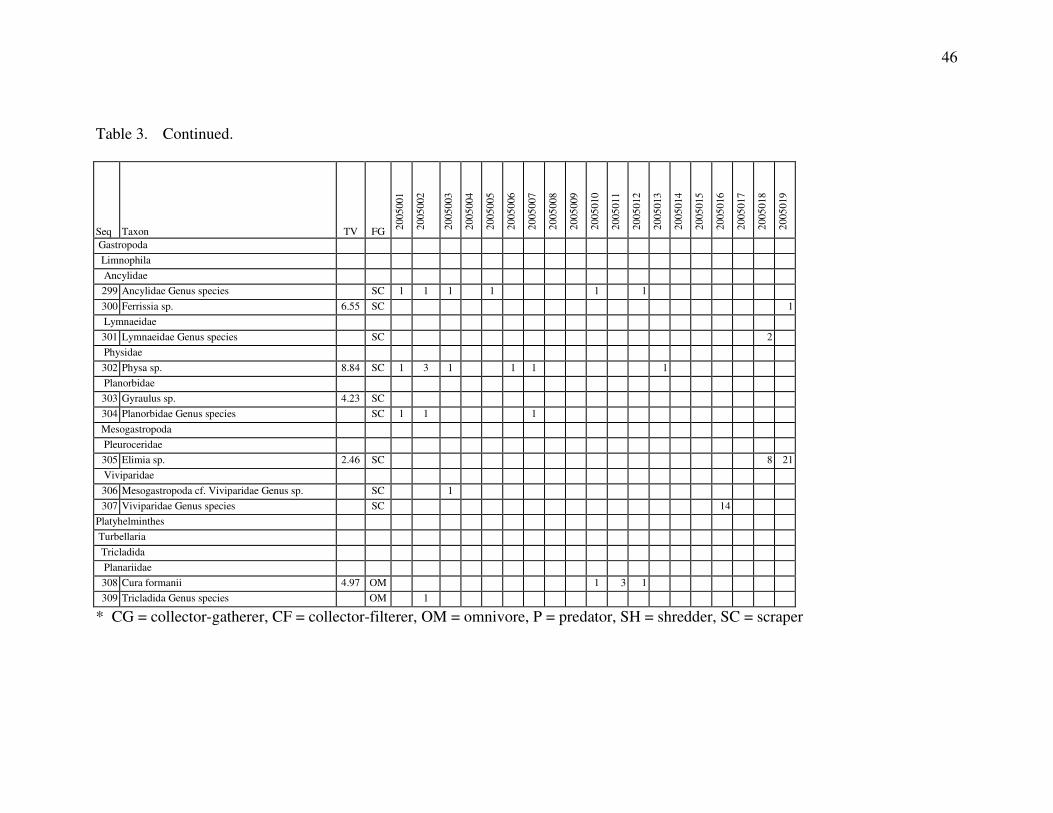
46
Table 3. Continued.
Seq Taxon TV FG 2005
001
2005
002
2005
003
2005
004
2005
005
2005
006
2005
007
2005
008
2005
009
2005
010
2005
011
2005
012
2005
013
2005
014
2005
015
2005
016
2005
017
2005
018
2005
019
Gastropoda Limnophila Ancylidae
299 Ancylidae Genus species SC 1 1 1 1 1 1 300 Ferrissia sp. 6.55 SC 1
Lymnaeidae 301 Lymnaeidae Genus species SC 2
Physidae 302 Physa sp. 8.84 SC 1 3 1 1 1 1
Planorbidae 303 Gyraulus sp. 4.23 SC 304 Planorbidae Genus species SC 1 1 1
Mesogastropoda Pleuroceridae
305 Elimia sp. 2.46 SC 8 21 Viviparidae
306 Mesogastropoda cf. Viviparidae Genus sp. SC 1 307 Viviparidae Genus species SC 14
Platyhelminthes Turbellaria Tricladida Planariidae
308 Cura formanii 4.97 OM 1 3 1 309 Tricladida Genus species OM 1
* CG = collector-gatherer, CF = collector-filterer, OM = omnivore, P = predator, SH = shredder, SC = scraper

47
Table 3. Continued. Seq Taxon TV FG
2005
020
2005
021
2005
022
2005
023
2005
024
2005
025
2005
026
2005
027
2005
028
2005
029
2005
030
2005
031
2005
032
2005
033
2005
034
2005
035
2005
036
2005
037
Gastropoda Limnophila Ancylidae
299 Ancylidae Genus species SC 300 Ferrissia sp. 6.55 SC 1 1 1
Lymnaeidae 301 Lymnaeidae Genus species SC
Physidae 302 Physa sp. 8.84 SC 3
Planorbidae 303 Gyraulus sp. 4.23 SC 2 304 Planorbidae Genus species SC
Mesogastropoda Pleuroceridae
305 Elimia sp. 2.46 SC 4 27 17 68 6 8 22 44 Viviparidae
306 Mesogastropoda cf. Viviparidae Genus sp. SC 307 Viviparidae Genus species SC
Platyhelminthes Turbellaria Tricladida Planariidae
308 Cura formanii 4.97 OM 2 309 Tricladida Genus species OM
* CG = collector-gatherer, CF = collector-filterer, OM = omnivore, P = predator, SH = shredder, SC = scraper

48
Table 4. Dominant taxa (>5% of the collection) for the sampling locations in the Broad River drainage South Carolina, 13 July-19 August 2005.
2005001 2005002 2005003 Taxon No. Rel. Abd. Taxon No. Rel. Abd. Taxon No. Rel. Abd. Caenis sp. 60 17.75 Chimarra sp. 79 17.67 Stenonema modestum 63 14.93 Tribelos jacundum 59 17.46 Stenacron interpunctatum 46 10.29 Caenis sp. 59 13.98 Microtendipes pedellus gr. 23 6.80 Cheumatopsyche sp. 38 8.50 Dubiraphia sp. 33 7.82 Stenacron interpunctatum 23 6.80 Tribelos jacundum 36 8.05 Cheumatopsyche sp. 24 5.69 Stenonema sp. 20 5.92 Caenis sp. 30 6.71 Tribelos jacundum 22 5.21 Heptageniidae Genus species 19 5.62 Hydropsyche betteni 24 5.37 2005004 2005005 2005006 Taxon No. Rel. Abd. Taxon No. Rel. Abd. Taxon No. Rel. Abd. Cheumatopsyche sp. 65 20.50 Stenonema modestum 62 18.24 Stenonema modestum 41 10.17 Stenonema modestum 39 12.30 Stenacron interpunctatum 43 12.65 Cheumatopsyche sp. 34 8.44
Tribelos jacundum 26 8.20 Microtendipes pedellus gr. 25 7.35 Isonychia sp. 34 8.44
Stenonema sp. 19 5.99 Cheumatopsyche sp. 23 6.76 Chimarra sp. 29 7.20 Hydropsychidae Genus species 17 5.36
Branchiobdellidae Genus species 28 6.95
2005007 2005008 2005009 Taxon No. Rel. Abd. Taxon No. Rel. Abd. Taxon No. Rel. Abd. Stenonema modestum 71 26.01 Stenonema modestum 99 23.29 Stenonema modestum 52 24.88 Progomphus cf. obscurus 29 10.62 Cheumatopsyche sp. 39 9.18 Polypedilum fallax gr. 13 6.22 Paratanytarsus dissimilis 22 8.06 Tricorythodes sp. 32 7.53 Boyeria vinosa 11 5.26 Lebertia sp. 15 5.49 Isonychia sp. 26 6.12
Boyeria vinosa 15 5.49 Perlidae cf. Acroneuria sp. 23 5.41
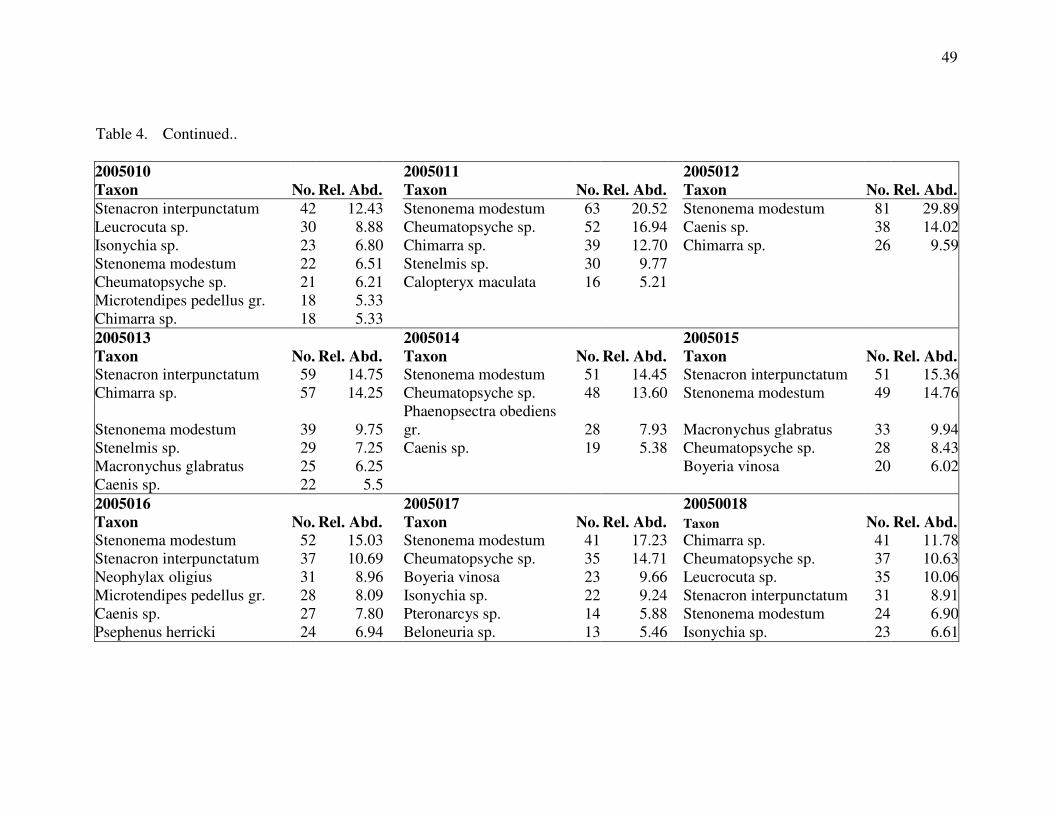
49
Table 4. Continued.. 2005010 2005011 2005012 Taxon No. Rel. Abd. Taxon No. Rel. Abd. Taxon No. Rel. Abd. Stenacron interpunctatum 42 12.43 Stenonema modestum 63 20.52 Stenonema modestum 81 29.89Leucrocuta sp. 30 8.88 Cheumatopsyche sp. 52 16.94 Caenis sp. 38 14.02Isonychia sp. 23 6.80 Chimarra sp. 39 12.70 Chimarra sp. 26 9.59Stenonema modestum 22 6.51 Stenelmis sp. 30 9.77 Cheumatopsyche sp. 21 6.21 Calopteryx maculata 16 5.21 Microtendipes pedellus gr. 18 5.33 Chimarra sp. 18 5.33 2005013 2005014 2005015 Taxon No. Rel. Abd. Taxon No. Rel. Abd. Taxon No. Rel. Abd. Stenacron interpunctatum 59 14.75 Stenonema modestum 51 14.45 Stenacron interpunctatum 51 15.36Chimarra sp. 57 14.25 Cheumatopsyche sp. 48 13.60 Stenonema modestum 49 14.76
Stenonema modestum 39 9.75 Phaenopsectra obediens gr. 28 7.93 Macronychus glabratus 33 9.94
Stenelmis sp. 29 7.25 Caenis sp. 19 5.38 Cheumatopsyche sp. 28 8.43Macronychus glabratus 25 6.25 Boyeria vinosa 20 6.02Caenis sp. 22 5.5 2005016 2005017 20050018 Taxon No. Rel. Abd. Taxon No. Rel. Abd. Taxon No. Rel. Abd. Stenonema modestum 52 15.03 Stenonema modestum 41 17.23 Chimarra sp. 41 11.78Stenacron interpunctatum 37 10.69 Cheumatopsyche sp. 35 14.71 Cheumatopsyche sp. 37 10.63Neophylax oligius 31 8.96 Boyeria vinosa 23 9.66 Leucrocuta sp. 35 10.06Microtendipes pedellus gr. 28 8.09 Isonychia sp. 22 9.24 Stenacron interpunctatum 31 8.91Caenis sp. 27 7.80 Pteronarcys sp. 14 5.88 Stenonema modestum 24 6.90Psephenus herricki 24 6.94 Beloneuria sp. 13 5.46 Isonychia sp. 23 6.61

50
Table 4. Continued.. 2005019 2005020 2005021 Taxon No. Rel. Abd. Taxon No. Rel. Abd. Taxon No. Rel. Abd. Stenonema modestum 21 12.14 Corydalus cornutus 24 11.88 Chimarra sp. 49 15.51Elimia sp. 21 12.14 Stenacron interpunctatum 22 10.89 Stenonema modestum 39 12.34Baetis pluto 16 9.25 Stenonema modestum 21 10.40 Cheumatopsyche sp. 34 10.76Cheumatopsyche sp. 11 6.36 Isonychia sp. 16 7.92 Stenacron interpunctatum 30 9.49Stenacron interpunctatum 10 5.78 Isonychia sp. 17 5.382005022 2005023 2005024 Taxon No. Rel. Abd. Taxon No. Rel. Abd. Taxon No. Rel. Abd. Stenonema modestum 39 21.79 Stenonema modestum 48 20.69 Leucrocuta sp. 47 15.72Caenis sp. 32 17.88 Stenacron interpunctatum 26 11.21 Stenelmis sp. 41 13.71Stenacron interpunctatum 22 12.29 Chimarra sp. 14 6.03 Elimia sp. 27 9.03Chimarra sp. 13 7.26 Isonychia sp. 12 5.17 Stenacron interpunctatum 25 8.36 Stenonema modestum 20 6.69 Isonychia sp. 18 6.02 Macronychus glabratus 16 5.35 Boyeria vinosa 16 5.352005025 2005026 20050027 Taxon No. Rel. Abd. Taxon No. Rel. Abd. Taxon No. Rel. Abd. Stenonema modestum 35 15.22 Cheumatopsyche sp. 19 11.95 Isonychia sp. 117 27.34Leucrocuta sp. 31 13.48 Stenonema modestum 19 11.95 Chimarra sp. 56 13.08Stenacron interpunctatum 18 7.83 Beloneuria sp. 16 10.06 Cheumatopsyche sp. 44 10.28Cheumatopsyche sp. 14 6.09 Calopteryx sp. 12 7.55 Microtendipes pedellus gr. 13 5.65 Simulium sp. 11 6.92 Tallaperla sp. 13 5.65 Boyeria vinosa 9 5.66 Isonychia sp. 13 5.65

51
Table 4. Continued.. 2005028 2005029 2005030 Taxon No. Rel. Abd. Taxon No. Rel. Abd. Taxon No. Rel. Abd. Beloneuria sp. 54 16.93 Stenonema modestum 68 17.44 Stenonema modestum 45 15.52Cheumatopsyche sp. 45 14.11 Stenacron interpunctatum 64 16.41 Cheumatopsyche sp. 39 13.45
Cordulegaster sp. 35 10.97 Ceratopsyche sparna 32 8.21 Branchiobdellidae Genus species 28 9.66
Stenonema modestum 25 7.84 Leuctra sp. 30 7.69 Stenacron interpunctatum 26 8.97Xylotopus par 20 6.27 Baetis pluto 23 5.90 Elimia sp. 17 5.86Hydropsyche betteni 17 5.33 Isonychia sp. 22 5.64 Simulium sp. 20 5.13 2005031 2005032 2005033 Taxon No. Rel. Abd. Taxon No. Rel. Abd. Taxon No. Rel. Abd. Elimia sp. 68 18.58 Beloneuria sp. 19 12.03 Epeorus sp. 23 9.54Stenonema modestum 52 14.21 Cheumatopsyche sp. 16 10.13 Simulium sp. 17 7.05Stenacron interpunctatum 39 10.66 Tallaperla sp. 16 10.13 Acroneuria abnormis 17 7.05Branchiobdellidae Genus species 32 8.74 Stenonema modestum 11 6.96 Psephenus herricki 15 6.22 Boyeria vinosa 11 6.96 Cheumatopsyche sp. 14 5.81 Acroneuria abnormis 9 5.70 Stenonema modestum 14 5.812005034 2005035 20050036 Taxon No. Rel. Abd. Taxon No. Rel. Abd. Taxon No. Rel. Abd. Tallaperla sp. 68 23.94 Stenonema modestum 91 32.62 Chimarra sp. 81 23.82Diplectrona modesta 33 11.62 Cheumatopsyche sp. 43 15.41 Stenonema modestum 39 11.47Branchiobdellidae Genus species 29 10.21 Tricorythodes sp. 15 5.38 Stenacron interpunctatum 30 8.82Elimia sp. 22 7.75 Nigronia serricornis 30 8.82Dolophilodes sp. 16 5.63 Phaenopsectra obediens gr. 18 5.29Acroneuria abnormis 15 5.28
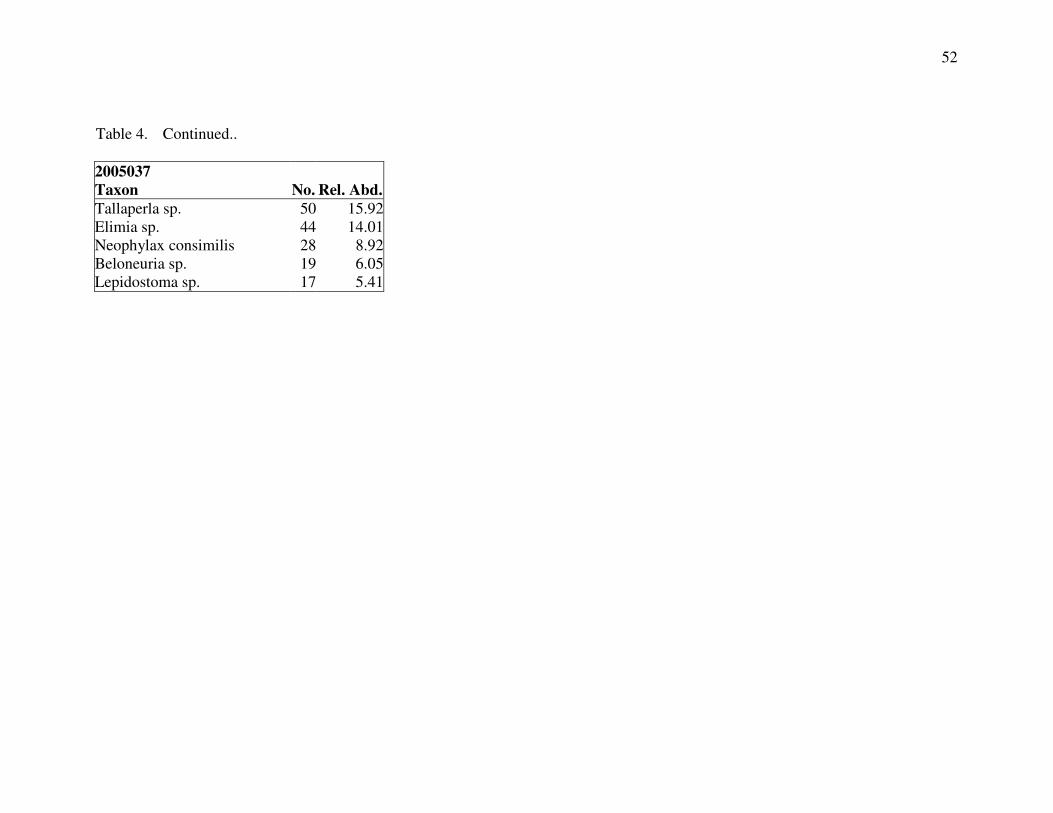
52
Table 4. Continued.. 2005037 Taxon No. Rel. Abd. Tallaperla sp. 50 15.92Elimia sp. 44 14.01Neophylax consimilis 28 8.92Beloneuria sp. 19 6.05Lepidostoma sp. 17 5.41

53
Table 5. Rapid bioassessment metrics calculated for the sampling locations in the Broad River drainage, South Carolina 13 July-19 August 2005.
Sample Location
Metric 2005
001
2005
002
2005
003
2005
004
2005
005
2005
006
2005
007
2005
008
2005
009
2005
010
2005
011
2005
012
2005
013
2005
014
2005
015
2005
016
2005
017
2005
018
2005
019
Taxa Richness 55 65 62 49 62 70 51 57 50 56 46 48 56 57 47 55 38 54 45 Number of Specimens 338 447 422 317 340 403 273 425 209 338 307 271 400 353 332 346 238 348 173 EPT Index 10 16 15 19 23 21 7 20 9 14 11 12 21 12 18 18 16 21 19 EPT Abundance 146 299 216 210 208 226 84 275 80 197 187 166 234 171 186 192 162 251 102 Chironomidae Taxa 16 18 13 13 14 26 20 20 17 18 10 15 15 16 8 19 6 11 7 Chironomidae Abundance 127 77 52 50 53 80 84 79 56 62 24 55 32 68 20 69 11 12 18 EPT/Chironomidae Abundance
1.15 3.88 4.15 4.20 3.92 2.83 1.00 3.48 1.43 3.18 7.79 3.02 7.31 2.51 9.30 2.78 14.73 20.92 5.67
NCBI 5.70 5.66 5.57 5.01 5.43 5.25 6.26 5.66 6.04 5.51 5.49 5.70 5.89 6.21 5.58 5.36 4.88 4.96 5.11 SCDHEC Bioclassification 3.0 3.3 3.2 4.0 3.7 3.5 2.2 3.5 2.3 3.2 3.0 3.0 3.0 2.5 3.5 3.5 3.8 4.0 4.0 Percent Collector-Filterers 13.31 37.36 13.03 35.02 28.82 31.51 17.22 22.59 8.61 28.70 35.18 16.61 27.00 18.98 13.25 16.47 29.41 30.75 20.81 Percent Collector-Gatherers 46.75 21.03 41.47 16.72 12.06 10.67 8.79 18.35 22.49 13.61 6.19 28.41 19.25 21.81 22.89 12.72 10.92 14.37 19.08 Percent Omnivores 0.59 0.22 1.90 0.32 0.29 0.50 3.66 0.00 0.00 4.73 1.30 1.48 2.50 1.70 0.00 2.60 1.26 0.29 1.16 Percent Predators 13.61 9.17 15.64 16.40 19.41 22.08 36.63 25.41 25.36 14.50 9.12 14.02 11.75 21.53 23.80 11.56 31.09 13.79 13.87 Percent Scrapers 24.56 28.41 26.30 20.50 34.12 22.58 29.30 26.82 31.10 34.02 42.02 36.90 37.50 31.44 33.73 53.47 19.33 39.66 43.93 Percent Shredders 1.18 3.36 1.18 10.09 3.53 8.93 1.47 4.71 9.09 2.96 5.86 1.85 2.00 3.68 5.72 2.60 7.98 1.15 1.16 Scraper/Collector-Filterers 1.84 0.76 2.02 0.59 1.18 0.72 1.70 1.19 3.61 1.19 1.19 2.22 1.39 1.66 2.55 3.25 0.66 1.29 2.11 Shredders/Total 0.01 0.03 0.01 0.10 0.04 0.09 0.01 0.05 0.09 0.03 0.06 0.02 0.02 0.04 0.06 0.03 0.08 0.01 0.01 Percent Dominant Taxon 17.75 17.67 14.93 20.50 18.24 10.17 26.01 23.29 24.88 12.43 20.52 29.89 14.75 14.45 15.36 15.03 17.23 11.78 12.14 Number Of Dominant Taxa 6.00 6.00 5.00 5.00 4.00 5.00 5.00 5.00 3.00 7.00 5.00 3.00 6.00 4.00 5.00 6.00 6.00 6.00 5.00

54
Table 5. Continued..
Sample Location
Metric 2005
019
2005
020
2005
021
2005
022
2005
023
2005
024
2005
025
2005
026
2005
027
2005
028
2005
029
2005
030
2005
031
2005
032
2005
033
2005
034
2005
035
2005
036
2005
037
Taxa Richness 45 52 50 41 51 42 48 39 49 52 51 53 48 40 41 28 42 53 44 Number of Specimens 173 202 316 179 232 299 230 159 428 319 390 290 366 158 241 284 279 340 314 EPT Index 19 24 18 14 21 14 21 12 16 14 22 19 19 20 25 19 11 18 17 EPT Abundance 102 119 229 118 152 126 168 72 286 177 293 160 157 112 164 217 171 212 178 Chironomidae Taxa 7 10 12 7 11 9 7 13 11 12 12 12 9 4 2 1 12 10 11 Chironomidae Abundance 18 24 36 13 29 16 20 24 44 45 26 23 39 5 2 3 29 43 27 EPT/Chironomidae Abundance
5.67 4.96 6.36 9.08 5.24 7.88 8.40 3.00 6.50 3.93 11.27 6.96 4.03 22.40 82.00 72.33 5.90 4.93 6.59
NCBI 5.11 5.05 5.22 5.84 5.23 5.04 4.39 5.68 5.50 5.77 4.73 4.92 4.82 4.26 3.51 2.47 5.68 5.51 3.85 SCDHEC Bioclassification 4.0 4.3 3.7 2.7 3.7 3.7 4.0 3.0 3.3 3.0 4.2 4.0 4.0 4.0 4.3 4.0 3.0 3.5 3.8 Percent Collector-Filterers 20.81 20.79 36.08 16.20 18.97 12.71 18.70 22.01 51.87 20.69 28.72 15.86 8.20 12.03 22.41 24.65 24.73 40.29 10.19 Percent Collector-Gatherers 19.08 20.79 15.19 24.02 9.05 10.03 9.57 9.43 15.19 16.61 11.54 8.62 3.83 13.92 21.58 3.17 16.49 4.12 6.37 Percent Omnivores 1.16 0.50 0.95 1.68 3.88 0.67 1.30 0.00 0.23 0.00 0.51 1.72 4.10 0.63 2.90 0.70 0.36 1.47 5.73 Percent Predators 13.87 22.28 12.66 16.76 17.24 21.07 17.39 37.74 14.72 41.38 10.26 24.83 25.14 35.44 19.50 22.89 17.20 18.82 20.06 Percent Scrapers 43.93 28.71 34.18 40.22 42.24 54.85 44.78 20.13 10.75 12.85 38.46 42.76 54.92 17.09 23.65 20.42 38.35 33.24 31.21 Percent Shredders 1.16 6.93 0.95 1.12 8.62 0.67 8.26 10.69 7.24 8.46 10.51 6.21 3.83 20.89 9.96 28.17 2.87 2.06 26.43 Scraper/Collector-Filterers 2.11 1.38 0.95 2.48 2.23 4.32 2.40 0.91 0.21 0.62 1.34 2.70 6.70 1.42 1.06 0.83 1.55 0.82 3.06 Shredders/Total 0.01 0.07 0.01 0.01 0.09 0.01 0.08 0.11 0.07 0.08 0.11 0.06 0.04 0.21 0.10 0.28 0.03 0.02 0.26 Percent Dominant Taxon 12.14 11.88 15.51 21.79 20.69 15.72 15.22 11.95 27.34 16.93 17.44 15.52 18.58 12.03 9.54 23.94 32.62 23.82 15.92 Number Of Dominant Taxa 5.00 4.00 5.00 4.00 4.00 8.00 7.00 6.00 3.00 6.00 7.00 5.00 4.00 6.00 6.00 6.00 3.00 5.00 5.00

55
Table 6. Community Loss Index (CLI) calculated for the sampling locations in the Broad River drainage, South Carolina, 13 July-19 August 2005.
2005
002
2005
003
2005
004
2005
005
2005
006
2005
007
2005
008
2005
009
2005
010
2005
011
2005
012
2005
013
2005
014
2005
015
2005
016
2005
017
2005
018
2005
019
2005001 0.34 0.39 0.76 0.53 0.39 0.57 0.61 0.66 0.57 0.80 0.83 0.61 0.53 0.74 0.58 1.16 0.59 0.80 2005002 0.53 0.86 0.71 0.47 0.90 0.68 0.80 0.70 0.89 1.00 0.70 0.74 0.96 0.73 1.24 0.72 1.00 2005003 0.71 0.58 0.50 0.78 0.74 0.78 0.66 0.87 0.94 0.66 0.63 0.89 0.80 1.13 0.69 0.93 2005004 0.42 0.36 0.57 0.49 0.50 0.46 0.61 0.77 0.41 0.42 0.66 0.55 0.66 0.44 0.69 2005005 0.49 0.75 0.61 0.80 0.63 0.87 1.00 0.73 0.65 0.85 0.69 1.18 0.74 0.98 2005006 0.84 0.65 0.86 0.71 0.93 1.06 0.77 0.75 1.04 0.78 1.32 0.74 1.09 2005007 0.51 0.60 0.61 0.76 0.88 0.63 0.53 0.81 0.60 1.03 0.63 0.84 2005008 0.52 0.55 0.80 0.83 0.70 0.60 0.85 0.67 1.00 0.69 0.98 2005009 0.46 0.72 0.75 0.55 0.42 0.68 0.56 0.79 0.52 0.80 2005010 0.72 0.75 0.57 0.60 0.77 0.60 1.05 0.52 0.73 2005011 0.60 0.41 0.47 0.64 0.49 0.84 0.43 0.69 2005012 0.54 0.58 0.70 0.56 1.05 0.56 0.76 2005013 0.58 0.74 0.55 0.95 0.43 0.73 2005014 0.68 0.62 0.95 0.57 0.80 2005015 0.40 0.71 0.39 0.73 2005016 1.05 0.56 0.82 2005017 0.33 0.51 2005018 0.67 2005019 2005020 2005021 2005022 2005023 2005024 2005025 2005026 2005027 2005028 2005029 2005030 2005031 2005032 2005033 2005034 2005035 2005036

56
Table 6. Continued..
2005
020
2005
021
2005
022
2005
023
2005
024
2005
025
2005
026
2005
027
2005
028
2005
029
2005
030
2005
031
2005
032
2005
033
2005
034
2005
035
2005
036
2005
037
2005001 0.79 0.72 0.90 0.73 0.95 0.77 1.15 0.82 0.85 0.78 0.75 0.83 1.18 1.05 1.89 0.98 0.68 0.93 2005002 0.92 0.84 1.05 0.82 1.17 0.96 1.13 0.90 0.88 0.84 0.85 0.94 1.28 1.24 2.18 1.14 0.81 1.11 2005003 0.75 0.78 1.02 0.84 1.00 0.92 1.21 0.86 0.94 0.80 0.75 0.94 1.25 1.10 2.07 1.10 0.74 1.11 2005004 0.50 0.54 0.71 0.59 0.74 0.69 0.77 0.49 0.63 0.55 0.47 0.60 0.80 0.76 1.50 0.64 0.45 0.70 2005005 0.81 0.88 1.07 0.84 1.10 0.98 1.21 0.80 0.90 0.84 0.79 0.94 1.28 1.17 2.07 1.07 0.75 1.07 2005006 0.96 0.94 1.17 0.86 1.17 0.98 1.26 0.92 0.88 0.80 0.83 0.96 1.40 1.27 2.29 1.17 0.85 1.11 2005007 0.75 0.78 0.90 0.69 0.93 0.83 1.00 0.73 0.77 0.76 0.70 0.88 1.10 1.05 1.75 0.90 0.64 0.84 2005008 0.81 0.72 1.00 0.75 1.12 0.92 0.97 0.76 0.73 0.73 0.70 0.83 1.13 1.05 1.86 0.93 0.75 0.86 2005009 0.65 0.60 0.76 0.63 0.86 0.81 0.79 0.53 0.60 0.63 0.55 0.75 0.85 0.88 1.61 0.69 0.58 0.80 2005010 0.62 0.64 0.78 0.57 0.95 0.75 0.90 0.63 0.69 0.63 0.57 0.71 1.10 0.95 1.82 0.76 0.60 0.80 2005011 0.60 0.60 0.66 0.51 0.74 0.58 0.79 0.59 0.56 0.59 0.49 0.63 0.93 0.78 1.43 0.67 0.49 0.68 2005012 0.71 0.66 0.83 0.65 0.88 0.73 0.95 0.67 0.65 0.61 0.57 0.71 0.98 0.90 1.57 0.83 0.64 0.89 2005013 0.62 0.68 0.88 0.55 0.83 0.65 0.95 0.67 0.69 0.57 0.57 0.79 1.03 0.93 1.86 0.81 0.58 0.93 2005014 0.67 0.66 0.90 0.75 0.88 0.81 1.00 0.59 0.69 0.73 0.62 0.79 1.03 1.07 1.93 0.81 0.60 0.98 2005015 0.50 0.62 0.71 0.57 0.67 0.67 0.79 0.47 0.62 0.59 0.51 0.60 0.83 0.80 1.61 0.60 0.53 0.82 2005016 0.75 0.66 0.76 0.67 0.88 0.75 0.95 0.67 0.75 0.75 0.64 0.73 1.15 1.07 1.86 0.88 0.68 0.84 2005017 0.42 0.34 0.51 0.41 0.50 0.46 0.46 0.31 0.31 0.35 0.26 0.38 0.48 0.49 1.11 0.50 0.32 0.55 2005018 0.58 0.48 0.71 0.49 0.67 0.56 0.79 0.51 0.60 0.57 0.47 0.56 0.90 0.80 1.75 0.69 0.55 0.77 2005019 0.48 0.40 0.61 0.47 0.67 0.52 0.79 0.47 0.58 0.45 0.38 0.54 0.80 0.66 1.36 0.71 0.42 0.61 2005020 0.56 0.83 0.55 0.69 0.69 0.87 0.57 0.69 0.53 0.51 0.67 0.93 0.85 1.68 0.74 0.64 0.84 2005021 0.68 0.45 0.69 0.50 0.74 0.51 0.56 0.47 0.40 0.50 0.73 0.78 1.57 0.69 0.51 0.64 2005022 0.43 0.48 0.44 0.59 0.41 0.48 0.41 0.40 0.44 0.68 0.68 1.39 0.50 0.36 0.55 2005023 0.69 0.52 0.79 0.49 0.52 0.53 0.51 0.60 0.83 0.73 1.50 0.69 0.49 0.66 2005024 0.38 0.72 0.39 0.50 0.47 0.40 0.46 0.63 0.66 1.21 0.55 0.42 0.61 2005025 0.79 0.55 0.56 0.51 0.49 0.52 0.78 0.73 1.43 0.71 0.51 0.68 2005026 0.24 0.23 0.33 0.26 0.42 0.53 0.54 1.14 0.50 0.38 0.48 2005027 0.37 0.47 0.42 0.52 0.70 0.73 1.50 0.50 0.42 0.68 2005028 0.51 0.45 0.67 0.80 0.83 1.57 0.79 0.58 0.68 2005029 0.40 0.54 0.73 0.71 1.54 0.69 0.49 0.73 2005030 0.50 0.75 0.73 1.46 0.76 0.51 0.75 2005031 0.68 0.63 1.32 0.69 0.42 0.61 2005032 0.41 1.00 0.64 0.43 0.52 2005033 0.86 0.69 0.34 0.48 2005034 0.57 0.36 0.39 2005035 0.32 0.61 2005036 0.75

57
Table 7. Jaccard Coefficient of Similarity (JCS) calculated for the sampling locations in the Broad River drainage, South Carolina, 13 July-19 August 2005.
2005
002
2005
003
2005
004
2005
005
2005
006
2005
007
2005
008
2005
009
2005
010
2005
011
2005
012
2005
013
2005
014
2005
015
2005
016
2005
017
2005
018
2005
019
2005001 0.38 0.36 0.21 0.23 0.29 0.33 0.22 0.27 0.26 0.22 0.17 0.23 0.29 0.24 0.26 0.13 0.27 0.23 2005002 0.34 0.25 0.20 0.31 0.20 0.27 0.28 0.27 0.28 0.18 0.27 0.23 0.22 0.26 0.21 0.28 0.22 2005003 0.32 0.27 0.26 0.24 0.20 0.26 0.27 0.26 0.18 0.27 0.28 0.22 0.18 0.23 0.27 0.23 2005004 0.26 0.25 0.25 0.25 0.32 0.28 0.28 0.14 0.33 0.31 0.23 0.22 0.38 0.32 0.24 2005005 0.27 0.27 0.29 0.24 0.30 0.26 0.15 0.22 0.27 0.25 0.26 0.20 0.23 0.20 2005006 0.29 0.35 0.29 0.31 0.30 0.19 0.27 0.27 0.22 0.28 0.23 0.32 0.22 2005007 0.26 0.26 0.19 0.20 0.10 0.18 0.24 0.15 0.20 0.16 0.19 0.16 2005008 0.41 0.30 0.24 0.19 0.19 0.25 0.20 0.22 0.25 0.22 0.15 2005009 0.29 0.22 0.17 0.22 0.32 0.23 0.22 0.29 0.27 0.17 2005010 0.29 0.24 0.27 0.24 0.24 0.26 0.21 0.34 0.29 2005011 0.22 0.29 0.23 0.21 0.23 0.20 0.30 0.20 2005012 0.21 0.17 0.19 0.20 0.10 0.21 0.18 2005013 0.26 0.26 0.31 0.27 0.43 0.29 2005014 0.32 0.26 0.28 0.31 0.26 2005015 0.32 0.31 0.35 0.18 2005016 0.19 0.30 0.22 2005017 0.28 0.22 2005018 0.32 2005019 2005020 2005021 2005022 2005023 2005024 2005025 2005026 2005027 2005028 2005029 2005030 2005031 2005032 2005033 2005034 2005035 2005036

58
Table 7. Continued..
2005
020
2005
021
2005
022
2005
023
2005
024
2005
025
2005
026
2005
027
2005
028
2005
029
2005
030
2005
031
2005
032
2005
033
2005
034
2005
035
2005
036
2005
037
2005001 0.15 0.22 0.23 0.20 0.18 0.21 0.12 0.17 0.11 0.16 0.16 0.17 0.09 0.14 0.02 0.17 0.21 0.16 2005002 0.17 0.25 0.26 0.25 0.18 0.20 0.25 0.23 0.19 0.23 0.20 0.22 0.15 0.15 0.04 0.19 0.23 0.17 2005003 0.25 0.26 0.24 0.20 0.24 0.20 0.17 0.22 0.13 0.23 0.24 0.18 0.13 0.20 0.05 0.18 0.25 0.14 2005004 0.29 0.29 0.29 0.23 0.25 0.20 0.28 0.34 0.19 0.27 0.31 0.26 0.24 0.25 0.10 0.32 0.32 0.24 2005005 0.21 0.19 0.21 0.20 0.18 0.16 0.17 0.26 0.15 0.20 0.21 0.18 0.12 0.16 0.05 0.20 0.24 0.16 2005006 0.20 0.24 0.25 0.27 0.23 0.24 0.24 0.27 0.24 0.32 0.27 0.26 0.15 0.19 0.07 0.23 0.26 0.23 2005007 0.13 0.13 0.18 0.19 0.15 0.13 0.15 0.18 0.12 0.13 0.16 0.10 0.08 0.10 0.03 0.16 0.20 0.17 2005008 0.16 0.24 0.20 0.21 0.11 0.14 0.25 0.23 0.21 0.23 0.22 0.19 0.14 0.17 0.06 0.22 0.18 0.23 2005009 0.19 0.25 0.26 0.22 0.18 0.13 0.27 0.32 0.23 0.22 0.26 0.17 0.22 0.18 0.07 0.30 0.23 0.19 2005010 0.29 0.29 0.33 0.34 0.20 0.24 0.28 0.31 0.23 0.29 0.31 0.27 0.14 0.21 0.06 0.32 0.28 0.27 2005011 0.18 0.20 0.28 0.26 0.21 0.24 0.21 0.22 0.21 0.20 0.25 0.21 0.12 0.19 0.09 0.26 0.25 0.22 2005012 0.12 0.18 0.19 0.18 0.14 0.16 0.14 0.18 0.16 0.21 0.22 0.17 0.11 0.14 0.06 0.17 0.16 0.11 2005013 0.29 0.26 0.26 0.35 0.27 0.32 0.25 0.28 0.23 0.34 0.31 0.21 0.19 0.23 0.05 0.29 0.30 0.18 2005014 0.25 0.29 0.26 0.21 0.25 0.21 0.23 0.36 0.24 0.23 0.28 0.22 0.20 0.15 0.04 0.30 0.29 0.16 2005015 0.27 0.20 0.26 0.23 0.27 0.19 0.23 0.33 0.18 0.21 0.25 0.23 0.19 0.19 0.03 0.33 0.23 0.14 2005016 0.18 0.27 0.33 0.25 0.23 0.23 0.24 0.27 0.18 0.19 0.24 0.24 0.10 0.13 0.04 0.23 0.21 0.22 2005017 0.22 0.31 0.27 0.24 0.28 0.25 0.36 0.34 0.33 0.29 0.33 0.29 0.27 0.29 0.16 0.26 0.30 0.21 2005018 0.29 0.41 0.36 0.38 0.37 0.36 0.33 0.39 0.28 0.31 0.37 0.36 0.24 0.28 0.06 0.35 0.30 0.26 2005019 0.26 0.36 0.30 0.28 0.24 0.27 0.20 0.31 0.18 0.30 0.34 0.26 0.18 0.26 0.11 0.21 0.31 0.25 2005020 0.31 0.24 0.30 0.32 0.23 0.25 0.31 0.18 0.32 0.31 0.25 0.19 0.22 0.07 0.29 0.21 0.19 2005021 0.32 0.36 0.30 0.36 0.31 0.34 0.26 0.35 0.39 0.36 0.30 0.25 0.08 0.30 0.29 0.31 2005022 0.26 0.34 0.29 0.29 0.30 0.21 0.28 0.27 0.29 0.21 0.19 0.03 0.32 0.31 0.25 2005023 0.31 0.36 0.29 0.37 0.30 0.31 0.30 0.29 0.25 0.30 0.13 0.31 0.32 0.30 2005024 0.36 0.21 0.34 0.21 0.24 0.28 0.29 0.26 0.22 0.13 0.29 0.27 0.21 2005025 0.24 0.28 0.23 0.29 0.28 0.32 0.24 0.25 0.12 0.25 0.26 0.24 2005026 0.44 0.42 0.32 0.37 0.28 0.30 0.27 0.12 0.29 0.26 0.28 2005027 0.42 0.33 0.36 0.33 0.31 0.27 0.10 0.44 0.36 0.26 2005028 0.34 0.36 0.25 0.28 0.24 0.11 0.25 0.25 0.30 2005029 0.41 0.34 0.32 0.31 0.11 0.31 0.32 0.27 2005030 0.41 0.32 0.33 0.16 0.26 0.34 0.38 2005031 0.31 0.33 0.17 0.27 0.35 0.30 2005032 0.40 0.21 0.19 0.22 0.25 2005033 0.33 0.17 0.32 0.31 2005034 0.06 0.13 0.18 2005035 0.36 0.21 2005036 0.26
Table 8. Sörensen Coefficient (CS) calculated for the sampling locations in the Broad River drainage, South Carolina, 13 July-19 August 2005.
2005
002
2005
003
2005
004
2005
005
2005
006
2005
007
2005
008
2005
009
2005
010
2005
011
2005
012
2005
013
2005
014
2005
015
2005
016
2005
017
2005
018
2005
019
2005001 0.55 0.53 0.35 0.38 0.45 0.49 0.36 0.42 0.41 0.36 0.29 0.38 0.45 0.39 0.42 0.24 0.42 0.38 2005002 0.50 0.40 0.33 0.47 0.33 0.43 0.43 0.43 0.43 0.30 0.43 0.38 0.36 0.42 0.35 0.44 0.36 2005003 0.49 0.42 0.41 0.39 0.34 0.41 0.42 0.41 0.31 0.42 0.44 0.37 0.31 0.38 0.43 0.37 2005004 0.41 0.40 0.40 0.40 0.48 0.44 0.44 0.25 0.50 0.47 0.38 0.37 0.55 0.49 0.38 2005005 0.42 0.42 0.45 0.39 0.46 0.41 0.25 0.36 0.42 0.40 0.41 0.34 0.38 0.34
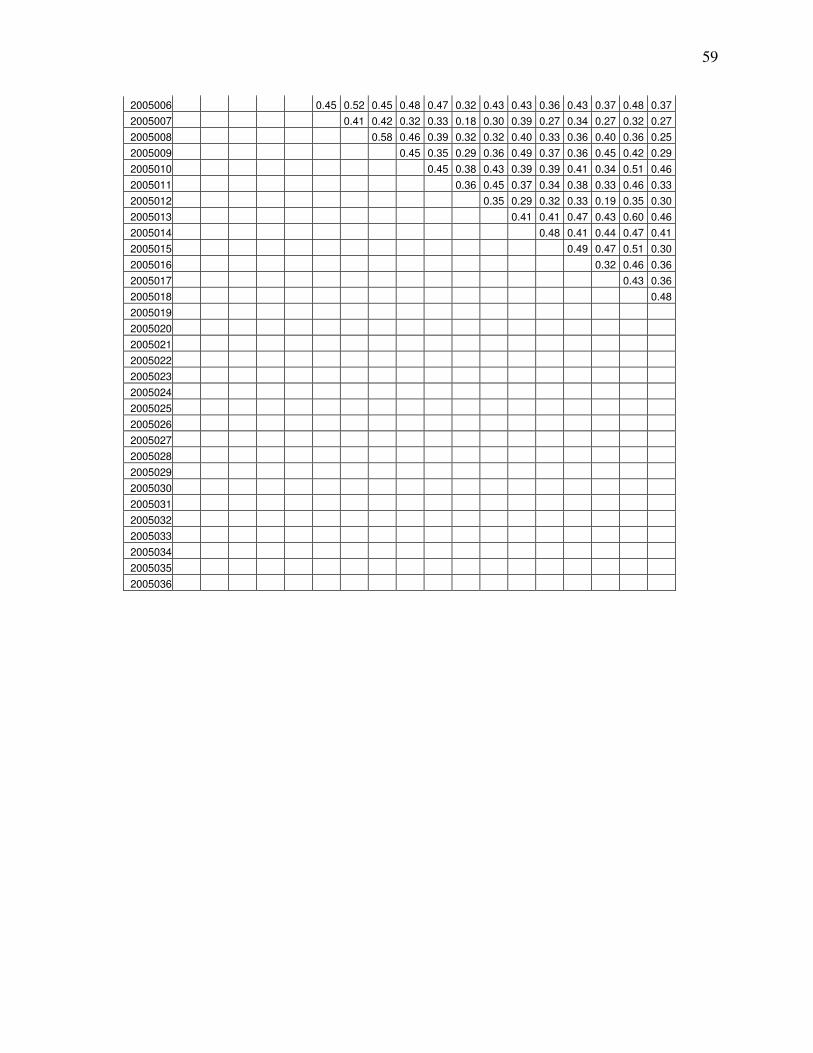
59
2005006 0.45 0.52 0.45 0.48 0.47 0.32 0.43 0.43 0.36 0.43 0.37 0.48 0.37 2005007 0.41 0.42 0.32 0.33 0.18 0.30 0.39 0.27 0.34 0.27 0.32 0.27 2005008 0.58 0.46 0.39 0.32 0.32 0.40 0.33 0.36 0.40 0.36 0.25 2005009 0.45 0.35 0.29 0.36 0.49 0.37 0.36 0.45 0.42 0.29 2005010 0.45 0.38 0.43 0.39 0.39 0.41 0.34 0.51 0.46 2005011 0.36 0.45 0.37 0.34 0.38 0.33 0.46 0.33 2005012 0.35 0.29 0.32 0.33 0.19 0.35 0.30 2005013 0.41 0.41 0.47 0.43 0.60 0.46 2005014 0.48 0.41 0.44 0.47 0.41 2005015 0.49 0.47 0.51 0.30 2005016 0.32 0.46 0.36 2005017 0.43 0.36 2005018 0.48 2005019 2005020 2005021 2005022 2005023 2005024 2005025 2005026 2005027 2005028 2005029 2005030 2005031 2005032 2005033 2005034 2005035 2005036

60
Table 8. Continued..
2005
020
2005
021
2005
022
2005
023
2005
024
2005
025
2005
026
2005
027
2005
028
2005
029
2005
030
2005
031
2005
032
2005
033
2005
034
2005
035
2005
036
2005
037
2005001 0.26 0.36 0.38 0.34 0.31 0.35 0.21 0.29 0.21 0.28 0.28 0.29 0.17 0.25 0.05 0.29 0.35 0.28 2005002 0.29 0.40 0.42 0.40 0.30 0.34 0.40 0.37 0.32 0.38 0.34 0.35 0.27 0.26 0.09 0.32 0.37 0.29 2005003 0.40 0.41 0.39 0.34 0.38 0.33 0.30 0.36 0.23 0.37 0.38 0.31 0.24 0.33 0.09 0.31 0.40 0.25 2005004 0.46 0.44 0.44 0.38 0.40 0.33 0.43 0.51 0.32 0.42 0.47 0.41 0.38 0.40 0.18 0.48 0.49 0.39 2005005 0.35 0.32 0.35 0.34 0.31 0.27 0.30 0.41 0.26 0.34 0.35 0.31 0.22 0.27 0.09 0.33 0.38 0.28 2005006 0.33 0.38 0.40 0.43 0.38 0.39 0.39 0.42 0.39 0.48 0.42 0.41 0.25 0.32 0.12 0.38 0.41 0.37 2005007 0.23 0.24 0.30 0.31 0.26 0.22 0.27 0.30 0.21 0.24 0.27 0.18 0.15 0.17 0.05 0.28 0.33 0.29 2005008 0.28 0.39 0.33 0.35 0.20 0.25 0.40 0.38 0.35 0.37 0.36 0.32 0.25 0.29 0.12 0.36 0.31 0.38 2005009 0.31 0.40 0.42 0.36 0.30 0.22 0.43 0.48 0.37 0.36 0.41 0.29 0.36 0.31 0.13 0.46 0.37 0.32 2005010 0.44 0.45 0.49 0.50 0.33 0.38 0.44 0.48 0.37 0.45 0.48 0.42 0.25 0.35 0.12 0.49 0.44 0.42 2005011 0.31 0.33 0.44 0.41 0.34 0.38 0.35 0.36 0.35 0.33 0.40 0.34 0.21 0.32 0.16 0.41 0.40 0.36 2005012 0.22 0.31 0.31 0.30 0.24 0.27 0.25 0.31 0.28 0.34 0.36 0.29 0.20 0.25 0.11 0.29 0.28 0.20 2005013 0.44 0.42 0.41 0.52 0.43 0.48 0.40 0.44 0.37 0.50 0.48 0.35 0.31 0.37 0.10 0.45 0.46 0.30 2005014 0.40 0.45 0.41 0.35 0.40 0.34 0.38 0.53 0.39 0.37 0.44 0.36 0.33 0.27 0.07 0.46 0.45 0.28 2005015 0.42 0.33 0.41 0.37 0.43 0.32 0.37 0.50 0.30 0.35 0.40 0.38 0.32 0.32 0.05 0.49 0.38 0.24 2005016 0.30 0.42 0.50 0.40 0.37 0.37 0.38 0.42 0.30 0.32 0.39 0.39 0.19 0.23 0.07 0.37 0.35 0.36 2005017 0.36 0.48 0.43 0.38 0.43 0.37 0.52 0.53 0.49 0.45 0.53 0.47 0.49 0.46 0.21 0.43 0.46 0.34 2005018 0.45 0.58 0.53 0.55 0.54 0.53 0.49 0.56 0.43 0.48 0.54 0.53 0.38 0.44 0.12 0.52 0.47 0.41 2005019 0.41 0.53 0.47 0.44 0.39 0.43 0.33 0.47 0.31 0.46 0.51 0.41 0.31 0.42 0.19 0.34 0.47 0.40 2005020 0.47 0.39 0.47 0.49 0.38 0.40 0.48 0.31 0.49 0.48 0.40 0.33 0.37 0.13 0.45 0.34 0.31 2005021 0.48 0.53 0.46 0.53 0.47 0.51 0.41 0.51 0.56 0.53 0.47 0.40 0.15 0.46 0.45 0.47 2005022 0.41 0.51 0.45 0.45 0.47 0.34 0.43 0.43 0.45 0.35 0.32 0.06 0.48 0.47 0.40 2005023 0.47 0.53 0.44 0.54 0.47 0.47 0.46 0.44 0.40 0.46 0.23 0.47 0.48 0.46 2005024 0.53 0.35 0.51 0.34 0.39 0.44 0.44 0.41 0.36 0.23 0.45 0.42 0.35 2005025 0.39 0.43 0.38 0.44 0.44 0.48 0.39 0.40 0.21 0.40 0.42 0.39 2005026 0.61 0.59 0.49 0.54 0.44 0.46 0.43 0.21 0.44 0.41 0.43 2005027 0.59 0.50 0.53 0.49 0.47 0.42 0.18 0.62 0.53 0.41 2005028 0.50 0.53 0.40 0.43 0.39 0.20 0.40 0.40 0.46 2005029 0.58 0.51 0.48 0.48 0.20 0.47 0.48 0.40 2005030 0.57 0.49 0.49 0.30 0.44 0.49 0.41 2005031 0.48 0.49 0.29 0.42 0.51 0.46 2005032 0.57 0.35 0.32 0.37 0.40 2005033 0.49 0.29 0.49 0.47 2005034 0.11 0.22 0.31 2005035 0.53 0.35 2005036 0.41