Multipoint observations of nightside auroral activity: the Cascades2 sounding rocket mission
PICTURE: a sounding rocket experiment for direct imagingof an extrasolar planetary environment
Christopher B. Mendilloa, Brian A. Hicksb, Timothy A. Cookb, Thomas G. Bifanoc, David A.Contentd, Benjamin F. Lanee, B. Martin Levinef, Douglas Rabind, Shanti R. Raof, RoccoSamueleg, Edouard Schmidtlinf, Michael Shaof, J. Kent Wallacef, Supriya Chakrabartia
a Astronomy Department, Boston University,725 Commonwealth Avenue Room 506, Boston, MA 02215, USA;
b Center for Atmospheric Research, University of Massachusetts Lowell,600 Suffolk Street 3rd Floor, Lowell, MA 01854, USA;
c Photonics Center, Boston University,8 Saint Mary’s Street Room 936, Boston, MA 02215, USA;
d NASA Goddard Space Flight Center, Greenbelt Road, Greenbelt, MD 20771, USA;e The Charles Stark Draper Laboratory, Inc.,
555 Technology Square, Cambridge, MA 02139, USA;f Jet Propulsion Laboratory, California Institute of Technology,
4800 Oak Grove Drive, Pasadena, CA 91109, USA;g Northrop Grumman Corporation,
One Space Park Drive, Redondo Beach, CA 90278, USA
ABSTRACT
The Planetary Imaging Concept Testbed Using a Rocket Experiment (PICTURE 36.225 UG) was designedto directly image the exozodiacal dust disk of ε Eridani (K2V, 3.22 pc) down to an inner radius of 1.5 AU.PICTURE carried four key enabling technologies on board a NASA sounding rocket at 4:25 MDT on October
8th, 2011: a 0.5 m light-weight primary mirror (4.5 kg), a visible nulling coronagraph (VNC) (600-750 nm), a32x32 element MEMS deformable mirror and a milliarcsecond-class fine pointing system.
Unfortunately, due to a telemetry failure, the PICTURE mission did not achieve scientific success. Nonethe-less, this flight validated the flight-worthiness of the lightweight primary and the VNC. The fine pointing system,a key requirement for future planet-imaging missions, demonstrated 5.1 mas RMS in-flight pointing stability.
We describe the experiment, its subsystems and flight results. We outline the challenges we faced in developingthis complex payload and our technical approaches.
Keywords: exoplanets, exozodiacal dust, debris disks, nulling interferometer, fine pointing, wavefront control,high-contrast imaging
1. INTRODUCTION
The direct imaging of exoplanets in both infrared and visible light is inescapably convolved with the directimaging of exozodiacal dust. The dust pervades the planetary habitat, thermally emitting in the infrared andreflecting visible starlight. In both wavelength regimes, the dust brightness may be comparable to that of aplanet, thus exozodiacal dust is the dominant astrophysical background against which extrasolar planets willbe imaged. Characterizing this background is vital for the development of future exoplanet imaging missions.Properties of the dust itself inform theoretical models of planetary formation and may enable indirect detectionof exoplanets through their influence on the dust morphology.1
Further author information: (Send correspondence to C.B.M.)C.B.M.: E-mail: [email protected]
Space Telescopes and Instrumentation 2012: Optical, Infrared, and Millimeter Wave, edited by Mark C. Clampin,Giovanni G. Fazio, Howard A. MacEwen, Jacobus M. Oschmann, Jr., Proc. of SPIE Vol. 8442, 84420E
© 2012 SPIE · CCC code: 0277-786/12/$18 · doi: 10.1117/12.926408
Proc. of SPIE Vol. 8442 84420E-1
Downloaded From: http://proceedings.spiedigitallibrary.org/ on 01/19/2013 Terms of Use: http://spiedl.org/terms

!"#$%&'()$* +(*%&,-#(% .#"#*$'/#
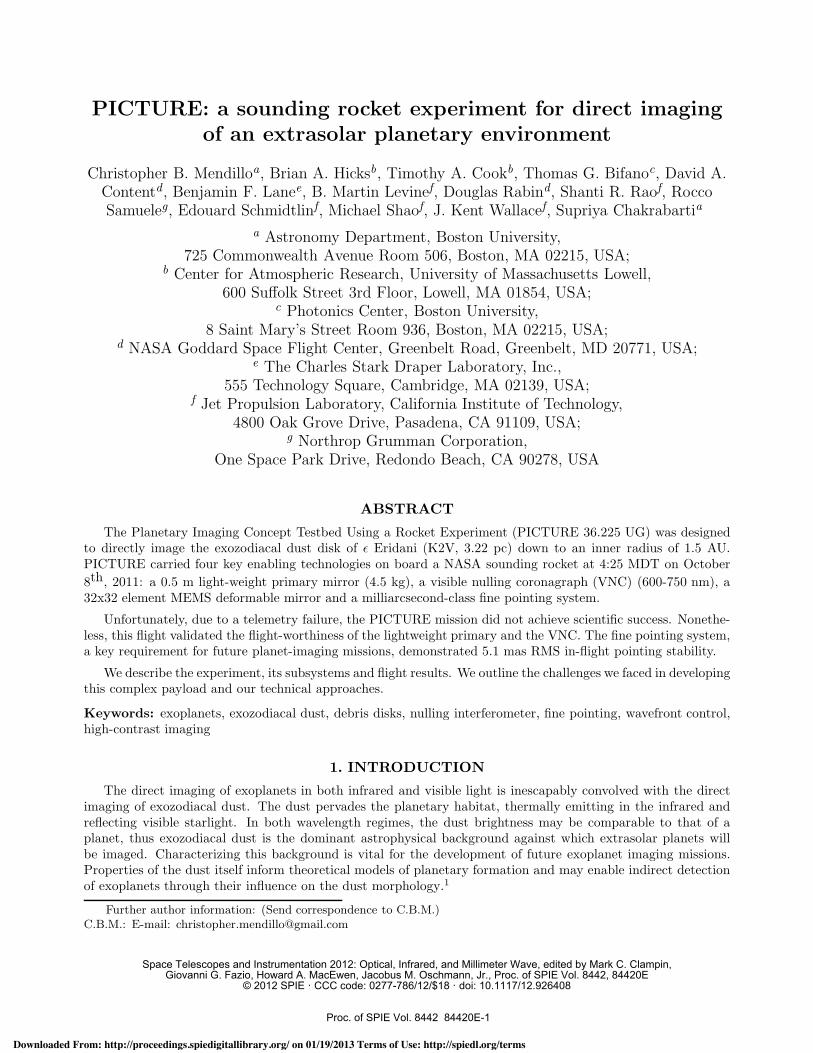
Figure 1: The PICTURE payload.
The singular science objective of the PICTURE (36.225 UG) mission was to obtain a direct, visible-lightimage of exozodiacal dust around the nearby sun-like star ε Eridani (K2V, 3.22 pc). To capture a direct image ofthe inner 20 AU of this system, a high-contrast coronagraph must be used to attenuate the point spread function(PSF) of the bright host star. The PICTURE visible nulling coronagraph (VNC, nuller) was built at JPL2–4 asa design candidate for the TPF-C mission. With a small inner working angle (IWA) of 1.7 λ/D, the PICTUREVNC can probe the ε Eri dust distribution down to an inner radius of 1.5 AU.
The ε Eri system contains a well characterized debris disk at 60 AU.5, 6 Observed infrared excess in the stellarspectrum has been used to infer the existence of two warm dust belts at 20 AU and 3 AU.7 This system is alsothought to harbor at least one giant planet, ε Eri b,8 with a mass of 1.55 0.24 MJ and an eccentric 7 year orbit(e=0.7, a=3.4 0.4 AU).9 The 3 AU dust belt is predicted to have an integrated 2.1 µm scattered light brightnessof 1.8 10 4 F .7 If a maximum ring width of 0.5 AU is adopted based on the modeled minimum inner clearingradius of 2.5 AU,10 this geometry results in a ring with an average surface brightness of 2 10 4 F /as2. At3 AU (0.93 as), operating with a 4000:1 null and 10 sec exposures, the modeled PICTURE 3σ dust detectionlimit is 8 10 6 F /as2. PICTURE will therefore provide an observational test of these predictions and perhapsa direct measurement of the exozodiacal dust morphology.
Beyond its scientific goal, PICTURE carries an important technological objective: to demonstrate the op-eration of several foundational exoplanet imaging technologies in space. These technologies include: an ultra-lightweight 0.5 m diameter primary mirror, a wavefront control system that uses a 32x32 element MEMS de-formable mirror (DM), a milliarcsecond pointing control system, and the heart of the PICTURE instrument,the white-light (20% bandpass) nulling interferometer. In the following sections we will describe the assembly ofthese elements into a compact sounding rocket payload. We will detail the operation and testing of each of thethe PICTURE payload subsystems.
2. MISSION OVERVIEW
2.1 Payload Design
The PICTURE payload consists of the three distinct sections: the telescope, the instrument and the electron-ics. A mechanical model of the payload and photographs of each section are shown in Figure 1. The telescopeand instrument sections are evacuated for flight. All electrical connections pass through a vacuum bulkhead,which serves as the mount point for the electronics longeron.
Proc. of SPIE Vol. 8442 84420E-2
Downloaded From: http://proceedings.spiedigitallibrary.org/ on 01/19/2013 Terms of Use: http://spiedl.org/terms
ACS ±1"ANGLE
TRACKER CCD
5 mas stability
WCSCPU
'I'1 linkPZT control
DM control
FPSCPU
1 linkAT camera
FSM control
F
DM
lyot
V.lateral phase 2shear plates<- "V%_1 I
CAMCPU
SCI camera
WFS camera
PICTURE NULLER: 1-2: Nulling Interferometer (NIF)
2-3: Calibration Interferometer (CIF):
Sc'-
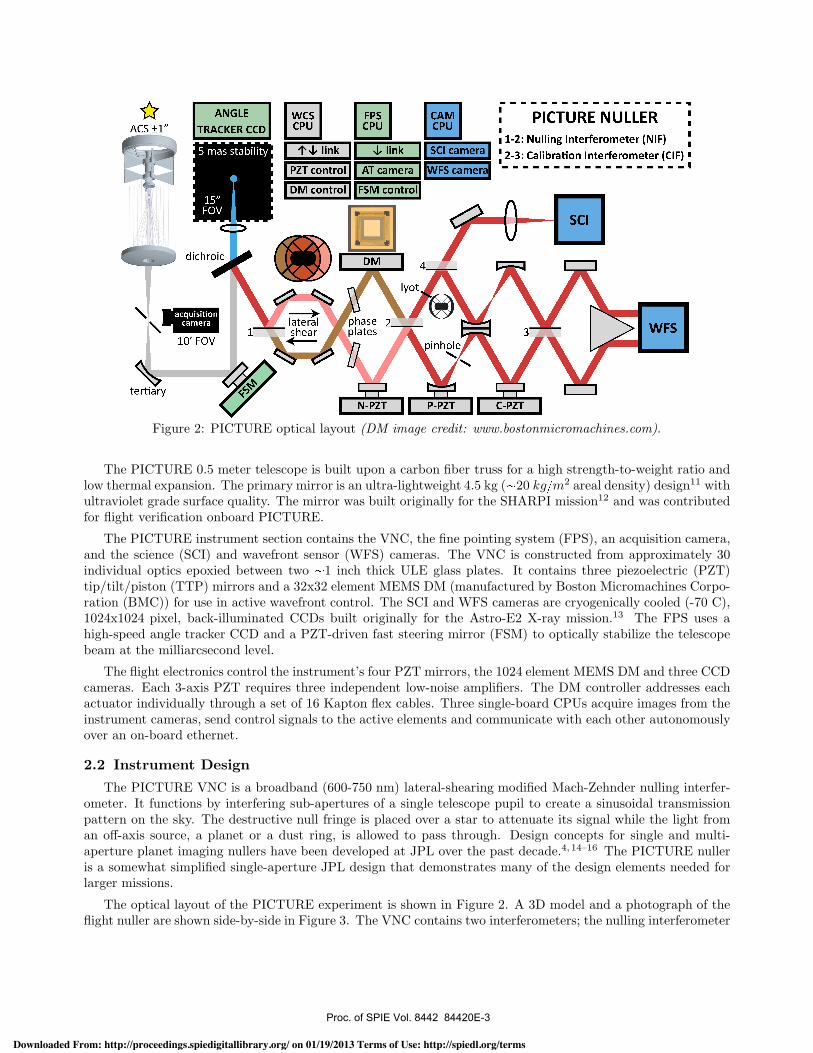
Figure 2: PICTURE optical layout (DM image credit: www.bostonmicromachines.com).
The PICTURE 0.5 meter telescope is built upon a carbon fiber truss for a high strength-to-weight ratio andlow thermal expansion. The primary mirror is an ultra-lightweight 4.5 kg ( 20 kg m2 areal density) design11 withultraviolet grade surface quality. The mirror was built originally for the SHARPI mission12 and was contributedfor flight verification onboard PICTURE.
The PICTURE instrument section contains the VNC, the fine pointing system (FPS), an acquisition camera,and the science (SCI) and wavefront sensor (WFS) cameras. The VNC is constructed from approximately 30individual optics epoxied between two 1 inch thick ULE glass plates. It contains three piezoelectric (PZT)tip/tilt/piston (TTP) mirrors and a 32x32 element MEMS DM (manufactured by Boston Micromachines Corpo-ration (BMC)) for use in active wavefront control. The SCI and WFS cameras are cryogenically cooled (-70 C),1024x1024 pixel, back-illuminated CCDs built originally for the Astro-E2 X-ray mission.13 The FPS uses ahigh-speed angle tracker CCD and a PZT-driven fast steering mirror (FSM) to optically stabilize the telescopebeam at the milliarcsecond level.
The flight electronics control the instrument’s four PZT mirrors, the 1024 element MEMS DM and three CCDcameras. Each 3-axis PZT requires three independent low-noise amplifiers. The DM controller addresses eachactuator individually through a set of 16 Kapton flex cables. Three single-board CPUs acquire images from theinstrument cameras, send control signals to the active elements and communicate with each other autonomouslyover an on-board ethernet.
2.2 Instrument Design
The PICTURE VNC is a broadband (600-750 nm) lateral-shearing modified Mach-Zehnder nulling interfer-ometer. It functions by interfering sub-apertures of a single telescope pupil to create a sinusoidal transmissionpattern on the sky. The destructive null fringe is placed over a star to attenuate its signal while the light froman off-axis source, a planet or a dust ring, is allowed to pass through. Design concepts for single and multi-aperture planet imaging nullers have been developed at JPL over the past decade.4, 14–16 The PICTURE nulleris a somewhat simplified single-aperture JPL design that demonstrates many of the design elements needed forlarger missions.
The optical layout of the PICTURE experiment is shown in Figure 2. A 3D model and a photograph of theflight nuller are shown side-by-side in Figure 3. The VNC contains two interferometers; the nulling interferometer
Proc. of SPIE Vol. 8442 84420E-3
Downloaded From: http://proceedings.spiedigitallibrary.org/ on 01/19/2013 Terms of Use: http://spiedl.org/terms

Figure 3: The PICTURE nuller. Left: 3D model and ray-trace. Right: Flight nuller during final alignment.
(NIF) functions as the coronagraph and the calibration interferometer (CIF) provides post-coronagraph wavefrontsensing. A similar design to the PICTURE calibration system is being implemented on the Gemini PlanetImager.17
The NIF contains two active elements, the Nuller PZT (N-PZT) and a 32x32 element MEMS DM. Theseelements are used by the wavefront control system (WCS) to remove optical path difference (OPD) betweenthe two NIF arms at each point in the split/sheared/recombined pupil. To create a quasi-achromatic null, theNIF uses a pair of fused silica dispersive phase plates to introduce a broadband (20%) π phase shift betweenthe two arms.18, 19 The PICTURE nuller does not actively control amplitude, rather the reflective optics arematch-coated to within 1%. This places a hard lower limit of 2.5 10 5 on the nuller contrast performance.2
The CIF uses the Pinhole PZT (P-PZT) to pass the bright output of the NIF through a 5 µm pinhole, whichacts as a spatial filter to create a reference beam that is re-interfered with the NIF dark output to measurethe stellar leakage wavefront properties. The Calibration PZT (C-PZT) is used to locate and step through thecalibration fringe packet. The WFS camera collects images of interference fringes in the recombined pupil toprovide feedback to the WCS. Imaging optics re-focus the pupil to form images of the sky on the SCI camera.
2.3 Flight Observation Plan
The rocket attitude control system (ACS) is capable of pointing the payload at a target star with 1 arcsecstability. At telescope focus, a circular pick-off mirror reflects a 10 arcmin field of view to an acquisition camera.The live signal from this camera is used to manually drive the ACS to send the stellar spot through a 15 arcsechole in the center of the mirror. The stellar beam drops down into the FPS, which actively stabilizes the inputpointing to the nuller. A dichroic beam splitter is used to pass only the blue ( 600 nm) light to the angle trackercamera, reflecting the red science light into the nuller. The first 120 seconds of the 420 second observationwindow are spent pointed at a bright calibration target while the WCS aligns the NIF active elements to producea coronagraphic null. Here the NIF functions as its own wavefront sensor, stepping the N-PZT through a full waveto generate alignment phase maps. The design and functionality of the WCS is described further in Section 5.On completion of alignment, the NIF is placed in “nulling” mode with the N-PZT set to the bottom of thecentral dark fringe. Reference exposures of the system PSF are taken on the dust-free calibration target foruse in data post-processing. The payload then slews to the dimmer science target to collect science exposures.During this phase the CIF is used to monitor the null and maintain alignment. Nominally, science exposures aretaken at two different roll angles to enable angular differential imaging.20
Proc. of SPIE Vol. 8442 84420E-4
Downloaded From: http://proceedings.spiedigitallibrary.org/ on 01/19/2013 Terms of Use: http://spiedl.org/terms

!
"
#
$
%&
'
(
)
!*
!!
+,--./01 +,--./01
2-.341564478/39:,;<
=>5+>?
@5A("(+BC9?DE8/<
@5A("(FGEE479HB
#9BID19B.8/9C.6.9C,J/E8/<
K+5+>?
@5A("(=>599HB
+LB+>?
M6N47/46OGI
! #
>PHLB>!
CB9+,/67,EE47L/3E49H7.;<47
++C+,/67,EE47
>PHLB>"
>PHLB>#
>PHLB>$%&
( " $ % & '
)
5+29Q9K=5++C
+,/67,EE47
!*
!!
!"##$%&
+LB+>?
Figure 4: PICTURE electronics section block diagram.
3. ELECTRONICS SECTION
A block diagram of the electronics section is shown in Figure 4. The task of operating the FPS, WCS and theSCI and WFS cameras is split between three flight computers. All three computers are built upon the PC-104standard, utilizing COTS single board computers (SBCs) stacked with various ADC, DAC, FPGA, fiber-link, andpower boards to perform the necessary data acquisition and hardware control. Each SBC runs a different flavorof embedded Linux. The FPS and WCS CPUs both implement a hard real-time layer for performing time-criticalfunctions. The WCS CPU provides a system-wide command interface for each of the three flight computers. Anup/down RS-232 link to the WCS CPU is transmitted by the Wallops Flight Facility (WFF) telemetry system.Commands are received, interpreted, and passed to the appropriate system over an on-board ethernet. Theethernet provides a critical communication layer between the flight computers. SCI and WFS images are passedover ethernet from the camera (CAM) CPU to the WCS for processing and eventual transmission to the groundover the high-bandwidth 4 Mbps parallel downlink. The ethernet is also used to transmit the steering lock flagfrom the FPS to the WCS computer to inform the WCS that it is okay to iterate through the alignment statemachine. The FPS computer is also given its own serial downlink for sending status information about thepointing system. This data was displayed in real-time during flight; it was used to issue manual ACS commandsto drive the star into the capture range of the FSM.
The nuller PZTs and DM are controlled by JPL designed driver electronics. They receive digital commandsfrom the WCS CPU via two DIO boards in the PC-104 stack. The FSM and angle tracker CCD electronics aredescribed in detail in (Mendillo et. al. (2012) submitted). Along with the CCD chips, the SCI and WFS cameracontroller also comes from the Astro-E2 mission.
4. TELESCOPE ALIGNMENT & TESTING
The PICTURE telescope (Figure 5) is a Gregorian design consisting of a f/1.26 508 mm clear aperture (559mm physical diameter) ultra-lightweight (4.54 kg, 19.75 kg/m2 aerial density) primary and a 102 mm clearaperture secondary. The primary is mounted on three bipods and is discussed at length in Ref. 11. The f/12.3telescope is collimated to an 18.4 mm beam by a tertiary mirror that reimages the system pupil to the FSM. Acompressor further reduces the beam diameter to 12.5 mm in order to fit on the 32x32 actuator square apertureMEMS mirror (after shearing and masking) and reimages the pupil to the DM.
In aligning the secondary, the telescope was mounted horizontally (Figure 6) and clocked at different rollangles. This allowed us to determine the sag modes of the mirrors in their mounts at various orientations. Sixdifferentially driven actuators were used to manually set tip, tilt, focus and decenter to optimize the secondaryposition at each clocking. A 5 µm pinhole and a flat reference mirror were held by the telescope alignmenttransfer tool (TATT) to mechanically locate the desired focal point and boresight orientation of the telescopebetween alignments. The TATT fixture is also shown in Figure 6.
Proc. of SPIE Vol. 8442 84420E-5
Downloaded From: http://proceedings.spiedigitallibrary.org/ on 01/19/2013 Terms of Use: http://spiedl.org/terms

Ultra-lightweighted ULE primary (4.54 kg)
SiC secondary
Invar, Ti, carbon fiber truss
Protected aluminum coatings
Gregorian design
kp = -1
ks = -0.66
Dp = 508 mm
Fp = 1.26
F = 12.3
S = 763 mm
B = 459 mm
= 0.25
Figure 5: Basic parameters of the PICTURE telescope along with images of the secondary support structureand alignment actuators. The outer spider supports the lost-in-space ST5000 star tracker camera.21
Figure 6: Left : The telescope along with the phase-shifting interferometer built for aligning the secondary tothe primary in double pass. Right : the telescope alignment transfer tool (TATT) fixture which served threepurposes: 1) the mechanical interface between the instrument and telescope; 2) holding a flat mirror for trackingthe boresight of the telescope through gravity sag testing and alignment; 3) positioning a f=125 mm sphericalmirror that was used to transfer the telescope alignment to the instrument and to simulate the f/12.3 telescopeduring independent instrument testing.
A phase-shifting Fizeau interferometer was built and used with the telescope in a double pass arrangementfor fine alignment. The source was a red HeNe laser spatially filtered by a 10 µm pinhole, collimated and stoppeddown to a 13 mm beam in order to accommodate 25.4 mm optics. A 0.5 m retro mirror on a combined swiveland cantilever mount with 1 arcsec tip/tilt control was placed in front of the telescope at a distance adequate toadjust the secondary actuators. A f=150 mm lens was used to feed the telescope with a matched f-number beam.A λ 20 reference flat placed before this lens was scanned in twelve 60 degree steps to generate wavefront error(WFE) maps using the Durango software package.22 In rolling the telescope, aberrations introduced by thesethree non-common path elements could be isolated from the telescope. A best alignment position was chosenbased on an average of the secondary actuator settings at each roll angle. The locking mechanisms limitedtranslational and angular control to 2 µm and 8 arcsec, respectively.
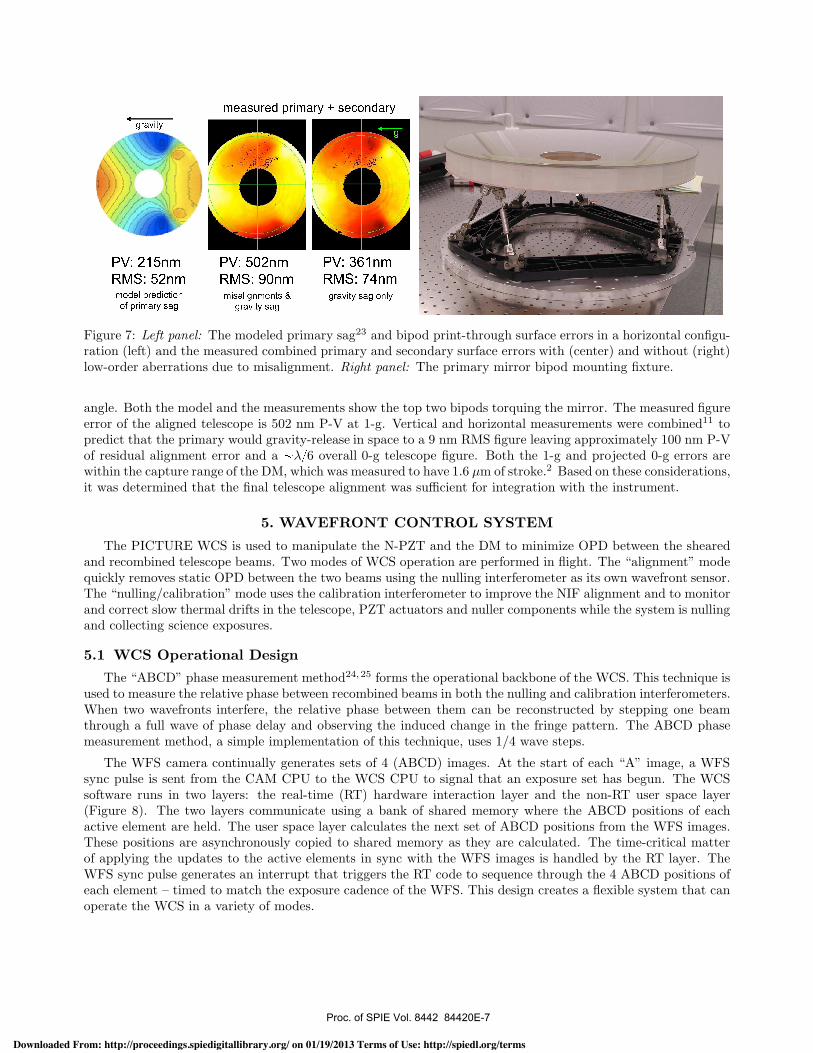
A characteristic figure error map of the final telescope alignment is shown in Figure 7. The error is dominatedby gravity sag on the primary mirror. The low-frequency figure error due to primary sag alone is modeled at215 nm P-V23 and measured at 361 nm P-V for the combined primary and secondary. Print-through from theprimary mounting bipods is apparent, as is a cylinder-like fold that varied in amplitude depending on the roll
Proc. of SPIE Vol. 8442 84420E-6
Downloaded From: http://proceedings.spiedigitallibrary.org/ on 01/19/2013 Terms of Use: http://spiedl.org/terms
gravitymeasured primary + secondary
"IPV: 215nm PV: 502nm PV: 36mmRMS: 52nm RMS: 9Onm RMS: 74nmmodel prediction misalignments & gravity sag onlyof primary sag gravity sag
Figure 7: Left panel: The modeled primary sag23 and bipod print-through surface errors in a horizontal configu-ration (left) and the measured combined primary and secondary surface errors with (center) and without (right)low-order aberrations due to misalignment. Right panel: The primary mirror bipod mounting fixture.
angle. Both the model and the measurements show the top two bipods torquing the mirror. The measured figureerror of the aligned telescope is 502 nm P-V at 1-g. Vertical and horizontal measurements were combined11 topredict that the primary would gravity-release in space to a 9 nm RMS figure leaving approximately 100 nm P-Vof residual alignment error and a λ 6 overall 0-g telescope figure. Both the 1-g and projected 0-g errors arewithin the capture range of the DM, which was measured to have 1.6 µm of stroke.2 Based on these considerations,it was determined that the final telescope alignment was sufficient for integration with the instrument.
5. WAVEFRONT CONTROL SYSTEM
The PICTURE WCS is used to manipulate the N-PZT and the DM to minimize OPD between the shearedand recombined telescope beams. Two modes of WCS operation are performed in flight. The “alignment” modequickly removes static OPD between the two beams using the nulling interferometer as its own wavefront sensor.The “nulling/calibration” mode uses the calibration interferometer to improve the NIF alignment and to monitorand correct slow thermal drifts in the telescope, PZT actuators and nuller components while the system is nullingand collecting science exposures.
5.1 WCS Operational Design
The “ABCD” phase measurement method24, 25 forms the operational backbone of the WCS. This technique isused to measure the relative phase between recombined beams in both the nulling and calibration interferometers.When two wavefronts interfere, the relative phase between them can be reconstructed by stepping one beamthrough a full wave of phase delay and observing the induced change in the fringe pattern. The ABCD phasemeasurement method, a simple implementation of this technique, uses 1/4 wave steps.
The WFS camera continually generates sets of 4 (ABCD) images. At the start of each “A” image, a WFSsync pulse is sent from the CAM CPU to the WCS CPU to signal that an exposure set has begun. The WCSsoftware runs in two layers: the real-time (RT) hardware interaction layer and the non-RT user space layer(Figure 8). The two layers communicate using a bank of shared memory where the ABCD positions of eachactive element are held. The user space layer calculates the next set of ABCD positions from the WFS images.These positions are asynchronously copied to shared memory as they are calculated. The time-critical matterof applying the updates to the active elements in sync with the WFS images is handled by the RT layer. TheWFS sync pulse generates an interrupt that triggers the RT code to sequence through the 4 ABCD positions ofeach element – timed to match the exposure cadence of the WFS. This design creates a flexible system that canoperate the WCS in a variety of modes.
Proc. of SPIE Vol. 8442 84420E-7
Downloaded From: http://proceedings.spiedigitallibrary.org/ on 01/19/2013 Terms of Use: http://spiedl.org/terms

Ur,arapped Phase
bJrs 0
13 441VisibilityIt;ty
177 465 C! 4
!"#$%&'($)*+,-.
!"##/01$234.-
)05-0.65/$7+896.6:6465/$7+8;0<=+88->$2?+.-$7+8@68A$@645A$26.5B0C-.6>3+4$2?+.-$7+8D5?-=0-5
!"#$%"#&"%"#
'%()*+#
,-./0#1
2-3*4-+3
(7$$EF2G@$$2F2G@$$'F2G@%&'($2B.6HB0.
56*789:%"%92$-86("3
&#"9; &#"95 &#"9, &#"9:
,-./
<#%7=>*?#9@%/#$
&)%$#89'#?-$/
A3#$9&.%(#9@%/#$
(7 EF2G@ 2F2G@ 'F2G@:!B92-$"3
I%J I%J I%J !"#$DK8$@6*-
)E@DCC;2@
!"#$%$&$' !"#$($&$)*+ !"#$,$&$) !"#$-$&$.)*+
/01203415 6434748415 9:3; <=:32
>0?@:AA2B$<=:32 C234BD:8$<=:32 -9$#2E0F3
!"#$%
GG<$"41*#D71@:HIJ0
Figure 8: Left: WCS software architecture. Right: WCS data products.
5.2 WCS Data Products
ABCD image sets are collected by the WCS CPU from the CAM CPU over the on-board ethernet andprocessed into several data products. First, the images are corrected for background counts, dark counts, andflat-field effects. Then, intensity (I), visibility (V) and phase (φ) maps are calculated using Equations (1,2,3). Apixel selection mask is also defined to include all pixels with intensity and visibility above a pre-defined threshold.
I A B C D (1)
V 2A C 2 B D 2
I2(2)
φ ArcTanB D
A C(3)
Next, a test is run on the phase map to determine if there are phase wraps across the pupil. If so, the iterativePicard method26 is used to build an unwrapped phase map. A tip/tilt/piston (TTP) plane is fit to the unwrappedphase map and subtracted off to create a residual phase map. To prevent DM edge effects around the selectionmask, the residual phase map is extrapolated and smoothed onto the pixels outside the selection region. Anexample set of these data products taken during WCS alignment mode is displayed in Figure 8.
5.3 Alignment and Calibration
The WCS alignment mode is used first to quickly drive out static OPD from figure errors on the optics and theincurred misalignments due to launch vibration and gravity release on the telescope. In this mode, the N-PZTis configured to make 1/4 wave ABCD steps such that the generated data products represent the OPD betweenthe two arms of the NIF. The TTP error signal is applied to the N-PZT zero-point “A” position, processedfirst through a simple integral servo controller. This correction is superimposed on top of the continuous ABCDpiston stepping. The residual error correction is applied to the DM, likewise through an integral controller.
The alignment mode is halted when the residual OPD is pushed below 10 nm RMS. At this point, theinstrument is placed into “nulling/calibration” mode. With the N-PZT set to the C=π “null” position, thenuller dark output is now sent to the science camera. The once highly saturated science images drop well belowthe saturation limit and the WFS images go dark. With the system nulling, calibration can begin. The P-PZT istilted to pass the nuller bright output through the calibration pinhole to create a reference beam that is interferedwith the NIF dark output. The C-PZT begins stepping at 1/4 wave intervals. The WCS data products now
Proc. of SPIE Vol. 8442 84420E-8
Downloaded From: http://proceedings.spiedigitallibrary.org/ on 01/19/2013 Terms of Use: http://spiedl.org/terms

!"!#
$%%%%&
'()*
+,
-%%.
#'/'01+
*(*
'
2%..$%.
3%.
''
..+ +' .%+
$%..%&%.&4
%.
3%. ! ""
#!5.% %% 6%'% % $
#.'$
3%.%&'
+ +' .!"!#
$%%%%&
''7+ 8%
%%()+ .$$.8%%%%&()*/0,
!+#%$
*
!-+*%
!-+*%
+
9#.$ .$7 &,-.%.$.$+/'0$+'.%. $+..+ .$*#:+ .$'$+(7:,(/09;%.'%. &
Figure 9: WCS flight software state machine layout.
measure OPD within the calibration system. The calibration maps can be used to simply monitor the nullerperformance, or to provide fine-alignment error signals for null maintenance and improvement. To continuedriving the DM, the N-PZT is dithered on either side of the null to measure the slope of the fringe visibilityat each DM actuator. The DM actuators are set to minimize the calibration visibility. The dither pattern isrequired to measure the downhill direction for each actuator. This method was shown to achieve 2 nm RMS OPDacross the full pupil using the flight DM.2
The measured calibration maps can also be used in image post processing to further separate starlight fromplanetary light. This technique takes advantage of the fact that the stellar light is coherent in the CIF, whilethe planetary light is not. The calibration fringes are formed only by stellar photons and a reconstructed PSFfrom these fringes represents only the stellar component. This PSF can be subtracted from the science imagesto reveal the planetary signal. This technique is explained in Ref. 27.
5.4 Flight Alignment Procedure
The discussed methods for nuller alignment and calibration fit into the larger schema of automated operationduring flight. The flight alignment procedure is implemented as a simple state machine on the WCS CPU. Theflight states take the WCS data products as input and nominally follow a pre-determined order – each state exitsto one and only one state. As a fail-safe, the operator can command the alignment procedure to either startover with the original startup conditions, or fall back to a saved state. The flight state machine is diagrammedin Figure 9. One iteration of the state machine is defined by one ABCD image set. For each iteration, thestate decides whether or not to advance to the next state. This decision is based either on self-evaluation of itsprogress, or a pre-determined number of iterations. The flight states are as follows:
• LOST: The system begins here. The initial DM and PZT settings are set to their hard-coded defaults.The DM is set to a pre-defined flat pattern. The N-PZT is configured to make 1/4 wave ABCD steps. TheP-PZT is tilted at an extreme angle to dump the NIF bright output. The C-PZT is frozen.
• FIND PACKET: The N-PZT zero-point is stepped in 0.8 µm intervals over its 8 µm range until themeasured average visibility across the pupil passes through a maximum. As seen in Figure 10, these stepsare small enough to catch some part of the white-light fringe packet, which is approximately 3 µm wide.
Proc. of SPIE Vol. 8442 84420E-9
Downloaded From: http://proceedings.spiedigitallibrary.org/ on 01/19/2013 Terms of Use: http://spiedl.org/terms

!"#"$%&%'()*+ ('+%,-./
Figure 10: Left: A scan of the N-PZT through the white-light fringe packet. Right: A residual OPD map of thepupil in the POKED state.
The N-PZT begins at the position where the central fringe packet was last measured on the ground. Ifno packet is found, the stepping program wraps around to the low end of the PZT stroke and continuesstepping. If the fringe packet is out of range, another 2 µm of delay can be accessed by shifting the angletracker target position laterally in the shear direction. This is equivalent to adding a delay between thetwo NIF arms.
• COARSE MODE: An integral servo controller is run to minimize the measured TTP using the N-PZT.The DM remains static. The state advances when these values drop below a threshold.
• FIND CENTRAL: Here the N-PZT makes single fringe hops in either direction to locate the central fringe.The search routine uses the average visibility across the pupil to climb uphill to the central fringe.
• POKED: The DM is registered to the WFS image. The DM pokes up two actuators creating two “bright”spots in the calculated phase map (Figure 10). These spots are located and centroided. They are usedto calculate the rotation and scale mapping between the WFS coordinates and the DM coordinates. Thisstate is necessary to correct for any shifts in the WFS position from launch vibration.
• FINE MODE: Now both the N-PZT and DM servo controllers are operational. The TTP error signal issent to the N-PZT and the residual errors are mapped onto the DM. The WCS works to push each pixel inthe C=π WFS image to the bottom of the central dark fringe. To exit this state requires user interaction.An operator on the ground watches the RMS OPD fall towards zero. When the decision is made that theOPD is no longer improving, an uplink command is sent to begin nulling. At this point the WCS switchesfrom “alignment” mode to “nulling/calibration” mode. The N-PZT is set to the C=π position, and thecalibration interferometer is activated.
• FIND PINHOLE: Before flight, the pinhole position and the P-PZT range of motion are registered to theangle tracker image coordinates to aid the P-PZT in quickly locating the pinhole based on the current angletracker spot position. If the pinhole is not found immediately, a spiral search is implemented. The spiralstep size is set at 1/5 the pinhole diameter. When the pinhole is found, the WFS lights up dramaticallyand the C-PZT begins 1/4 wave ABCD stepping.
• FIND CAL PACKET: This state is identical to the “FIND PACKET” state except here we are finding thecalibration fringe packet.
• NULL DITHER: This state requires three iterations to make one measurement. For each iteration, theN-PZT cycles though the following pattern with respect to the null: -15 nm, 0 nm, +15 nm. The C-PZTcontinues ABCD stepping to generate a calibration visibility map for each of the three N-PZT positions.A parabola is fit to the 3-point visibility curve for each DM actuator and the measured null offset is fedinto the DM servo. The dither size is initially 15 nm, but this can be reduced as the system walks ontothe null as described in Ref. 2.
Proc. of SPIE Vol. 8442 84420E-10
Downloaded From: http://proceedings.spiedigitallibrary.org/ on 01/19/2013 Terms of Use: http://spiedl.org/terms

!"#$%&'()*+,'"-#!,&.(/,
01,*
%(&-)!!,*
*,%*(23%
4544."**(*
3+6)"'"7(-&."**(*
Figure 11: PICTURE payload test configurations. Optical layout (top-left). Horizontal test configuration(bottom-left). Vertical test configuration (right). In the vertical configuration, the 0.5 m retro mirror is heldinside the endcap fixture. Three jack screws positioned on the bottom of the endcap are used to adjust tip andtilt. The entire payload stands freely on-end atop a floating optical bench.
5.5 WCS Pre-Flight Testing
5.5.1 Nuller Performance Tests
Null depth tests were performed at JPL before the nuller was delivered to Boston University to be integratedwith the payload. The nuller performance was measured using two methods: the dark output was coupled into asingle mode fiber as described in Ref. 3 and a CCD camera was used to image the entire science focal plane.2 Thedeepest broadband (20%) null achieved with the flight nuller was 4000:1 using the fiber method. This null is afactor of 10 worse than the limit imposed by the 1% reflectivity mismatch between the DM and N-PZT coatings.The limited nuller performance is likely due to sub-actuator surface features on the DM. This “scalloping” effectis measured on the flight DM at 15 nm RMS.2
5.5.2 Payload Functionality Tests
End-to-end testing of the payload was conducted in both horizontal and vertical configurations. The testingwas performed to demonstrate functionality of the WCS alignment procedure on the full-up payload and todetermine if the combined telescope and instrument aberrations were within the capture range of the DM. Thetest configurations are shown in Figure 11 along with a simplified drawing of the optical layout. A single modefiber was used to inject a test beam at telescope focus through a fiber ferrule that is built into the back of theacquisition mirror and projects back towards the secondary mirror. The test beam runs backwards through thetelescope and is retro-reflected with a slight tilt to pass the return beam through the acquisition mirror pinholeand down into the instrument. In this configuration, the telescope is used in double pass; the WFE introducedby the telescope and thus the stroke required by the DM is doubled. Before integration with the telescope, WCStesting was performed using the TATT spherical mirror (see Figure 6) as a telescope simulator.
During the functionality test, the alignment state machine operated as it would in flight. The residual RMSOPD and TTP values for the TATT and telescope are plotted through the progression of the state machine
Proc. of SPIE Vol. 8442 84420E-11
Downloaded From: http://proceedings.spiedigitallibrary.org/ on 01/19/2013 Terms of Use: http://spiedl.org/terms

Nuller Alignment Sequence (TATT)ResidualRMS OPD
[nm]Tip
[nm/px]
Tilt[nm/px]
Piston[nm]
StateFP CM FC P FM
Time [sec]
Time [sec]
Double PassNuller Alignment Sequence (Telescope)
TATT Initial OPD [nm]
FPCM FC P FM
ResidualRMS OPD
[nm]Tip
[nm/px]
Tilt[nm/px]
Piston[nm]
State
Telescope Initial OPD [nm]
TATT Final OPD [nm]
Telescope Final OPD [nm]
Figure 12: The progression of the flight alignment state machine on both the TATT and telescope in doublepass. The telescope test was conducted in the vertical configuration (see Figure 11). Initial and final residualOPD maps are taken at the beginning and end of FINE MODE (FM). Note that the OPD map color scale variesbetween images.
in Figure 12. The telescope test results are from the more environmentally stable vertical configuration. Theinitial and final residual OPD maps, taken at the beginning and end of FINE MODE, are also shown. In bothtests, the WCS was able to push the residual OPD below 10 nm RMS. Both tests used the same initial DMsettings, which were established from earlier TATT tests. This explains the longer telescope alignment time; the1-g primary figure imparted nearly a full wave of OPD to begin with. As discussed in Section 4, the predictedλ 6 0-g telescope should produce a wavefront more similar to that of the TATT. The TATT test completed
alignment in 85 seconds, an acceptable amount of time for a 5 min observing window. In the telescope test, theDM was shown to have adequate stroke to remove most of the low-frequency OPD down to the 20 nm level –a positive result given that the tests were conducted in double pass with a 1-g primary. Environmental effectsfrom air currents and vibration further limited the telescope tests.
The TATT setup reached 4 nm RMS residual OPD. The final TATT OPD map clearly shows the high-frequency, sub-actuator scalloping effect from the DM, which appears as a checkerboard pattern. To pushthe lower spatial frequency performance down into the 1 nm RMS regime, the calibration system is needed.Unfortunately, a fabrication error in the nuller prevents calibrator operation across the full pupil. A portion ofthe pupil is obscured by the calibrator pinhole mount. This can be fixed for a future flight to restore full nulleroperation.
6. FINE POINTING SYSTEM
The rocket ACS provides 1 arcsec pointing stability. The PICTURE nuller requires 10 milliarcsecond(mas) stability to operate in the regime where its performance is limited by the surface quality of the DM. ThePICTURE FPS actively stabilizes the nuller input beam using a PZT driven FSM for tip/tilt correction and ahigh-speed angle tracker camera for stellar centroid measurement. The optical design is illustrated in Figure 2.The measured centroids are fed back to the FSM using a software PID controller that runs on the FPS CPUwith a system rate that can range from 200 Hz to 1000 Hz. Details of the FPS design and flight performanceare presented in (Mendillo et. al. (2012) submitted).
Proc. of SPIE Vol. 8442 84420E-12
Downloaded From: http://proceedings.spiedigitallibrary.org/ on 01/19/2013 Terms of Use: http://spiedl.org/terms

IFigure 13: Left: PICTURE launch. Right: Telemetry failure. The main science data telemetry transmitter(TM 2) failed 70 seconds after launch.
7. FLIGHT, ANOMALY, RECOVERY & FUTURE WORK
PICTURE launched from White Sands Missile Range at 4:25 MDT on October 8th, 2011. Approximately 70seconds after launch, the main science data telemetry transmitter onboard the payload failed. Figure 13 showsthe TM transmitter power during flight. This TM channel transmits the high-bandwidth 4 Mbps data streamshown in Figure 4, which carries all of the WFS and SCI images and the WCS data products. Due to lack ofdata, the in-flight performance of the nuller and active optics cannot be confirmed. Approximately 20 secondsof flight data has been recovered, unfortunately this data is from very early in the flight, before the FPS hadacquired steering lock and thus the nuller had not begun its alignment sequence. This data may be useful infuture analysis for determining some basic functionality of the nuller and telescope.
The most important result returned from the PICTURE flight is the successful demonstration of the FPS.In flight, the ACS acquired the calibration star, Rigel according to schedule. Manual ACS uplinks were sent todrive the star into the acquisition mirror pinhole. The functioning FPS telemetry link showed the star appear onthe live angle tracker GSE display. An additional ACS uplink was sent to drive the star into the capture range ofthe FSM at which point the FPS immediately locked on and stabilized the beam pointing. The FPS operated at200 Hz with a 5 Hz bandwidth. Analysis of the raw centroid and FSM data that was stored onboard has shownthat the FPS stabilized the 627 mas RMS ACS radial pointing error to 5.1 mas RMS. The FSM position dataalso provides a high-precision measurement of the rocket ACS performance. A power spectral density analysisof both the ACS body-pointing and the FPS stability is presented in (Mendillo et. al. (2012) submitted).
The operation of the telescope in flight is confirmed through the FPS results. The FPS data suggests thatthe telescope PSF was much larger than anticipated, nearly 10 the diffraction limit. The cause of this is yetunknown. Unfortunately, the lightweight primary mirror shattered upon landing in the New Mexican desert.The remaining hardware was recovered intact and appears to be in working order. Post-flight optical testing hasnot yet been conducted.
Future prospects look towards a PICTURE reflight. This would first and foremost accomplish the scienceand technology goals of the first mission. In addition, many lessons have been learned along the 7 year road toflight. A number of hardware upgrades have been identified to improve the nuller performance. The two leadingcontributors to OPD in the nuller, the telescope primary mirror and the DM, should be replaced. A morerigid SiC primary would narrow the void between laboratory and space operation, giving near diffraction-limitedperformance in both environments with a similar areal density. Higher quality production-run DMs are nowavailable from BMC. A drop-in replacement could be integrated into the nuller and run with the existing driverelectronics. The nuller calibration system could also be revived by replacing the pinhole mount with a designthat does not obscure the calibration reference beam. This would enable full nuller operation and an additionalavenue for data post-processing.
Proc. of SPIE Vol. 8442 84420E-13
Downloaded From: http://proceedings.spiedigitallibrary.org/ on 01/19/2013 Terms of Use: http://spiedl.org/terms
ACKNOWLEDGMENTS
The authors would like to acknowledge and thank the entire PICTURE team. Boston University: PaulJung, Jason Martel, Ewan Douglas, Meredith Danowski, Nicholas McConnell and John Atkinson. JPL: RobGappinger, S. Felipe Fregoso, Francisco Aguayo, Randy Bartos, Gary Brack and Jim Moore. GSFC: ScottAntonille, Jeffrey Bolognese, Shane Wake, Tom Wallace and Joseph Davila. MIT: Mark Bautz, Steve Kissel,Geoff Crew, Rick Foster, Jim O’Connor, Dorothy Gordon, Matt Smith and Bob Goeke. Northrop Grumman:Ronald Polidan. Lockheed Martin: Dominick Tennerelli, Bill Reeve, John Miles, Andy Klavins and Bill Sable.BMC: Paul Bierden; Thomas Bifano acknowledges a financial interest in Boston Micromachines Corporation.We’d like to thank the entire WFF I&T crew and WSMR flight crew, especially our flight MM Christine Powerand integration MM David Jennings. Special thanks to Scott Taylor at WFF for fixing the telemetry GSEreceiver the day before launch and to Bhaskar Bose at Derivation Systems for donating his time to rewriteand test our FPGA code during flight integration. This work was funded by NASA grants NNG05WC17Gand NNX11AD53G, and through graduate fellowships awarded to Christopher Mendillo and Brian Hicks by theMassachusetts Space Grant Consortium. The research carried out at the Jet Propulsion Laboratory, CaliforniaInstitute of Technology, was done so under a contract with the National Aeronautics and Space Administration.
REFERENCES
[1] Stark, C. C. and Kuchner, M. J., “The detectability of exo-earths and super-earths via resonant signaturesin exozodiacal clouds,” ApJ 686, 637–648 (2008).
[2] Rao, S. R., Wallace, J. K., Samuele, R., Chakrabarti, S., Cook, T., Hicks, B., Jung, P., Lane, B., Levine,B. M., Mendillo, C., Schmidtlin, E., Shao, M., and Stewart, J. B., “Path length control in a nullingcoronagraph with a mems deformable mirror and a calibration interferometer,” Proc. SPIE 6888, 68880B(2008).
[3] Samuele, R., Wallace, J., Schmidtlin, E., Shao, M., Levine, B., and Fregoso, S., “Experimental progress andresults of a visible nulling coronagraph,” Proc. IEEE Aerospace Conference , 1–7 (2007).
[4] Shao, M., Levine, B. M., Wallace, J. K., Orton, G. S., Schmidtlin, E., Lane, B. F., Seager, S., Tolls, V.,Lyon, R. G., Samuele, R., Tenerelli, D. J., Woodruff, R., and Ge, J., “A nulling coronagraph for tpf-c,”Proc. SPIE 6265, 626517 (2006).
[5] Greaves, J. S., Holland, W. S., Moriarty-Schieven, G., Jenness, T., Dent, W. R. F., Zuckerman, B., Mc-Carthy, C., Webb, R. A., Butner, H. M., Gear, W. K., and Walker, H. J., “A dust ring around epsiloneridani: Analog to the young solar system,” ApJL 506, L133–L137 (1998).
[6] Greaves, J. S., Holland, W. S., Wyatt, M. C., Dent, W. R. F., Robson, E. I., Coulson, I. M., Jenness,T., Moriarty-Schieven, G. H., Davis, G. R., Butner, H. M., Gear, W. K., Dominik, C., and Walker, H. J.,“Structure in the ε eridani debris disk,” ApJL 619, L187–L190 (2005).
[7] Backman, D., Marengo, M., Stapelfeldt, K., Su, K., Wilner, D., Dowell, C. D., Watson, D., Stansberry,J., Rieke, G., Megeath, T., Fazio, G., and Werner, M., “Epsilon eridani’s planetary debris disk: Structureand dynamics based on spitzer and caltech submillimeter observatory observations,” ApJ 690, 1522–1538(2009).
[8] Hatzes, A. P., Cochran, W. D., McArthur, B., Baliunas, S. L., Walker, G. A. H., Campbell, B., Irwin, A. W.,Yang, S., Kurster, M., Endl, M., Els, S., Butler, R. P., and Marcy, G. W., “Evidence for a long-period planetorbiting ε eridani,” ApJL 544, L145–L148 (2000).
[9] Benedict, G. F., McArthur, B. E., Gatewood, G., Nelan, E., Cochran, W. D., Hatzes, A., Endl, M.,Wittenmyer, R., Baliunas, S. L., Walker, G. A. H., Yang, S., Kurster, M., Els, S., and Paulson, D. B., “Theextrasolar planet ε eridani b: Orbit and mass,” AJ 132, 2206–2218 (2006).
[10] Liu, W. M., Hinz, P. M., Hoffmann, W. F., Brusa, G., Miller, D., and Kenworthy, M. A., “Observationsof main-sequence stars and limits on exozodical dust with nulling interferometry,” ApJ 693, 1500–1507(2009).
[11] Antonille, S., Content, D., Rabin, D., Wake, S., and Wallace, T., “Figure verification of a precision ultra-lightweight mirror: techniques and results from the sharpi/picture mirror at nasa/gsfc,” Proc. SPIE 7011,70110Z (2008).
Proc. of SPIE Vol. 8442 84420E-14
Downloaded From: http://proceedings.spiedigitallibrary.org/ on 01/19/2013 Terms of Use: http://spiedl.org/terms

[12] Rabin, D., Davila, J., Content, D., Keski-Kuha, R., and Michael, S., “Sharpi: Solar high angular resolutionphotometric imager,” BAAS 34, 735 (2002).
[13] Bautz, M. W., Kissel, S. E., Prigozhin, G. Y., LaMarr, B., Burke, B. E., and Gregory, J. A., “Progressin x-ray ccd sensor performance for the astro-e2 x-ray imaging spectrometer,” Proc. SPIE 5501, 111–122(2004).
[14] Serabyn, E. and Colavita, M. M., “Fully symmetric nulling beam combiners,” Appl. Opt. 40, 1668–1671(2001).
[15] Mennesson, B. P., Shao, M., Levine, B. M., Wallace, J. K., Liu, D. T., Serabyn, E., Unwin, S. C., andBeichman, C. A., “Optical planet discoverer: how to turn a 1.5-m class space telescope into a powerfulexo-planetary systems imager,” Proc. SPIE 4860, 32–44 (2003).
[16] Levine, B. M., Shao, M., Liu, D. T., Wallace, J. K., and Lane, B. F., “Planet detection in visible light witha single aperture telescope and nulling coronagraph,” Proc. SPIE 5170, 200–208 (2003).
[17] Wallace, J. K., Burruss, R. S., Bartos, R. D., Trinh, T. Q., Pueyo, L. A., Fregoso, S. F., Angione, J. R.,and Shelton, J. C., “The gemini planet imager calibration wavefront sensor instrument,” Proc. SPIE 7736,77365D (2010).
[18] Morgan, R. M., Burge, J. H., and Woolf, N. J., “Nulling interferometric beam combiner utilizing dielectricplates: experimental results in the visible broadband,” Proc. SPIE 4006, 340–348 (2000).
[19] Shao, M., Wallace, J. K., Levine, B. M., and Liu, D. T., “Visible nulling interferometer,” Proc. SPIE 5487,1296–1303 (2004).
[20] Marois, C., Lafreniere, D., Doyon, R., Macintosh, B., and Nadeau, D., “Angular differential imaging: Apowerful high-contrast imaging technique,” ApJ 641, 556–564 (2006).
[21] Percival, J. W., Jaehnig, K. P., and Nordsieck, K. H., “A low-cost star tracker for sounding rockets andclass d satellites,” BAAS 39, 976 (2007).
[22] Durango website, www.diffraction.com.[23] Antonille, S. and Content, D. private communication (2008).[24] Wyant, J. C., “Use of an ac heterodyne lateral shear interferometer with real-time wavefront correction
systems,” Appl. Opt. 14, 2622–2626 (1975).[25] Colavita, M. M., Wallace, J. K., Hines, B. E., Gursel, Y., Malbet, F., Palmer, D. L., Pan, X. P., Shao, M.,
Yu, J. W., Boden, A. F., Dumont, P. J., Gubler, J., Koresko, C. D., Kulkarni, S. R., Lane, B. F., Mobley,D. W., and van Belle, G. T., “The palomar testbed interferometer,” ApJ 510, 505–521 (1999).
[26] Ghiglia, D. C. and Romero, L. A., “Robust two-dimensional weighted and unweighted phase unwrappingthat uses fast transforms and iterative methods,” JOSAA 11, 107–117 (1994).
[27] Lane, B. F., Muterspaugh, M. W., and Shao, M., “Calibrating an interferometric null,” ApJ 648, 1276–1284(2006).
Proc. of SPIE Vol. 8442 84420E-15
Downloaded From: http://proceedings.spiedigitallibrary.org/ on 01/19/2013 Terms of Use: http://spiedl.org/terms