PI3Kγ/δ and NOTCH1 cross-regulate pathways that define the...
47
1 PI3K and NOTCH1 cross-regulate pathways that define the T-cell acute lymphoblastic leukemia disease signature Evgeni Efimenko, 1 * Utpal P. Davé, 2 * Irina V. Lebedeva, 1 Yao Shen, 3 Maria J. Sanchez- Quintero, 4 Daniel Diolaiti, 1 Andrew Kung, 1 Brian J. Lannutti, 5 Jianchung Chen, 1 Ronald Realubit, 3 Zoya Niatsetskiya, 1 Vadim Ten, 1 Charles Karan, 3 Xi Chen, 6 Andrea Califano, 3 and Thomas G. Diacovo 1,7 1 Department of Pediatrics, Columbia University Medical Center, New York, New York, 10032, USA. 2 Division of Hematology/Oncology, Indiana University School of Medicine and the IU Simon Cancer Center, Indianapolis, Indiana 46202. 3 Department of Systems Biology, Columbia University, New York, New York, 10032, USA. 4 Department of Neurology, Columbia University Medical Center, New York, NY 10032, USA. 5 Oncternal Therapeutics. San Diego, CA 92130. 6 Department of Public Health Sciences, University of Miami, Miami Florida, 33136, USA. 7 Department of Pathology and Cell Biology, Columbia University Medical Center, New York, New York, 10032, USA. * contributed equally Running title: Interplay between PI3K/ and NOTCH1 in Lmo2-driven T-ALL Key Words (5): T-ALL, GSI, PI3Kγ/δ, cMYC, NOTCH1 Financial support This research is supported by National Cancer Institute grant R01CA169162-01 (T.G. Diacovo), Department of Veterans Affairs (I01BX001799, U.P.D.), the Vanderbilt Ingram Cancer Center (P30 CA68485) (U.P. Davé). on August 11, 2019. © 2017 American Association for Cancer Research. mct.aacrjournals.org Downloaded from Author manuscripts have been peer reviewed and accepted for publication but have not yet been edited. Author Manuscript Published OnlineFirst on July 17, 2017; DOI: 10.1158/1535-7163.MCT-17-0141
Transcript of PI3Kγ/δ and NOTCH1 cross-regulate pathways that define the...
1
PI3Kand NOTCH1 cross-regulate pathways that define the T-cell acute
lymphoblastic leukemia disease signature
Evgeni Efimenko,1* Utpal P. Davé,2* Irina V. Lebedeva,1 Yao Shen,3 Maria J. Sanchez-
Quintero,4 Daniel Diolaiti,1 Andrew Kung,1 Brian J. Lannutti,5 Jianchung Chen,1 Ronald
Realubit,3 Zoya Niatsetskiya,1 Vadim Ten,1 Charles Karan,3 Xi Chen,6 Andrea Califano,3
and Thomas G. Diacovo1,7
1Department of Pediatrics, Columbia University Medical Center, New York, New York,
10032, USA. 2Division of Hematology/Oncology, Indiana University School of Medicine
and the IU Simon Cancer Center, Indianapolis, Indiana 46202. 3Department of Systems
Biology, Columbia University, New York, New York, 10032, USA. 4Department of
Neurology, Columbia University Medical Center, New York, NY 10032, USA.
5Oncternal Therapeutics. San Diego, CA 92130. 6Department of Public Health Sciences,
University of Miami, Miami Florida, 33136, USA. 7Department of Pathology and Cell
Biology, Columbia University Medical Center, New York, New York, 10032, USA.
* contributed equally
Running title: Interplay between PI3K/ and NOTCH1 in Lmo2-driven T-ALL
Key Words (5): T-ALL, GSI, PI3Kγ/δ, cMYC, NOTCH1
Financial support
This research is supported by National Cancer Institute grant R01CA169162-01 (T.G.
Diacovo), Department of Veterans Affairs (I01BX001799, U.P.D.), the Vanderbilt
Ingram Cancer Center (P30 CA68485) (U.P. Davé).
on August 11, 2019. © 2017 American Association for Cancer Research. mct.aacrjournals.org Downloaded from
Author manuscripts have been peer reviewed and accepted for publication but have not yet been edited. Author Manuscript Published OnlineFirst on July 17, 2017; DOI: 10.1158/1535-7163.MCT-17-0141

2
Correspondence
Thomas Diacovo, MD
Columbia University
1130 St. Nicholas Ave, Room 924
New York, NY 10032
Tel: 212-851-4683
E-mail: [email protected]
Conflict of Interest Disclosure The authors declare no potential conflicts of interest
Text word count: 4,882
Text abstract count: 226
Number of figures: 7, and 5 Supplementary Figures
Number of tables: 3 Supplementary Tables
on August 11, 2019. © 2017 American Association for Cancer Research. mct.aacrjournals.org Downloaded from
Author manuscripts have been peer reviewed and accepted for publication but have not yet been edited. Author Manuscript Published OnlineFirst on July 17, 2017; DOI: 10.1158/1535-7163.MCT-17-0141

3
Abstract
PI3K/AKT and NOTCH1 signaling pathways are frequently dysregulated in T-cell acute
lymphoblastic leukemias (T-ALL). Although we have shown that the combined activities
of the class I PI3K isoforms p110 and p110 play a major role in the development and
progression of PTEN null T-ALL, it has yet to be determined whether their contribution
to leukemogenic programing is unique from that associated with NOTCH1 activation.
Using a Lmo2-driven mouse model of T-ALL in which both the PI3K/AKT and
NOTCH1 pathways are aberrantly upregulated, we now demonstrate that the combined
activities of PI3K have both overlapping and distinct roles from NOTCH1 in
generating T-ALL disease signature and in promoting tumor cell growth. Treatment of
diseased animals with either a dual PI3K or a -secretase inhibitor (GSI) reduced
tumor burden, prolonged survival, and induced proapoptotic pathways. Consistent with
their similar biological effects, both inhibitors downregulated genes involved in cMYC-
dependent metabolism in gene set enrichment analyses. Furthermore, overexpression of
cMYC in mice or T-ALL cell lines conferred resistance to both inhibitors, suggesting a
point of pathway convergence. Of note, interrogation of transcriptional regulators and
analysis of mitochondrial function showed that PI3K/activity played a greater role in
supporting the disease signature and critical bioenergetic pathways. Results provide
insight into the interrelationship between T-ALL oncogenic networks and the therapeutic
efficacy of dual PI3K/ inhibition in the context of NOTCH1 and cMYC signaling.
on August 11, 2019. © 2017 American Association for Cancer Research. mct.aacrjournals.org Downloaded from
Author manuscripts have been peer reviewed and accepted for publication but have not yet been edited. Author Manuscript Published OnlineFirst on July 17, 2017; DOI: 10.1158/1535-7163.MCT-17-0141

4
Introduction
T-cell acute lymphoblastic leukemia (T-ALL) is an aggressive disease characterized by
frequent relapse, resistance to chemotherapy, and reduced survival as compared to B-
precursor ALL (1). Consistent with most lymphoid malignancies, tumor development and
disease progression depend upon deregulation of an oncogene(s) and/or tumor suppressor
genes that permit unchecked proliferation and resistance to programmed cell death.
Chromosomal translocations driven by T-cell receptor-regulatory elements occur
frequently in T-ALL, resulting in aberrant expression of a select group of transcription
factor oncogenes such as TAL1, LMO1, LMO2, TLX1, and TLX3 (2-4). These gene
rearrangement events are typically accompanied by constitutive NOTCH1 signaling due
to mutations within its heterodimerization (HD) and C-terminal proline-, glutamic acid-,
serine-, and threonine-rich (PEST) domains, causing ligand-independent activation and
increased stability of the -secretase cleaved intracellular domain (ICN1) (5, 6).
Subsequent nuclear translocation of ICN1 stimulates transcription of downstream target
genes such as HES1, DTX1, and MYC, the latter being an essential mediator of NOTCH1
signaling (7, 8). cMYC is a known master transcription factor that regulates genes
essential for cell metabolism, proliferation and survival (9, 10).
Aberrant activation of the PI3K/AKT pathway has also been implicated in the
oncogenic transformation and tumor progression of T-ALL, and is associated with
aggressive biological features, drug resistance and poor prognosis (11-13). In the
majority of cases this results from a loss or reduced function of the phosphatase and
tensin homolog (PTEN) tumor suppressor, which limits levels of PIP3 generated by class
I PI3Ks (14). Interestingly, NOTCH1 has also been reported to indirectly regulate this
on August 11, 2019. © 2017 American Association for Cancer Research. mct.aacrjournals.org Downloaded from
Author manuscripts have been peer reviewed and accepted for publication but have not yet been edited. Author Manuscript Published OnlineFirst on July 17, 2017; DOI: 10.1158/1535-7163.MCT-17-0141

5
signaling pathway due to its ability to alter PTEN expression, which has been implicated
in inducing GSI resistance in T-ALL by switching “oncogene addiction” (15). However,
other studies have shown that PTEN status does not always correlate with GSI
responsiveness, and that NOTCH1 and PI3K/AKT pathways may work in concert to
promote tumor growth and survival (16, 17).
Previously, we have demonstrated the importance of the class I PI3K isoforms
p110 and p110 in T cell development and their ability to cooperate as non-classical
oncogenes in supporting leukemogenesis in the absence of negative regulation by PTEN
(18, 19). This was further evidenced by our observations that a highly selective dual
PI3Kγ/δ inhibitor CAL-130 significantly reduced disease burden, prolonged survival of
mice with established PTEN null T-ALL, and induced apoptosis in human T-ALL tumor
cells with aberrant PI3K/AKT signaling. Yet, it remains to be determined whether
PI3Kγ/δ regulate transcriptional pathways typically associated with activated NOTCH1
(e.g. cMYC). Investigations along these lines are essential for establishing whether p110-
selective small molecule inhibitors could synergize or substitute for GSIs in the treatment
of T-ALL. Indeed, the variable antitumor effects of GSIs reported in phase I clinical trails
would suggest that such an approach is warranted (20, 21). To this end, we evaluated the
molecular and genetic interplay between these pathways using the Lmo2-driven mouse
model of T-ALL where both PI3K/AKT and NOTCH1 are activated (22-23).
Additionally, gene set enrichment and pathway analyses were used to determine if these
disparate pro-oncogenic pathways controlled similar genes and transcriptional regulators
that are determinants of the disease signature associated with T-ALL.
on August 11, 2019. © 2017 American Association for Cancer Research. mct.aacrjournals.org Downloaded from
Author manuscripts have been peer reviewed and accepted for publication but have not yet been edited. Author Manuscript Published OnlineFirst on July 17, 2017; DOI: 10.1158/1535-7163.MCT-17-0141
6
Materials and Methods
Mice
Cohorts of CD2-Lmo2 and Gt(ROSA)26Sortm13(CAG-MYC, -CD2*)Rsky/J;Lck-cre/Ptenfl/fl, both
on C57BL/6J background, were monitored for the onset of leukemia (19, 22, 25).
Experiments were performed in accordance with guidelines set forth by the Institutional
Animal Care and Use Committee of Columbia University. Animals with established T-
ALL received either the dual PI3K inhibitor CAL-130 (10 mg/kg every 8 hours;
Calistoga Pharmaceuticals) (19) or the -secretase inhibitor dibenzazepine (DBZ; 10
µmol/kg IP daily; Tocris) (26) for a total of 7 days (27). Kaplan-Meier survival and
statistical analyses were performed using GraphPad Prism Version 6.0 software. Values
were considered significant at P < 0.05.
Primary leukemia samples and cell lines
Cryopreserved human T-ALL samples were provided by St. Jude Children's Research
Hospital and Vanderbilt University Medical Center after appropriate IRB review. All
samples were collected with informed consent. Murine CD2-Lmo2 T-ALL cell lines
03007 and 03027 were generated as previously described (23). In brief, they were
generated in the Davé lab (Vanderbilt University) from T-cell leukemia that arose in
transgenic B6.CD2-Lmo2 mice. Once established in culture, aliquots of cells were banked
in liquid nitrogen and samples obtained for this study in 2014. The cell lines were
identified and then confirmed immediately before use by their immunophenotpye and by
T-cell receptor Jβ rearrangement (23).
on August 11, 2019. © 2017 American Association for Cancer Research. mct.aacrjournals.org Downloaded from
Author manuscripts have been peer reviewed and accepted for publication but have not yet been edited. Author Manuscript Published OnlineFirst on July 17, 2017; DOI: 10.1158/1535-7163.MCT-17-0141

7
Retroviral transduction of murine cell line
Plasmid pMSCV-IRES-mCherry and pMSCV-cMyc-IRES-mCherry were kindly
provided by the laboratory of Dr. Riccardo Dalla-Favera (Columbia University, NY,
NY). Retroviruses were produced in ecotropic packaging cell line 293T Platinum-E
according to manufacturer’s instructions (Cell Biolabs Inc). Viral transduction was
performed using the RetroNectin® (Takara) and spinoculation method as previously
described (28).
Mutation detection
Sequencing of the Notch1 and Pten genes was performed on primary mouse T-ALL cells
by PCR using Pfu DNA polymerase (Stratagene) with primers specific for exon 34, and
exons 3 through 7, respectively.
FACS
Preparation, staining, and detection of cell surface and cytoplasmic proteins in primary T-
ALL cells and murine T-ALL cell lines were performed as previously described (19).
Western blot analysis
Cell lysates were prepared on ice in M-PER Mammalian Protein Extraction reagent
(Pierce) containing a cocktail of protease and phosphatase inhibitors (19). Lysates were
subjected to SDS-PAGE, transferred to PVDF membrane (Immobilon-P, Millipore), and
membranes probed by overnight incubation (4°C) with appropriate primary antibodies.
on August 11, 2019. © 2017 American Association for Cancer Research. mct.aacrjournals.org Downloaded from
Author manuscripts have been peer reviewed and accepted for publication but have not yet been edited. Author Manuscript Published OnlineFirst on July 17, 2017; DOI: 10.1158/1535-7163.MCT-17-0141
8
Bound antibodies were visualized with HRP-conjugated secondary antibodies and ECL
chemistry (SuperPico West, Pierce).
Drug synergy and cell viability studies
Murine CD2-Lmo2 T-ALL cell lines 03007 and 03027 were plated at optimal density into
384-well tissue culture plates (Greiner 781080) employing the Cell::Explorer automation
system (PerkinElmer). CAL-130 or the GSI CompE (ENZO Biochem) (29) (was added
using HP D300 Digital Dispenser, and drug activity measured at 60 hours using Cell
Titer Glo (Promega). The standard reference model of Bliss independence was employed
for the results analysis (30).
Cell lines were also grown in 6 well plates and individually treated with DMSO,
CAL-130, IC87114 (Calistoga) (31) CompE for 72 hours. Proliferation and cell death
were determined by cell counting with trypan blue and by staining with PI (BD
Biosciences) followed by flow cytometric analysis, respectively. For primary murine and
human T-ALL samples, cells were harvested from thymi of diseased animals and plated
with MS5-DL1 stromal cells in the presence of recombinant IL-7 and FLT-3 (mouse) or
recombinant IL-7, FLT-3 and SCF (human). T-ALL cell viability following 72 hours of
drug treatment was assessed using the BD Cell Viability kit (BD Biosciences) coupled
with fluorescent counting beads as previously described (19). After 72 hours of treatment,
absolute number of cells in DMSO control was set to 100%.
Mitochondria isolation and respiration studies
on August 11, 2019. © 2017 American Association for Cancer Research. mct.aacrjournals.org Downloaded from
Author manuscripts have been peer reviewed and accepted for publication but have not yet been edited. Author Manuscript Published OnlineFirst on July 17, 2017; DOI: 10.1158/1535-7163.MCT-17-0141
9
Mitochondria were isolated from murine T-ALL cells treated with DMSO or CAL-130
(2.5 µM, 12 h) and respiration analyzed in TRIS-MOPS buffer using Clark’s type
electrode (Hansatech, UK) as described (32).
OCR measurements
Murine CD2-Lmo2 T-ALL cell lines treated with CAL-130 (2.5µM, 12 h), CompE (1µM,
48 h) or vehicle (DMSO) were centrifuged and directly suspended in XF assay medium
(Seahorse Biosciences) supplemented with 10 mM glucose (Sigma-Aldrich) and 10 mM
sodium pyruvate (Invitrogen). For primary CD2-Lmo2 T-ALL tumors, cells were grown
on MS5-DL1 stromal cells in the presence of recombinant IL-7 and FLT-3 (mouse) for
24 h before the addition of DMSO, CAL-130 (2.5 µM, 12 h) or CompE (1µM, 48 h).
Tumor cells were then disrupted by pipetting, filtered through a 40 µm strainer to
separate from the stromal cells, and centrifuged and suspended in XF assay medium
(Seahorse Biosciences) supplemented with 10 mM glucose (Sigma-Aldrich) and 10 mM
sodium pyruvate (Invitrogen). Primary tumors or tumor cell lines were added to a XF24
cell culture microplate coated with poly-L-Lysine (Sigma-Aldrich). After 30 minutes at
37°C, OCR was measured using a XFe24 Analyzer (Seahorse Biosciences) after serial
injections of oligomycin (1µM), carbonyl cyanide 4-(trifluoromethoxy)phenylhydrazone
(FCCP) (0.75 µM), rotenone (1 µM) and antimycin A (1µM). Coupling efficiency, as a
measure of the fraction of basal mitochondrial OCR used for ATP synthesis, was
assessed by the decrease in respiration on inhibiting ATP synthase with oligomycin. Cell
respiratory control ratio is the ratio of the uncoupled OCR (rate after FCCP injection) to
OCR in the presence of oligomycin. Spare respiratory capacity was measured by the ratio
on August 11, 2019. © 2017 American Association for Cancer Research. mct.aacrjournals.org Downloaded from
Author manuscripts have been peer reviewed and accepted for publication but have not yet been edited. Author Manuscript Published OnlineFirst on July 17, 2017; DOI: 10.1158/1535-7163.MCT-17-0141
10
of the uncoupled OCR to the basal rate. Experiments were performed using at least 3
biological replicates and all values were internally normalized (33).
Glucose Uptake Assessment
Murine CD2-Lmo2 T-ALL cell lines cells treated as described were resuspended in
glucose-free RPMI-1640 medium containing 1% fetal calf serum (FCS) and 150 µM 2-
NBDG (Life Technologies), incubated for 10 min at 37° C, washed with ice-cold PBS
and analyzed using flow cytometry. Apigenin (100µM, 30 min treatment), an inhibitor of
Glut1 expression, was used as a positive control.
Microarray procedure
A representative murine CD2-Lmo2 derived T-ALL cell line (03007) was treated with
DMSO (0.6%) or CAL-130 (2.5 µM; 10 h) or CompE (1 µM; 48 h). Biological
triplicates were performed with each experimental condition and gene expression
profiling performed by Expression Analysis, Inc. using the Affymetrix Mouse Genome
430 array (#901570). Microarray data were then normalized using the Robust MultiChip
Averaging (RMA) algorithm as implemented in the Bioconductor package Affy (34). A
modified t-test was used in Bioconductor Limma package to identify differentially
expressed probe sets between each drug treatment group and control group (35). The P-
values from Limma analysis were adjusted by Benjamini and Hochberg method to control
false discovery rate (FDR) and genes were ranked to identify top 50 up and 50 down
regulated genes for each treatment condition (36).
on August 11, 2019. © 2017 American Association for Cancer Research. mct.aacrjournals.org Downloaded from
Author manuscripts have been peer reviewed and accepted for publication but have not yet been edited. Author Manuscript Published OnlineFirst on July 17, 2017; DOI: 10.1158/1535-7163.MCT-17-0141

11
Statistical analyses
Results are expressed as mean ± SEM for a minimum of 3 independent experiments.
Statistical analysis was performed using either the Student unpaired t-test or two-way
ANOVA followed by Bonferroni post-test. P values < 0.05 were considered significant.
Further detailed statistical analysis of the microarray data and information on
experimental methods can be found in supplemental materials available on the Molecular
Cancer Therapeutics Web site.
on August 11, 2019. © 2017 American Association for Cancer Research. mct.aacrjournals.org Downloaded from
Author manuscripts have been peer reviewed and accepted for publication but have not yet been edited. Author Manuscript Published OnlineFirst on July 17, 2017; DOI: 10.1158/1535-7163.MCT-17-0141

12
Results
Lmo2-driven T-ALL is defined by constitutive activation of PI3K/AKT and
NOTCH1 pathways
Disease penetrance was 100% with a median survival rate of 227 days in CD2-Lmo2
transgenic mice (Fig. 1A). Tumor cells displayed high levels of both phosphorylated
AKT (Thr308 and Ser473) and intracellular NOTCH1 (ICN) with activation of
downstream targets (Fig. 1B); all tumors expressed the p110 and p110 catalytic
domains of class I PI3Ks (Fig. 1 C). Of note, the majority of Lmo2-driven T-ALL lacked
expression of PTEN, acquired Notch1 mutations within the PEST domain
(Supplementary Table S1) and had evidence of upregulation of the Notch1 target genes
such as Deltex1 (~4-fold; Fig. 1D). Moreover, the majority of circulating blasts had an
immunophenotype characteristic of NOTCH1-induced T-ALL in mice: CD8 single
positive or CD4/CD8 double positive with high expression of CD25 (Fig. 2A and B).
Thus, the CD2-Lmo2 transgenic animal model of T-ALL provided an ideal system to
determine whether the combined activities of PI3K/ regulate similar or distinct
oncogenic programs typically associated with NOTCH1 activation.
PI3K/ blockade or GSI reduces leukemia burden and prolongs survival
To determine the reliance of Lmo2-driven T-ALL on the PI3K/AKT versus NOTCH1
pathway, we treated diseased animals with either the dual PI3K/ inhibitor CAL-130 (10
mg/kg every 8 hours) or the potent -secretase inhibitor DBZ (10 µmol/kg per day) for 7
days. Previously we have shown that CAL-130 is highly selective for the p110 and
on August 11, 2019. © 2017 American Association for Cancer Research. mct.aacrjournals.org Downloaded from
Author manuscripts have been peer reviewed and accepted for publication but have not yet been edited. Author Manuscript Published OnlineFirst on July 17, 2017; DOI: 10.1158/1535-7163.MCT-17-0141

13
p110 catalytic domains of class I PI3Ks by virtue of its ability to (1) yield an
immunologic phenotype similar to that of mice lacking both p110 isoforms when
administered to WT animals, and (2) significantly reduces tumor burden and prolong
survival in mice that develop PTEN null T-ALL (19). Despite NOTCH1 activation, all
mice had a rapid response to the dual PI3K inhibitor as evidenced by a reduction in
circulating blasts and presence of apoptotic cells 4 days post treatment (detected sub-G0
population after propidium iodide (PI) staining) (Fig. 2A). Administration of DBZ also
reduced disease burden (Fig. 2B) and resulted in a similar prolongation in survival:
median of 27 days for DBZ-treated versus 29 days for CAL-130 treated animals (Fig. 2C,
P = 0.64).
In order to investigate the direct effects of PI3K/AKT and NOTCH1 inhibition on
tumor cell proliferation and survival, we performed in vitro co-culture of primary
leukemic blasts from mice and human T-ALLs using MS5-DL1 stromal cells (19).
Consistent with in vivo results, primary T-ALL cell viability was significantly reduced in
the presence of either CAL-130 or the -secretase inhibitor CompE (Fig. 3A,
Supplementary Fig. S1A and 1B, and Supplementary Table S1) while the viability of
stromal cells was not affected by either compound.
We next evaluated the effects of these inhibitors alone or in combination using
two representative T-ALL cell lines, designated 03007 and 03027, which were derived
from diseased CD2-Lmo2 transgenic animals (23). Consistent with results obtained with
primary tumors, treatment of either cell line with CAL-130, but not the p110 selective
inhibitor IC87114, had a cytostatic effect and induced cell death within 24 hours based on
PI staining (Fig. 3B and Supplementary Fig. S1C). The effects of CompE were similar
on August 11, 2019. © 2017 American Association for Cancer Research. mct.aacrjournals.org Downloaded from
Author manuscripts have been peer reviewed and accepted for publication but have not yet been edited. Author Manuscript Published OnlineFirst on July 17, 2017; DOI: 10.1158/1535-7163.MCT-17-0141

14
albeit delayed (Fig. 3C and Supplementary Fig. S1D). To determine whether the
combination of CAL-130 and CompE would be synergistic in nature, we used a high-
throughput cell viability screen based on cellular ATP detection and the Bliss
independence model to quantify the degree of synergy between the pathways (30).
Excess over Bliss (EoB) was calculated as the difference between the observed effect and
the predicted response; a 5-10% EoB response was considered as weak, 10-20% as
moderate, and over 20% was considered as strong synergism. Results indicate that CAL-
130 (2.5 µM) in combination with CompE did not yield a synergistic effect in either cell
line, suggesting redundancy in the NOTCH1 and PI3K/AKT pathways in Lmo2-driven T-
ALL (Supplementary Fig. S2).
PI3K/ regulate cMYC expression independently of NOTCH1
NOTCH1 directly regulates cMYC expression, which governs an oncogenic program
supporting T-ALL cell growth and survival (7,8). Accordingly, CompE blocked
NOTCH1 activation in Lmo2-driven T-ALL cell lines and also reduce protein levels of
cMYC, albeit at distinct time points (24 hours and 48 hours, respectively) (Fig. 3D and
Supplementary Fig. S1E). In contrast to the delayed effects associated with GSI, dual
inhibition of PI3K/ activity abolished cMYC protein but not transcript expression
within 12 hours of treatment (Fig. 3D and 3E). Importantly, CAL-130 was still able to
inhibit activation of AKT (phosphorylation of Thr308 and Ser473) and its downstream
targets such as glycogen synthase kinase-3 (GSK3), the eukaryotic translation
initiation factor 4E-binding protein 1 (4E-BP1), and the ribosomal protein p70 S6 kinase
(p70 S6K) (19), which play a major role in cell cycle progression and tumor cell
on August 11, 2019. © 2017 American Association for Cancer Research. mct.aacrjournals.org Downloaded from
Author manuscripts have been peer reviewed and accepted for publication but have not yet been edited. Author Manuscript Published OnlineFirst on July 17, 2017; DOI: 10.1158/1535-7163.MCT-17-0141
15
proliferation (Fig. 3F and Supplementary Fig. S1F). Of note, blockade of
PI3Kactivity or GSI abrogated the expression of the anti-apoptotic effectors MCL-1
and phospho-BAD (S136) and lead to upregulation of pro-apoptotic BIM (Supplementary
Fig. S3A and S3B), with > 50% of CAL-130 treated cells becoming apoptotic by 24
hours in contrast to those treated with CompE as determined by flow cytometry (sub-G1)
(Supplementary Figs. S3C-F). In contrast, the majority of effects of CompE were not
observed until 48 hours.
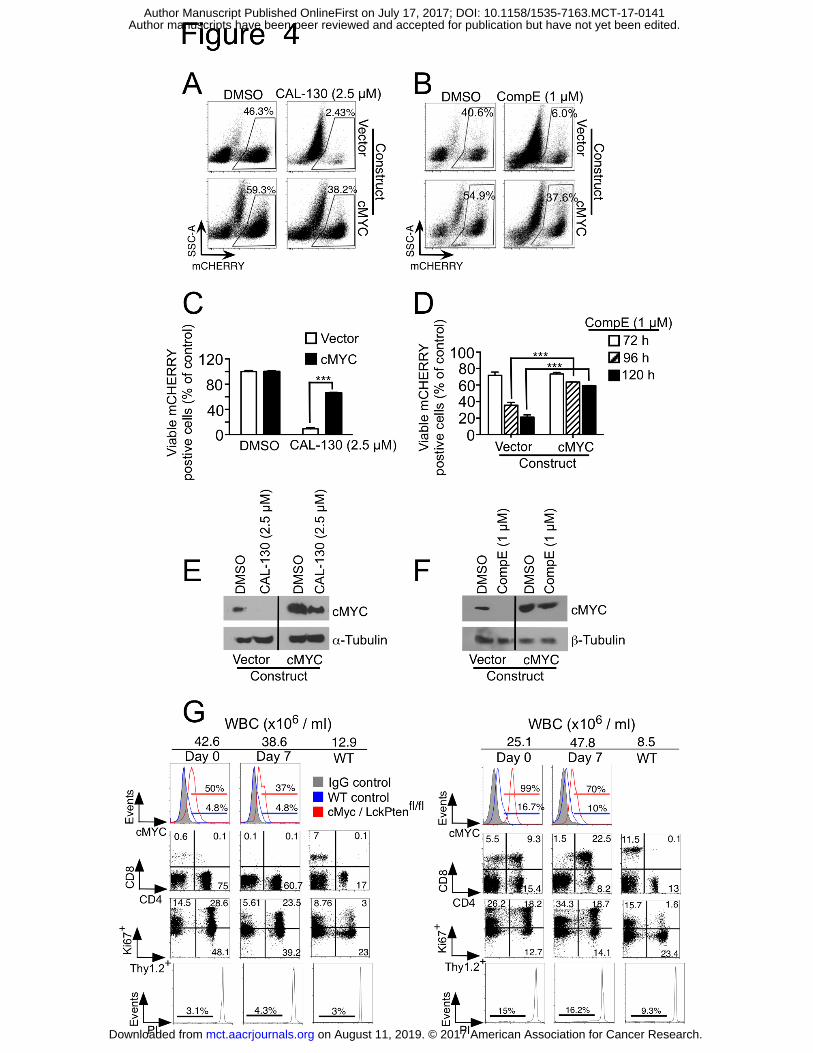
In order to confirm that loss of cMYC protein expression is essential for CAL-130
or CompE-induced tumor cell death, we generated an Lmo2-driven murine T-ALL line
with constitutive cMYC expression. Indeed, over expression of this oncogene permitted
continued tumor cell growth despite incubation with either inhibitor. Moreover, cMYC
protein levels remained constant in contrast to cells expressing vector alone (Fig. 4A-F).
To further demonstrate that down regulation of cMYC is essential for the anti-
tumorigenic effects CAL-130 and that it may exert this effect independent of NOTCH1
activation, we crossed Gt(ROSA)26Sortm13(CAG-MYC, -CD2*)Rsky/J mice that overexpress cMyc
with Lck-cre/Pten(fl/fl) mice that lack Pten. Previously we have shown that T-ALL that
develops in PTEN-null mice is exquisitely sensitive to the dual PI3Kγ/δ inhibition (19).
In contrast, T-ALL with enforced cMYC expression was resistant to CAL-130 treatment
(10 mg/kg every 8 hours for 7 days) and showed continued expansion of circulating
blasts (Ki67+/Thy1.2+ population) and lack of PI-staining (Fig. 4G).
on August 11, 2019. © 2017 American Association for Cancer Research. mct.aacrjournals.org Downloaded from
Author manuscripts have been peer reviewed and accepted for publication but have not yet been edited. Author Manuscript Published OnlineFirst on July 17, 2017; DOI: 10.1158/1535-7163.MCT-17-0141

16
PI3K and NOTCH1 have overlapping gene regulatory networks in Lmo2-driven
T-ALL
To better understand the genetic basis by which PI3K and NOTCH1 regulate tumor
progression in Lmo2-driven T-ALL, we generated gene expression signatures based on
disease phenotype and drug treatment. Global gene expression profiles were obtained in
triplicate from tumor cells cultured in the presence of CAL-130 (2.5 µM), CompE (1 µM),
or DMSO. Drug treated cells were harvested at time points known to affect cMYC
expression (12 hours and 48 hours, respectively). A Venn diagram was created to
illustrate the overlap in genes altered by either PI3K/ blockade (red circle) or GSI
(green circle) using a false discovery rate (FDR) of 0.0005 as cut off (Fig. 5A). Of note,
ten-fold more genes were affected following PI3K/ blockade and included the majority
(~62%) of genes altered by GSI monotherapy, a highly significant finding (Fisher's exact
test, P < 2.2×10⁻¹⁶). Heat maps were also generated from complete linkage hierarchical
cluster analyses of statistically significant changes in gene expression associated with
drug treatment versus vehicle control (Fig. 5B). In the case of PI3K/ blockade, down-
regulated genes also included those involved in cMYC-regulated cellular metabolism
and/or metabolic reprogramming such as the glycine/serine biosynthetic pathway (e.g.
Phgdh, FDR = 6×10⁻⁸; Shmt1, FDR = 8.2×10⁻⁸; Shmt2, FDR = 6.2×10⁻⁸, folate
metabolism (e.g. Mthfd1, FDR = 6.04×10⁻⁸), glycolysis (e.g. Hk-2, FDR = 5.4×10⁻⁸),
nucleotide metabolism (Ak4, FDR = 2.3×10⁻⁸) and mitochondrial proline metabolism and
synthesis (Pycr1, FDR = 3.1×10⁻⁷) (37-41). As expected, gene expression profiling of
CompE-treated cells demonstrated significant downregulation of canonical NOTCH1
target genes including Hes1 (FDR = 1.1×10⁻⁷), Hey1 (FDR = 2.6×10⁻⁸), and Deltex1
on August 11, 2019. © 2017 American Association for Cancer Research. mct.aacrjournals.org Downloaded from
Author manuscripts have been peer reviewed and accepted for publication but have not yet been edited. Author Manuscript Published OnlineFirst on July 17, 2017; DOI: 10.1158/1535-7163.MCT-17-0141

17
(FDR = 4.4×10⁻⁶), as well as modulating the expression of genes involved in glycolysis
(e.g. Slc2a3, FDR = 4.14×10⁻⁶; Hk2, FDR = 1.68×10⁻⁵) and nucleotide metabolism (e.g.
Ak4, FDR=1.66×10⁻³) (42).
We next defined a murine T-ALL disease signature by ranking all genes based on
their differential expression in T-ALL samples compared to wild type murine thymocytes.
To determine the contribution of PI3K/ and NOTCH1 to the overall disease signature,
we performed a gene set enrichment analysis (GSEA) of the 200 most transcriptionally
activated and repressed genes following treatment with either CAL-130 or CompE in
differentially expressed genes. Although both drugs significantly inverted the T-ALL
disease signature, underscoring the importance of these signaling pathways in
maintaining the leukemic phenotype (Fig. 5C), the enrichment was much more
significant with CAL-130 (normalized enrichment score (NES) of -5.8 (P < 0.0001) for
CAL-130 versus NES of -2.6 (P = 0.006) for CompE. To show that treatment of murine
cells is highly consistent with treatment of human cells, we assessed whether the top 200
most differentially expressed genes following CompE treatment of murine T-ALL cells
were significantly enriched in human-to-mouse mapped genes differentially expressed
following CompE treatment of human cells (Fig. 5D). To accomplish this goal, we
integrated data from seven distinct dataset representing human T-ALL cells treatment
with CompE (7). Analysis confirms that results from drug treatment of Lmo2-driven
murine T-ALL are relevant to human T-ALL.
Previously, we have shown the existence of Master Regulator (MR) proteins
responsible for causally (i.e., physically) regulating the transcriptional state of a cancer
on August 11, 2019. © 2017 American Association for Cancer Research. mct.aacrjournals.org Downloaded from
Author manuscripts have been peer reviewed and accepted for publication but have not yet been edited. Author Manuscript Published OnlineFirst on July 17, 2017; DOI: 10.1158/1535-7163.MCT-17-0141

18
cell (43). As such, their activated and repressed targets are highly enriched in genes that
are over- and under-expressed in tumor cells, respectively, and can thus be efficiently
identified by analyzing a regulatory network that represents the transcriptional targets of
every protein using the VIPER (Virtual Proteomics by Enriched Regulon) algorithm (44).
VIPER is an extension of the Master Regulator Inference algorithm (MARINa) (45),
which supports analysis of MR proteins on an individual sample basis. Such an analysis
has helped elucidate novel mechanisms of tumorigenesis, progression, and drug
sensitivity in glioma, leukemia, lymphoma, prostate and breast cancer, among others. As
MR protein activity efficiently recapitulates overall tumor state and drug response, we
first identified key T-ALL-specific MR proteins and then assessed whether compound
treatment could effectively reverse their activity. MR proteins were inferred by VIPER
analysis of a previously assembled, genome-wide T-ALL-specific regulatory network
(interactome) using a signature of a Lmo2-driven murine T-ALL cell line (7) compared to
wild type murine thymocytes. This interactome was previously used to successfully
elucidate the Mechanism of Action (MoA) of small molecule compounds targeting
human T-ALL pathways (7). The ViPER algorithm was then used to compute the activity
of each of the top 40 T-ALL MR proteins following drug perturbation. This was
accomplished by computing the enrichment of their regulons (i.e., the set of their
transcriptional targets), as represented in the interactome, in genes differentially
expressed following drug treatment (drug signature). Although the gene signatures for the
two drugs overlapped significantly (P < 6 x 10-13, Fisher exact test), ~3-fold more T-ALL
MRs were reverted by CAL-130 compared to GSI CompE (Fig. 5E and Supplementary
Table S2; NES < -1.96 and P < 0.05). Of note, Lyl1, Tal1 and Hhex were not affected by
on August 11, 2019. © 2017 American Association for Cancer Research. mct.aacrjournals.org Downloaded from
Author manuscripts have been peer reviewed and accepted for publication but have not yet been edited. Author Manuscript Published OnlineFirst on July 17, 2017; DOI: 10.1158/1535-7163.MCT-17-0141

19
CAL-130 according to our analysis. We also performed GSEA of ~4,500 annotated gene
sets collected from Molecular Signatures Database (MSigDB) on the CAL-130 and
CompE induced gene signatures to study the perturbed pathways (46). Although CAL-
130 altered many of the same genes as compared to CompE, it had stronger effects on
pathways regulated by PML (originally identified as a tumor suppressor in acute
promyelocytic leukaemia) (NES 2.57 and P < 0.01 vs. NES 0.82 and P = 0.41), EDF1
(NES -3.58 and P < 0.005 vs. NES -0.53 and P = 0.6) and IRF9 (NES 3.18 and P < 0.005
vs. NES 0.07 and P = 0.944). Thus, CAL-130 treatment recapitulated majority of
mechanism of action of CompE, while reversing the activity of a large number of
additional master regulators and pathways associated with the T-ALL tumor cell state.
To access drug effects on cMYC activity, we analyzed published microarrays of
human T-ALL (47) and used GSEA to compute the enrichment of cMYC-regulated genes
differentially expressed following CAL-130 or CompE treatment (Fig. 5F and
Supplementary Table S3). Although genes regulated by cMYC were observed in both
drug treatment signatures (P < 10-3), CAL-130 treatment had a greater effect in terms of
reversing the global expression of cMYC targets (NES of -6.23), compared to CompE
(NES of -5.10). Of note, ~74% of genes regulated by cMYC were in the top 1,000 genes
in the CAL-130 treated gene expression signature as compared to ~42% in the CompE
treated gene signature (Supplementary Table S3).
PI3Kγ/δ and NOTCH1 differentially modulate metabolic and mitochondrial
pathways in leukemic cells
on August 11, 2019. © 2017 American Association for Cancer Research. mct.aacrjournals.org Downloaded from
Author manuscripts have been peer reviewed and accepted for publication but have not yet been edited. Author Manuscript Published OnlineFirst on July 17, 2017; DOI: 10.1158/1535-7163.MCT-17-0141
20
To better assess the functional categories represented by the set of genes altered in
response to the inhibitors, we performed pathway analysis using DAVID (48). A highly
conservative threshold (P < 1x10⁻⁵) was used to identify the top down-regulated genes in
CAL-130 or CompE treated Lmo2-driven T-ALL cells. In the case of PI3K blockade,
there was a significant enrichment in functional categories related to cellular metabolism
and most interestingly, pathways that regulate mitochondrial activity (Fig. 6A and 6B).
CompE treatment not only altered similar metabolic pathways including those related to
carbohydrate, nucleotide, pyruvate and TCA (Fig. 6C and Supplementary Fig. S4A and
S4B), but also reduce glucose uptake in T-ALL tumor cells as observed for CAL-130
(Fig. 6D and Supplementary Fig. S5A); it did not, however, appear to affect genes that
directly regulate mitochondrial function (7, 42, 49).
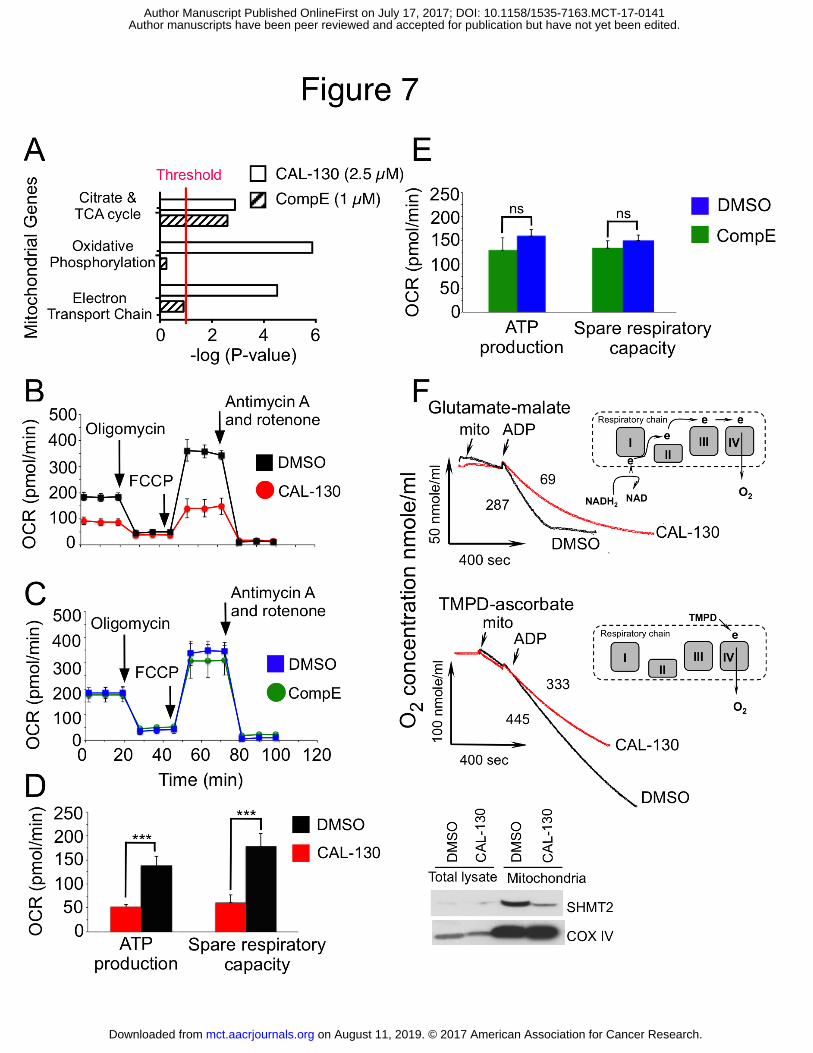
As aforementioned, blockade of PI3Kγ/δ activity preferentially altered genes that
affect mitochondrial activity, such as those involved in the electron transport chain and
oxidative phosphorylation (Fig. 7A and Supplementary Fig. S4C). Consistent with this
observation, CAL-130 but not CompE significantly reduced in situ oxygen consumption
rates (OCRs), ATP levels and spare respiratory capacity, the latter indicating that
PI3Kγ/δ inhibition limits the ability of tumor cell lines and primary tumor cells to
respond to stress or metabolic challenge (Fig. 7B-E and Supplementary Fig. S5B-H).
Further evidence to support these observations was provided by directly studying
mitochondria isolated from CAL-130 treated tumor cells. Indeed, a robust inhibition of
resting and phosphorylating respirations rates in purified mitochondria were observed
suggesting that the alterations in genes encoding the respiratory chain complexes I (e.g.
Ndufa12), II (e.g. Sdhb), and III (e.g. Cyc1) were functionally significant (Fig. 6B and
on August 11, 2019. © 2017 American Association for Cancer Research. mct.aacrjournals.org Downloaded from
Author manuscripts have been peer reviewed and accepted for publication but have not yet been edited. Author Manuscript Published OnlineFirst on July 17, 2017; DOI: 10.1158/1535-7163.MCT-17-0141
21
7F). Our experiments also suggested dysregulation of complex IV as evidenced by the
marked depression of mitochondrial respiration with TMPD-ascorbate as substrate (50).
Of note, CAL-130 treatment affected the expression of mitochondrial protein serine
hydroxymethyl transferase (SHMT2; Figure 7F, insert). SHMT2 is a key enzyme in the
serine / glycine synthesis pathway that plays a critical role in the metabolic
reprogramming in cancer and is a transcriptional target of cMYC (51). Thus, PI3Kγ/δ
inhibition not only affects major metabolic pathways that support tumor homeostasis but
also affects the bioenergetics of T-ALL cells.
on August 11, 2019. © 2017 American Association for Cancer Research. mct.aacrjournals.org Downloaded from
Author manuscripts have been peer reviewed and accepted for publication but have not yet been edited. Author Manuscript Published OnlineFirst on July 17, 2017; DOI: 10.1158/1535-7163.MCT-17-0141

22
Discussion
Cumulative evidence indicates that the PI3K/AKT and NOTCH1 pathways not only
contribute to the malignant transformation of T cell progenitors but also play a major role
in regulating the growth, metabolism, and survival of T-ALL. Here, we explored the
interdependence of these oncogenic pathways in promoting tumor cell maintenance,
which has profound implications for the development of a rational therapeutic strategy to
treat this aggressive hematologic malignancy. It is for this reason that we chose the
Lmo2-driven transgenic mouse model of T-ALL that is characterized by the spontaneous
accumulation of several oncogenic mutations in T cell precursors, resulting in the co-
activation of PI3K/AKT and NOTCH pathways. In the context of this model, we now
provide evidence that (1) although there is no preferential addiction of tumor cells to
either pathway, PI3K blockade appears to exert a more rapid and potent effect on
tumor cells than GSI, and (2) there is a lack of synergy between PI3K/AKT and
NOTCH1 in supporting tumor cell proliferation and survival.
Previous studies have demonstrated that NOTCH1 can indirectly impact on the
activity of the PI3K/AKT pathway by controlling a transcriptional network that regulates
PTEN expression in leukemic T cells (15). Indeed, this mechanism is believed to be
responsible for bypassing the requirement for aberrant NOTCH1 signaling that normally
supports tumor cell growth and metabolism. In contrast, our studies indicate that
NOTCH1 does not regulate PI3K activity or PTEN expression, suggesting that these
pathways can function independently of one another. This is exemplified by the lack of
correlation between activation status of either pathway and the ability of primary mouse
on August 11, 2019. © 2017 American Association for Cancer Research. mct.aacrjournals.org Downloaded from
Author manuscripts have been peer reviewed and accepted for publication but have not yet been edited. Author Manuscript Published OnlineFirst on July 17, 2017; DOI: 10.1158/1535-7163.MCT-17-0141

23
or human T-ALL cells to respond to treatment with CompE or CAL-130. That said, they
do appear to control similar oncogenic networks that are indispensible for tumor cell
maintenance. Results indicate a genetic underpinning for these observations as evidenced
by the considerable overlap in genes regulated by both signaling pathways, including
cMYC. The latter was confirmed by the ability of constitutively expressed cMYC to
reverse the effects of either inhibitor. Collectively, these data demonstrate that PI3K
can support a NOTCH1-independent pathway of cMYC activation in T-ALL, which may
account for similar reduction in cell growth and survival but lack of synergistic effect
observed in response to CAL-130 and/or CompE (52).
Why then does PI3K/blockade appear to exert a more rapid and potent anti-
leukemic effect than inhibition of NOTCH1 by GSI? Gene expression profiling and
pathway analysis based on DNA microarrays of drug treated Lmo2-driven T-ALL
provided possible answers. On a global scale, CAL-130 treatment had a greater effect on
altering the disease signature compared to CompE, as demonstrated by the reversal of top
master regulators (e.g. HNRNPAB, Tp53, PA2G4, ASH2L and SNAPC5) and affects on
pathways (e.g. PML, EDF1, and IRF9) associated with the CD2-Lmo2 T-ALL tumor cell
state. This was consistent with the ability of CAL-130 to down regulate a 10-fold greater
number of genes at an early time point. Interestingly, the majority of altered genes are
known to support cellular metabolism and/or the metabolic reprogramming implicated in
tumor progression, including those involved in serine/glycine metabolism, polyamine
synthesis, and glycolysis. Indeed, the ability of cancer cells to alter their metabolism is
essential to support the increased energy demands associated with rapid tumor growth.
Germane to this study is the ability of the PI3K/AKT pathway to act as a master regulator
on August 11, 2019. © 2017 American Association for Cancer Research. mct.aacrjournals.org Downloaded from
Author manuscripts have been peer reviewed and accepted for publication but have not yet been edited. Author Manuscript Published OnlineFirst on July 17, 2017; DOI: 10.1158/1535-7163.MCT-17-0141
24
of aerobic glycolysis and cellular biosynthesis that critically relies on mitochondrial
bioenergetics (53, 54). In fact, the shift from oxidative to more glycolytic metabolism is
one of the most common changes found in tumor cells. Although our results clearly
demonstrated that PI3Kγ/δ blockade or GSI significantly reduce glucose uptake in
leukemic cells, only the former was able to rapidly alter mitochondrial function. Indeed,
we noted that genes encoding proteins involved in oxidative phosphorylation were
uniquely susceptible to CAL-130, including those essential for the mitochondrial
respiratory chain complex formation (FDR < 0.005). Consistent with this observation was
the robust inhibition of mitochondrial resting and phosphorylating respirations rates. This
finding is of particular interest as enhancement in the bioenergetics properties of tumor
cells is thought to be a prerequisite for survival.
Overall, our results suggest the existence of a regulatory circuit linking NOTCH1
and PI3K/AKT signaling, with cMYC serving as a crucial node of convergence that
intertwines but does preferentially support the activity of either pathway. Moreover, we
provide new insights into the mechanism(s) by which the combined activities of PI3K
contribute to the maintenance of T-ALL and how pharmacological blockade of these two
isoforms exerts a more rapid and pronounced effect on tumor cell proliferation than GSI,
yet can yield similar rates of survival of diseased animals. This involves regulating
transcriptional pathways and genes typically associated with NOTCH1, as well as distinct
metabolic and bioenergetic pathways essential for tumor progression and survival. These
results provide a rationale for the combined targeting of p110 and p110 catalytic
domains of class I PI3Ks in T-ALL where NOTCH and/or PI3K/AKT pathways are
dysregulated.
on August 11, 2019. © 2017 American Association for Cancer Research. mct.aacrjournals.org Downloaded from
Author manuscripts have been peer reviewed and accepted for publication but have not yet been edited. Author Manuscript Published OnlineFirst on July 17, 2017; DOI: 10.1158/1535-7163.MCT-17-0141

25
Acknowledgements
We thank Juan Carlos Zuniga-Pflucker for providing the MS5-DL1 cells, Andrew
Nicholson, Anastasiya Egorova, and Anna Binyamin for genotyping and animal
husbandry, and St. Jude Children’s Research Hospital for providing primary T-ALL cells
from patients.
on August 11, 2019. © 2017 American Association for Cancer Research. mct.aacrjournals.org Downloaded from
Author manuscripts have been peer reviewed and accepted for publication but have not yet been edited. Author Manuscript Published OnlineFirst on July 17, 2017; DOI: 10.1158/1535-7163.MCT-17-0141

26
References
1. Pui CH, Evans WE. Treatment of acute lymphoblastic leukemia. N Engl J Med 2006;
354:166-78.
2. Teitell MA, Pandolfi PP. Molecular genetics of acute lymphoblastic leukemia. Annu
Rev Pathol 2009;4:175-98.
3. Van Vlierberghe P, Ferrando A. The molecular basis of T cell acute lymphoblastic
leukemia. J Clin Invest 2012;122:3398-406.
4. Grabher C, von Boehmer H, Look AT. Notch 1 activation in the molecular
pathogenesis of T-cell acute lymphoblastic leukaemia. Nat Rev Cancer 2006;6:347-59.
5. Aster JC, Pear WS, Blacklow SC. Notch signaling in leukemia. Annu Rev Pathol
2008;3:587-613.
6. Weng AP, Ferrando AA, Lee W, Morris JP, Silverman LB, Sanchez-Irizarry C, et al.
Activating mutations of NOTCH1 in human T cell acute lymphoblastic leukemia.
Science 2004;306:269-71.
7. Palomero T, Lim WK, Odom DT, Sulis ML, Real PJ, Margolin A, et al. NOTCH1
directly regulates c-MYC and activates a feed-forward-loop transcriptional network
promoting leukemic cell growth. Proc Natl Acad Sci U S A 2006;103:18261-6.
on August 11, 2019. © 2017 American Association for Cancer Research. mct.aacrjournals.org Downloaded from
Author manuscripts have been peer reviewed and accepted for publication but have not yet been edited. Author Manuscript Published OnlineFirst on July 17, 2017; DOI: 10.1158/1535-7163.MCT-17-0141
27
8. Weng AP, Millholland JM, Yashiro-Ohtani Y, Arcangeli ML, Lau A, Wai C, et al. c-
Myc is an important direct target of Notch1 in T-cell acute lymphoblastic
leukemia/lymphoma. Genes Dev 2006;20:2096-109.
9. Dang CV. MYC on the path to cancer. Cell 2012;149:22-35.
10. Meyer N, Penn LZ. Reflecting on 25 years with MYC Nat Rev Cancer 2008;8:976-90.
11. Blackburn JS, Liu S, Wilder JL, Dobrinski KP, Lobbardi R, Moore FE, et al. Clonal
evolution enhances leukemia-propagating cell frequency in T cell acute lymphoblastic
leukemia through Akt/mTORC1 pathway activation. Cancer Cell 2014; 25: 366-78.
12. Jotta PY, Ganazza MA, Silva A, Viana MB, da Silva MJ, Zambaldi LJ, et al.
Negative prognostic impact of PTEN mutation in pediatric T-cell acute lymphoblastic
leukemia. Leukemia 2010;24:239-42.
13. Trinquand A, Tanguy-Schmidt A, Ben Abdelali R, Lambert J, Beldjord K, Lengline E,
et al. Toward a NOTCH1/FBXW7/RAS/PTEN-based oncogenetic risk classification of
adult T-cell acute lymphoblastic leukemia: a Group for Research in Adult Acute
Lymphoblastic Leukemia study. J Clin Oncol 2013;31:4333-42.
on August 11, 2019. © 2017 American Association for Cancer Research. mct.aacrjournals.org Downloaded from
Author manuscripts have been peer reviewed and accepted for publication but have not yet been edited. Author Manuscript Published OnlineFirst on July 17, 2017; DOI: 10.1158/1535-7163.MCT-17-0141
28
14. Silva A, Yunes JA, Cardoso BA, Martins LR, Jotta PY, Abecasis M, et al. PTEN
posttranslational inactivation and hyperactivation of the PI3K/Akt pathway sustain
primary T cell leukemia viability. J Clin Invest 2008;118:3762-74.
15. Palomero T, Sulis ML, Cortina M, Real PJ, Barnes K, Ciofani M, et al. Mutational
loss of PTEN induces resistance to NOTCH1 inhibition in T-cell leukemia. Nat Med
2007;13:1203-10.
16. Cullion K, Draheim KM, Hermance N, Tammam J, Sharma VM, Ware C, et al.
Targeting the Notch1 and mTOR pathways in a mouse T-ALL model. Blood 2009;
113:6172-81.
17. Medyouf H, Gao X, Armstrong F, Gusscott S, Liu Q, Gedman AL, et al. Acute T-cell
leukemias remain dependent on Notch signaling despite PTEN and INK4A/ARF loss.
Blood 2010;115:1175-84.
18. Swat W, Montgrain V, Doggett TA, Douangpanya J, Puri K, Vermi W, et al.
Essential role of PI3Kdelta and PI3Kgamma in thymocyte survival. Blood
2006;107:2415-22.
19. Subramaniam PS, Whye DW, Efimenko E, Chen J, Tosello V, De Keersmaecker K,
et al. Targeting nonclassical oncogenes for therapy in T-ALL. Cancer Cell 2012;21:459-
72.
on August 11, 2019. © 2017 American Association for Cancer Research. mct.aacrjournals.org Downloaded from
Author manuscripts have been peer reviewed and accepted for publication but have not yet been edited. Author Manuscript Published OnlineFirst on July 17, 2017; DOI: 10.1158/1535-7163.MCT-17-0141
29
20. Deangelo DJ, Stone RM, Silverman LB, Stock W, Attar EC, Fearen I, et al. A phase I
clinical trial of the notch inhibitor MK-0752 in patients with T-cell acute lymphoblastic
leukemia/lymphoma (T-ALL) and other leukemias. J Clin Oncol. 2006;24(18S):6585.
21. Papayannidis C, DeAngelo DJ ,Stock W, Huang B, Shaik MN, Cesari R et al. A
Phase 1 study of the novel gamma-secretase inhibitor PF-03084014 in patients with T-
cell acute lymphoblastic leukemia and T-cell lymphoblastic lymphoma. Blood Cancer
Journal. 2015;5:e350.
22. Cleveland SM, Smith S, Tripathi R, Mathias EM, Goodings C, Elliott N, et al. Lmo2
induces hematopoietic stem cell-like features in T-cell progenitor cells prior to leukemia.
Stem Cells 2013;31:882-94.
23. Cleveland SM, Goodings C, Tripathi RM, Elliott N, Thompson MA, Guo Y, et al.
LMO2 induces T-cell leukemia with epigenetic deregulation of CD4. Exp Hematol 2014;
42:581-93 e5.
24. McCormack MP, Young LF, Vasudevan S, de Graaf CA, Codrington R, Rabbitts TH,
et al. The Lmo2 oncogene initiates leukemia in mice by inducing thymocyte self-renewal.
Science 2010;327:879-83.
on August 11, 2019. © 2017 American Association for Cancer Research. mct.aacrjournals.org Downloaded from
Author manuscripts have been peer reviewed and accepted for publication but have not yet been edited. Author Manuscript Published OnlineFirst on July 17, 2017; DOI: 10.1158/1535-7163.MCT-17-0141

30
25. Calado DP, Sasaki Y, Godinho SA, Pellerin A, Kochert K, Sleckman BP, et al. The
cell-cycle regulator c-Myc is essential for the formation and maintenance of germinal
centers. Nat Immunol 2012;13:1092-100.
26. Milano J, McKay J, Dagenais C, Foster-Brown L, Pognan F, Gadient R, et al.
Modulation of notch processing by gamma-secretase inhibitors causes intestinal goblet
cell metaplasia and induction of genes known to specify gut secretory lineage
differentiation. Toxicol Sci. 2004; 82:341-58.
27. Real PJ, Tosello V, Palomero T, Castillo M, Hernando E, de Stanchina E, et al.
Gamma-secretase inhibitors reverse glucocorticoid resistance in T cell acute
lymphoblastic leukemia. Nat Med 2009;15:50-8.
28. Lee J, Sadelain M, Brentjens R. Retroviral transduction of murine primary T
lymphocytes. Methods Mol Biol 2009;506:83-96.
29. Doerfler P, Shearman MS, Perlmutter RM. Presenilin-dependent gamma-secretase
activity modulates thymocyte development. Proc Natl Acad Sci U S A. 2001;98:9312-7.
30. Borisy AA, Elliott PJ, Hurst NW, Lee MS, Lehar J, Price ER, et al. Systematic
discovery of multicomponent therapeutics. Proc Natl Acad Sci U S A 2003;100:7977-82.
on August 11, 2019. © 2017 American Association for Cancer Research. mct.aacrjournals.org Downloaded from
Author manuscripts have been peer reviewed and accepted for publication but have not yet been edited. Author Manuscript Published OnlineFirst on July 17, 2017; DOI: 10.1158/1535-7163.MCT-17-0141

31
31. Sadhu C, Masinovsky B, Dick K, Sowell CG, Staunton DE. Essential role of
phosphoinositide 3-kinase delta in neutrophil directional movement. J Immunol.
2003;170:2647-54.
32. Niatsetskaya ZV, Sosunov SA, Matsiukevich D, et al. The oxygen free radicals
originating from mitochondrial complex I contribute to oxidative brain injury following
hypoxia-ischemia in neonatal mice. J Neurosci 2012;32:3235-44
33. Brand MD, Nicholls DG. Assessing mitochondrial dysfunction in cells. Biochem J
2011;435:297-312.
34. Irizarry RA, Bolstad BM, Collin F, Cope LM, Hobbs B, Speed TP. Summaries of
Affymetrix GeneChip probe level data. Nucleic Acids Res 2003;31:e15.
35. Smyth GK. Linear models and empirical bayes methods for assessing differential
expression in microarray experiments. Stat Appl Genet Mol Biol 2004;3:Article3.
36. Benjamini Y, Hochberg Y. Controlling the False Discovery Rate - a Practical and
Powerful Approach to Multiple Testing. Journal of the Royal Statistical Society Series B-
Methodological 1995;57:289-300.
37. Cheong H, Lu C, Lindsten T, Thompson CB. Therapeutic targets in cancer cell
metabolism and autophagy. Nat Biotechnol 2012;30:671-8.
on August 11, 2019. © 2017 American Association for Cancer Research. mct.aacrjournals.org Downloaded from
Author manuscripts have been peer reviewed and accepted for publication but have not yet been edited. Author Manuscript Published OnlineFirst on July 17, 2017; DOI: 10.1158/1535-7163.MCT-17-0141
32
38. Lanning NJ, Looyenga BD, Kauffman AL, Niemi NM, Sudderth J, DeBerardinis RJ,
et al. A mitochondrial RNAi screen defines cellular bioenergetic determinants and
identifies an adenylate kinase as a key regulator of ATP levels. Cell Rep 2014;7:907-17.
39. Liu W, Le A, Hancock C, Lane AN, Dang CV, Fan TW, et al. Reprogramming of
proline and glutamine metabolism contributes to the proliferative and metabolic
responses regulated by oncogenic transcription factor c-MYC. Proc Natl Acad Sci U S A
2012;109:8983-8.
40. Locasale JW. Serine, glycine and one-carbon units: cancer metabolism in full circle.
Nat Rev Cancer 2013;13:572-83.
41. Patra KC, Wang Q, Bhaskar PT, Miller L, Wang Z, Wheaton W, et al. Hexokinase 2
is required for tumor initiation and maintenance and its systemic deletion is therapeutic in
mouse models of cancer. Cancer Cell 2013;24:213-28.
42. Herranz D, Ambesi-Impiombato A, Sudderth J, Sanchez-Martin M, Belver L, Tosello
V, et al. Metabolic reprogramming induces resistance to anti-NOTCH1 therapies in T cell
acute lymphoblastic leukemia. Nat Med 2015;21:1182-9.
43. Califano A, Alvarez MJ. The recurrent architecture of tumour initiation, progression
and drug sensitivity. Nat Rev Cancer 2017;17:116-130.
on August 11, 2019. © 2017 American Association for Cancer Research. mct.aacrjournals.org Downloaded from
Author manuscripts have been peer reviewed and accepted for publication but have not yet been edited. Author Manuscript Published OnlineFirst on July 17, 2017; DOI: 10.1158/1535-7163.MCT-17-0141
33
44. Alvarez MJ, Shen Y, Giorgi FM, Lachmann A, Ding BB, Ye BH et al. Functional
characterization of somatic mutations in cancer using network-based inference of protein
activity. Nat Genet 2016;48:838-847.
45. Piovan E, Yu J, Tosello V, Herranz D, Ambesi-Impiombato A, Da Silva AC, et al.
Direct reversal of glucocorticoid resistance by AKT inhibition in acute lymphoblastic
leukemia. Cancer Cell 2013;24:766-76.
46. Subramanian A, Tamayo P, Mootha VK, Mukherjee S, Ebert BL, Gillette MA, et al.
Gene set enrichment analysis:a knowledge-based approach for interpreting genome-wide
expression profiles. Proc Natl Acad Sci U S A. 2005;102:15545-50.
47. Palomero T, Barnes KC, Real PJ, Glade Bender JL, Sulis ML, Murty VV, et al.
CUTLL1, a novel human T-cell lymphoma cell line with t(7;9) rearrangement, aberrant
NOTCH1 activation and high sensitivity to gamma-secretase inhibitors. Leukemia
2006;20:1279-87.
48. Huang da W, Sherman BT, and Lempicki RA. Systematic and integrative analysis of
large gene lists using DAVID bioinformatics resources. Nat Protoc 2009;4:44-57.
49. Ciofani M, Zuniga-Pflucker JC. Notch promotes survival of pre-T cells at the beta-
selection checkpoint by regulating cellular metabolism. Nat Immunol 2005;6:881-8.
on August 11, 2019. © 2017 American Association for Cancer Research. mct.aacrjournals.org Downloaded from
Author manuscripts have been peer reviewed and accepted for publication but have not yet been edited. Author Manuscript Published OnlineFirst on July 17, 2017; DOI: 10.1158/1535-7163.MCT-17-0141

34
50. Salabei JK, Gibb AA, Hill BG. Comprehensive measurement of respiratory activity in
permeabilized cells using extracellular flux analysis. Nat Protoc 2014;9:421-38.
51. Nikiforov M.A. A functional screen for Myc-responsive genes reveals serine
hydroxymethyltransferase, a major source of the one-carbon unit for cell metabolism.
Mol. Cell. Biol. 2002;22:5793–5800
52. Bonnet M, Loosveld M, Montpellier B, Navarro JM, Quilichini B, Picard C, et al.
Posttranscriptional deregulation of MYC via PTEN constitutes a major alternative
pathway of MYC activation in T-cell acute lymphoblastic leukemia. Blood
2011;117:6650-9.
53. DeBerardinis RJ1, Lum JJ, Hatzivassiliou G, Thompson CB. The biology of cancer:
metabolic reprogramming fuels cell growth and proliferation. Cell Metab 2008;7:11-20.
54. Wallace DC. Mitochondria and cancer. Nat Rev Cancer. 2012;12:685-98.
on August 11, 2019. © 2017 American Association for Cancer Research. mct.aacrjournals.org Downloaded from
Author manuscripts have been peer reviewed and accepted for publication but have not yet been edited. Author Manuscript Published OnlineFirst on July 17, 2017; DOI: 10.1158/1535-7163.MCT-17-0141
https://www.ncbi.nlm.nih.gov/pubmed/?term=Salabei%20JK%5BAuthor%5D&cauthor=true&cauthor_uid=24457333

35
Figure legends
Figure 1. PI3K/AKT and NOTCH1 pathways are co-activated in Lmo2 driven T-ALL in
mice. A, Kaplan-Meier survival curves for CD2-Lmo2 transgenic animals. Representative
immunoblots of the primary T-ALL cells from diseased mice showing protein expression
of PTEN and cMYC as well as AKT and NOTCH1 activation state (B), and expression of
p110 catalytic subunits of class I PI3K (C). D, Expression levels of Notch1 and its target
Deltex1 in primary murine tumors compared to wild-type (WT) DN3 thymocytes as
determined by qRT-PCR (n = 7). ***, P < 0.0001; ns = not significant.
Figure 2. Combined PI3K/ blockade or GSI reduces tumor burden and prolongs the
survival of mice with Lmo2-driven T-ALL. A and B, Flow cytometric analysis of disease
status in CD2-Lmo2 transgenic mice immediately before and 4 days and 7 days after
initiating treatment with either the dual PI3K/ inhibitor CAL-130 (A; 10 mg/kg every
8h) or the γ-secretase inhibitor DBZ (B; 10 µmol/kg daily) for 7 days. Tumor response to
drug treatments was confirmed by changes in circulating blasts (Thy1.2+/Ki67+) and
evidence of propidium iodide (PI)-staining. C, Kaplan-Meier survival curves for CD2-
Lmo2 mice with T-ALL treated with either CAL-130 or DBZ for 7 days. The latter only
included animals that received the full course of drug, P = 0.64 (log-rank test).
on August 11, 2019. © 2017 American Association for Cancer Research. mct.aacrjournals.org Downloaded from
Author manuscripts have been peer reviewed and accepted for publication but have not yet been edited. Author Manuscript Published OnlineFirst on July 17, 2017; DOI: 10.1158/1535-7163.MCT-17-0141

36
Figure 3. PI3K/ inhibition promotes tumor cell death irrespective of NOTCH1
activation status. A, Analyses of primary CD2-Lmo2 mouse T-ALL tumor cell viability
in the presence of increasing concentrations of CAL-130 or CompE for 72 h. B-C,
Proliferation and survival analysis of a representative Lmo2-driven T-ALL tumor cell line
(03007) cultured in the presence of increasing concentrations of CAL-130 (B) or CompE
(C) for 72 h. Data represent mean ± SEM (n = 3 in triplicate). Statistical significance was
determined by Student’s t test for drug treated cells relative to control. *, P < 0.01; **, P
< 0.001; ***, P < 0.0001; ns (not-significant). D, Immunoblots of PTEN and cMYC
expression as well as NOTCH1 activation state in a representative CD2-Lmo2 T-ALL
cell line (03007) cultured in the presence of CAL-130 (6, 12, and 24 hours) or CompE
(24 and 48 hours). E, Expression levels of cMyc in the identical tumor cell line after 12 h
of treatment with CAL-130 (2.5 µM) as determined by qRT-PCR (n = 3). F,
Immunoblots depicting AKT and the activation state of its downstream effectors in the
same cell line at the indicated duration of treatments.
Figure 4. Overexpression of cMYC results in resistance to CAL-130 and GSI treatments.
A-D, FACS dot plots (A and B) and viability bar graphs (C and D) of a representative
CD2-Lmo2-driven T-ALL cell line (03007) transfected with mCherry-expressing empty
or WT cMYC vector and treated with CAL-130 (72 hours), CompE (27, 96 and 120
hours) or DMSO control. Data represent mean ± SEM (***, P < 0.0001; n = 3, t test).
cMYC protein expression in the same cells treated with CAL-130 (E) or CompE (F) for
24 and 48 hours, respectively. G, Flow cytometric analysis of disease status in two
representative (n = 5) Gt(ROSA)26Sortm13(CAG-MYC, -CD2*)Rsky/J; Lck-cre/Pten(fl/fl) mice
immediately before and 7 days after initiating treatment with dual PI3Kγ/δ inhibitor
on August 11, 2019. © 2017 American Association for Cancer Research. mct.aacrjournals.org Downloaded from
Author manuscripts have been peer reviewed and accepted for publication but have not yet been edited. Author Manuscript Published OnlineFirst on July 17, 2017; DOI: 10.1158/1535-7163.MCT-17-0141

37
CAL-130 (10 mg/kg every 8h) for 7 days. Tumor drug response was determined by
assessing for changes in circulating blasts (Thy1.2+/Ki67+) and propidium iodide (PI)-
staining.
Figure 5. Blockade of PI3Kγ/δ activity reverses the oncogenic signature of Lmo2-driven
T-ALL. A, Venn diagram comparing the number and overlap of genes altered by PI3Kγ/δ
blockade (red circle) or GSI (green circle) using FDR < 0.0005 as cut off. Gene
expression profiling was performed on triplicate samples of the CD2-Lmo2 T-ALL cell
line (03007) treated with either CAL-130 (2.5µM, 10 hours) or CompE (1µM, 48 hours)
as compared to DMSO control. B, Heat map representation of the top 100 differentially
expressed genes (FDR < 0.00001) between DMSO and CAL-130 or CompE treated
tumor cells. The scale bar shows color-coded differential expression, with red and blue
indicating higher and lower levels of expression, respectively. Red arrows denote cMYC-
regulated genes. C, Enrichment of top 100 activated and repressed genes from Lmo2-
driven T-ALL disease signature (T-ALL versus WT mouse thymocytes) on the CAL-130
(top) and CompE (bottom) activity gene signature. Repressed genes are shown in blue,
and over-expressed genes are shown in red. D, Comparison of GSI treatment signature
for tumor cells (top 200 up and down regulated genes) on the consensus GSI
perturbational signature obtained from the expression profiles (GSE5827) of seven
human T-ALL cell lines treated with DMSO or CompE. E, Enrichment of top 40
activated and repressed T-ALL master regulator TFs (as inferred by ViPER based on the
Lmo2-driven T-ALL versus WT murine thymocyte signature) on the CAL-130 (top) and
on August 11, 2019. © 2017 American Association for Cancer Research. mct.aacrjournals.org Downloaded from
Author manuscripts have been peer reviewed and accepted for publication but have not yet been edited. Author Manuscript Published OnlineFirst on July 17, 2017; DOI: 10.1158/1535-7163.MCT-17-0141
38
CompE (bottom) activity signature, respectively. F, Enrichment of cMYC-regulated
genes on the sorted CAL-130 (top) and CompE (bottom) treatment gene signature.
Figure 6. PI3K/ and NOTCH1 regulate metabolic pathways that contribute to the
oncogenic programming of Lmo2-driven T-ALL. A, Functional annotation of top 297
genes down regulated (P < 0.00001) in a CAL-130 (2.5 µM, 10 h) treated CD2-Lmo2 T-
ALL cell line (03007) using DAVID. Pathways with Benjamini Hochberg corrected P <
0.05 are shown. B, Heat map of metabolism-related gene expression profiles after CAL-
130 or vehicle (DMSO) treatment (in triplicate). Colored bar denotes pathways annotated
in A, and red and blue indicate high and low levels of gene expression, respectively. C,
Summary of GSEA performed on the ranked genes according to the ratios of transcripts
from DMSO, CAL-130 (2.5 µM, 10 h) or CompE (1µM, 48 h) treated cells. Six
metabolic gene sets with P < 0.01 and a false discovery rate (FDR) of <0.05 (represents
threshold) were considered significant. D, Inhibition of glucose uptake by PI3Kγ/δ
blockade or NOTCH1 inhibition. Histograms (upper) and mean fluorescence intensity
(MFI, lower) of 2-NBDG incorporation into tumor cells treated with DMSO, CAL-130
(2.5 µM, 14 h) or CompE (1µM, 72 h). Apigenin (100µM, 30 min treatment), an inhibitor
of Glut1 expression, was used as a positive control. Data represent mean ± SEM (**, P <
0.01, ***, P < 0.001 relative to DMSO; n = 3, t test).
on August 11, 2019. © 2017 American Association for Cancer Research. mct.aacrjournals.org Downloaded from
Author manuscripts have been peer reviewed and accepted for publication but have not yet been edited. Author Manuscript Published OnlineFirst on July 17, 2017; DOI: 10.1158/1535-7163.MCT-17-0141

39
Figure 7. PI3K regulate distinct bioenergetic pathways that contribute to the
oncogenic programming of Lmo2-driven T-ALL. A, Summary of mitochondrial GSEA
analysis performed on the ranked genes according to the ratios of transcripts from
DMSO, CAL-130 (2.5 µM, 10 h) or CompE (1µM, 48 h) treated cells. Gene sets with a P
< 0.01 and a false discovery rate (FDR) of < 0.05 (represents threshold) were considered
significant. B and C, Oxygen consumption rates (OCR) in the same cell line treated with
DMSO vs. CAL-130 (2.5µM) for 12 hours (B) or DMSO vs. CompE (1µM) for 48 hours
(C) under basal conditions and in response to the indicated mitochondrial inhibitors.
Changes after oligomycin and FCCP application are indicative for respiration linked to
ATP synthesis and the maximal respiratory capacity, respectively. D and E, ATP
production and spare respiratory capacity in CAL-130 (D) or CompE (E) treated tumor
cells. Data represent mean ± SEM (***, P < 0.0001, n = 3, t test). F, Respiration of
mitochondria isolated from a CD2-Lmo2 T-ALL cell line (03007) following exposure to
CAL-130 (2.5 µM, 12 hours) or DMSO and supported with two different substrates:
complex-I dependent glutamate-malate (upper panel) or complex-IV linked substrate,
TMPD-ascorbate (lower panel). Red and black tracings denote drug and DMSO treated
cells, respectively. The points of initiation of resting, phosphorylating and uncoupled
respirations are indicated (arrows). The values of the phosphorylating respiration rates
(PRR) are provided. Schematic substrate-dependent changes in electron supply for
mitochondrial respiratory chain is presented above each tracing. Insert shows western
blot analysis for the mitochondria expressed SHMT2 protein in treated tumor cells.
on August 11, 2019. © 2017 American Association for Cancer Research. mct.aacrjournals.org Downloaded from
Author manuscripts have been peer reviewed and accepted for publication but have not yet been edited. Author Manuscript Published OnlineFirst on July 17, 2017; DOI: 10.1158/1535-7163.MCT-17-0141

Published OnlineFirst July 17, 2017.Mol Cancer Ther Evgeni Efimenko, Utpal P. Davé, Irina V. Lebedeva, et al. T-cell acute lymphoblastic leukemia disease signature
and NOTCH1 cross-regulate pathways that define theδ/γPI3K
Updated version
10.1158/1535-7163.MCT-17-0141doi:
Access the most recent version of this article at:
Material
Supplementary
http://mct.aacrjournals.org/content/suppl/2017/07/15/1535-7163.MCT-17-0141.DC1
Access the most recent supplemental material at:
Manuscript
Authoredited. Author manuscripts have been peer reviewed and accepted for publication but have not yet been
E-mail alerts related to this article or journal.Sign up to receive free email-alerts
Subscriptions
Reprints and
To order reprints of this article or to subscribe to the journal, contact the AACR Publications
Permissions
Rightslink site. Click on "Request Permissions" which will take you to the Copyright Clearance Center's (CCC)
.http://mct.aacrjournals.org/content/early/2017/08/12/1535-7163.MCT-17-0141To request permission to re-use all or part of this article, use this link
on August 11, 2019. © 2017 American Association for Cancer Research. mct.aacrjournals.org Downloaded from
Author manuscripts have been peer reviewed and accepted for publication but have not yet been edited. Author Manuscript Published OnlineFirst on July 17, 2017; DOI: 10.1158/1535-7163.MCT-17-0141