PI3-kinase signaling contributes to orientation in shallow...
9
3589 Research Article Introduction Chemotaxis is a vital process in a wide variety of organisms, ranging from bacteria to vertebrates (Baggiolini, 1998; Campbell and Butcher, 2000; Crone and Lee, 2002). Chemotaxis is achieved by coupling gradient sensing to basic cell movement. The difference in receptor occupation between each side of the cell leads to an internal polarization. A pseudopod is extended at the side with the highest receptor occupation while at the same time pseudopod formation at all other sides is repressed or existing pseudopodia are retracted, resulting in directional cell migration (Devreotes and Janetopoulos, 2003; Postma et al., 2004a). It has been well documented that local areas of high phosphatidylinositol (3,4,5)-trisphosphate [PtdIns(3,4,5)P 3 ] concentrations [PtdIns(3,4,5)P 3 patches] are associated with increased concentrations of F-actin and pseudopod extension in neutrophils and Dictyostelium cells (Devreotes and Janetopoulos, 2003). PtdIns(3,4,5)P 3 is synthesized by PI3-kinases (PI3Ks) and degraded by 5-phosphatases such as SHIP and synaptojanin or by the 3-phosphatase tumor suppressor PTEN. In Dictyostelium, PtdIns(3,4,5)P 3 is degraded predominantly by PTEN (Iijima et al., 2004). Cells with a deletion of the pten gene show a substantial increase of PtdIns(3,4,5)P 3 levels, and a much broader leading edge both of PtdIns(3,4,5)P 3 patches and protrusions. These very clear data have led to the convincing hypothesis that the local formation of PtdIns(3,4,5)P 3 at the side of the cell closest to the source of chemoattractant provides the directional information for chemotactic movement in Dictyostelium and mammalian cells (Ma et al., 2004; Merlot and Firtel, 2003; Parent et al., 1998). However, several observations suggest that this might not be the complete picture. The PI3K inhibitor LY29004 strongly inhibits cAMP-stimulated PtdIns(3,4,5)P 3 production, but has only minor effects on chemotaxis (Andrew and Insall, 2007; Chen et al., 2003; Funamoto et al., 2002; Loovers et al., 2006; Takeda et al., 2007). Furthermore, deletion of the genes encoding two cAMP-stimulated PI3Ks, which results in the near complete inhibition of detectable PtdIns(3,4,5)P 3 production (Huang et al., 2003), leads to only partial inhibition of chemotaxis in steep gradients (Funamoto et al., 2001; Loovers et al., 2006; Takeda et al., 2007). A study was recently conducted in which all five genes encoding recognizable type-I PI3Ks were disrupted, but cells still exhibited relatively good chemotaxis towards cAMP (Hoeller and Kay, 2007). However, movement of the PI3K mutants was not normal; they were slower and orientated poorly in weak gradients (Hoeller and Kay, 2007; Takeda et al., 2007). These data suggest that PtdIns(3,4,5)P 3 signaling is dispensable for chemotaxis in steep gradients, which leaves us with two important questions: what is/are the other pathway(s) that mediate chemotaxis in pi3k-null cells, and what is the contribution of PtdIns(3,4,5)P 3 to chemotaxis in wild-type cells? Recently, it was demonstrated that PLA2 and soluble guanylyl cyclase (sGC) partake in alternative pathways in Dictyostelium; inhibition of the PI3K, PLA2 or sGC pathway had small partial effects on chemotaxis, whereas simultaneous inhibition of all pathways nearly completely inhibited chemotaxis (Chen et al., 2007; van Haastert et al., 2007; Veltman et al., 2008). Other pathways, such as adenylyl cyclase, TORC2, PLC and Ca 2+ might also play Dictyostelium cells that chemotax towards cAMP produce phosphatidylinositol (3,4,5)-trisphosphate [PtdIns(3,4,5)P 3 ] at the leading edge, which has been implicated in actin reorganization and pseudopod extension. However, in the absence of PtdIns(3,4,5)P 3 signaling, cells will chemotax via alternative pathways. Here we examined the potential contribution of PtdIns(3,4,5)P 3 to chemotaxis of wild-type cells. The results show that steep cAMP gradients (larger than 10% concentration difference across the cell) induce strong PtdIns(3,4,5)P 3 patches at the leading edge, which has little effect on the orientation but strongly enhances the speed of the cell. Using a new sensitive method for PtdIns(3,4,5)P 3 detection that corrects for the volume of cytosol in pixels at the boundary of the cell, we show that, in shallow cAMP gradient (less than 5% concentration difference across the cell), PtdIns(3,4,5)P 3 is still somewhat enriched at the leading edge. Cells lacking PI3-kinase (PI3K) activity exhibit poor chemotaxis in these shallow gradients. Owing to the reduced speed and diminished orientation of the cells in steep and shallow gradients, respectively, cells lacking PtdIns(3,4,5)P 3 signaling require two- to six-fold longer times to reach a point source of chemoattractant compared with wild-type cells. These results show that, although PI3K signaling is dispensable for chemotaxis, it gives the wild type an advantage over mutant cells. Supplementary material available online at http://jcs.biologists.org/cgi/content/full/121/21/3589/DC1 Key words: Dictyostelium, PI3-kinase, Chemotaxis Summary PI3-kinase signaling contributes to orientation in shallow gradients and enhances speed in steep chemoattractant gradients Leonard Bosgraaf, Ineke Keizer-Gunnink and Peter J. M. Van Haastert* Department of Molecular Cell Biology, University of Groningen, Kerklaan 30, 9751NN Haren, The Netherlands *Author for correspondence (e-mail: [email protected]) Accepted 4 August 2008 Journal of Cell Science 121, 3589-3597 Published by The Company of Biologists 2008 doi:10.1242/jcs.031781 Journal of Cell Science
Transcript of PI3-kinase signaling contributes to orientation in shallow...

3589Research Article
IntroductionChemotaxis is a vital process in a wide variety of organisms, rangingfrom bacteria to vertebrates (Baggiolini, 1998; Campbell andButcher, 2000; Crone and Lee, 2002). Chemotaxis is achieved bycoupling gradient sensing to basic cell movement. The differencein receptor occupation between each side of the cell leads to aninternal polarization. A pseudopod is extended at the side with thehighest receptor occupation while at the same time pseudopodformation at all other sides is repressed or existing pseudopodia areretracted, resulting in directional cell migration (Devreotes andJanetopoulos, 2003; Postma et al., 2004a).
It has been well documented that local areas of highphosphatidylinositol (3,4,5)-trisphosphate [PtdIns(3,4,5)P3]concentrations [PtdIns(3,4,5)P3 patches] are associated withincreased concentrations of F-actin and pseudopod extension inneutrophils and Dictyostelium cells (Devreotes and Janetopoulos,2003). PtdIns(3,4,5)P3 is synthesized by PI3-kinases (PI3Ks) anddegraded by 5-phosphatases such as SHIP and synaptojanin or bythe 3-phosphatase tumor suppressor PTEN. In Dictyostelium,PtdIns(3,4,5)P3 is degraded predominantly by PTEN (Iijima et al.,2004). Cells with a deletion of the pten gene show a substantialincrease of PtdIns(3,4,5)P3 levels, and a much broader leading edgeboth of PtdIns(3,4,5)P3 patches and protrusions.
These very clear data have led to the convincing hypothesisthat the local formation of PtdIns(3,4,5)P3 at the side of the cellclosest to the source of chemoattractant provides the directionalinformation for chemotactic movement in Dictyostelium andmammalian cells (Ma et al., 2004; Merlot and Firtel, 2003; Parent
et al., 1998). However, several observations suggest that thismight not be the complete picture. The PI3K inhibitor LY29004strongly inhibits cAMP-stimulated PtdIns(3,4,5)P3 production,but has only minor effects on chemotaxis (Andrew and Insall,2007; Chen et al., 2003; Funamoto et al., 2002; Loovers et al.,2006; Takeda et al., 2007). Furthermore, deletion of the genesencoding two cAMP-stimulated PI3Ks, which results in the nearcomplete inhibition of detectable PtdIns(3,4,5)P3 production(Huang et al., 2003), leads to only partial inhibition of chemotaxisin steep gradients (Funamoto et al., 2001; Loovers et al., 2006;Takeda et al., 2007). A study was recently conducted in whichall five genes encoding recognizable type-I PI3Ks were disrupted,but cells still exhibited relatively good chemotaxis towardscAMP (Hoeller and Kay, 2007). However, movement of the PI3Kmutants was not normal; they were slower and orientated poorlyin weak gradients (Hoeller and Kay, 2007; Takeda et al., 2007).These data suggest that PtdIns(3,4,5)P3 signaling is dispensablefor chemotaxis in steep gradients, which leaves us with twoimportant questions: what is/are the other pathway(s) that mediatechemotaxis in pi3k-null cells, and what is the contribution ofPtdIns(3,4,5)P3 to chemotaxis in wild-type cells? Recently, it wasdemonstrated that PLA2 and soluble guanylyl cyclase (sGC)partake in alternative pathways in Dictyostelium; inhibition ofthe PI3K, PLA2 or sGC pathway had small partial effects onchemotaxis, whereas simultaneous inhibition of all pathwaysnearly completely inhibited chemotaxis (Chen et al., 2007; vanHaastert et al., 2007; Veltman et al., 2008). Other pathways, suchas adenylyl cyclase, TORC2, PLC and Ca2+ might also play
Dictyostelium cells that chemotax towards cAMP producephosphatidylinositol (3,4,5)-trisphosphate [PtdIns(3,4,5)P3] atthe leading edge, which has been implicated in actinreorganization and pseudopod extension. However, in theabsence of PtdIns(3,4,5)P3 signaling, cells will chemotax viaalternative pathways. Here we examined the potentialcontribution of PtdIns(3,4,5)P3 to chemotaxis of wild-type cells.The results show that steep cAMP gradients (larger than 10%concentration difference across the cell) induce strongPtdIns(3,4,5)P3 patches at the leading edge, which has little effecton the orientation but strongly enhances the speed of the cell.Using a new sensitive method for PtdIns(3,4,5)P3 detection thatcorrects for the volume of cytosol in pixels at the boundary ofthe cell, we show that, in shallow cAMP gradient (less than 5%concentration difference across the cell), PtdIns(3,4,5)P3 is still
somewhat enriched at the leading edge. Cells lacking PI3-kinase(PI3K) activity exhibit poor chemotaxis in these shallowgradients. Owing to the reduced speed and diminishedorientation of the cells in steep and shallow gradients,respectively, cells lacking PtdIns(3,4,5)P3 signaling require two-to six-fold longer times to reach a point source ofchemoattractant compared with wild-type cells. These resultsshow that, although PI3K signaling is dispensable forchemotaxis, it gives the wild type an advantage over mutantcells.
Supplementary material available online athttp://jcs.biologists.org/cgi/content/full/121/21/3589/DC1
Key words: Dictyostelium, PI3-kinase, Chemotaxis
Summary
PI3-kinase signaling contributes to orientation inshallow gradients and enhances speed in steepchemoattractant gradientsLeonard Bosgraaf, Ineke Keizer-Gunnink and Peter J. M. Van Haastert*Department of Molecular Cell Biology, University of Groningen, Kerklaan 30, 9751NN Haren, The Netherlands*Author for correspondence (e-mail: [email protected])
Accepted 4 August 2008Journal of Cell Science 121, 3589-3597 Published by The Company of Biologists 2008doi:10.1242/jcs.031781
Jour
nal o
f Cel
l Sci
ence

3590
important roles in chemotaxis (Comer et al., 2005; Lee et al.,2005; Postma et al., 2004b; van Haastert et al., 2007).
We investigated the potential role of PtdIns(3,4,5)P3 in thechemotaxis of wild-type cells. Several observations suggest thatinhibition of PI3K reduces chemotaxis in shallow cAMP gradients,but not in steep gradients (Loovers et al., 2006; Takeda et al., 2007;van Haastert et al., 2007). We have been long confused by thisobservation because, in wild-type cells, strongly labeled patches ofthe PtdIns(3,4,5)P3 detector, PHCRAC-GFP, at the leading edge aredetected in strong cAMP gradients, but not even weak PHCRAC-GFP responses at the leading edge could be detected in shallowcAMP gradients, in which these wild-type cells exhibit excellentchemotaxis (presented here in Fig. 1B). Thus, how could PI3Kmediate chemotaxis in shallow gradients if there is noPtdIns(3,4,5)P3 formation detectable? We developed a novel methodthat discriminates better between PHCRAC-GFP in the cytosol andat the boundary of the cell so that it has approximately tenfold highersensitivity to detect PtdIns(3,4,5)P3 responses then previousmethods. Using this method, we show two types of PHCRAC-GFP–PtdIns(3,4,5)P3 responses: a small PtdIns(3,4,5)P3 responsein shallow cAMP gradients that is proportional to the gradient, and,as reported previously, a strong PtdIns(3,4,5)P3 response in steepcAMP gradients. The PI3K inhibitor LY294002 inhibited bothresponses. Analysis of cell behavior in steep and shallow gradientswith and without PI3K activity revealed that the strongly labeledPtdIns(3,4,5)P3 patches are associated with an approximate twofoldincrease of the cell speed. The presence or absence of thesePtdIns(3,4,5)P3 patches had little effect on the strong chemotacticresponse in steep gradients. In shallow gradients, inhibition ofPtdIns(3,4,5)P3 signaling led to a strong reduction of chemotaxis.Overall, the contribution of PtdIns(3,4,5)P3 signaling todirectionality in shallow gradients and speed in steep gradients leadsto a two- to six-fold faster migration towards a chemoattractant whencompared with cells in which PtdIns(3,4,5)P3 synthesis is blocked.Thus, although the PtdIns(3,4,5)P3 signaling pathway is dispensablefor chemotaxis in steep gradients, it plays an important role inchemotaxis and natural aggregation.
ResultsFormation of PHCRAC-GFP–PtdIns(3,4,5)P3 patches in steepcAMP gradientsIn order to investigate the function of PtdIns(3,4,5)P3 inDictyostelium chemotaxis, we made use of the establishedPtdIns(3,4,5)P3-binding PH domain of CRAC, which was fused toGFP. Consistent with previous reports (Parent et al., 1998), we foundthat when cells were stimulated with a micropipette filled with100μM cAMP, they formed distinct regions towards the pipettethat were highly enriched in PHCRAC-GFP. Throughout thismanuscript, these regions are termed patches. As explained later,we define a patch as a region at the cell boundary with an averageGFP signal that is ≥1.5 times the mean fluorescence of the cytosol,has a minimum size of 2 μm and lasts for at least two consecutiveframes (4-8 seconds/frame). These patches of PHCRAC-GFP wereobserved in about 80% of the cells very close to the pipette (<20μm),but were virtually absent in cells beyond a distance of 100μm (Fig.1A,B). Patch formation in 40% of the cells was observed at adistance of 50μm. At this distance, the cAMP concentration was200 nM and the absolute gradient was 2000 pM/μm (see Materialsand Methods). Cells show a significant chemotactic response(threshold chemotaxis index=0.2) up to 1000 μm from amicropipette with 100 μM cAMP (Fig. 1B). At this distance, the
cAMP concentration was 5 nM and the absolute gradient was 5pM/μm. These findings suggest that PHCRAC-GFP patches areformed only when the gradient of chemoattractant across the cellis above a certain threshold, approximately 1000 pM/μm.
Role of PtdIns(3,4,5)P3 patches in steep gradientsTo deduce the function of PHCRAC-GFP patches in steep gradientswe determined several aspects of chemotaxis and cell movementat a distance of 40-60μm from a pipette filled with 100 μM cAMP.
Journal of Cell Science 121 (21)
Fig. 1. Formation of PHCRAC-GFP patches in steep cAMP gradients. Cellsexpressing PHCRAC-GFP were stimulated with a micropipette filled with 10–4
M cAMP. (A) The confocal image reveals PHCRAC-GFP patch formation at theleading edge of cells close to the pipette, but more uniform cytosoliclocalization of PHCRAC-GFP in cells further away from the pipette. Two cellsare shown at higher magnification. The asterisk indicates the position of thepipette. Scales bars: 50 μm (middle) and 10 μm (left and right). (B) Thefraction of cells containing a PHCRAC-GFP patch at the leading edge and thechemotaxis index were determined at different distances from the pipette.Half-maximal PHCRAC-GFP patch formation occurs at a distance of about50 μm from the pipette, and significant chemotaxis is observed up to 1000 μmfrom the pipette. (C) The chemotaxis index and speed of cells at 40-60 μmfrom the pipette was determined for 35 cells without and 22 cells with aPHCRAC-GFP patch. Values are averages ± s.d.
Jour
nal o
f Cel
l Sci
ence

3591PI3-kinase in chemotaxis
In this region, about 50% of the cells exhibited a PHCRAC-GFP patchat the leading edge, whereas the other cells displayed a cytosolicdistribution of PHCRAC-GFP (Fig. 1A,B). These two groups of cellswere exposed to the same cAMP gradient, and were in dynamicequilibrium because cells without a patch often obtained a patchsomewhat later and vice versa. Quantitative analysis of themovement of the cells revealed that cells with a PHCRAC-GFP patchessentially had the same chemotaxis index as cells without aPHCRAC-GFP patch (Fig. 1C). By strong contrast, cells with aPHCRAC-GFP patch exhibited a nearly twofold higher speed thancells without a PHCRAC-GFP patch (Fig. 1C).
This twofold difference in speed matches our previousobservation that pseudopodia that originate from PHCRAC-GFPpatches are two times larger than pseudopodia that were not initiatedby a patch (Postma et al., 2004b). These findings strongly suggestthat, in steep cAMP gradients, the PHCRAC-GFP patches at theleading edge are responsible for the enhanced speed of the cells,but are not essential for chemotactic orientation. This conclusionis consistent with the observations that, in steep gradients, both pi3k-null cells and wild-type cells treated with the PI3K inhibitorLY294002 had the same chemotaxis index and speed as wild-typecells without PHCRAC-GFP patches (see supplementary materialTable S1).
PI3K and chemotaxis in shallow cAMP gradientsTo investigate the function of PtdIns(3,4,5)P3 signaling in shallowcAMP gradients (below 1000 pM/μm), we performed three assaysto measure the chemotaxis index and speed of control cells andcells with inhibited PI3K production (Fig. 2; supplementary materialTable S1). Because LY294002 might not be completely specificand might inhibit pathways other than that of PI3K, the experimentswere also performed with cells inwhich the pi3k1 and pi3k2 genes havebeen deleted (pi3k-null cells), whichshow a >90% reduction of the cAMP-induced PtdIns(3,4,5)P3 accumulation(Funamoto et al., 2001; Huang et al.,2003). The data are in part identicalto those published (Loovers et al.,2006), and were supplemented withadditional data at other cAMPconcentrations. The first experimentwas performed by placing dropletscontaining cAMP next to dropletscontaining cells on an agar plate,
revealing that inhibition of PI3K activity with LY294002 or bydeletion of two pi3k genes leads to a reduction of chemotacticactivity at low cAMP concentrations, but not at high cAMPconcentrations (Fig. 2A). The second experiment was performedusing a modified Zigmond chamber (Veltman and Van Haastert,2006). We found that, under these conditions, the chemotaxis indexwas not affected by LY294002 when 1000 nM of cAMP was usedin the source chamber, but was strongly inhibited at lower cAMPconcentrations (Fig. 2B). Finally, the chemotaxis index of cellsmoving towards a micropipette filled with 100 μM cAMP wasanalyzed at different distances from the pipette. As shown in Fig.2C, chemotaxis was hardly reduced in pi3k-null cells or byLY294002 in wild-type cells at short (<100 μm) distances, whereasfurther away from the pipette chemotaxis was increasingly inhibited.These findings suggest that, in shallow gradients, the PI3K pathwayplays an important role in chemotaxis, consistent with previousobservations (Loovers et al., 2006; Postma et al., 2004b; Takeda etal., 2007). Activation of the PI3K pathway is most probably requiredfor cAMP production (Loovers et al., 2006): because cAMP relaymay enhance the cAMP gradient far away from the pipette, thereduction of chemotaxis in cells with inhibited PI3K activity couldbe caused by the absence of cAMP relay. However, inhibition ofcAMP relay using 2 mM caffeine has no effect on chemotacticactivity (Brenner and Thoms, 1984) in steep or shallow gradients(P.J.M.V.H., unpublished observations), suggesting that cAMPrelay does not play a crucial role in chemotaxis.
The input signal for chemotaxis is probably a spatial gradient ofcAMP (Mato et al., 1975). Therefore, we expressed the chemotacticindex obtained with these three assays as a function of the spatialgradient, which was calculated according to the equations presentedin the Materials and Methods. Fig. 2D shows that the three assays
Fig. 2. Inhibition of PI3K signaling inhibitschemotaxis in shallow gradients but not insteep gradients. (A) Chemotactic activitywas measured for pi3k-null cells and wild-type cells in the absence and presence of50 μM LY294002 using (A) the small-population assay, (B) a Zigmond chamberor (C) the pipette assay. The cAMPgradients to which the cells are exposedwere calculated using the equationspresented in the Materials and Methods.(D) The chemotaxis index as function of theabsolute gradient is shown. The data are themeans of three experiments involving about20 populations or cells analyzed in eachexperiment.
Jour
nal o
f Cel
l Sci
ence

3592
yielded essentially the same results, with half-maximal chemotaxisat a gradient of 50 pM/μm and threshold chemotaxis (CI=0.2) at~6 pM/μm. Upon addition of LY294002 or by deletion of two genesencoding PI3Ks, the chemotaxis in shallow gradients was inhibitedand the threshold for chemotaxis increased ~tenfold to 60 pM/μm.Furthermore, half-maximal chemotaxis was obtained at 225 pM/μm.In steeper gradients (above 750 pM/μm), the chemotaxis index wasnot affected by LY294002 or deletion of pi3k genes. These data
suggest that PI3K inhibition leads to reduced chemotactic orientationin shallow gradients.
PHCRAC-GFP–PtdIns(3,4,5)P3 localizationThe above mentioned results strongly support a role forPtdIns(3,4,5)P3 signaling in shallow gradients. However, we werenot able to detect clear PHCRAC-GFP patches at the leading edge inshallow cAMP gradients at distances beyond 100 μm from thepipette, i.e. below 500 pM/μm (Fig. 1A). As outlined below, assaysdetecting the redistribution of a GFP marker from the cytosol tothe plasma membrane have a restricted sensitivity (see also Materialsand Methods for more theoretical information). In confocalmicroscopy, fluorescence is typically detected in pixel elements withdimensions of 200�200�1000 nm (in x, y and z direction). A pixelelement at the boundary of the cell will contain cytosol, plasmamembrane and extracellular volume. We calculated that, for aDictyostelium cell, approximately 70% of the pixels are interior andabout 30% are at the boundary of the cell (see Materials andMethods). Assuming that, in unstimulated cells, all PHCRAC-GFPis cytosolic, the boundary pixels will have an average fluorescenceintensity that is half the fluorescence value of the interior pixels.When cAMP induces a significant but small (e.g. 10%) uniformtranslocation of PHCRAC-GFP from the cytosol to the plasmamembrane, this will lead to a decrease of the fluorescence intensityin the cytosol from 100% to 90%. The intensity of the boundarypixels will concurrently increase from 50% of the cytosol value toapproximately 73%, which is still lower than the fluorescenceintensity of the cytosol. Thus, the detection limit of translocationassays of a GFP-tagged protein from cytosol to membrane is poorwhen the increase at the membrane is measured. We used two assaysto detect potential PtdIns(3,4,5)P3 signaling at low cAMPconcentrations. First, we studied depletion of fluorescence in thecytosol after stimulation with uniform cAMP concentrations,because accurate data can be obtained from the cytosol before andafter uniform cAMP stimulation. Second, the increase offluorescence at the boundary in cAMP gradients was measured,using a novel method to correct for the volume of the cytosol ineach boundary pixel.
Dictyostelium cells stimulated with uniform cAMP exhibit atranslocation of PHCRAC-GFP to the membrane at very low cAMPconcentrations (Loovers et al., 2006; Postma et al., 2004b). At 0.3nM cAMP, approximately 45% of the cells showed strong patchesof PHCRAC-GFP at the membrane, whereas no detectable increaseof PHCRAC-GFP was detectable at the membrane of the other 55%of the cells (Fig. 3A).
Using the definition of patches (fluorescence intensity at theboundary at least 1.5-fold above the intensity in the cytosol, sizeabove 2 μm and duration above 8 seconds), we discriminated
Journal of Cell Science 121 (21)
Fig. 3. Depletion of PHCRAC-GFP from the cytosol after uniform stimulationwith very low cAMP concentrations. Cells expressing PHCRAC-GFP werestimulated in a perfusion chamber with the indicated concentration of cAMP.(A) Images before (top) and 14 seconds after (bottom) stimulation with 0.3 nMcAMP, showing one cell with PHCRAC-GFP patches (left) and two cells with amore uniform cytosolic distribution of PHCRAC-GFP (right). Scale bar: 10 μm.(B) Quantification of the decrease of fluorescence intensity of the cytosol aftercAMP stimulation in cells with or without a PHCRAC-GFP patch. The resultsshow the means ± s.d. of 10 to 22 cells per cAMP concentration from twoindependent experiments. (C) Frequency distribution of the number of cellswith different amounts of depletion of fluorescence intensity in the cytosolafter stimulation with 0.1, 0.3 or 1 nM cAMP for cells with or without aPHCRAC-GFP patch.
Jour
nal o
f Cel
l Sci
ence
3593PI3-kinase in chemotaxis
between cells containing a patch and cells that do not. For all 65cells stimulated by 0.1 to 1 nM cAMP, the depletion of PHCRAC-GFP in the cytosol was measured. The probability distribution forall cells is clearly bimodal, with a population of patch-containingcells showing a 33±7% reduction of the fluorescence intensity ofthe cytosol after cAMP stimulation (mean ± s.d., n=29), and apopulation of cells that does not contain a patch but still exhibits12±7% (n=36) reduction of the fluorescence intensity of the cytosol.The fraction of cells containing depletions of around 20% is small,suggesting a biphasic response at increasing cAMP concentrations:at very low cAMP concentrations (<0.1 nM) a dose-dependenttranslocation of some PHCRAC-GFP from the cytosol to plasmamembrane occurs up to about 12% depletion in the cytosol; higher
cAMP concentrations (>0.1 nM) lead to the enhanced depletion of30% that is associated with the visible strong PHCRAC-GFP patchesat the membrane. We conclude that very low uniform cAMPconcentrations can induce a significant PtdIns(3,4,5)P3 response.
To increase the sensitivity of the assay for translocation ofPHCRAC-GFP to the membrane of cells in a cAMP gradient, wecoexpressed PHCRAC-GFP and the cytosol marker monomeric redfluorescent protein MARS (RFP), and simultaneously obtainedconfocal fluorescent images of both markers (Fischer et al., 2004).The fluorescence intensity of RFP provides information on thecytosolic volume of boundary pixels, which can then be used tocalculate the membrane component of the PHCRAC-GFP signal. Forthese calculations we first normalized the RFP signal to the average
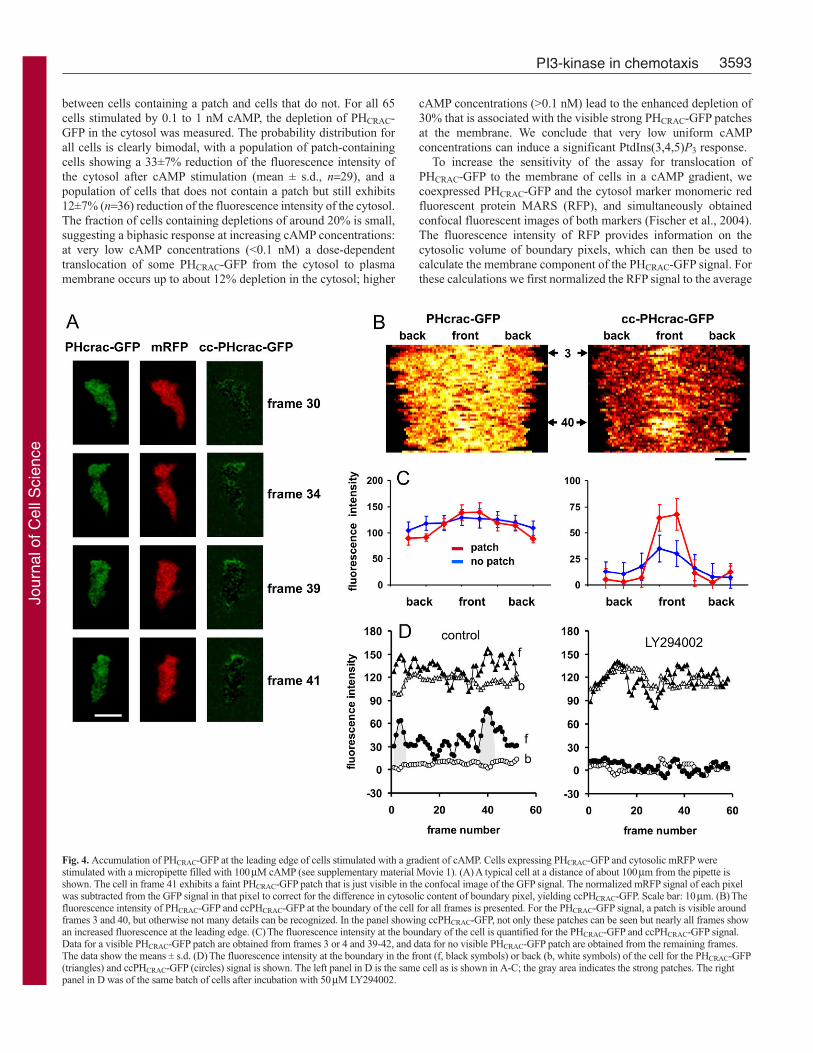
Fig. 4. Accumulation of PHCRAC-GFP at the leading edge of cells stimulated with a gradient of cAMP. Cells expressing PHCRAC-GFP and cytosolic mRFP werestimulated with a micropipette filled with 100μM cAMP (see supplementary material Movie 1). (A) A typical cell at a distance of about 100μm from the pipette isshown. The cell in frame 41 exhibits a faint PHCRAC-GFP patch that is just visible in the confocal image of the GFP signal. The normalized mRFP signal of each pixelwas subtracted from the GFP signal in that pixel to correct for the difference in cytosolic content of boundary pixel, yielding ccPHCRAC-GFP. Scale bar: 10μm. (B) Thefluorescence intensity of PHCRAC-GFP and ccPHCRAC-GFP at the boundary of the cell for all frames is presented. For the PHCRAC-GFP signal, a patch is visible aroundframes 3 and 40, but otherwise not many details can be recognized. In the panel showing ccPHCRAC-GFP, not only these patches can be seen but nearly all frames showan increased fluorescence at the leading edge. (C) The fluorescence intensity at the boundary of the cell is quantified for the PHCRAC-GFP and ccPHCRAC-GFP signal.Data for a visible PHCRAC-GFP patch are obtained from frames 3 or 4 and 39-42, and data for no visible PHCRAC-GFP patch are obtained from the remaining frames.The data show the means ± s.d. (D) The fluorescence intensity at the boundary in the front (f, black symbols) or back (b, white symbols) of the cell for the PHCRAC-GFP(triangles) and ccPHCRAC-GFP (circles) signal is shown. The left panel in D is the same cell as is shown in A-C; the gray area indicates the strong patches. The rightpanel in D was of the same batch of cells after incubation with 50μM LY294002.
Jour
nal o
f Cel
l Sci
ence

3594
GFP signal in that cell to correct for differences in expression levelsbetween PHCRAC-GFP and RFP. Then we subtracted the normalizedRFP signal from the GFP signal in each pixel element, yieldingcytosol-corrected PHCRAC-GFP (ccPHCRAC-GFP; see Materials andMethods for details). Images of the original PHCRAC-GFP andccPHCRAC-GFP are presented in Fig. 4A for a cell that has a faintPHCRAC-GFP patch at the membrane at around frame 3 and aroundframe 40; this cell is at a distance of about 100 μm from the pipette.In Fig. 4B, the fluorescence intensity in the boundary pixels ispresented in space-time plots, whereas spatial data for frames withand without patches are presented in Fig. 4C, and temporal datafor the front and back of the cell are shown in Fig. 4D. In the space-time plot of the PHCRAC-GFP signal (Fig. 4B, left), the patches arejust visible, but otherwise not much detail can be observed. Aftercorrection for the cytosol in boundary pixels, the ccPHCRAC-GFPsignal provides more details, with elevated fluorescence in the frontregion of the frames lacking obvious patches (Fig. 4B, right). Thequantitative data reveal that the boundary PHCRAC-GFP signal inthe patch at the leading edge is about 139±12, compared with 95±12at the side or back of the cell (all mean ± s.d.; n=4). The framesthat do not contain a visible PHCRAC-GFP patch also have nostatistically significant difference in fluorescence intensity betweenthe front and the side and/or back of the cell (125±9 versus 114±7).After correction for the cytosolic volume of boundary pixels, theccPHCRAC-GFP signal of patches was 66±3, compared with 6±5 atthe side and/or back of the cell. More importantly, the frames thatdid not contain a visible PHCRAC-GFP patch also exhibitedsignificantly more fluorescence at the front (32±4) than at the sideor in the back of the cell (9±4). Cells treated with the PI3K inhibitorLY294002 did not show a significantly different fluorescenceintensity of PHCRAC-GFP between the front and back of the cell,neither in the original data nor after cytosol correction (Fig. 4D).
The cell presented in Fig. 4 was located ~100 μm from the pipetteand displayed clear but not very strong PHCRAC-GFP patches. In asteep cAMP gradient at a distance of less than 50 μm from thepipette, strong PHCRAC-GFP patches were observed with a typicalPHCRAC-GFP signal of 141±13 in the patch and 69±5 in the backof the cell, showing a ~twofold difference between the front andback of the cell, as has been observed before (Janetopoulos et al.,2004; Xu et al., 2005). After correction for the cytosol, theccPHCRAC-GFP values of this cell are 86±11 in the front and 2±4at the side or back of the cell. The ccPHCRAC-GFP fluorescencesignal at the side or back of the cell was not significantly differentfrom zero, which precludes the calculation of a ratio of ccPHCRAC-GFP between the front and back of the cell. The data suggests that,in a steep cAMP gradient, the internal gradient of PtdIns(3,4,5)P3
is much stronger than previously anticipated, and that the internalgradient of PtdIns(3,4,5)P3 is also present in shallow cAMPgradients.
DiscussioncAMP-stimulated cells exhibit two PtdIns(3,4,5)P3 responses: asmall gradual response in shallow gradients and a strong amplifiedresponse leading to a PHCRAC-GFP patch in steep gradients. Thesmall response is detectable when the depletion from the cytosolcan be measured accurately (uniform stimulation) or when theresponse at the membrane can be corrected for the cytosol volumeof boundary pixels (cAMP gradient). On the basis of theseobservations, we define a strong PHCRAC-GFP patch as an area ofthe boundary of the cell with an uncorrected fluorescence intensitythat is more than 1.5-fold higher than the fluorescence intensity of
the cytosol; to exclude noise by individual pixels, patches shouldbe larger than 2 μm and last for more than 8 seconds.
The function of PI3K signaling in chemotaxisWe have shown here that inhibition of PI3K signaling withLY294002 or by deletion of two genes, encoding PI3K1 and PI3K2,leads to a significant inhibition of chemotaxis, but only in shallowgradients, in which the control cells have a chemotaxis index ofless then ~0.5. In steeper gradients, in which control cells have achemotaxis index above ~0.8, inhibition of PI3K signaling has farless effect on orientation of the cell.
Cell movement in buffer is best described as a random walk, i.e.cells extend a new pseudopod in a random direction every 30-60seconds. In shallow gradients, new pseudopodia are still extendedin all directions, but are either extended more frequently in thedirection of the gradient than in other directions, or retracted lessfrequently. We suppose that activators and inhibitors regulate thetime and place where a new pseudopod is made, and that stimulationof the cAMP receptor will influence the activity of one or multipleof these activators and inhibitors, thereby affecting pseudopodformation. In Dictyostelium, at least four signaling pathways havebeen implicated in chemotaxis: PI3K, PLA2, a soluble guanylylcyclase protein (sGC) and cGMP produced by sGC (Veltman et al.,2008). Each of these chemoattractant-stimulated pathways mayproduce activators or inhibitors of pseudopodia. In a shallowgradient, in which the probability that a pseudopod is extended inthe direction of the gradient is very low, interference with any ofthese hypothetical activators or inhibitors will lead to a reductionof chemotaxis. Therefore, inhibition of PI3K signaling will reducechemotaxis in shallow gradients, even though three other parallelpathways are functional. In steep cAMP gradients, amplification ofPI3K signaling leads to the formation of PtdIns(3,4,5)P3 patches.These PtdIns(3,4,5)P3 patches at the leading edge might help thecell in orienting towards the cAMP gradient, because actin-filamentformation is stimulated in regions of the cytosol immediately belowthe membrane area with a PtdIns(3,4,5)P3 patch (Funamoto et al.,2002; Parent et al., 1998; Postma et al., 2004b). However, we didnot observed a difference of chemotaxis index between cells withor without PHCRAC-GFP patches that were exposed to the samecAMP gradient. We propose that the PI3K pathway is dispensablefor chemotaxis in steep gradients because the other PLA2, cGMPand sGC pathways provide sufficient orientation to yield achemotaxis index of around 0.8.
In contrast to the absence of a strong effect of PI3K on orientationin steep gradients, we observed that cells with a PHCRAC-GFP patchmove towards the pipette about twofold faster than cells withoutPHCRAC-GFP patches. In addition, we observed that, during uniformcAMP stimulation, pseudopodia extending from areas of themembrane with a PHCRAC-GFP patch are about twofold larger thanpseudopodia without PHCRAC-GFP patches. These results suggestthat membrane areas with PtdIns(3,4,5)P3 patches induce extensiveactin-filament formation, leading to large pseudopodia and fastforward movement of the cell.
The function of PI3K signaling in chemotaxis can be approachedby proposing a ‘race’ between wild-type and pi3k-null cellstowards a point source of chemoattractant. Using the measuredspeed and chemotaxis indices at different distances from the pipette,the time required by a cell to reach the pipette can be computed(Fig. 5; see Materials and Methods for equations). The pi3k-nullcells are at a disadvantage because they have a lower chemotaxisindex than wild-type cells far away from the pipette and move slower
Journal of Cell Science 121 (21)
Jour
nal o
f Cel
l Sci
ence

3595PI3-kinase in chemotaxis
than wild-type cells close to the pipette. As a consequence, wild-type cells at a distance of 450 μm from the pipette are expected toreach the pipette in about 1 hour, whereas pi3k-null cells require 3hours to tip the pipette. At longer distances from the pipette thesituation is even worse, because pi3k-null cells do not exhibitchemotaxis beyond 450 μm. The cells must first reach this thresholddistance by random movement before they can pick up thechemotactic signal, which requires about 30 hours when starting ata distance of 1000 μm. By contrast, wild-type cells exhibitsignificant chemotaxis at 1000 μm from the pipette, predicting that,in 4 hours, wild-type cells move from 1000 μm away to the pipette.Cells with inhibited PI3K activity perform optimally relative to wild-type cells when starting at a distance of about 100 μm from thepipette, a distance at which the chemotactic behavior of cells isusually determined. We have performed the race experiment byexposing a mixture of RFP-labeled pi3k-null cells and GFP-labeledwild-type cells to the same cAMP gradient. Before application ofthe cAMP gradient, the distribution of both cell types wasapproximately random (Fig. 5C). At 50 minutes after exposing cells
to the cAMP gradient, many wild-type cells, but only a few pi3k-null cells, had moved close to the pipette (Fig. 5D). We determinedthe increase of cell density after application of the gradient as afunction of the distance towards the pipette. The pi3k-null cellsshowed a modest 1.75-fold increase close to the pipette, and noincrease beyond 100 to 200 μm from the pipette. By contrast, wild-type cells exhibit a nearly tenfold increase of cell density close tothe pipette, and the density is still elevated at 400 μm from thepipette (Fig. 5B).
In summary, we have addressed three issues on the role of PI3Ksignaling in chemotaxis that were raised after it was observed thatcells lacking PI3K signaling can exhibit excellent chemotaxis. First,parallel PLA2-sGC signaling pathways are responsible forchemotaxis in cells lacking PI3K activity. Second, two functionsfor PI3K signaling for chemotaxis were characterized, supportingorientation in shallow gradients and speed in steep gradients. Third,despite being dispensable, wild-type cells depend on PI3K signalingto effectively orient and move in a chemotactic gradient. In theirnatural habitat, cells use chemotaxis to trace bacteria for eating and
Fig. 5. Cells lacking PI3K activity are out competed by wild-type cells. (A) Calculations. The chemotaxis index and speed of the cells at different distances from apipette containing 100 μM cAMP were determined for AX3 cells in the presence and absence of the PI3K inhibitor LY294002 (see Fig. 1C; Fig. 2; supplementarymaterial Table S1). Using these data, the displacement in the direction of the pipette due to chemotaxis and random movement was calculated (see Materials andMethods for equations). Presented is the average time needed to reach the pipette from different starting positions. The data predict that PI3K-inhibited cells alwaysarrive later at the source than wild-type cells and perform relatively well when starting from a distance of about 100μm, but perform increasingly worse at largerdistances from the source. (B-D) Experiment. Wild-type cells were transformed with a plasmid expressing cytosolic GFP, whereas pi3k-null cells were transformedwith a plasmid expressing RFP. Cells were starved, mixed (wild-type:pi3k-null ratio is 1:3) and exposed to a cAMP gradient from a pipette containing 100μMcAMP. Confocal images were recorded before (C) and 50 minutes after (D) application of the cAMP gradient. The white dot in the centre in D indicates theposition of the pipette; the field of observation is 725�725 μm, recorded as 5�5 tile scans. The cell density was measured at different distances from the pipettebefore and after stimulation (B). The data show the increase of cell density as means ± s.d. of four determinations.
Jour
nal o
f Cel
l Sci
ence

3596
to form a multicellular structure for survival in the absence of food.In mixtures with wild-type cells, PI3K-deficient cells will be rapidlyout competed.
Materials and MethodsStrain and culture conditionsThe pi3k-null strain GMP1 has deletions of the pi3k1 and pi3k2 genes (Funamoto etal., 2001). A cell line expressing the PH domain of CRAC fused to GFP S65T (Parentet al., 1998) was made by electroporation of wild-type AX3 cells with plasmid WF38(a generous gift of Peter Devreotes, Johns Hopkins University, MD). These PHCRAC-GFP-expressing cells were selected and grown in HG5 medium with 10-40 μg/mlgeneticin (Gibco) in dishes to 80% confluency. Cells were harvested and washedtwice with 10 mM phosphate buffer, pH 6.5 (PB), and starved in a six-well plate(Nunc) at 80% confluency on 1% agarose in PB until the onset of aggregation.
Definition of PHCRAC-GFP patchesCells in each frame of a movie were classified as ‘cell with patch’ or ‘cell withoutpatch’. We define a patch as a region at the cell boundary with an average GFP-signal that is ≥1.5 times the mean fluorescence of the cytosol and has a minimumsize of 2 μm. To reduce the noise in the data, a patch must be present in at least twoconsecutive frames (4-8 seconds/frame). Conversely, when a patch disappears, it mustbe absent for at least two consecutive frames to identify the cell as a ‘cell withoutpatch’.
Chemotaxis assaysCells were harvested at the onset of aggregation, when dark-field waves becomevisible, and used for three chemotaxis assays. The small-population assay wasperformed as described (van Haastert et al., 2007). For the Zigmond-chamber assay(Zigmond, 1977), cells were deposited under the glass bridge of a modified Zigmondchemotaxis chamber (Veltman and Van Haastert, 2006). The bridge is ~2 mm wideand supported by two strips of 0.15-mm thickness. A block of agarose (1% w/v inPB) is placed at one side of the bridge and a block of agarose containing the indicatedconcentration of cAMP in PB is placed at the opposite side, making sure that bothblocks make contact with the fluid under the bridge. A gradient is formed across theglass bridge by diffusion of the cAMP from the ‘source’ block to the ‘sink’ block.Cells were observed in an area of 100�100 μm at a distance of about 700 μm fromthe agar block containing cAMP.
A second chemotaxis assay using micropipettes filled with cAMP has often beenused for Dictyostelium cells expressing PHCRAC-GFP (Funamoto et al., 2001). Briefly,a droplet containing cells was deposited on a microscope slide. A micropipettecontaining 100 μM cAMP (femtotip, Eppendorf) was placed in the field of cells witha micromanipulator. cAMP was released from the pipette by diffusion. In some cases,a compensation pressure of 1 hPa was used. The formation of the cAMP gradientwas deduced by measuring the release of the fluorescent dye lucifer yellow (molecularmass=457 Da) from the pipette. The fluorescence intensity at different distances fromthe pipette was recorded in pixel elements (0.404�0.404 μm) and calibrated usingthe fluorescence intensity of diluted lucifer yellow added homogeneously to the bath.In this work we report on chemotaxis in stable gradients, which are obtained in about10 minutes in the Zigmond chamber, but nearly instantaneously in the micropipetteassay (Marten Postma and P.J.M.V.H., unpublished).
The behavior of the cells was recorded using an inverted phase-contrast microscopeequipped with a standard CCD camera (JVC TK-C1381), or a fluorescent confocalmicroscope (Zeiss LSM510) with a Plan-apochromat 63� magnification 1.40 NAoil-immersed objective. The fields of observation were 100�100 μm for the phase-contrast microscope and roughly 150�150 μm for the fluorescence confocalmicroscope. Images were taken every 4 to 8 seconds. The chemotaxis index, definedas the ratio of the cell displacement in the direction of the gradient and its total traveleddistance, was determined as previously described (Veltman and Van Haastert, 2006).Briefly, the position of the centroid of a cell was determined with ImageJ at 30-second intervals. Using these coordinates, the chemotaxis index and speed of each30-second step was calculated and averaged, yielding the chemotaxis index and speedof the cell. The data shown are the average and s.e.m. of the chemotaxis indices andspeed from at least three independent experiments with about 25 cells per experiment.
Cytosol correction of PHCRAC-GFP in boundary pixelsPixel elements at the boundary of the cell contain variable amounts of cytosol, whichmake a large contribution to the total fluorescence intensity of the boundary pixels(see below). When the amount of cytosol in these pixels could be measured, thefluorescence due to association of PHCRAC-GFP with the membrane could becalculated, resulting in a significant increase of the sensitivity to detect PtdIns(3,4,5)P3.To correct for the amount of cytosol in pixels at the boundary of the cell, the followingapproach was applied. Cells expressing PHCRAC-GFP were transformed with plasmidpDM134, which contains a hygromycin-resistance cassette and the entire monomericred fluorescent protein MARS open reading frame (Fischer et al., 2004), flanked byan actin-15 promoter and an actin-8 terminator. Cells were selected and grown in thepresence of 10 μg/ml geneticin (Gibco) and 50 μg/ml hygromycin B (Invitrogen).Images of these PHCRAC-GFP/RFP cells were recorded using the Zeiss 510 laser-
scanning microscope using an argon (488 nm) and neon (543 nm) laser, respectively.The movies were imported to and processed with ImageJ. Processing involvedsubtraction of the average fluorescence of an area devoid of cells, followed by a 1-pixel smoothing step. Subsequently, the GFP/RFP normalization factor was determinedfor individual cells by manually selecting the interior of the cell (starting at ~1 μmfrom the cell boundary) and dividing the average fluorescence value of the GFPchannel by the average RFP signal. This was repeated for five other framesthroughout the movie, the average GFP:RFP ratio was calculated and the RFP channelwas multiplied by this GFP:RFP ratio. Finally, the corrected RFP signal wassubtracted from the GFP signal in the entire stack of pixel elements of the movie(see supplementary material Movie 1).
The resulting ccPHCRAC-GFP movie was analyzed with a custom version of QuimP(Dormann et al., 2002). In brief, the membrane intensity was determined at circa 50points around the cell by averaging the intensity of 3�3 pixels at those positions.The data were imported and further analyzed using Microsoft Excel.
Equations used to calculate cAMP gradientsWhen a pipette filled with cAMP is inserted in a field of Dictyostelium cells, cAMPwill diffuse continuously from the pipette, leading to a stable spatial gradient of whichthe concentration C(x) and the spatial gradient �C(x) are dependent on the distance(x) from the pipette according to:
and
where Cp is the cAMP concentration in the pipette and α is a proportionality constantthat depends on the geometry of the pipette and the applied pressure. Using afluorescent dye we determined experimentally that α=0.05. These equations are bothexperimentally and theoretically accurate descriptions of the cAMP gradient at adistance beyond 15 μm from the pipette; at shorter distances, more-complex equationsare required (Marten Postma and P.J.M.V.H., in preparation).
In the modified Zigmond chamber, cells are deposited under a bridge. A cAMPgradient is formed by placing agar blocks with buffer on one side of the bridge andan agar block with cAMP on the other side (Veltman and Van Haastert, 2006). Aftera while, cells experience a gradient with the following properties:
and
where Cs is the cAMP concentration at the source, x is the distance from the source(700 μm) and L is the width of the bridge (2000 μm).
The small-population assay scores the chemotactic response of a population ofcells towards a cAMP source that has been applied at some distance away as a singledose. Owing to diffusion in the agar, a transient cAMP gradient is formed that ismaximal with the following properties (Mato et al., 1975):
and
where r is the radius of the cAMP droplet (150 μm), x is the distance between cellpopulation and cAMP source (250 μm), and Cd is the applied cAMP concentrationin the droplet.
Threshold for observing translocation of the cytosolic marker tothe membraneWe are interested in the amount of depletion of PHCRAC-GFP from the cytosol thatleads to a significant increase of the fluorescence intensity at the membrane abovethe level of the cytosol. A confocal image of a cell is composed of internal pixelelements and boundary pixel elements. The pixel elements have dimensions of400�400�1000 nm in the x, y and z direction, respectively, with a volume of 0.16μm3. The fluorescence intensity of an internal pixel element is Ic, and the averagefluorescence intensity in the boundary pixel element is Ib. The boundary pixel elementsconsist of extracellular, intracellular and membrane volume. The membrane has athickness of about 5 nm, which implies a volume of the membrane in a boundarypixel element that is maximally 1.4�400�1000�5=0.28�10–3 μm3, or 0.175% of
∇C x( ) = 2.42
r3
x4Cd (6),
C x( ) = 0.48r3
x3Cd (5)
∇C x( ) = −Cs
L(4),
C x( ) = Cs 1 −x
L
⎛⎝⎜
⎞⎠⎟
(3),
∇C x( ) = −
αCp
x2(2),
C x( ) =αCp
x(1)
Journal of Cell Science 121 (21)
Jour
nal o
f Cel
l Sci
ence
3597PI3-kinase in chemotaxis
the pixel volume. Therefore, the volume of the average boundary pixel consists ofnearly 50% extracellular and 50% intracellular medium. The fluorescence intensityof the boundary pixel element is thus Ib=Im+0.5Ic, where Im is the fluorescence intensityassociated with the plasma membrane. Assume that the total number of pixel elementsis n and the fraction of boundary pixel elements is a.
Assume that, before cAMP stimulation, all PHCRAC-GFP is localized in the cytosol,then Ic=Ic
0, and Ib=0.5 Ic0. Assume that, after cAMP stimulation, the fraction g of the
PHCRAC-GFP in the cytosol translocates to the membrane. Then the fluorescenceintensity after stimulation in the interior pixels is Ic
s=(1–g)Ic0 and in the boundary
pixels is Ibs=ga–1Ic
0+(0.5–g)Ic0.
We are interested in the condition at which the fluorescence intensity of the boundarypixels surpasses the fluorescence intensity of the interior pixels, i.e. Ib/Ic >1. The ratioof fluorescence intensity at the boundary and interior pixels is given by:
Ib/Ic = [ga–1Ic0+(0.5–g)Ic
0]/(1–g)Ic0 = [(g/a)+0.5–g]/(1–g) . (7)
The fraction of pixel elements at the boundary (a) depends on the size of the pixels,and the size and shape of the cell. For a spherical cell with radius of 5 μm and pixelelements as indicated above, we estimate a=0.24, and for an elongated cell with lengthof 15 μm and radius 4 μm we estimate a=0.30. Using three-dimensional reconstructionof a cell expressing a transmembrane protein membrane, we observed a=0.26.
Supplementary material Fig. S1 shows that, for a=0.25, the fluorescence intensityof the boundary pixel elements becomes higher than the fluorescence intensity of thecytosol (Ib/Ic >1) when the depletion in the cytosol is above 12%. Thus, cAMP-inducedtranslocations of PHCRAC-GFP smaller than 12% cannot be easily detected at theboundary of the cell. This threshold for detecting translocation to the membrane willbe smaller (i.e. more easily detected) when pixels elements are smaller, because thenumber of interior and boundary pixel elements increase with the power of three andtwo, respectively, by which the fraction of boundary pixels (a) decreases.
Equations used to calculate cell movement in cAMP gradientsA cell at time t and position x from the pipette has a speed of v(x,t) and chemotaxisindex of CI(x,t). The distance ΔA(x,t) moved towards the pipette at that position duringa time interval Δt is given by:
where ΔA(x,t)=v(x,t)CI(x,t)Δt is the distance moved towards the pipette due tochemotaxis and Δ is the distance moved in the direction of thepipette due to random movement.
The distance moved after a large time period t is given by:
This equation was numerically solved for different start positions xs to obtainA(x,t)=A(xs,ts), i.e. the time ts to reach the source of chemoattractant.
The chemotaxis index CI(x) at distance (x) from the pipette was calculated fromthe spatial gradient (see above) and the fitted chemotaxis index at different spatialgradients obtained, as shown in Fig. 2D:
where α=0.05, Cp=108 pM, CIMAX=0.9, K=26 pM/μm and n=0.9 for wild-type cells,and K=166.5 pM/μm and n=1.28 for pi3k-defective cells.
The speed v(x) at distance (x) from the pipette is given by:
v(x) = v0 + (vp – v0)F(x),
where v0 and vp are the speed of cells without and with patch, respectively, obtainedfrom supplementary material Table S1, and F(x) is the fraction of cells with a patchfrom Fig. 1B (the fitted curve is:
where σ is the maximal fraction of PtdIns(3,4,5)P3 patches, and β is the distance atwhich half-maximal patches are observed; σ=0.8 and β=50 μm). Calculations wereperformed with v0=10 μm/minute for both wild-type and pi3k-defective cells, andvp=19 μm/minute for wild-type cells with a patch.
ReferencesAndrew, N. and Insall, R. H. (2007). Chemotaxis in shallow gradients is mediated
independently of PtdIns 3-kinase by biased choices between random protrusions. Nat.Cell Biol. 9, 193-200.
F (x) = σ
βx + β
,
CI (x) = CIMAX
ΔCn
ΔCn + K n
ΔC = αCp / x2
and
(10),
A(x,t) = v(x,t)CI (x,t)Δtt=0
t=t
∑ + v(x,t)t (9).
�A(x,t)= v(x,t)Δt
ΔA(x,t) = Δ
�A x,t( ) + Δ
�A(x,t) =v(x,t)CI (x,t)Δt + v(x,t)Δt (8),
Baggiolini, M. (1998). Chemokines and leukocyte traffic. Nature 392, 565-568.Brenner, M. and Thoms, S. D. (1984). Caffeine blocks activation of cyclic AMP synthesis
in Dictyostelium discoideum. Dev. Biol. 101, 136-146.Campbell, J. J. and Butcher, E. C. (2000). Chemokines in tissue-specific and
microenvironment-specific lymphocyte homing. Curr. Opin. Immunol. 12, 336-341.Chen, L., Janetopoulos, C., Huang, Y. E., Iijima, M., Borleis, J. and Devreotes, P. N.
(2003). Two phases of actin polymerization display different dependencies onPI(3,4,5)P3 accumulation and have unique roles during chemotaxis. Mol. Biol. Cell 14,5028-5037.
Chen, L., Iijima, M., Tang, M., Landree, M. A., Huang, Y. E., Xiong, Y., Iglesias, P.A. and Devreotes, P. N. (2007). PLA(2) and PI3K/PTEN pathways act in parallel tomediate chemotaxis. Dev. Cell 12, 603-614.
Comer, F. I., Lippincott, C. K., Masbad, J. J. and Parent, C. A. (2005). The PI3K-mediated activation of CRAC independently regulates adenylyl cyclase activation andchemotaxis. Curr. Biol. 15, 134-139.
Crone, S. A. and Lee, K. F. (2002). The bound leading the bound: target-derived receptorsact as guidance cues. Neuron 36, 333-335.
Devreotes, P. and Janetopoulos, C. (2003). Eukaryotic chemotaxis: distinctions betweendirectional sensing and polarization. J. Biol. Chem. 278, 20445-20448.
Dormann, D., Libotte, T., Weijer, C. J. and Bretschneider, T. (2002). Simultaneousquantification of cell motility and protein-membrane-association using active contours.Cell Motil. Cytoskeleton 52, 221-230.
Fischer, M., Haase, I., Simmeth, E., Gerisch, G. and Muller-Taubenberger, A. (2004).A brilliant monomeric red fluorescent protein to visualize cytoskeleton dynamics inDictyostelium. FEBS Lett. 577, 227-232.
Funamoto, S., Milan, K., Meili, R. and Firtel, R. A. (2001). Role of phosphatidylinositol3� kinase and a downstream pleckstrin homology domain-containing protein in controllingchemotaxis in dictyostelium. J. Cell Biol. 153, 795-810.
Funamoto, S., Meili, R., Lee, S., Parry, L. and Firtel, R. A. (2002). Spatial and temporalregulation of 3-phosphoinositides by PI 3-kinase and PTEN mediates chemotaxis. Cell109, 611-623.
Hoeller, O. and Kay, R. (2007). Chemotaxis in the absence of PIP3 gradients. Curr. Biol.17, 813-817.
Huang, Y. E., Iijima, M., Parent, C. A., Funamoto, S., Firtel, R. A. and Devreotes, P.(2003). Receptor-mediated regulation of PI3Ks confines PI(3,4,5)P3 to the leading edgeof chemotaxing cells. Mol. Biol. Cell 14, 1913-1922.
Iijima, M., Huang, Y. E., Luo, H. R., Vazquez, F. and Devreotes, P. N. (2004). Novelmechanism of PTEN regulation by its phosphatidylinositol 4,5-bisphosphate bindingmotif is critical for chemotaxis. J. Biol. Chem. 279, 16606-16613.
Janetopoulos, C., Ma, L., Devreotes, P. N. and Iglesias, P. A. (2004). Chemoattractant-induced phosphatidylinositol 3,4,5-trisphosphate accumulation is spatially amplified andadapts, independent of the actin cytoskeleton. Proc. Natl. Acad. Sci. USA 101, 8951-8956.
Lee, S., Comer, F. I., Sasaki, A., McLeod, I. X., Duong, Y., Okumura, K., Yates, J.R., 3rd, Parent, C. A. and Firtel, R. A. (2005). TOR complex 2 integrates cellmovement during chemotaxis and signal relay in Dictyostelium. Mol. Biol. Cell 16,4572-4583.
Loovers, H. M., Postma, M., Keizer-Gunnink, I., Huang, Y. E., Devreotes, P. N. andvan Haastert, P. J. (2006). Distinct roles of PI(3,4,5)P3 during chemoattractantsignaling in Dictyostelium: a quantitative in vivo analysis by inhibition of PI3-kinase.Mol. Biol. Cell 17, 1503-1513.
Ma, L., Janetopoulos, C., Yang, L., Devreotes, P. N. and Iglesias, P. A. (2004). Twocomplementary, local excitation, global inhibition mechanisms acting in parallel canexplain the chemoattractant-induced regulation of PI(3,4,5)P3 response in dictyosteliumcells. Biophys. J. 87, 3764-3774.
Mato, J. M., Losada, A., Nanjundiah, V. and Konijn, T. M. (1975). Signal input for achemotactic response in the cellular slime mold Dictyostelium discoideum. Proc. Natl.Acad. Sci. USA 72, 4991-4993.
Merlot, S. and Firtel, R. A. (2003). Leading the way: directional sensing throughphosphatidylinositol 3-kinase and other signaling pathways. J. Cell Sci. 116, 3471-3478.
Parent, C. A., Blacklock, B. J., Froehlich, W. M., Murphy, D. B. and Devreotes, P. N.(1998). G protein signaling events are activated at the leading edge of chemotactic cells.Cell 95, 81-91.
Postma, M., Bosgraaf, L., Loovers, H. M. and Van Haastert, P. J. (2004a). Chemotaxis:signalling modules join hands at front and tail. EMBO Rep. 5, 35-40.
Postma, M., Roelofs, J., Goedhart, J., Loovers, H. M., Visser, A. J. and Van Haastert,P. J. (2004b). Sensitization of Dictyostelium chemotaxis by phosphoinositide-3-kinase-mediated self-organizing signalling patches. J. Cell Sci. 117, 2925-2935.
Takeda, K., Sasaki, A. T., Ha, H., Seung, H. A. and Firtel, R. A. (2007). Role ofphosphatidylinositol 3-kinases in chemotaxis in Dictyostelium. J. Biol. Chem. 282, 11874-11884.
van Haastert, P. J. M., Keizer-Gunnink, I. and Kortholt, A. (2007). Essential role of PI3-kinase and phospholipase A2 in Dictyostelium chemotaxis. J. Cell Biol. 177, 809-816.
Veltman, D. M. and Van Haastert, P. J. (2006). Guanylyl cyclase protein and cGMPproduct independently control front and back of chemotaxing Dictyostelium cells. Mol.Biol. Cell 17, 3921-3929.
Veltman, D. M., Keizer-Gunnink, I. and Van Haastert, P. J. M. (2008). Four key signalingpathways mediating chemotaxis in Dictyostelium discoideum. J. Cell Biol. 180, 747-753.
Xu, X., Meier-Schellersheim, M., Jiao, X., Nelson, L. E. and Jin, T. (2005). Quantitativeimaging of single live cells reveals spatiotemporal dynamics of multistep signaling eventsof chemoattractant gradient sensing in Dictyostelium. Mol. Biol. Cell 16, 676-688.
Zigmond, S. H. (1977). Ability of polymorphonuclear leukocytes to orient in gradients ofchemotactic factors. J. Cell Biol. 75, 606-616.
Jour
nal o
f Cel
l Sci
ence