PI-Tool To Improve Performance of Application In Multi-core Architecture
13
P. Bala Subramanyam Raju & P. Govindarajulu International Journal of Computer Science and Security (IJCSS), Volume (8) : Issue (4) : 2014 84 PI-Tool To Improve Performance of Application In Multi-core Architecture P. Bala Subramanyam Raju [email protected] Research Scholar, Dept. of Computer Science, S.V University, Tirupathi Chittoor (Dt) AP, India Pin 517501 P. Govindarajulu [email protected] Professor, Dept. of Computer Science, S.V University, Tirupathi, Chittoor (Dt) AP, India Pin 517501 Abstract Multi-core CPUs become increasingly popular on server-grade hardware as well as end-user desktop PCs or laptops. Necessary efforts are taken in the community towards developing applications optimized for multi-core architecture [1], still every user is expecting to run applications or programs with more speed than normal execution. In order to achieve maximum possible performance, there is a need for fine tuning in the areas of Operating System scheduling, Process Priority and CPU Affinity. So this paper presents PI-tool, to aid user by changing priority and CPU Affinity to his application or program at runtime to achieve better performance .The PI-tool is compared with Red Hat TUNA tool with NQueens program the results are presented for evaluation. Keywords: CPU Affinity, Ping-Pong Effect, Chip Multi-core, Performance, Benchmark, Microprocessor, Software Challenges, OS (Operating System) High Performance Computing [HPC]. 1. INTRODUCTION Modern microprocessor is the most complex systems ever created by humans. A single chip, roughly fingernail size contains trillions of transistors to perform billions of operations per second. The advent of multi-core processors is able to still deliver more computing power. It is a complex, challenging task to take full advantage of today’s high performance computer architectures. In order to achieve this, research is focused in the areas of Operating system(OS), OS Service Libraries ,Cache Management, Process Scheduling, Modifying Existing applications, and Other software’s management[,2,3,4,5,6,7,8] to identify the performance bottlenecks to provide a way ,to full utilization of modern microprocessor effectively. New process created will be assigned to processor Queue by the operating system in some order or priority Example FIFO, LIFO, Round Robin Scheduling. The process doesn’t have any choice of choosing the processor on which it is going to execute. Linux Kernel by default provides soft affinity [9] (also called natural affinity), it is the tendency of the scheduler to keep processes on the same CPU as long as possible. In certain situations the scheduler bounces processes between multiple processors each time they are scheduled and rescheduled called Ping-Pong effect. Migrating processes from one core to another core can be costly due to cache invalidation, this problem is considered to be the bottleneck for performance. Low priority for the process is also another major bottleneck for the performance of the application. So this paper presents a tool which gives the user, capability to bind his application to less utilizing core to reduce Ping- Pong effect, along with this user can increase the priority of process. High priority processes are
-
Upload
cscjournals -
Category
Education
-
view
103 -
download
1
Transcript of PI-Tool To Improve Performance of Application In Multi-core Architecture

P. Bala Subramanyam Raju & P. Govindarajulu
International Journal of Computer Science and Security (IJCSS), Volume (8) : Issue (4) : 2014 84
PI-Tool To Improve Performance of Application In Multi-core Architecture
P. Bala Subramanyam Raju [email protected]
Research Scholar, Dept. of Computer Science, S.V University, Tirupathi Chittoor (Dt) AP, India Pin 517501
P. Govindarajulu [email protected] Professor, Dept. of Computer Science, S.V University, Tirupathi, Chittoor (Dt) AP, India Pin 517501
Abstract
Multi-core CPUs become increasingly popular on server-grade hardware as well as end-user desktop PCs or laptops. Necessary efforts are taken in the community towards developing applications optimized for multi-core architecture [1], still every user is expecting to run applications or programs with more speed than normal execution. In order to achieve maximum possible performance, there is a need for fine tuning in the areas of Operating System scheduling, Process Priority and CPU Affinity. So this paper presents PI-tool, to aid user by changing priority and CPU Affinity to his application or program at runtime to achieve better performance .The PI-tool is compared with Red Hat TUNA tool with NQueens program the results are presented for evaluation. Keywords: CPU Affinity, Ping-Pong Effect, Chip Multi-core, Performance, Benchmark, Microprocessor, Software Challenges, OS (Operating System) High Performance Computing [HPC].
1. INTRODUCTION Modern microprocessor is the most complex systems ever created by humans. A single chip, roughly fingernail size contains trillions of transistors to perform billions of operations per second. The advent of multi-core processors is able to still deliver more computing power. It is a complex, challenging task to take full advantage of today’s high performance computer architectures. In order to achieve this, research is focused in the areas of Operating system(OS), OS Service Libraries ,Cache Management, Process Scheduling, Modifying Existing applications, and Other software’s management[,2,3,4,5,6,7,8] to identify the performance bottlenecks to provide a way ,to full utilization of modern microprocessor effectively. New process created will be assigned to processor Queue by the operating system in some order or priority Example FIFO, LIFO, Round Robin Scheduling. The process doesn’t have any choice of choosing the processor on which it is going to execute. Linux Kernel by default provides soft affinity [9] (also called natural affinity), it is the tendency of the scheduler to keep processes on the same CPU as long as possible. In certain situations the scheduler bounces processes between multiple processors each time they are scheduled and rescheduled called Ping-Pong effect. Migrating processes from one core to another core can be costly due to cache invalidation, this problem is considered to be the bottleneck for performance. Low priority for the process is also another major bottleneck for the performance of the application. So this paper presents a tool which gives the user, capability to bind his application to less utilizing core to reduce Ping-Pong effect, along with this user can increase the priority of process. High priority processes are

P. Bala Subramanyam Raju & P. Govindarajulu
International Journal of Computer Science and Security (IJCSS), Volume (8) : Issue (4) : 2014 85
run before low-priority processes, they are also allowed to run longer period before being pre-empted.
The rest of the paper is organized as follows: Section 2 presents a brief survey of performance tuning tools, advantages of CPU Affinity is discussed in Section 3, and description of PI-Tool presented in Section 4. Section 5 specifies software and hardware details and tuning of a process is discussed in section 6. Section 7 presents the comparative study the effects of CPU Affnitity. Section 8 deals with positive and negative effects of using PI-Tools .Finally a conclusion with Future work is made in Section 9.
2. A SURVEY OF PERFORMANCE TUNING TOOLS In this section, we present a historical survey on top 5 performance monitoring and tuning tools from early systems to today. We will discuss the goals, strengths and weakness of each tool. 2.1 TOP & HTOP The top is a text-mode program provides a dynamic real-time view of a running system.it displays the most CPU-intensive tasks running on the server and updates the list every five seconds. It can sort the tasks by CPU usage, memory usage and runtime [10] The htop program is very similar to top but has some extra features that make it an even better command line utility for process monitoring. It allows you to scroll vertically and horizon‐ tally. Tasks related to processes (killing, renicing) can be done without entering their PIDs [11]. The below figure shows the sample output top of htop program
FIGURE 1: Sample Output Top of Htop Program.
2.2 SYSSTAT Sysstat is a powerful logging and monitoring tool for Linux/Unix systems. It can be used to monitor system performance and troubleshoot problems. The sysstat package contains the sar, mpstat and iostat commands for Linux. The sar command collects, report, or save Linux system activity information like CPU, Memory utilization, Network, IO transfers, process activity, device activity and interrupts. However, analyzing information provided by sar can be difficult. The iostat command reports CPU utilization and I/O statistics for disks. The mpstat command reports global

P. Bala Subramanyam Raju & P. Govindarajulu
International Journal of Computer Science and Security (IJCSS), Volume (8) : Issue (4) : 2014 86
and per-processor statistics. The statistics reported by sar concern I/O transfer rates, paging activity, process-related activities, interrupts, network activity, memory and swap space utilization, CPU utilization, kernel activities and TTY statistics, among others[12,13]. The sample output of sar command is 12:00:01 AM CPU %user %nice %system %iowait %steal %idle 12:01:01 AM all 73.28 0.00 1.25 0.00 0.00 25.47 12:02:01 AM all 7.83 0.00 0.44 0.00 0.00 91.73 12:03:01 AM all 61.65 0.00 0.70 0.00 0.00 37.66 12:04:01 AM all 57.85 0.00 0.82 0.00 0.00 41.34 12:05:01 AM all 4.25 0.00 0.41 0.00 0.00 95.34 12:06:01 AM all 4.20 0.00 0.22 0.00 0.00 95.58 12:07:01 AM all 5.05 0.00 0.33 0.00 0.00 94.63 12:08:01 AM all 4.76 0.00 0.06 0.00 0.00 95.18 12:09:01 AM all 37.57 0.00 0.37 0.00 0.00 62.05 12:10:01 AM all 70.04 0.00 0.80 0.00 0.00 29.16 12:11:01 AM all 5.03 0.00 0.12 0.00 0.00 94.84 2.3 KDE/GNOME SYSTEM MONITOR The GNOME and KDE desktop environments both have graphical tools to assist you in monitoring and modifying the behavior of your system. System Monitor displays basic system information and allows you to monitor system processes, and resource or file system usage [14][15] The below figure shows the sample out of GNOME/KDE System Monitor
FIGURE 2: Sample of GNOME/KDE System Monitor.
2.4 PERFSUITE PerfSuite is a collection of tools, utilities, and libraries for software optimization, benchmarking, and performance analysis where the primary design goals are ease of use, comprehensibility, interoperability, and simplicity. PerfSuite by itself gives you the information you need to focus your performance optimization efforts in the right direction without extensive source code changes to

P. Bala Subramanyam Raju & P. Govindarajulu
International Journal of Computer Science and Security (IJCSS), Volume (8) : Issue (4) : 2014 87
your application or complicated builds of the performance tools or libraries themselves. PerfSuite development is driven by people who do performance analysis on a daily basis with a wide variety of applications. Therefore the emphasis is on practicality, robustness, simplicity, and utility in real-world, everyday use on platforms ranging from single-processor workstations to terascale clusters and beyond [16][17]. Command-Line Utilities psinv,psprocess: psrun Graphical Tools PSConfig: Web-Based Tools,AmdahlCalc
FIGURE 3: PerfSuite Tool.
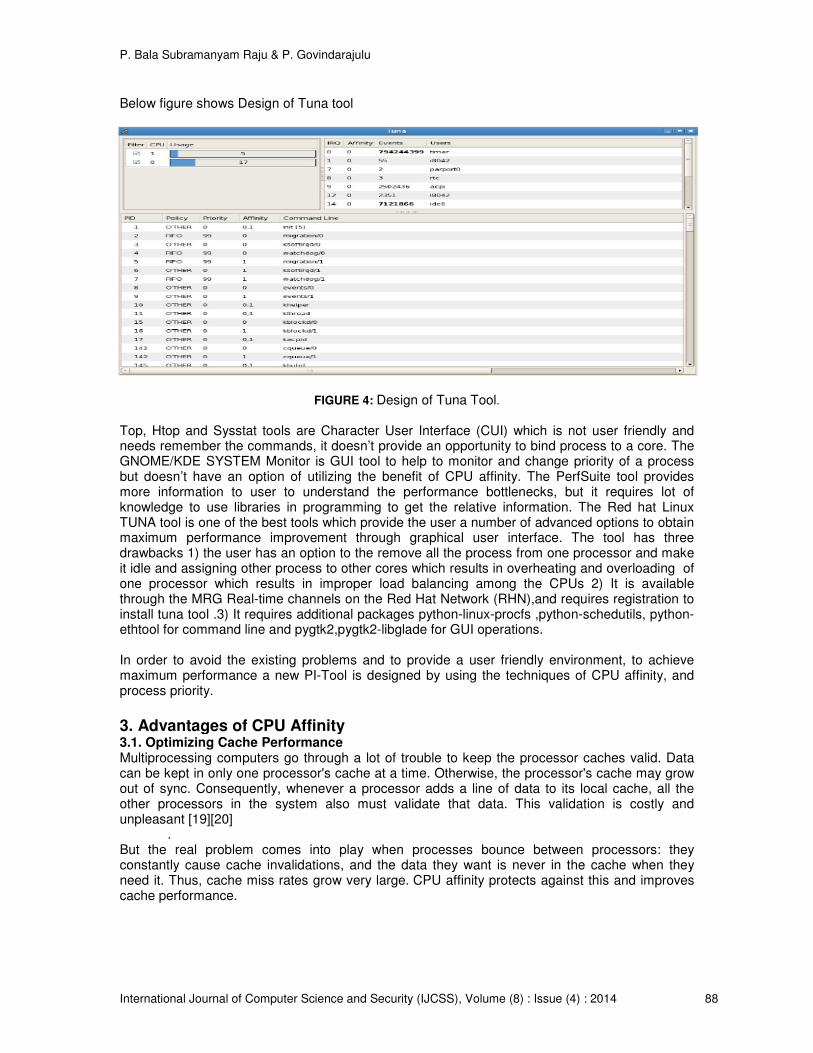
2.5 RED HAT TUNA TOOL Tuna was developed for tuning the MRG Realtime component of Red Hat Enterprise MRG [18], but can also be used to tune standard Red Hat Enterprise Linux systems. Tuna is a tool that can be used to adjust scheduler policy, Real-time priority and CPU affinity. It also allows the user to see the results of these changes. Threads and IRQ handlers are able to be tuned. It is also possible to isolate CPU cores and sockets, moving all threads away from them so that a new, more important set of threads can run exclusively. Tuna provides a graphical user interface (GUI), displays the CPU topology on one screen, which helps identify problems. It also allows changes to make for running threads, and see the results of those changes immediately .Most Tuna operations can be performed on either the command line, or in the GUI.
P. Bala Subramanyam Raju & P. Govindarajulu
International Journal of Computer Science and Security (IJCSS), Volume (8) : Issue (4) : 2014 88
Below figure shows Design of Tuna tool
FIGURE 4: Design of Tuna Tool.
Top, Htop and Sysstat tools are Character User Interface (CUI) which is not user friendly and needs remember the commands, it doesn’t provide an opportunity to bind process to a core. The GNOME/KDE SYSTEM Monitor is GUI tool to help to monitor and change priority of a process but doesn’t have an option of utilizing the benefit of CPU affinity. The PerfSuite tool provides more information to user to understand the performance bottlenecks, but it requires lot of knowledge to use libraries in programming to get the relative information. The Red hat Linux TUNA tool is one of the best tools which provide the user a number of advanced options to obtain maximum performance improvement through graphical user interface. The tool has three drawbacks 1) the user has an option to the remove all the process from one processor and make it idle and assigning other process to other cores which results in overheating and overloading of one processor which results in improper load balancing among the CPUs 2) It is available through the MRG Real-time channels on the Red Hat Network (RHN),and requires registration to install tuna tool .3) It requires additional packages python-linux-procfs ,python-schedutils, python-ethtool for command line and pygtk2,pygtk2-libglade for GUI operations. In order to avoid the existing problems and to provide a user friendly environment, to achieve maximum performance a new PI-Tool is designed by using the techniques of CPU affinity, and process priority.
3. Advantages of CPU Affinity 3.1. Optimizing Cache Performance Multiprocessing computers go through a lot of trouble to keep the processor caches valid. Data can be kept in only one processor's cache at a time. Otherwise, the processor's cache may grow out of sync. Consequently, whenever a processor adds a line of data to its local cache, all the other processors in the system also must validate that data. This validation is costly and unpleasant [19][20]
. But the real problem comes into play when processes bounce between processors: they constantly cause cache invalidations, and the data they want is never in the cache when they need it. Thus, cache miss rates grow very large. CPU affinity protects against this and improves cache performance.

P. Bala Subramanyam Raju & P. Govindarajulu
International Journal of Computer Science and Security (IJCSS), Volume (8) : Issue (4) : 2014 89
3.2. Multithreading Performance If multiple threads are accessing the same data, it might make sense to bind them all to the same processor. Doing so guarantees that the threads do not contend over data and cause cache misses. This does diminish the performance gained from multithreading on SMP. Thus binding a thread to a processor improves the multithreading performance.
3.3 Time Quantum The third and final benefit is found in real-time or otherwise time-sensitive applications. In this approach, all the system processes are bound to a subset of the processors on the system. The specialized application then is bound to the remaining processors. Commonly, in a dual-processor system, the specialized application is bound to one processor, and all other processes are bound to the other. This ensures that the specialized application receives the full attention of the processor by receiving more time quantum.
4. DESCRIPTION OF PI-TOOL The PI-Tools divided into two sections; first section shows the information regarding the process executing in the system ,from which user can select one process by entering the PID of the process in the below text box.
The second section shows the selected process information, CPU core on which process is running, processor, ram utilization, command name, process start time and priority. Here user can find two buttons for obtaining CPU affinity and to increase process Priority.

P. Bala Subramanyam Raju & P. Govindarajulu
International Journal of Computer Science and Security (IJCSS), Volume (8) : Issue (4) : 2014 90
The PI-Tool has divided into two procedures; 1.newprocess 2.updatevalues. The new process is responsible for reading and displaying all the process running in the system. When user enters a process ID and click button, the method is responsible for reading the processor, cpu,memory utilization values, starttime,command, nice values of selected process .
The updatevalues procedure is designed using a thread which continuously updates the information of selected process,
5. EXPERIMENTAL TEST BED 5.1 Hardware
Name Details
Processor Intel Core i7 4770K [23]
No of Cores 4
No of Threads 8
Clock Speed 3.5 GHz
Max Turbo Frequency 3.9 GHz
Intel Smart Cache 8 MB
RAM ,Speed 8 GB(1600 MHz)
Instruction Set 64 Bit
5.2 Software
• Linux Kernel 3.14.4-200 [22]
• Fedora OS -20 [21]
• GCC Compiler
• Java 1.7
P. Bala Subramanyam Raju & P. Govindarajulu
International Journal of Computer Science and Security (IJCSS), Volume (8) : Issue (4) : 2014 91
• Net Beans IDE 7.4 [24]
6. PROCESS TUNING
o To select a process for tuning, click on get process list button, among the displayed list find the process ID and enter the process ID into text box then click go button, PI-Tool will display the core number on which program is executing, cpu, ram usage, command name, start time, and nice values of the of entered process ID
o If the process is exhibiting the Ping-Pong effect, then click bind to processor button, PI-Tool will automatically select the less utilizing core and binds to it.
o To increase the priority of a process, enter new priority value into the textbox then click increase priority button, then PI-Tool will ask for password of root user, after entering the password, PI-Tool will increase the priority.
7. COMPARATIVE STUDY THE EFFECTS OF CPU AFFINITY In order to study the effect of CPU affinity, with reference to CPU performance, the NQueens program has been executed through Linux shell. The NQueens program is executed in normal conditions and then the Tuna and PI tools are used with FIFO and Round Robin (RR) scheduling to study the CPU Performance.
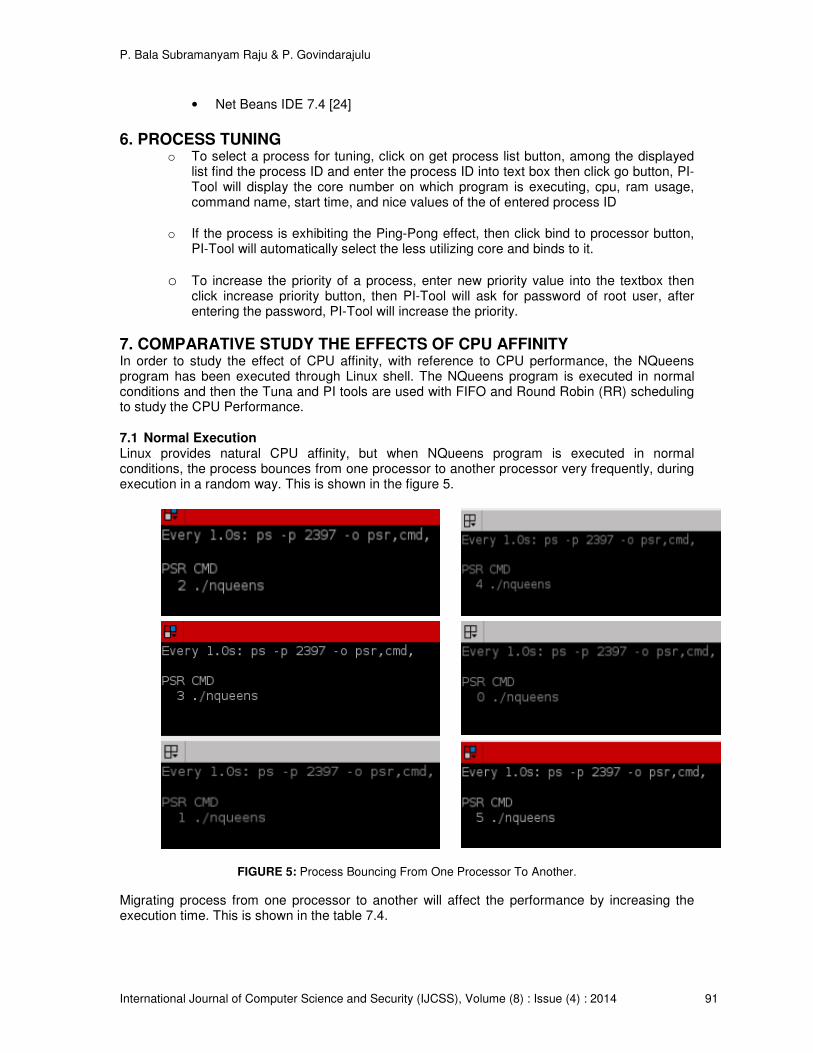
7.1 Normal Execution Linux provides natural CPU affinity, but when NQueens program is executed in normal conditions, the process bounces from one processor to another processor very frequently, during execution in a random way. This is shown in the figure 5.
o
FIGURE 5: Process Bouncing From One Processor To Another.
Migrating process from one processor to another will affect the performance by increasing the execution time. This is shown in the table 7.4.

P. Bala Subramanyam Raju & P. Govindarajulu
International Journal of Computer Science and Security (IJCSS), Volume (8) : Issue (4) : 2014 92
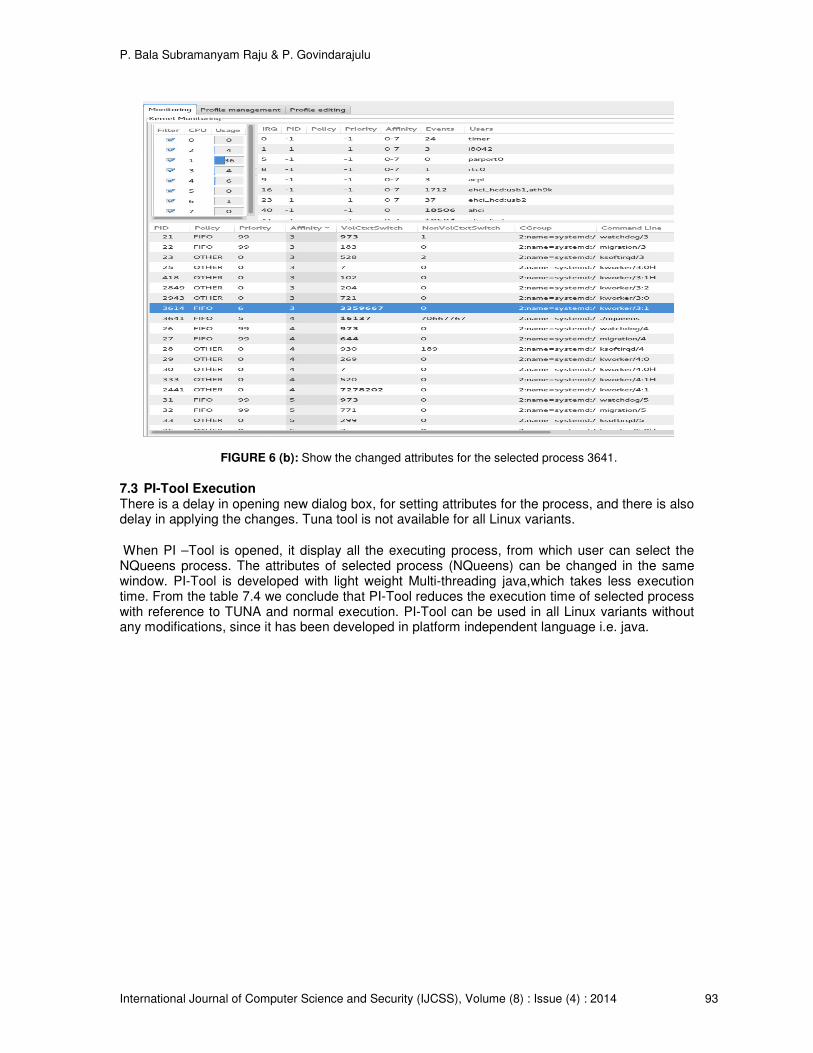
7.2 Tuna-Tool Execution When NQueens program is under execution through Linux shell, the Tuna tool can be activated under Super User Mode by executing the sudo Tuna command at shell prompt. Select the process (NQueens PID 3641), click the mouse right button, then a small dialog box will appear on the screen. The attributes of scheduling, priority, and CPU affinity can be modified in the dialogue box, as shown in the figure 6 (a). After modifying the attributes, the process has been bind to the selected processor and execution will be completed with given priority and scheduling policy as shown in the figure 6 (b). The results in the table 7.4 show the decrease in the execution time than the normal execution.
FIGURE 6 (a): Shows the selected process 3641 and dialogue box to change.
P. Bala Subramanyam Raju & P. Govindarajulu
International Journal of Computer Science and Security (IJCSS), Volume (8) : Issue (4) : 2014 93
FIGURE 6 (b): Show the changed attributes for the selected process 3641.
7.3 PI-Tool Execution There is a delay in opening new dialog box, for setting attributes for the process, and there is also delay in applying the changes. Tuna tool is not available for all Linux variants.
When PI –Tool is opened, it display all the executing process, from which user can select the NQueens process. The attributes of selected process (NQueens) can be changed in the same window. PI-Tool is developed with light weight Multi-threading java,which takes less execution time. From the table 7.4 we conclude that PI-Tool reduces the execution time of selected process with reference to TUNA and normal execution. PI-Tool can be used in all Linux variants without any modifications, since it has been developed in platform independent language i.e. java.

P. Bala Subramanyam Raju & P. Govindarajulu
International Journal of Computer Science and Security (IJCSS), Volume (8) : Issue (4) : 2014 94
FIGURE 7: Show the PI-Tool Interface for changing the attributes of a process.
The table 7.4 presents the results of NQueen program, normal execution along with TUNA and PI-Tool with FIFO and Round Robin scheduling.
Queens Solutions Normal Priority TUNA PI-tool
FIFO RR FIFO RR
N=13 73712 00:00:57 6 00:00:57 00:00:57 00:00:55 00:00:55
N=14 3,65,596 00:05:45 6 00:05:36 00:05:31 00:05:33 00:05:29
N=15 22,79,184 00:40:35 6 00:40:30 00:39:46 00:39:39 00:39:15
N=16 1,47,72,512 05:02:57 6 04:50:56 04:38:15 04:46:00 04:37:30
TABLE 7.4: shows the results of NQueens program normal execution, TUNA tool and PI-Tool.
8. ADVANTGES AND DISADVANTAGES Advantages
o PI-Tool is more user friendly , and can be operated by any user with little knowledge
o Helps to avoid Ping-Pong effects of process that results in performance
improvements.
o Useful to increase priority of a process without knowing any shell commands
o No need of any additional subscription or downloading or installing any software’s

P. Bala Subramanyam Raju & P. Govindarajulu
International Journal of Computer Science and Security (IJCSS), Volume (8) : Issue (4) : 2014 95
o It can be used on any Linux system ,having JRE
Disadvantages
o With increase of priority to a selected process the other process may get delayed.
9. CONCLUSION and FUTURE WORK The above results show the execution with the PI-tool gives marginally better results than TUNA Tool and normal execution. The marginally better results are achieved when small and medium size programs but may increase with the program size and execution time. This marginal advantage is mainly depending on the core selection by the PI-Tool. This PI tool is designed to provide the user a way to overcome the drawback of CPU Affinity, and to increase priority to applications to get more performance. So further research work may require by making the process to core mapping automatically by the Operating system.
10. REFERENCES [1] “Optimizing software for multi-core processors” white paper Intel Corporation [2] Donald Porter, Silas Boyd-Wickizer, Jon Howell, Reuben Olinsky, Galen Hunt,”Rethinking the Library OS from the Top Down” Microsoft Research,ASPLOS (March-2011) [3] J Chen, LK John,” Efficient program scheduling for heterogeneous multi-core processors” Design Automation Conference, 2009 DAC ‘09m 46
th ACM/IEEE
[4] Max Domeik. “Optimizing Software for Multi-core Processors”, 2007, Intel Corporation. [5] Nandan Tripathi and Amrit Singh, “Analyzing multithreaded applications—identifying
performance bottlenecks on multicore systems”, May 3, 2011 in San Jose, CA.
[6] Erik Hangersten, CTO Acumem, “Finding & Fixing Multicore Performance Bottlenecks in HPC
Applications” [7] Silas Boyd-Wickizer, Robert Morris, M.Frans Kaashoek, “Reinventing Scheduling for Multicore Systems”. Proceedings of the 12th conference on hot topics in operating systems, Berkeley, CA, USA, USENIX Association, (2009) [8] Jiang Lin; Qingda Lu; Xiaoning Ding; Zhao Zhang; Xiaodong Zhang; Sadayappan, P., "Enabling Software management for multicore caches with a lightweight hardware support," High Performance Computing Networking, Storage and Analysis, Proceedings of the Conference on, vol., no., pp.1, 12, 14-20 Nov.2009doi: 10.1145/1654059.1654074
[9] Robert Love (Jul 01, 2003) “CPU Affinity” Linux journal [On-line], Available: http://www.linuxjournal.com/article/6799 [May.13, 2014]. [10] Ravi Saive (March 4, 2013)” 12 TOP Command Examples in Linux” Tecmint.com. Available: http://www.tecmint.com/12-top-command-examples-in-linux/ [May, 13, 2014] [11] RAMESH NATARAJAN (SEPTEMBER 14, 2011) “15 Practical Linux HTOP Examples” TheGeekStuff, Available: http://www.thegeekstuff.com/2011/09/linux-htop-examples/ [May 13, 2014] [12] RAMESH NATARAJAN (MARCH 29, 2011) “10 Useful Sar (Sysstat) Examples for UNIX / Linux Performance Monitoring” TheGeekStuff, Available:http://www.thegeekstuff.com/2011/03/sar Examples/ [May 13, 2014]

P. Bala Subramanyam Raju & P. Govindarajulu
International Journal of Computer Science and Security (IJCSS), Volume (8) : Issue (4) : 2014 96
[13] BLFS Development Team (Feb 20, 2014)” Beyond Linux from Scratch” chapter 12 Sysstat 10.2.1. Availability: http://www.linuxfromscratch.org/blfs/view/svn/general/sysstat.html [May 13, 2014]
[14] NIX CRAFT (JUNE 27, 2009 · UPDATED JANUARY 1,2014)” 20 Linux System
Monitoring Tools Every SysAdmin Should Know” NIX CRAFT
Availability:http://www.cyberciti.biz/tips/top-linux-monitoring-tools.html [may 13,2014].
[15] Don Domingo,Laura Bailey(2011) “Optimizing subsystem throughput in Red Hat Enterprise
Linux 6” Performance Tunning Guide Availability:
https://access.redhat.com/site/documentation/en-US/Red_Hat_Enterprise_Linux/6/html-
single/Performance_Tuning_Guide/index.html [May 13,2014]. [16] Rick Kufrin Availability:http://perfsuite.ncsa.illinois.edu/[May 13, 2014]. [17] Rkufrin (Feb 20,2013) “PerfSuite” Sourceforge Availability: http://sourceforge.net/projects/perfsuite/[May 13, 2014]. [18] Lana Brindley, Alison Young(2011) “Red Hat Enterprise MRG 1.3” Tuna User Guide Avaialability:https://access.redhat.com/site/documentation/en-US/Red_Hat_Enterprise_MRG/1.3/html-single/Tuna_User_Guide/index.html [May 13, 2014]. [19] http://www.linuxjournal.com/article/6799. [20] https://www.kernel.org/pub/linux/kernel/people/rml/cpu-affinity/. [21] Availability: http://ark.intel.com/products/75123 [May 13, 2014]. [22] Availability: http:// www.kernel.org [May 13, 2014]. [23] Availability: http://fedoraproject.org [Jun 04, 2014]. [24] Availability: http://www.netbeans.org [May 13, 2014].