PHYSIOLOGICAL STRUCTURE AND SINGLE-CELL ACTIVITY …
56
8 PHYSIOLOGICAL STRUCTURE AND SINGLE-CELL ACTIVITY IN MARINE BACTERIOPLANKTON PAUL A. DEL GIORGIO De ´ partement des Sciences Biologiques, Universite ´ du Que ´ bec a ` Montre ´ al, CP 8888, succ. Centre Ville, Montre ´ al, Que ´ bec, Canada H3C 3P8 JOSEP M. GASOL Institut de Cie ` ncies del Mar, CMIMA (CSIC), Passeig Marı ´tim de la Barceloneta 37–49, 08003 Barcelona, Catalunya, Spain INTRODUCTION Generations of microbiologists have pondered over the issue of bacterial activity and whether most bacteria in the environment are “active,” “inactive,” or “dormant” (Stevenson 1978). This is a question with clear practical implications, in terms of food, sanitary, and clinical microbiology, as well as profound ecological implications. The issue started to be debated in earnest within the aquatic microbial community roughly at the time researchers were developing new methods to estimate the total abundance of aquatic bacteria, since some of the first stains used were thought to respond differently depending on the RNA content of single bacterial cells (see, e.g., Francisco et al. 1973). It was not until bacteria were recognized as being not only very abundant, but also active, that the notion of microbes as important partners in the marine food web gained widespread recognition (Pomeroy 1974). The early studies using radiotracer incorporation showed surprisingly high rates of bacterial Microbial Ecology of the Oceans, Second Edition. Edited by David L. Kirchman Copyright # 2008 John Wiley & Sons, Inc. 243
Transcript of PHYSIOLOGICAL STRUCTURE AND SINGLE-CELL ACTIVITY …

8PHYSIOLOGICAL STRUCTUREAND SINGLE-CELL ACTIVITY INMARINE BACTERIOPLANKTON
PAUL A. DEL GIORGIODepartement des Sciences Biologiques, Universite du Quebec a Montreal,CP 8888, succ. Centre Ville, Montreal, Quebec, Canada H3C 3P8
JOSEP M. GASOLInstitut de Ciencies del Mar, CMIMA (CSIC), Passeig Marıtim de la Barceloneta 37–49,08003 Barcelona, Catalunya, Spain
INTRODUCTION
Generations of microbiologists have pondered over the issue of bacterial activity andwhether most bacteria in the environment are “active,” “inactive,” or “dormant”(Stevenson 1978). This is a question with clear practical implications, in terms offood, sanitary, and clinical microbiology, as well as profound ecological implications.The issue started to be debated in earnest within the aquatic microbial communityroughly at the time researchers were developing new methods to estimate the totalabundance of aquatic bacteria, since some of the first stains used were thought torespond differently depending on the RNA content of single bacterial cells (see,e.g., Francisco et al. 1973). It was not until bacteria were recognized as being notonly very abundant, but also active, that the notion of microbes as important partnersin the marine food web gained widespread recognition (Pomeroy 1974). The earlystudies using radiotracer incorporation showed surprisingly high rates of bacterial
Microbial Ecology of the Oceans, Second Edition. Edited by David L. KirchmanCopyright # 2008 John Wiley & Sons, Inc.
243
biomass production and of DNA replication, so clearly there had to be active bacterialcells in the oceans. The question then arose as to how this activity was distributedamong the 105–106 cells that are on average present in 1 mL of ocean water(Hoppe 1976; Stevenson 1978). Did all these cells have roughly the same level ofmetabolic activity, or was the bulk of bacterioplankton activity concentrated in afew key players? Marine microbial ecology has gone a long way since those earlystudies, but the question is as valid and relevant today as it was back then.
That complex aquatic bacterial assemblages harbor a wide range of single-cellmetabolic activities as well as of physiological states is neither surprising normuch contested nowadays. Yet, in spite of the simplicity of this basic premise, theactual description and quantification of this metabolic and physiological hetero-geneity have proven elusive, and its underlying mechanisms, as well as its ecologicaland evolutionary consequences, have been very difficult to address in practice(Mason et al. 1986; Koch 1997; Kell et al. 1998; Smith and del Giorgio 2003).Under the term “bacterial single-cell activity,” various authors throughout the yearshave lumped together a number of very different cellular processes, including celldivision rate, single and complex substrate uptake, respiratory activity, protein syn-thesis, intracellular enzyme activity, membrane potential and polarity, membraneintegrity, ultrastructural characteristics, nucleic acid and other macromolecular con-tents, motility, and the list continues. While all these different aspects of cell struc-ture, metabolism, and physiology are surely connected, the links that exist betweenthem are complex, with feedbacks, compensatory mechanisms, and nonlinearresponses, so that information on any particular cell function does not necessarilyallow inferences about the others (Smith and del Giorgio 2003). In this chapter,we refer to the ensemble of these single-cell characteristics and processes as the“physiological structure” of bacterial assemblages. As we hope to make evident inthis chapter, this structure can be neither described nor understood on the basis ofany one single aspect of cell function.
In spite of the very incomplete descriptions of the physiological structure of bac-terioplankton that we currently have, some patterns are emerging: the evidence con-verges to suggest that while many bacterial cells appear to be intact, many of these donot seem to have detectable levels of activity, at least with the methods that are cur-rently available. In addition, in all assemblages studied to date, there seems to be anon-negligible proportion of cells that are either damaged or dead. The presence ofsignificant numbers of these cells in almost all assemblages studied begs the question:Why are there so many apparently inactive, damaged, and dead cells in all aquaticsystems? What are the factors that induce cell inactivation and damage? How canthese cells persist in the assemblage, and what is their role in community functioningand the maintenance of genetic diversity? How and when does individual cell activityrelate to phylogenetic composition? Recent technical and conceptual developmentsare providing the tools to at least begin to address some of these questions.
In this chapter, we review the current state of knowledge and the technical andconceptual progress that has been made in the past two decades in the study of thesingle-cell characteristics and of the physiological structure of marine bacterioplank-ton. There are five main issues concerning the physiological structure of marine
244 SINGLE-CELL ACTIVITY IN MARINE BACTERIOPLANKTON
bacterial assemblages that we address in this chapter: (1) the approaches used to probevarious aspects of bacterial activity and physiology at the single cell level; (2) theconnections that exist between these various cell functions; (3) the environmentaland biological factors that influence the different aspects of bacterial physiologyand metabolism; (4) the empirical findings concerning the distribution of single-cell bacterial activity and the physiological structure of marine bacterioplanktonassemblages; and (5) the biogeochemical, ecological, and evolutionary significanceof the resulting patterns of cellular activity. It is the goal of this chapter to providea conceptual framework to help interpret and integrate the data that have been gener-ated in the last few years concerning the physiological structure of bacterioplanktonassemblages.
DISTRIBUTION OF PHYSIOLOGICAL STATES INBACTERIOPLANKTON ASSEMBLAGES
The Concept of “Physiological Structure” of BacterioplanktonAssemblages
The physiological structure of bacterioplankton is the distribution of cells in differentphysiological categories within the assemblage. The physiological structure is akin tothe “phylogenetic structure” of an assemblage, except that the classification of organismsbased on “phylogenetic units” is replaced by one based on “physiological state units.”The challenge in microbial ecology has precisely been how to define these units.Metabolic activity and cell physiology are generally not discreet variables—they arerather expressed as a continuum that is impossible to capture by any single method.Cells must thus be grouped into artificial categories that are essentially operational,depending directly on the characteristics and thresholds of the methods used (see below).
The physiological structure of bacterioplankton, that is, the distribution within theassemblage of cells in different physiologic categories, is regulated by two majorgroups of factors. On the one hand, there are the environmental and phylogeneticfactors that influence the level of activity and physiological response of individualbacterial cells. It is unlikely that cells from different bacterial strains and taxarespond identically to environmental stimuli, and since in any bacterioplanktonassemblage there are many coexisting bacterial phylotypes, for any combinationof environmental factors (e.g., salinity, and rate of supply and nature of the organicsubstrates and nutrients) there must necessarily be a diversity of metabolic andphysiological responses.
The second major aspect of the regulation of the physiological structure of bacterio-plankton is imposed by factors that regulate not the activity but the loss and persist-ence of these different categories of cells in the assemblage. For example, there isnow evidence that protists may selectively graze on the more active cells (delGiorgio et al. 1996), and that viruses may preferentially infect cells that aregrowing and have higher levels of metabolism (Weinbauer 2004), such that thesecells at the high end of the activity spectrum may be subjected to higher removal
DISTRIBUTION OF PHYSIOLOGICAL STATES IN BACTERIOPLANKTON 245
rates than the average cell in the assemblage. Thus, the proportion of these cells in agiven assemblage is not a simple function of the rates of cell division and activation,but rather depends as well on the loss rates. Likewise, because of their size, and alsothe relative recalcitrance of their cellular components (see, e.g., McCarthy et al.1998), dead or inactive bacteria may remain suspended in plankton for longperiods and thus accumulate in the assemblage even if the rates at which they aregenerated are low.
There are no doubt interactions and feedbacks between these two levels of controlof physiological structure. For example, viral infection and the resulting bacterial lysistransfers cells from the active to the injured or dead pool, but, in doing so, releasesorganic carbon and nutrients that may induce the activation of dormant cells, orenhances the growth rates of cells that are already active. It is thus the net balancebetween levels of regulation (i.e., rates of activation, inactivation, or death) and selec-tive removal, persistence, or loss that determines the actual proportion of cells indifferent physiological categories found in aquatic bacterioplankton assemblages.We focus on the description of the physiological structure, as well as on these differ-ent aspects of regulation in the following sections.
The distribution of cells into different physiological categories is termed the“physiological structure” of bacterioplankton:
† Within a bacterial assemblage, there is a continuum of activity: from dead tohighly active cells.
† The categories used to describe the physiological structure are operational,and depend on the methods used.
† The physiological structure is related, albeit in complex ways, to the sizestructure of the community, as well as to the phylogenetic structure.
† The physiological structure is dynamic; that is, the proportions of cells in variousphysiological states may vary on short time scales and small spatial scales.
Starvation, Dormancy, and Viability in Marine Bacterioplankton
One issue at the center of the concept of the physiological structure concerns thedifferent adaptive strategies developed by aquatic bacteria to cope with a dilute andfluctuating environment, and the cellular physiological states associated with thesestrategies. In particular, and as we will see below, the evidence to date suggeststhat, in all aquatic ecosystems, there is a fraction, often large, of bacterial cells thatdo not have measurable metabolic activity but that nevertheless retain cellular inte-grity. The marine microbial literature abounds in references to “dormant,” “latent,”“starved,” “quiescent,” and “inactive” bacteria to describe these cells. These termsare often used quite loosely to denote absence or low levels of bacterial activity,but dormancy, starvation response, and slow growth are not synonymous, becausethey are associated with different life strategies and ecological consequences.
246 SINGLE-CELL ACTIVITY IN MARINE BACTERIOPLANKTON
Starvation, that is, the presence of organic substrates below the threshold of theuptake capacities or of the minimum cell requirements, is the most obvious causefor the inactivation of bacterial cells in aquatic ecosystems, and is the one that hasbeen traditionally invoked to explain differences in cell activity within and amongassemblages (Kjelleberg et al. 1993; Morita 1997). The physiological, molecular,and genetic basis of the starvation response has been studied mostly in laboratorycultures of Vibrio spp. and Escherichia coli (Morita 1997; Kjelleberg et al. 1993;Koch 1997), and a handful of marine isolates (Morita 1997), including the marinebacterium Sphingomonas sp. (Fegatella and Cavicchioli 2000). All cultured strainsexplored to date appear to have some systematic response to starvation, regulatedby several genes, which involves a complex series of morphological as well as mole-cular and physiological changes: reduction in size and changes in cell shape, changesin macromolecular composition, as well as the synthesis of specific proteins, changesin nucleic acid structure, and cell miniturisation (Nystrom et al. 1992; Ihssen and Egli2005). Some of the changes are geared to maximizing substrate uptake; others are toenable the cell to quickly resume synthesis and growth if conditions become favor-able; and yet others are to protect the cell against cell damage or degradation inthe absence of sufficient energy and carbon supply; there is also protection againstpossible sudden carbon surfeit that could have negative consequences to the cells(Koch 1997). In addition, the starvation-related changes may confer protectionagainst other stresses, such as ultraviolet (UV) or temperature shock, viral infection,and even protistan grazing and digestion (Nystrom et al. 1992), and this cross-protection does not necessarily exist for cells that have low levels of metabolismand are simply growing slowly.
Dormancy, on the other hand, is a response to stress, not just to carbon starvation,but also to osmotic, temperature, water, and other types of environmental stresses,also involving structural and biochemical changes that function to keep the cell ina state of suspended animation (Koch 1997). In this regard, dormancy could beviewed as the final and most extreme stage of the starvation response (Kjelleberget al. 1993). Bacteria in the dormant state do not undergo cell division, and functionat very low metabolic rates or have complete metabolic arrest (Kjelleberg et al. 1993;Barer and Harwood 1999). When environmental conditions change and becomefavorable, dormant bacteria can (in theory) resume cell division. Dormancy involvesadaptive mechanisms, but not morphological differentiation such as sporulation, andcells may remain in a dormant state for extended periods of time without significantloss of cellular integrity (Roszak and Colwell 1987; Barer and Harwood 1999). Aswith the starvation-related process, dormant cells may have increased resistance toa range of environmental stresses (Kell et al. 1998).
Aspects of cell dormancy are related to the concept of cell culturability. Intraditional microbiology, the capacity of cells to multiply in artificial media wasused as the main criteria for bacterial viability. This definition had to be revisedwhen it become clear that there were cells that lost their ability to grow in culturebut nevertheless remained alive in a state that was later termed “viable but not cultur-able” (VBNC) (Roszak and Colwell 1987). A VBNC cell is one that persists intact inthe environment, but that does not divide in culture. The cell must retain cellularintegrity, an intact membrane, RNA and DNA, and potential for protein synthesis;
DISTRIBUTION OF PHYSIOLOGICAL STATES IN BACTERIOPLANKTON 247
a VBNC cell may also show measurable levels of cellular activity in terms of sub-strate uptake, respiration, or protein turnover (Gribbon and Barer 1995; Kell et al.1998). Gram-negative bacteria, such as Vibrio cholerae, V. vulnificus, and E. coli,have been reported to enter this VBNC state, from which they are able to return toa culturable state under certain conditions (Colwell 2000; Oliver 2000). There hasbeen debate as to whether the VBNC state actually exists in nature or if it is theresult of experimental conditions (Kell et al. 1998; Oliver 2000). The importanceof this concept from a sanitary and clinical viewpoint is the realization that culturabil-ity cannot be used as the ultimate indicator of cellular viability or survival. Kell et al.(1998) point out that dormancy refers to cells that have negligible activity but that areultimately culturable, whereas VBNC cells are metabolically active but noncultur-able, but this criterion can only be applied to strains that are easily culturable inthe laboratory. In this regard, aquatic microbial ecologists recognized long ago thatalthough most marine bacteria cannot be cultured, they should not be considereddead or non-viable (see, e.g., Staley and Konopka 1985; Amann et al. 1990).
Finally, many marine bacterial isolates are naturally slow-growing under ambientconditions (Schut et al. 1997; Eguchi et al. 2001; Rappe et al. 2002), even underoptimum conditions. Slow growth can therefore be both a stage in the response toextreme starvation and an adaptive strategy of marine bacteria. In either case,growth (even slow growth) requires the operation and maintenance of a largenumber of cellular processes, including transport and biosynthesis systems, andthere are thermodynamic constraints on how slowly these systems can effectivelyoperate (Chesbro et al. 1990). For example, at very low substrate and energyfluxes, there is a danger associated with incomplete synthesis of macromolecules,or the degradation of newly synthesized compounds, with negative effects on cellgrowth and survival (Koch 1997). In pure culture, responses to extreme carbon star-vation are heterogeneous, with some cells taking up substrate and continuing slowsynthesis and growth, and others not, and instead entering dormancy, suggestingthat there is a choice of energy expenditure even in situations of extreme lack of sub-strates or unfavorable environmental conditions (Koch 1997).
What are then the costs and benefits associated with entering dormancy, asopposed to the strategy of maintaining low growth rates and dividing until thermo-dynamically and physically impossible? The latter strategy implies cell injury anddeath if unfavorable conditions persist; the former implies decreased cell deathover extended exposure to unfavorable conditions but increased expenditures interms of the dormancy response. This question has recently been explored throughmodeling. Bar et al. (2002) modeled the outcome of two cyanobacterial populationsthat are capable or incapable of becoming dormant in response to lack of water. Theyconcluded that under a constant supply of water (even if the supply is extremely low),the dormant strategy does not provide any benefit, and it can, instead, decrease thechances of survival of the population. Konopka (2004) also modeled two bacterialpopulations, one entering dormancy and the other not making this transition, andfound that the cells capable of entering a dormant state would be favored only insituations where the periodicity of substrate inputs is long compared with theminimum doubling time of the bacterium. These results point to the fact that
248 SINGLE-CELL ACTIVITY IN MARINE BACTERIOPLANKTON

intermittency and microscale patchiness of resource supply probably play as large a roleas the actual rate of supply in terms of shaping bacterial responses in aquatic ecosystems.
The starvation response and the processes leading to cell dormancy profoundly alterthe physical and biochemical properties of cells relative to slow-growing cells, and this inturn influences how the cell interacts with both its physical and biological environments.Whether bacterioplankton cells are intrinsically slow-growing, in a starvation/survivalmode, or dormant sensu stricto is not just a methodological or philosophical issue butrather one that has significant ecological consequences. In practice, however, it is atpresent difficult, if not impossible, to differentiate in natural communities intrinsicallyslow-growing cells from those that are undergoing a starvation response. In addition, itis also difficult to differentiate truly dormant cells from those that have low levels ofmetabolic activity. In the rest of this chapter, we will refer to “inactive” cells to encompassthese different physiological categories, acknowledging that this represents a majoroversimplification that needs to be corrected in the future.
Dormancy, starvation-survival, latency, slow growth, and inactivity are oftenused interchangeably to denote low levels of cellular activity in marine bacteria,but these terms are not synonyms and refer to different states:
† Under conditions of extreme substrate and energy deprivation, marine bac-teria may undergo a “starvation” response.
† The starvation response is regulated by specific genes, and involves cellminiaturization and profound changes in macromolecular composition,with the synthesis of specialized protective proteins.
† Prolonged starvation may lead to cell “dormancy,” which is a state of completemetabolic arrest that allows long-term survival under unfavorable conditions.Cells in a dormant state are more resistant to environmental stresses thanactive cells.
† There are costs and benefits associated with entering dormancy as opposed tomaintaining a slow level of metabolic activity and growth as a response tolow substrate availability.
† Resource patchiness and temporal variability play a major role in shaping thesurvival strategies of marine bacteria, whether it be slow growth, starvationresponse, or dormancy.
† Microbiologists have further described the viable but nonculturable(VBNC) state, based on the inability of strains to grow in artificial media.
† The VBNC state is not analogous to cell dormancy, because in the former thecells may have significant metabolic activity, whereas in the latter cells haveno measurable metabolic activity but retain the capacity to reproduce onplates. Since most marine bacteria cannot be grown in plates even if activelygrowing in the ocean, this concept has little applicability to the ecology ofnaturally occurring marine bacteria.
DISTRIBUTION OF PHYSIOLOGICAL STATES IN BACTERIOPLANKTON 249
DESCRIBING THE PHYSIOLOGICAL STRUCTUREOF BACTERIOPLANKTON
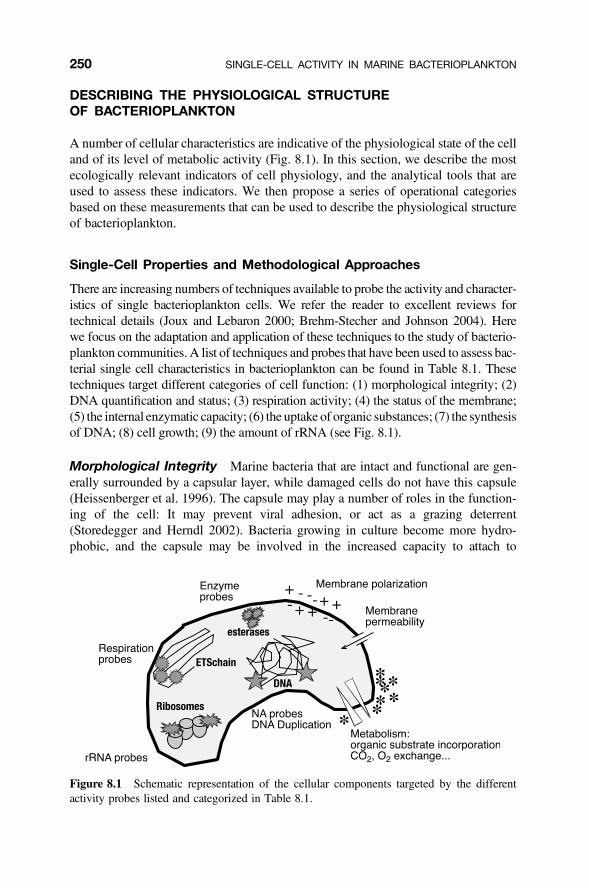
A number of cellular characteristics are indicative of the physiological state of the celland of its level of metabolic activity (Fig. 8.1). In this section, we describe the mostecologically relevant indicators of cell physiology, and the analytical tools that areused to assess these indicators. We then propose a series of operational categoriesbased on these measurements that can be used to describe the physiological structureof bacterioplankton.
Single-Cell Properties and Methodological Approaches
There are increasing numbers of techniques available to probe the activity and character-istics of single bacterioplankton cells. We refer the reader to excellent reviews fortechnical details (Joux and Lebaron 2000; Brehm-Stecher and Johnson 2004). Herewe focus on the adaptation and application of these techniques to the study of bacterio-plankton communities. A list of techniques and probes that have been used to assess bac-terial single cell characteristics in bacterioplankton can be found in Table 8.1. Thesetechniques target different categories of cell function: (1) morphological integrity; (2)DNA quantification and status; (3) respiration activity; (4) the status of the membrane;(5) the internal enzymatic capacity; (6) the uptake of organic substances; (7) the synthesisof DNA; (8) cell growth; (9) the amount of rRNA (see Fig. 8.1).
Morphological Integrity Marine bacteria that are intact and functional are gen-erally surrounded by a capsular layer, while damaged cells do not have this capsule(Heissenberger et al. 1996). The capsule may play a number of roles in the function-ing of the cell: It may prevent viral adhesion, or act as a grazing deterrent(Storedegger and Herndl 2002). Bacteria growing in culture become more hydro-phobic, and the capsule may be involved in the increased capacity to attach to
Figure 8.1 Schematic representation of the cellular components targeted by the differentactivity probes listed and categorized in Table 8.1.
250 SINGLE-CELL ACTIVITY IN MARINE BACTERIOPLANKTON

TA
BL
E8.
1A
ctiv
ity
Pro
bes
Use
dfo
rM
onit
orin
gB
acte
rial
Via
bilit
ya
Pro
be(s
)bM
ode
ofA
ctio
nM
etho
dcK
eyR
efer
ence
s
Res
pira
tion
INT
Red
uctio
nby
dehy
drog
enas
esO
MZ
imm
erm
anet
al.
(197
8)C
TC
,XT
TIn
dica
tor
ofre
spir
ator
y-ch
ain
activ
ityE
F,F
C,S
pect
del
Gio
rgio
etal
.(1
997)
Mem
bran
eP
olar
izat
ion
and
Mem
bran
eP
oten
tial
(inc
ludi
ngdy
e-ex
clus
ion
prob
es)
Eth
Br,
Eth
-D2
Exc
lude
dby
livin
gce
llsE
F/F
CS
chum
ann
etal
.(2
003)
PI
Exc
lude
dby
livin
gce
llsE
F/F
CW
illia
ms
etal
.(1
998)
Rh1
23A
ccum
ulat
edin
live
cells
FC
Dav
eyet
al.
(199
9)C
alca
fluo
rw
hite
,Tin
opal
CB
S-X
,...
Exc
lude
dby
livin
gce
llsF
CM
ason
etal
.(19
95)
Car
bocy
anin
es(c
atio
nic)
(JC
-1,D
iOC
6(3
),D
iOC
2(3
))E
xclu
ded
byliv
ing
cells
FC
Mas
onet
al.(
1995
)
Oxo
nols
(ani
onic
)(D
iBaC
4(3
),O
xono
lV
,V
I)E
xclu
ded
byliv
ing
cells
FC
del
Gio
rgio
and
Bou
vier
(200
2)
TO
PR
O-1
,TO
PR
O-3
TO
PR
O-3
Exc
lude
dby
livin
gce
llsE
F/F
CM
aran
ger
etal
.(2
002)
Syt
oxG
reen
Exc
lude
dby
livin
gce
llsE
F/F
CL
ebar
onet
al.(
1998
)
Intr
acel
lula
rE
nzym
es
FD
Gb
-gal
acto
sida
seac
tivity
FC
Nir
etal
.(1
990)
FD
Aan
dits
deri
vativ
es:
6CF
DA
,ca
lcei
nbl
ueA
M,S
FD
A,
BC
EC
F_A
M;C
hem
chro
me
B,V
6
Cle
aved
byin
trac
ellu
lar
enzy
mes
EF/
SP
C/
FC
Qui
nn(1
984)
and
Cat
ala
etal
.(19
99)
(Con
tinue
d)
251

TA
BL
E8.
1C
ontin
ued
Pro
be(s
)bM
ode
ofA
ctio
nM
etho
dcK
eyR
efer
ence
s
Cel
lTra
cker
Gre
enC
MF
DA
Est
eras
esE
FS
chum
ann
etal
.(2
003)
CM
AC
-Leu
Am
inop
eptid
ases
EF
Sch
uman
net
al.
(200
3)
Nuc
leic
Aci
dSt
ate
AO
Dif
fere
ntco
lor
whe
nlin
ked
toD
NA
orot
her
thin
gsF
CD
arzy
nkie
wic
zan
dK
apus
cins
ki(1
990)
DA
PI
(or
SG
1)de
stai
ning
Elim
inat
esst
aini
ngof
non-
DN
AE
FZ
wei
fel
and
Hag
stro
m(1
995)
Syt
o13,
Syb
rGre
en,T
OT
OT
OP
RO
Sep
arat
esat
leas
ttw
opo
pula
tions
base
don
DN
A/R
NA
cont
ent
FC
Rob
erts
onan
dB
utto
n(1
989)
,Li
etal
.(19
95)
Dou
ble/
Mul
tiple
Stai
ning
Pro
tcol
s
Dou
ble
“liv
e/de
ad”
stai
nsB
acL
ight
,N
AD
S,.
..L
ive/
dead
EF/
FC
Joux
etal
.(1
997a
),G
rego
riet
al.(
2001
)
FD
A/P
I;B
CE
CF
_AM
/PI
Act
ivity
/dea
dF
CY
amag
uchi
and
Nas
u(1
997)
EU
BF
ISH
prob
es/P
I/D
AP
iA
ctiv
e/de
ad/
inac
tive/
rece
ntly
dead
/liv
ebu
tin
activ
eE
FW
illia
ms
etal
.(1
998)
,H
owar
d-Jo
nes
etal
.(2
001)
Cel
lD
ivis
ion/
Gro
wth
DV
CL
ive
cells
elon
gate
whe
nin
pres
ence
ofan
tibio
tics
EF/
FC
Kog
ure
etal
.(19
79),
Joux
and
Leb
aron
(199
7)
Mic
roco
lony
form
atio
nC
apab
ility
ofpr
oduc
ing
asm
all
colo
nyO
M/
EF
Jann
asch
and
Jone
s(1
959)
,Sim
uet
al.(
2005
)B
rdU
imm
unod
etec
tion
Inco
rpor
ated
into
DN
Ain
stea
dof
TdR
EF
Urb
ach
etal
.(1
999)
,Per
ntha
ler
etal
.(20
02)
252
Mis
cella
neou
s
c-S
NA
RF
-1A
MIn
trac
ellu
lar
pHF
CL
eyva
let
al.
(199
7)16
SrR
NA
prob
esD
etec
tion
ofri
boso
mes
EF/
FC
Am
ann
etal
.(1
990)
,Bou
vier
and
del
Gio
rgio
(200
3)A
As,
gluc
ose,
thym
idin
eM
AR
Org
anic
subs
trat
ein
corp
orat
ion
EF
Hop
pe(1
976)
,Tab
oran
dN
eiho
f(1
984)
,Pe
dros
-Alio
and
New
ell
(198
9),K
arne
ran
dFu
hrm
an(1
997)
,Cot
trel
lan
dK
irch
man
(200
0)
aU
pdat
edfr
omT
able
3in
Gas
olan
dde
lG
iorg
io(2
000)
.A
nex
pand
edve
rsio
nof
this
tabl
eca
nbe
foun
din
the
web
appe
ndix
(ww
w.ic
m.c
sic.
es/
bio/
pers
onal
/gas
ol/
chap
terK
irch
man
book
).bIN
T,
2-(p
-iod
ophe
nyl)
-3-p
-(ni
trop
heny
l)-5
-phe
nylte
traz
oliu
mch
lori
de;
AO
,ac
ridi
neor
ange
;D
API
,40
,-6-
diam
idin
o-2-
phen
ylin
dole
;E
thB
r,et
hidi
umbr
omid
e;S
G1,
Syb
rGre
enI;
CT
C,
5-cy
ano-
2,3-
dito
lylte
traz
oliu
mch
lori
de;
XT
T,
sodi
um30
-[1-
[(ph
enyl
amin
o)-c
arbo
nyl]
-3,4
-tet
razo
lium
-bis
(4-m
etho
xy-6
-nitr
o)be
nzen
esul
foni
cac
idhy
drat
e;E
th-D
2,et
hidi
umho
mod
imer
-2;
PI,
prop
idiu
mio
dide
;R
h123
,rh
odam
ine1
23;
DiB
AC
4(3
),bi
s(1,
2-di
buty
lbar
bitu
ric
acid
)tr
imet
hine
oxon
ol;
DIO
C,
diet
hylo
xaca
rboc
yani
ne;
DiO
C6(3
),3,
30-d
ihex
ylox
acar
bocy
anin
eio
dide
;6C
FD
A,
6-ca
rbox
yfluo
resc
ein
diac
etat
e;F
DG
,fl
uore
scei
n–
gala
ctop
yran
ose;
FD
A,
fluo
resc
ein
diac
etat
e;C
MA
C-L
eu,
7-am
ino-
4-ch
loro
met
hylc
oum
arin
,L-l
euci
neam
ide,
hydr
ochl
orid
e;C
MF
DA
,5-
chlo
rom
ethy
lfluo
resc
ein
diac
etat
e;B
CE
CF-
AM
,20
,70 -
bis(
2-ca
rbox
yeth
yl)-
5-(a
nd-6
)-ca
rbox
yfluo
resc
ein
acet
oxy
met
hyl
este
r;M
AR
,m
icro
auto
radi
ogra
phy;
DV
C,
dire
ctvi
able
coun
t;B
rdU
,5-
brom
o-20
-deo
xyur
idin
e;N
AD
S,
nucl
eic
acid
doub
le-s
tain
ing
prot
ocol
.c E
F,ep
ifluo
resc
ence
mic
rosc
opy;
FC
,fl
owcy
tom
etry
;S
PC
,so
lid-p
hase
cyto
met
ry;
OM
,op
tical
mic
rosc
opy;
Spe
ct,
spec
trop
hoto
met
ry.
253
surfaces (van Loodsrecht et al. 1987). Production of a capsule might be an indicationof nutrient limitation (van Loodsrecht et al. 1987) and could also be a mechanism toenhance nutrient and substrate acquisition. Damaged and dead cells usually lack acapsule, show shrunken or partially deteriorated membranes, and may lackintracellular structures such as cytoplasm and ribosomes (Heissenberger et al.1996). The capsules can be observed by transmission electron microscopy(TEM), or by a simpler microscopic method using Congo Red or Maneval’s stainof cells transferred from filters onto a gelatin-covered slide (Storedegger andHerndl 2001).
Cellular Composition The ionic composition of the bacterial cells can give hintsof relative activity (Fagerbakke et al. 1999), and also the macromolecular compo-sition of bacterial cells is not fixed but rather varies as a function of cell size, activity,physiological state, and even phylogenetic composition (Kjelleberg et al. 1993).There is a wide plasticity in composition within a given bacterial organism, whichis evident, for example, during the starvation process (Roszak and Colwell 1987;Kjelleberg et al. 1993).
Some of these properties can be examined by flow cytometery. The amount ofintracellular nucleic acids is determined from the fluorescence of stains that attachpreferentially to DNA, RNA or both. While DAPI, and to a lesser extent, acridineorange, are the standard fluorochromes for determining bacterial abundance inplankton samples using epifluorescence, a new generation of blue-excitable stains,including Syto13, PicoGreen, TOTO, SybrGreen, and SybrGold, are increasinglybeing used, particularly in combination with flow cytometry. The latter techniqueallows the simultaneous determination of bacterial abundance and of the amountof fluorescence emitted, and thus the relative nucleic acid content, of individualcells (del Giorgio et al. 1996; Gasol and del Giorgio 2000).
One of the most interesting findings is that bacterioplankton cells tend to clusterinto distinct fractions based on differences in the individual cell fluorescence(related to the nucleic acid content) and in the side and forward light scatter signal(see, e.g., Li et al. 1995). There are at least two major fractions: cells with highnucleic acid content (HNA cells) and cells with low nucleic acid content (LNAcells) (Robertson and Button 1989; Li et al. 1995; Gasol et al. 1999; Gasol anddel Giorgio 2000; Lebaron et al. 2002). These cytometric populations are almostalways present regardless of the sample and of the different protocols, stains, andtype of cytometer used, suggesting that these fractions are not methodological arti-facts (Bouvier et al. 2007). The general trend that emerges is that the HNA cellsappear to be not only larger (Troussellier et al. 1999) but also more active, withhigher growth rates than the LNA cells, and that changes in total bacterial abundanceare often associated with changes in this fraction (Gasol and del Giorgio 2000;Lebaron et al. 2002). Several studies have supported the idea that HNA bacteriaare the high-growth component of bacterial assemblages (Gasol et al. 1999;Troussellier et al. 1999; Gasol and del Giorgio 2000; Lebaron et al. 2001;Seymour et al. 2004), because they increase in abundance in mesocosm or dilutionexperiments, while LNA bacteria do not (Gasol et al. 1999; Zubkov et al. 2004).
254 SINGLE-CELL ACTIVITY IN MARINE BACTERIOPLANKTON
However, other studies have shown that LNA also develop in marine dilutionexperiments (Jochem et al. 2004; Longnecker et al. 2006). Cell sorting experimentshave yielded mixed results, some showing higher cell-specific activities of theHNA fraction (Servais et al. 1999; Lebaron et al. 2001, 2002), others showing sub-stantial activity in the LNA fraction as well (Zubkov et al. 2004; Longnecker et al.2005). The evidence to date suggests that the simple dichotomy of HNA ¼ activeand LNA ¼ inactive is an oversimplification (Bouvier et al. 2007), and that LNAcannot routinely be considered to be inactive or dead.
Nucleoid Zweifel and Hagstrom (1995) proposed a de-staining procedure thatstains with DAPI only those cells with a compacted nucleoid (NucC, nucleoid-containing cells). The standard DAPI procedure, they claimed, stains the DNA andalso other cellular components. An isopropanol rinse following DAPI stainingremoves the nonspecific staining and leaves only the stain associated with DNA,which appears as a yellowish spot. Choi et al. (1996) proposed some modificationsto the protocol of Zweifel and Hagstrom, yielding higher counts of nucleoid-containing cells.
Electron Transport Activity Probes The activity of the respiratory enzymescan be assayed using tetrazolium salts as indicators of bacterial respiration; theelectrons produced from the electron transport chain in actively respiring bacteriareduce these salts from a soluble form to a dense, insoluble, cell-localized precipitate.These compounds compete with oxygen as electron acceptors. Depending on thetype of salt used, the precipitate is colored or fluorescent. The first application ofthe method was with the probe 2-( p-iodophenyl)-3 (phenyl)-5-phenyltetrazoliumchloride (INT) (Zimmerman et al. 1978). Rodriguez et al. (1992) introduced amodification of the method, based on the fluorogenic tetrazolium dye 5-cyano-2,3-ditolyltetrazolium chloride (CTC), which is reduced to a red-fluorescentformazan molecule that can be detected both with epifluorescence microscopy andwith flow cytometry (del Giorgio et al. 1997; Sieracki et al. 1999; Sherr et al.1999a). The techniques were initially thought to be applicable only to aerobicbacteria, but in anaerobic conditions, particularly during fermentation, the methodsseems to work well (Smith and McFeters 1997), although nonbiologicalreduction may occur in sediments and other reducing environments (Smith andMcFeters 1997).
Some authors have criticized the CTC method, on the basis of the potentialcellular toxicity of the CTC, or because of the low numbers of CTC-positive cellsoften recorded in field studies (Ullrich et al. 1999; Servais et al. 2001). Ullrichet al. (1996) and Servais et al. (2001) both showed inhibitory effects of CTC onbacterial respiration and metabolic activity. On the other hand, Epstein and Rossel(1995) reported that CTC-stained and nonstained benthic bacteria grew equallywell and that the ciliate Cyclidium sp. can survive on a diet of CTC-stained bacteria.Based on flow-cytometric sorting of red-fluorescent particles (assumed to beCTC-labeled bacteria) after incorporation of a radioactive tracer, Servais et al.(2001) concluded that the CTC dye is not suitable for the detection and enumeration
DESCRIBING THE PHYSIOLOGICAL STRUCTURE OF BACTERIOPLANKTON 255
of active bacteria, since the apparent contribution of these cells to total leucineuptake was relatively small, and similar results were later reported by Longneckeret al. (2005). However, recent flow-cytometric observations suggest that part of thediscrepancy might be due to the fact that very active cells might explode as theresult of the CTC-formazan granule formation, and free the granule to the medium.Cell sorting based only on red fluorescence of the granules would miss the mostactive cells, as those would have been destroyed before sorting (Gasol andArıstegui 2007). Overall, it would appear that the CTC method targets the cellswith the highest respiration rates (Sherr et al. 2001; Smith and del Giorgio 2003;Sieracki et al. 1999).
Membrane Integrity and Functionality The bacterial cell membrane plays akey role in the functioning of the cell, and the state of the membrane thus providesmuch information on the general physiological condition of the cell (Brehm-Stecher and Johnson 2004). Several aspects of membrane function are of ecologicalinterest, such as membrane integrity, energization and polarity, and the existence ofpH and ionic gradients. Membrane potential and membrane integrity are two aspectsof cellular function that should be a priori strongly linked, but studies have shown thatthis expectation is not always borne out, because the loss of membrane integrity is notalways accompanied by loss of potential, and vice versa (Novo et al. 2000; delGiorgio and Bouvier 2002).
There are a number of different approaches to probe the state of the cell membrane(Table 8.1). Cell injury and damage results in increased membrane permeability thatcan be assessed using exclusion stains that bind to nucleic acids, such as propidiumiodide (PI), TOPRO, or SYTOX Green (Veldhuis et al. 2001; Roth et al. 1997;Maranger et al. 2002). Because of their molecular weight and structure, these dyescan only enter cells with damaged or “leaky” membranes, and cannot enter cellswith intact membranes (Haugland 2005). Cell injury and death is accompaniedby loss of membrane potential and polarization. The latter can be assessed with theuse of oxonols, negatively charged molecules that are excluded by cells withpolarized membranes (Jepras et al. 1995). For example, DiBAC4(3) is an anionicmembrane potential-sensitive dye that enters cells with depolarized plasma mem-branes and then binds to lipid-containing intracellular material. It has been used todifferentiate live and dead cells (Mason et al. 1995) and to assess the physiologicalchanges of bacteria along salinity gradients (del Giorgio and Bouvier 2002).
Intracellular Enzymatic Activity Various fluorescein esters have already beenused in bacterial viability assays, including fluorescein diacetate (FDA: Chrzanowskiet al. 1984; Diaper et al. 1992), carboxyfluorescein diacetate (CFDA: Dive et al.1988; Miskin et al. 1998), and Chemchrome B (Clarke and Pinder 1998) andCMFDA (Schumann et al. 2003). These esters are uncharged and nonfluorescent,and are passively transported into cells. Internal enzymes (esterases) then hydrolyzethem to fluorescein derivatives, which are charged and fluorescent. In viable cells, themembrane is impermeable to the charged molecules, which, therefore, can accumu-late intracellularly and be detected by fluorescence. Organisms with leaky membranes
256 SINGLE-CELL ACTIVITY IN MARINE BACTERIOPLANKTON
do not retain the fluorescein. Thus, these assays target two aspects of cell function:intracellular enzymatic activity and membrane permeability. The method has someproblems: many bacteria are unable to transport FDA, the fluorescence emissiontends to be weak, and intracellular esterase activity is not always directly coupledto respiration (Diaper et al. 1992).
Uptake of Organic Substances Microautoradiography (MAR) is one of theearliest single-cell methods; the first reports of its use in aquatic microbialecology were published in 1959 (Saunders 1959), and Brock (1967) used it to quan-tify the growth rate of a conspicuous freshwater bacterium. It was used in marinesamples as early as 1976 (Hollibaugh 1976; Hoppe 1976). In this technique,microbial assemblages are incubated with a radiolabeled substrate and cells arethen placed in contact with an autoradiographic emulsion, and subsequent exposureof the emulsion to the radioactive emissions produces silver grain deposits aroundthe cells that are radioactive. Amino acids, acetate, glucose, along with leucineand thymidine were used in the initial studies, but recent studies have expandedto other substrates, such as chitin, N-acetylglucosamine, and even 14CO2. Graindensity may provide further information on the level of substrate uptake by the indi-vidual cells (Cottrell and Kirchman 2003; Sintes and Herndl 2006). In 1999, twoindependent studies showed that it was possible to combine this technique with flu-orescence in situ hybridization (FISH), providing the first insights into the in situsingle-cell activity of specific bacterial groups. A number of acronyms have beenproposed for variations of the same approach, including MAR-FISH (microautora-diography–fluorescence in situ hybridization: Lee et al. 1999), STAR-FISH (sub-strate tracking autoradiography–fluorescence in situ hybridization: Ouverney andFuhrman 1999), and Micro-FISH (microautoradiography–fluorescence in situhybridization: Cottrell and Kirchman 2000).
DNA Synthesis and Replication An alternative to using radioactive com-pounds for measuring bacterial DNA synthesis is to use 5-bromo-20-deoxyuridine(BrdU), which is a thymidine analog. Cells that are synthesizing DNA, and thus inthe process of cell division, incorporate BrdU into DNA, and can be detected byimmunofluorescence using anti-bromodeoxyuridine monoclonal antibodies or iso-lated by immunochemical capture using antibody-coated paramagnetic beads(Urbach et al. 1999; Borneman 1999; Hamasaki et al. 2007). This protocol hasbeen also combined with CARD-FISH to allow the identification of individualgrowing cells (Pernthaler et al. 2002).
Direct Viable Count (DVC) Method The direct viable count method was firstdescribed by Kogure et al. (1979) and was based on incubating samples with the anti-biotic nalidixic acid, which inhibits cell division. Active cells continue to grow butnot to divide, elongating in the process, and these elongated cells can be detectedmicroscopically (or by flow cytometry). The method has been used extensively toassess activity and viability of bacteria both in culture and in the environment(Roszak and Colwell 1987; Kogure et al. 1987; Yokomaku et al. 2000). The treatment
DESCRIBING THE PHYSIOLOGICAL STRUCTURE OF BACTERIOPLANKTON 257
generating elongated bacteria now includes the addition of glycine (Yokomaku et al.2000) and an antibiotic cocktail (Joux and Lebaron 1997).
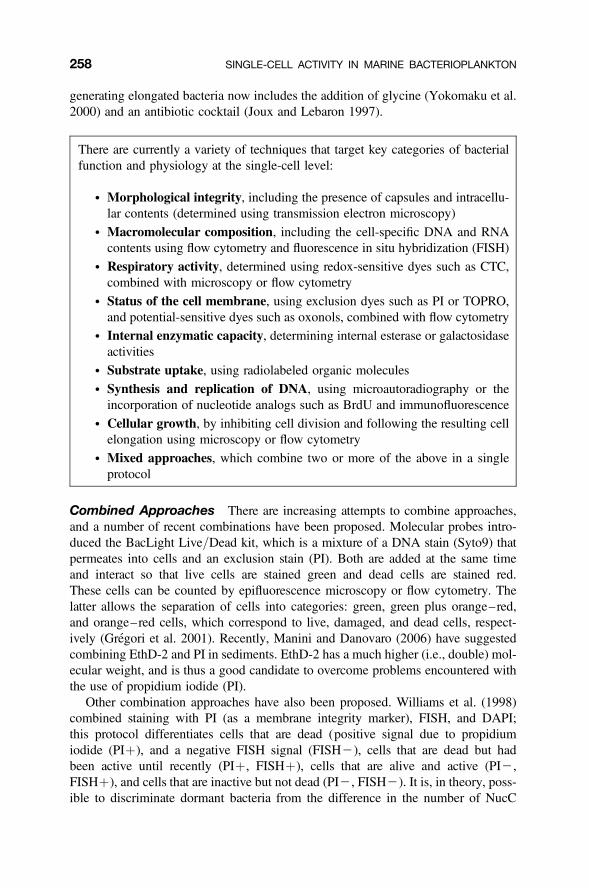
There are currently a variety of techniques that target key categories of bacterialfunction and physiology at the single-cell level:
† Morphological integrity, including the presence of capsules and intracellu-lar contents (determined using transmission electron microscopy)
† Macromolecular composition, including the cell-specific DNA and RNAcontents using flow cytometry and fluorescence in situ hybridization (FISH)
† Respiratory activity, determined using redox-sensitive dyes such as CTC,combined with microscopy or flow cytometry
† Status of the cell membrane, using exclusion dyes such as PI or TOPRO,and potential-sensitive dyes such as oxonols, combined with flow cytometry
† Internal enzymatic capacity, determining internal esterase or galactosidaseactivities
† Substrate uptake, using radiolabeled organic molecules† Synthesis and replication of DNA, using microautoradiography or the
incorporation of nucleotide analogs such as BrdU and immunofluorescence† Cellular growth, by inhibiting cell division and following the resulting cell
elongation using microscopy or flow cytometry† Mixed approaches, which combine two or more of the above in a single
protocol
Combined Approaches There are increasing attempts to combine approaches,and a number of recent combinations have been proposed. Molecular probes intro-duced the BacLight Live/Dead kit, which is a mixture of a DNA stain (Syto9) thatpermeates into cells and an exclusion stain (PI). Both are added at the same timeand interact so that live cells are stained green and dead cells are stained red.These cells can be counted by epifluorescence microscopy or flow cytometry. Thelatter allows the separation of cells into categories: green, green plus orange–red,and orange–red cells, which correspond to live, damaged, and dead cells, respect-ively (Gregori et al. 2001). Recently, Manini and Danovaro (2006) have suggestedcombining EthD-2 and PI in sediments. EthD-2 has a much higher (i.e., double) mol-ecular weight, and is thus a good candidate to overcome problems encountered withthe use of propidium iodide (PI).
Other combination approaches have also been proposed. Williams et al. (1998)combined staining with PI (as a membrane integrity marker), FISH, and DAPI;this protocol differentiates cells that are dead (positive signal due to propidiumiodide (PIþ), and a negative FISH signal (FISH2), cells that are dead but hadbeen active until recently (PIþ, FISHþ), cells that are alive and active (PI2,FISHþ), and cells that are inactive but not dead (PI2, FISH2). It is, in theory, poss-ible to discriminate dormant bacteria from the difference in the number of NucC
258 SINGLE-CELL ACTIVITY IN MARINE BACTERIOPLANKTON
cells, and the number of “live” cells determined by a probe that does not permeatemembranes (see, e.g., Gasol et al. 1999; Luna et al. 2002). Manini and Danovaro(2006) proposed the destaining of SybrGreen I in a way similar to the destainingof DAPI. They combined this procedure with staining by PI or EthD-2, whichallows dead cells (without a visible nucleoid region) to be distinguished from red-stained bacteria with a still-visible nucleoid (NucC) region. These cells (PIþ,NucCþ) are considered to be either cells that died recently or cells competent fortransformation (having large “holes” in the membrane to allow DNA entry). Pirkeret al. (2005) combined MAR and PI, to simultaneously assess the metabolic activityand viability of individual bacterioplankton cells in the North Sea.
Operational Categories of Single-Cell Activity
There has been much debate concerning the effectiveness of some of the methodsdescribed above, particularly in the context of natural bacterial communities charac-terized by low levels of activity and also by relatively mild sources of stress, at leastcompared to laboratory conditions (Ullrich et al. 1996; Karner and Fuhrman 1997;Kell et al. 1998; Colwell 2000; Smith and del Giorgio 2003). The current methodsonly allow us to place bacteria in very broad physiological categories, that is,active or inactive in substrate uptake, or having and intact or injured membranes.The categories themselves are often not well defined, because all the methods havethresholds of detection, and the thresholds themselves vary with the different proto-cols used and sample conditions. The physiological categories obtained are thus oper-ational and in no way absolute (Smith and del Giorgio 2003). In addition, there islikely a large range of activity or physiological states within each of these categories.For example, within the cells that are scored positive for substrate uptake, there isprobably a large range in the actual rates of substrate uptake (see, e.g., Sintes andHerndl 2006). Likewise, there is often a large range in the level of red fluorescenceof cells that are scored as positive to CTC reduction within any given sample (Sherret al. 1999a; Posch et al. 1997).
There are several approaches that link individual cell activity to phylogeneticcomposition, including the following:
† Flow sorting of specific cell fractions (radiolabeled with substrates orstained with specific dyes) followed by molecular analysis of the DNA ofthe sorted fractions
† Autoradiography (radiolabeled substrate uptake) combined with FISH todetermine the identity of substrate-active cells (Micro-FISH, MARFISH)
† Detection of DNA-synthesizing cells through the incorporation of BrdUfollowed by immunocytochemical detection of the target cells withfurther DNA analysis, or FISH identification
DESCRIBING THE PHYSIOLOGICAL STRUCTURE OF BACTERIOPLANKTON 259
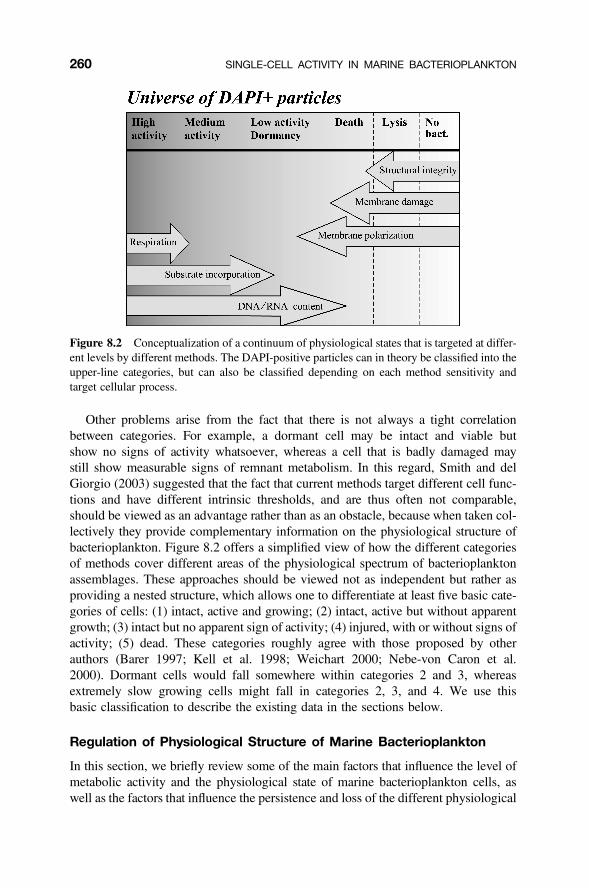
Other problems arise from the fact that there is not always a tight correlationbetween categories. For example, a dormant cell may be intact and viable butshow no signs of activity whatsoever, whereas a cell that is badly damaged maystill show measurable signs of remnant metabolism. In this regard, Smith and delGiorgio (2003) suggested that the fact that current methods target different cell func-tions and have different intrinsic thresholds, and are thus often not comparable,should be viewed as an advantage rather than as an obstacle, because when taken col-lectively they provide complementary information on the physiological structure ofbacterioplankton. Figure 8.2 offers a simplified view of how the different categoriesof methods cover different areas of the physiological spectrum of bacterioplanktonassemblages. These approaches should be viewed not as independent but rather asproviding a nested structure, which allows one to differentiate at least five basic cate-gories of cells: (1) intact, active and growing; (2) intact, active but without apparentgrowth; (3) intact but no apparent sign of activity; (4) injured, with or without signs ofactivity; (5) dead. These categories roughly agree with those proposed by otherauthors (Barer 1997; Kell et al. 1998; Weichart 2000; Nebe-von Caron et al.2000). Dormant cells would fall somewhere within categories 2 and 3, whereasextremely slow growing cells might fall in categories 2, 3, and 4. We use thisbasic classification to describe the existing data in the sections below.
Regulation of Physiological Structure of Marine Bacterioplankton
In this section, we briefly review some of the main factors that influence the level ofmetabolic activity and the physiological state of marine bacterioplankton cells, aswell as the factors that influence the persistence and loss of the different physiological
Figure 8.2 Conceptualization of a continuum of physiological states that is targeted at differ-ent levels by different methods. The DAPI-positive particles can in theory be classified into theupper-line categories, but can also be classified depending on each method sensitivity andtarget cellular process.
260 SINGLE-CELL ACTIVITY IN MARINE BACTERIOPLANKTON
fractions of the community. Chapter 10 explores the factors that influence growth atthe community level. Here, we focus on the factors that influence the physiologicalstate and the metabolic activity of single bacterial cells.
Factors Influencing Physiological State of Bacterial Cellsin Marine Ecosystems
Slow growth and dormancy are certainly not the only physiological states of interestfrom an ecological point of view. Cells are subject to a wide range of environmentalcharacteristics that either enhance metabolic activity or are deleterious and generatestress, and that may ultimately cause cell death. The response of cells to stressdepends greatly on what cellular function is investigated and might vary specifically(Joux et al. 1997a; Agogue et al. 2005). For example, exposure to heat or UV radi-ation had very different impacts on various cellular functions of E. coli (Fiksdal andTryland 1999). Lopez-Amoros et al. (1995a, b) found that stress and mortality causedby starvation did not result in an increase in membrane permeability, and was thusdifficult to detect using traditional exclusion stains. Likewise, the capacity to detectbacteria using FISH is extremely sensitive to osmotic stress and to carbon starvation,but not to cold and other types of physical and chemical stress (Tolker-Nielsen et al.1997; Oda et al. 2000). There is thus no single or simple response to stress, and loss ofa certain function does not necessarily imply loss or degradation of all other func-tions, except in the most extreme cases.
The availability of energy, mainly in the form of organic carbon (or as certaininorganic compounds or light for some bacteria), is perhaps one of the key factorsinfluencing bacterial singe-cell activity in aquatic ecosystems (Kjelleberg et al.1993; Morita 1997; Azam 1998; and see Chapter 10). As discussed above, theresponse of cultured bacteria to extreme carbon limitation has been extensivelystudied, but the question remains: What is starvation from the viewpoint of amarine bacterium, and is extreme starvation the most common state for marine bac-teria? Although much of the ocean is extremely dilute and oligotrophic, this environ-ment is still not analogous to the conditions of complete nutrient deprivation createdin laboratory cultures used to study the starvation response. (Fegatella andCavicchioli 2000). Substrate concentrations in marine waters are indeed extremelylow, due in part to low supply rates, and but also as the result of high turnover ofthese substrates, precisely due to extremely efficient bacterial consumption. It hasoften been assumed that bacteria in oligotrophic marine systems oscillate betweenscenarios of feast or famine (Azam 1998) in terms of substrate availability, but thereality for most oceanic bacteria lies probably somewhere in between. In thisregard, Ferenci (2001) recently introduced the notion of “hungry” bacteria: thosethat experience suboptimal resource conditions that are somewhere between feastand extreme famine. Hungry bacteria develop a whole set of adaptations that are infact distinct from those that characterize the more extreme starvation response.
We do not know to what extent marine bacteria are “hungry” as opposed to“starved,” but it is clear that there is no absolute threshold of carbon limitation/starvation that applies to all bacterial types, so a given level of organic substrate
DESCRIBING THE PHYSIOLOGICAL STRUCTURE OF BACTERIOPLANKTON 261
availability will trigger the starvation response in some bacteria and not in others(Ferenci 2001). There is increasing evidence that phylotypes within broad phylo-genetic groupings may share functional and metabolic traits such as patterns ofsubstrate utilization or intrinsic levels of cellular activity (Cottrell and Kirchman2000; Zubkov et al. 2001; Yokokawa and Nagata 2005).
Exposure to high substrate concentrations can cause cell death in cells that aredormant and in starvation-survival mode (Koch 1997). In fact, typical oligotrophicmarine bacteria, such as Sphingomonas spp. (Schut et al. 1997) and Pelagibacter(Rappe et al. 2002), are unable to grow in rich media, most likely due to an inabilityto deal with high respiration rates and the associated oxidative stress. In marineenvironments bacterial cells need to cope not only with low ambient concentrationsof organic substrates and nutrients, but also, and perhaps more importantly, withhighly intermittent supply at very different spatial and temporal scales. Some ofthese fluctuations may exceed the protective mechanisms of the cells, with deleteriousor lethal consequences to the microorganisms (Koch 1997).
Cells lacking key inorganic nutrients might still consume and respire organic matter,but biomass accumulation and cell division may be severely impeded under nutrientstarvation. This should be reflected in the distribution of bacterial cells with differentphysiological states, as cells would be actively respiring but unable to synthesizenucleic acids. It has been noted that while carbon starvation often leads to cell minia-turization (Morita 1997), acute nutrient limitation may lead to an increase in cell mass(Kjelleberg et al. 1993). Elemental composition may shift according to the physiologi-cal state of cells. For example, bacteria typically have more nitrogen and phosphorusper unit carbon than algae, but unicellular cyanobacteria often have higher carbon inrelation to heterotrophic microorganisms, and this has been interpreted as storage ofcarbon under nutrient deficiency (Heldal et al. 2003). Carbon availability associatedwith inorganic nutrient limitation can translate into the accumulation of excessreserve polymers, greatly increasing cell size. In the “Winnie-the-Pooh” hypothesis(Thingstad et al. 2005), increase in cell size might be seen as a strategy to “dominate”the system and simultaneously optimize uptake and minimize predation.
There are a number of direct as well as indirect effects of light, and particularlyUV, on bacterial physiology. Direct effects include damage to DNA, RNA, andcell membranes (Herndl et al. 1993; Fiksdal and Tryland 1999). Indirect effectsinclude UV-mediated generation of toxic radicals and hydrogen (Xenopoulos andBird 1997); increased substrate availability through photochemical degradation ofrefractory dissolved organic carbon (DOC) into more bioavailable forms (Kieberet al. 1989; Moran and Zepp 1997); reduction in viral abundance and infectivity(Suttle and Chen 1992; Noble and Fuhrman 1997; Wilhelm et al. 1998), perhapscountered by induction of the lytic cycle in lysogenic bacteria (Freifelder 1987;Maranger et al. 2002); and declines in the rate of flagellate grazing on bacteria andthus influence on the loss rates of bacteria (Sommaruga et al. 1996). Not all bacterio-plankton groups seem to be equally susceptible to UV damage (Joux et al. 1999;Arrieta et al. 2000; Agogue et al. 2005; Alonso-Saez et al. 2006), and UV appearsto have a greater effect on the more active cells (Rae and Vincent 1998;Maranger et al. 2002; Alonso-Saez et al. 2006). Cell-specific activity seems to be
262 SINGLE-CELL ACTIVITY IN MARINE BACTERIOPLANKTON

more susceptible to UV damage than membrane structure and potential (Alonso-Saezet al. 2006).
Membranes, nucleic acids, and certain enzymes are sites prone to damage by heat(Teixeira et al. 1997; Fiksdal and Tryland 1999), but a typical marine bacterium willbe rarely exposed to very high temperatures. Cold shock has been shown to generatesublethal injuries and force cells into a dormant state (see, e.g., Kjelleberg et al. 1987;Roszak and Colwell 1987; Munro et al. 1989). Whatever the direct mechanisminvolved at low temperatures, the general pattern is that more cells enter dormancy,and there are fewer cells capable of forming colonies or reducing CTC (see, e.g.,Smith et al. 1994). Temperature and organic carbon availability interact, such thatthe inhibitory effects of temperature are modulated in the presence of higher substrateconcentrations (see, e.g., Wiebe et al. 1992; Pomeroy and Wiebe 2001).
Osmotic shock has also been shown to generate sublethal injuries and force cellsinto dormancy. The capacity to detect bacteria by FISH, for example, has been shownto be extremely sensitive to osmotic stress (Tolker-Nielsen et al. 1997; Oda et al.2000). del Giorgio and Bouvier (2002) found in the 0–10 salinity range of theChoptank estuary a dramatic decline in hybridization with FISH probes, a decreasein bacterial production and growth efficiency, and an increase in cells with depolar-ized and injured membranes. Painchaud et al. (1995) had already identified salinity asone of the main factors related to cell mortality in the St. Lawrence estuary. Changesin the structure and functioning of the microbial food web along gradients of salinity(Schultz and Ducklow 2000; del Giorgio and Bouvier 2002; Bouvier and del Giorgio2002; Casamayor et al. 2002; Gasol et al. 2004; Kirchman et al. 2005) indicate thatthis parameter is a variable structuring both the composition and physiology ofbacterioplankton.
Finally, there are a wide range of chemical substances that may influence bacterialactivity and physiology in marine waters. These include antibiotic and toxic com-pounds released by bacteria (Long and Azam 2001) and by other planktonic organ-isms (Adolph et al. 2004), allelopathic substances (Gross 2003), or substancesassociated with quorum sensing (Miller and Bassler 2001). Contaminants may alsointerfere with marine bacterial activity (Price et al. 1986). Other factors may influencebacterial physiology, such as barometric pressure, low oxygen, or even localizedanoxia (e.g. in particles or guts), and turbulence (e.g. Malits et al. 2004), but, asfar as we know, their effects have not been well explored to date.
Factors Influencing Loss and Persistenceof Physiological Fractions
Grazing Predation is a major loss mechanism of bacterial cells in all marinesystems (see Chapter 11). There is now strong evidence that protistan grazing canbe highly selective in terms of the physiological state of the cells. In general, cellsthat are more active tend to be selectively cropped by protistan grazers (delGiorgio et al. 1996; Simek et al. 1997; Pernthaler et al. 1997; Tadonleke et al.2005). The underlying basis of this selectivity is partly cell size, since there is ingeneral a positive relationship between cell size and activity in bacterioplankton
DESCRIBING THE PHYSIOLOGICAL STRUCTURE OF BACTERIOPLANKTON 263

(Gasol et al. 1995; and see below), but is not restricted to it. Grazing preferentiallyremoves active cells, but may produce injured and dead cells, through incompletedigestion in protistan vacuoles and passage through the gut of metazoans.Incomplete feeding also results in cell fragments (Nagata and Kirchman 2000;Nagata 2000a), or incompletely digested egesta (picopellets, Nagata 2000b) thatcan potentially be counted as normal bacteria by standard protocols.
Cell Size Small size may facilitate survival by being a refuge from predation(Jurgens and Gude 1994). Several empirical studies have shown a preference oflarger bacterial prey by cultured and natural assemblages of flagellates (Anderssonet al. 1986; Gonzalez et al. 1990; Jurgens and Gude 1994) and ciliates (Fenchel1980; Epstein and Shiaris 1992; Simek et al. 1994). Size, thus, can have a largeimpact on the fate of bacterial production because it determines susceptibility tograzers and viruses (see also Chapter 11).
Viral Lysis Viral infection has been proposed as the main mechanism generatingempty or “ghost” bacterial cells that retain external structure but lack internal material(Heissenberger et al. 1996). There is now increasing evidence that viral infection isselective, towards cells that are either more sensitive, or with higher growth and meta-bolic rates (Waterbury and Valois 1993; Middelboe et al. 2001; Bouvier and delGiorgio 2007), and, like grazing, viral lysis preferentially removes cells from themost active categories and moves them to the dead or detrital categories. About 35percent of all bacteria may be infected at a given time, and lysogeny may influencethe growth rate and the metabolism of the host cells (Weinbauer 2004). There arefeedbacks between processes, so that environmental stress may trigger the lyticcycle in lysogenic bacteria (Weinbauer 2004).
Cell Motility This is another factor that plays a role in both cellular activity andloss. Motility is widespread in marine bacteria (Blackburn et al. 1998; Grossart et al.2001). It allows a bacterium to track patches of organic matter (Grossart et al. 2001),and, in an environment with a complex microscale structure (sensu Azam 1998),motility should increase the chance of growth and survival (Blackburn et al. 1997).On the other hand, motility increases the probability of encounter with a phage(Bratbak et al. 1992) or with a protist (Gonzalez et al. 1993; Monger et al. 1999),although very fast bacteria may also be able to avoid predation (Matz and Jurgens 2001).
Cell Degradation The persistence of dead and injured cells in the water columnhas not been well studied (Mason et al. 1986). Due to their size, these cells remainsuspended, and, due to the relative recalcitrance of their membrane components(see, e.g., McCarthy et al. 1998), dead and injured cells, as well as cell fragments,may persist for a long time (Mason et al. 1986). Remains of bacterial cell membranesand cellular fragments have been proposed as the main source of dissolved organicnitrogen in the ocean (McCarthy et al. 1998). The potential interaction betweenabiotic factors (UV, temperature, water chemistry) and grazing in determining theloss of dead and injured cells has not been well explored to date.
264 SINGLE-CELL ACTIVITY IN MARINE BACTERIOPLANKTON

Regulation of the physiological structure of bacterioplankton communitieshas three main components:
† Environmental factors that influence the individual level of metabolicactivity and cell integrity and damage, such as substrate and nutrient avail-ability, UV, and temperature
† Physical and biological factors that influence the persistence and loss of thevarious physiological fractions, such as selective grazing and viral infection,and selective degradation
† Intrinsic phylogenetic characteristics that modulate the response of differentbacterial strains to the above factors
DISTRIBUTION OF SINGLE-CELL CHARACTERISTICS INMARINE BACTERIOPLANKTON ASSEMBLAGES
In this section, we discuss the data generated over the past three decades concerningthe distribution of single-cell characteristics in marine bacterioplankton assemblages.We have assembled a comprehensive dataset based on published and unpublishedobservations of bacterioplankton single-cell activity and physiological state fromstudies that have applied some of the techniques listed in Table 8.1.
Distribution of Single-Cell Activity and Physiological Statesin Marine Bacterioplankton
For each category of assay, we present the average proportion of cells scored as posi-tive relative to the total for all the studies that have applied the technique, togetherwith the range of values obtained in the different studies as well as the resulting stan-dard error and distribution quartiles (Fig. 8.3). Most of the published studies haveapplied a single technique, although there are a handful of marine studies that havecombined several approaches. The latter have been summarized in Table 8.2 andare discussed in the following section.
Figure 8.3 shows a clear ordination of methods based on the average proportion ofcells scored as positive when applied to marine bacterioplankton assemblages.Although almost all techniques yield a wide range of results, most results for anygiven technique cluster in a specific range (as evidenced from the standard erroraround the mean). At one end of the spectrum, methods that target activity tend toyield relative low proportions of reactive cells. For example, researchers find onaverage less than 20 percent of CTC-positive, esterase-positive, and DVC-positivecells in marine samples. At the other extreme are methods that target membrane integ-rity or macromolecular composition, such as BacLight, FISH (RNA) or high-DNAcells, which fall consistently in the range between 40 and 60 percent of the totalcells. Other approaches, such as MAR (substrate uptake) and ultrastructural analysis
SINGLE-CELL CHARACTERISTICS IN MARINE BACTERIOPLANKTON 265

(presence of capsule), generally fall within the range of 20–40 percent. These resultswould suggest that, on average, marine bacterioplankton assemblages have a rela-tively high proportion (.50 percent) of cells that appear to have intact membranesand ultrastructural integrity, and detectable levels of DNA and RNA, but that onlya fraction of these apparently intact and healthy cells are active in substrate uptake,and that an even smaller fraction have high levels of metabolic activity, expressedas cell growth, cell division, or detectable respiratory activity. Moreover, theseresults suggest that, on average, a nontrivial proportion (.20 percent) of marinebacterioplankton cells may be either injured or dead.
The pattern in Figure 8.3 further suggests that certain aspects of cell physiologymay be more coupled than others. For example, DNA and RNA contents and mem-brane integrity result in similar proportions of positive cells, whereas respiratory,enzymatic, and substrate uptake activity appear generally clustered in the lower endof the spectrum. The fact that a relatively large fraction of intact cells appears tohave extremely low or nondetectable metabolic rates agrees well with recent estimates
Figure 8.3 The percentage of reactive cells determined by different methods for marineplankton communities (database available at www.icm.csic.es/bio/personal/gasol/chapterKirchmanbook). The average (filled-in circles), standard error (SE: solid lines), rangebetween the 25 and 75 percent quartiles (dotted lines), and ranges of values (spaces between thetwo vertical lines) are presented. “Membrane þ” indicates all membrane polarity and potentialprobes, including double-staining protocols.
266 SINGLE-CELL ACTIVITY IN MARINE BACTERIOPLANKTON

TA
BL
E8.
2O
verv
iew
ofSt
udie
sC
ompa
ring
Dif
fere
ntA
ctiv
ity
Pro
toco
ls
Site
Met
hod
(and
%)a
Mar
ine
Stud
ies
Hop
pe(1
976)
Kie
lB
ayA
O.
MA
Rþ
.cf
u10
041
1M
eyer
-Rei
l(1
978)
Kie
lB
ayA
O.
INTþ
.cf
u10
031
2K
ogur
eet
al.
(197
9)Pa
cifi
cO
cean
AO
.D
VC
.cf
u10
07
0.00
01T
abor
and
Nei
hof
(198
4)C
hesa
peak
eB
ayA
O.
INTþ�
MA
Rþ
.D
VC
100
4643
32N
ewel
let
al.
(198
6)C
hesa
peak
eB
ayT
C.
MA
Rþ�
INTþ
.D
VC
100
6156
35C
hoi
etal
.(19
96)
Ore
gon
coas
tD
AP
I.N
ucC
.L
iveþ
.C
TCþ
100
2514
7.5
100
4421
19K
arne
ran
dFu
hrm
an(1
997)
Cal
ifor
nia
coas
tal
DA
PI.
FIS
H.
MA
Rþ
.N
ucC
.C
TCþ
100
5649
291
Joux
and
Leb
aron
(199
7)M
edite
rran
ean
coas
tD
AP
I.D
VC
.C
TCþ
.C
FU
100
123
0.8
Gas
olet
al.
(199
9)M
edite
rran
ean
coas
tD
AP
I.L
iveþ
Nuc
C.
HN
A10
070
6860
Cat
ala
etal
.(19
99)
Med
iterr
anea
nco
ast
DA
PI.
Est
eras
eþ.
DV
C�
CT
C.
cfu
100
86
51
(Con
tinue
d)
267

TA
BL
E8.
2C
ontin
ued
Site
Met
hod
(and
%)a
Ber
nard
etal
.(20
00b)
Med
iterr
anea
nco
ast
SG
.C
TCþ�
cfu
100
21.
5G
ross
art
etal
.(2
001)
Cal
ifor
nia
coas
tD
AP
I.M
otile
.N
ucC
.C
TCþ
100
6033
9S
herr
etal
.(20
02)
Atla
ntic
shel
fD
AP
I.N
ucC
.C
TCþ
100
516
Sto
rede
gger
and
Her
ndl
(200
2)N
orth
Sea
DA
PI.
Cap
sule
.C
TC
100
3519
Sch
uman
net
al.
(200
3)E
stua
rine
DA
PI.
PI-
.E
ster
aseþ
CT
Cþ
Bal
ticS
ea10
074
1210
100
678
15S
chum
ann
etal
.(2
003)
Glo
bal
DA
PI.
Eth
D2-
.S
ytox
-�
PI-
.C
TCþ�
Est
.þ.
leu
AM
P10
087
7170
1210
6Y
akim
ovet
al.(
2004
)R
oss
Sea
DA
PI.
FIS
Hþ
.C
TCþ
100
8711
100
182
Dav
idso
net
al.(
2004
)T
asm
ania
nco
asta
lD
AP
I.P
I-.
MP
N.
CF
DAþ�
CT
Cþ
100
3023
1313
Zam
pino
etal
.(20
04)
Med
iterr
anea
nco
ast
DA
PI.
Liv
eþ�
DV
C�
CT
Cþ�
cfu
100
44
21
Pear
ceet
al.
(200
7)A
ntar
ctic
coas
tD
AP
I.E
ster
aseþ
.L
iveþ
100
3714
268

Oth
erA
quat
icSt
udie
s
Mak
ian
dR
emse
n(1
981)
Lak
esA
O.
INTþ�
DV
C10
010
8Q
uinn
(198
4)L
akes
AO
.IN
Tþ�
DV
C.
FD
Aþ
.cf
u10
026
225
0.4
Port
eret
al.
(199
5)L
ake
Win
derm
ere
AO
.C
FD
A�
CT
C.
DV
C.
cfu
100
64
0.6
0.2
Riv
erM
erse
yA
O.
Che
mB
.D
VC
.cf
u10
080
7156
Yam
aguc
hian
dN
asu
(199
7)R
iver
sD
AP
I.E
ster
aseþ
.C
TCþ
100
6325
Kaw
aiet
al.
(199
9)P
urifi
edw
ater
DA
PI.
6CF
DA
.D
VC�
CT
Cþ
.m
col.
cfu
100
205
51
0.00
1Y
okom
aku
etal
.(20
00)
Riv
erw
ater
DA
PI.
Est
eras
eþ�
DV
C.
CT
Cþ
.cf
u10
034
17-4
520
12B
erm
anet
al.(
2001
)L
ake
Kin
nere
tD
AP
I.L
iveþ�
Nuc
C�
CT
Cþ
100
98
5V
olle
rtse
net
al.(
2001
)W
aste
wat
erA
O.
DA
PI.
Liv
eþ.
MA
Rþ
.C
TCþ
100
7560
4020
Lun
aet
al.
(200
2)M
arin
ese
dim
ents
AO
.L
iveþ
.N
ucC
.D
VC
100
284
2S
chum
ann
etal
.(2
003)
Fre
shw
ater
DA
PI.
PI-
.E
ster
aseþ
CT
Cþ
100
659
11F
rees
eet
al.
(200
6)R
iver
DA
PI.
FIS
Hþ�
Mem
brþ
.E
ster
aseþ
.C
TCþ
100
2927
52
aT
hem
etho
dsar
eor
dere
dac
cord
ing
toth
epe
rcen
tage
ofth
ere
fere
nce
valu
e(fi
rstc
olum
n).A
qual
itativ
eap
prec
iatio
nis
give
nby
sym
bols¼
,�or
.(i
ndic
atin
geq
ual,
sim
ilar
orhi
gher
valu
e).A
cron
yms
are
asin
Tab
le8.
1,w
ithth
ead
ditio
nof
cfu,
colo
ny-f
orm
ing
units
;MA
R,m
icro
auto
radi
ogra
phy;
SG
,Syb
rGre
en;A
B,a
ntib
ody-
posi
tive;
leu-
AM
P,le
ucin
eam
inop
eptid
ase;
B-G
al:b
-gal
acto
sida
se;m
-col
,m
icro
colo
nyfo
rmat
ion.
269

of the proportion of marine bacterioplankton cells that are dividing, based on theincorporation of BrdU, which are in the range of less then 1 to 10 percent incoastal assemblages (Urbach et al. 1999; Borneman 1999; Pernthaler et al. 2002).
Simultaneous Determination of Several Aspects of Single-CellActivity and Physiology
The average distribution of single-cell characteristics presented in Figure 8.3 isderived mostly from studies that have applied individual techniques in differentsystems, and thus the pattern could be driven to some extent by biases in terms ofthe origin and characteristics of the samples. To what extent does the averagedistribution of single-cell characteristics presented in Figure 8.3 represent the realsequence of physiological states that could be found within a single sample if mul-tiple techniques were applied simultaneously? In Table 8.2, we have summarizedthe marine studies that combined and compared several approaches in the samesamples. For reference, we have included in this table some additional studiesthat simultaneously assessed multiple aspects of single-cell activity in otheraquatic ecosystems.
The data summarized in Table 8.2 show a pattern of distribution of single-cellcharacteristics within individual samples that is similar to the average cross-samplepattern shown in Figure 8.3. Most studies that combined several approaches foundrelatively high proportions of cells that appear intact in terms of membrane integrity,ultrastructure, and macromolecular component, but a much smaller fraction thatappears active in terms of respiration, intracellular enzyme activity, or substrateuptake. Some of these studies found some coherence between the different aspectsof single-cell physiology. For example, Karner and Fuhrman (1997) found thatNucC values were similar to those from autoradiography and FISH, although thesetwo aspects of cell function were not significantly correlated. Likewise, Gasolet al. (1999) found that the number of HNA bacteria measured by flow cytometrywas similar to the number of NucC cells, and the rates of change of both groupswere similar. Davidson et al. (2004) and Schumann et al. (2003) found similarnumber of CTC-positive and CFDA-positive or esterase-active cells, suggestingthat these aspects of cell function might be more tightly coupled.
Some of these studies have also revealed apparent discrepancies. For example,Karner and Fuhrman (1997) reported extremely low numbers of CTC-positivecells, in spite of relatively high proportions of MAR and FISH-positive cells.Likewise, Grossart et al. (2001) found that between 22 and 64 percent of bacteriawere motile in coastal marine sample. Larger cells were more motile than smallercells, and there was a correlation between colony-forming units (CFU) and percent-age of cells that were motile, but this percentage was about twofold higher thanthe percentage of NucC-containing cells, and about sixfold higher than the proportionof CTC-positive cells. Since motile bacteria must be respiring, these differencesmust be due to the different thresholds of detection of each method. Interestingly,Grossart et al. (2001) also found that motile and CTC-positive percentages tendedto converge (91 percent for CTC-positive and 85 percent for motile cells) upon the
270 SINGLE-CELL ACTIVITY IN MARINE BACTERIOPLANKTON
addition of organic substrates, suggesting greater uncoupling of these processes undergrowth-limiting conditions.
Some of these apparent discrepancies may be methodological, but others may be areflection of the complexity of the coupling between various aspects of cellular func-tion. A number of laboratory and regrowth studies have revealed complex patterns ofresponse to starvation and stress at the single-cell level. For example, Joux et al.(1997b) described the response of a marine bacterium to prolonged starvation, inwhich total cell counts and DNA content remained relatively stable during the first2 months of starvation, whereas there was a clear sequence of changes in otheraspects of cell functioning, starting with loss of culturability, followed by a declinein respiratory and enzymatic capacity, and ending in a loss of membrane integrity.Others have shown similar responses following exposure to a variety of stresses inpure bacterial cultures (Fiksdal and Tryland 1999; Caro et al. 1999; Suller andLloyd 1999; Maalej et al. 2004). These studies collectively confirm that there is ahierarchy of physiological states in plankton assemblages, such that, in practicalterms, scoring a cell as “live” does not imply activity, and, conversely, that scoringa cell as “dead” or “injured” does not imply complete inactivity.
Patterns in Distribution of Single-Cell Activity and PhysiologyAlong Marine Gradients
Figure 8.4 shows the relationship between the abundance of seven specific bacterialfractions (MAR-positive, CTC-positive, HNA, membrane-intact (membrane-positive), membrane-impaired, DVC, NucC and esterase-positive) and total bacterialabundance. These relationships include all the individual data points that were used toconstruct Figure 8.3. The relationships extend over three orders of magnitude in totalbacterial abundance (105–107 cells/mL), thus covering much of the range inbacterial abundance in aquatic waters. Figure 8.4 suggests different patterns in therelative abundance of these different fractions: the log-slopes of the HNA and mem-brane-positive relationships are not significantly different from unity, suggesting thatalthough there is a large degree of scatter in each of these relationships, the relativecontribution of these fractions does not change systematically along gradients ofincreasing bacterial abundance and thus of total system productivity. In contrast,the log-slopes of the CTC-positive, DVC, NucC and MAR-positive relationshipsare significantly greater than unity, suggesting that the relative importance of thesefractions tends to increase with increasing overall abundance and probably systemproductivity. The proportion of esterase-positive cells tends to decrease with totalbacterial abundance, but the database is not large and seems to be biased towardsnutrient-rich aquatic ecosystems.
There appears to be a relative constancy in the proportion of intact versus damagedcells, and of cells with high nucleic acid contents and nucleoid, and a correlationbetween these fractions. Further, the relative constancy of these fractions suggeststhat the processes that result in bacterial cell death and damage, as well as in distri-bution of DNA, are not only present along the entire marine gradient, but are exertinga similar effect throughout. In contrast, the apparent increase in metabolically active
SINGLE-CELL CHARACTERISTICS IN MARINE BACTERIOPLANKTON 271
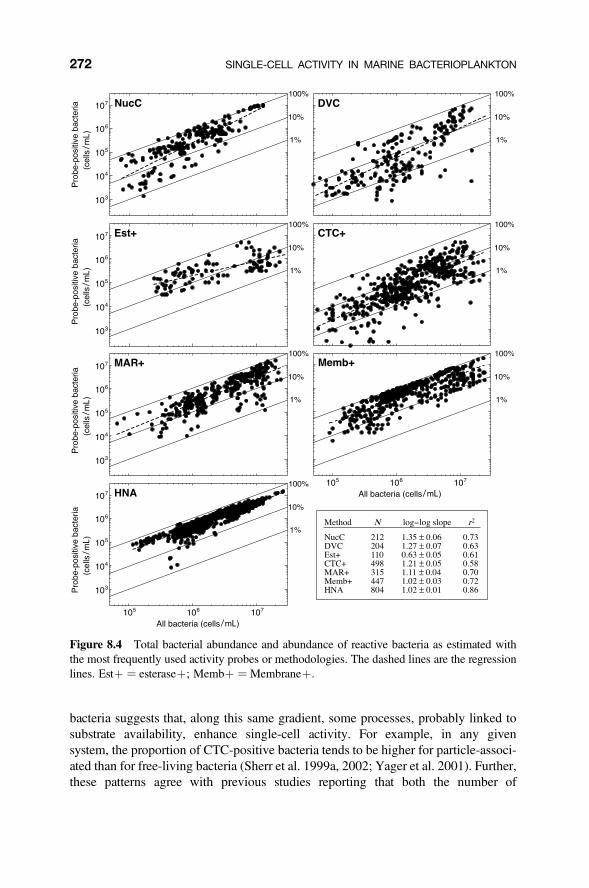
bacteria suggests that, along this same gradient, some processes, probably linked tosubstrate availability, enhance single-cell activity. For example, in any givensystem, the proportion of CTC-positive bacteria tends to be higher for particle-associ-ated than for free-living bacteria (Sherr et al. 1999a, 2002; Yager et al. 2001). Further,these patterns agree with previous studies reporting that both the number of
Figure 8.4 Total bacterial abundance and abundance of reactive bacteria as estimated withthe most frequently used activity probes or methodologies. The dashed lines are the regressionlines. Estþ ¼ esteraseþ; Membþ ¼Membraneþ.
272 SINGLE-CELL ACTIVITY IN MARINE BACTERIOPLANKTON

CTC-positive cells and the percentage of CTC-positive cells increase with systemproductivity (del Giorgio and Scarborough 1995; Lovejoy et al. 1996; Søndergaardand Danielsen 2001), and that the abundance of CTC-positive cells is correlatedwith bacterial production (del Giorgio et al. 1997; Lovejoy et al. 1996; Sherr et al.1999a) and cell growth (Choi et al. 1996, 1999; Sherr et al. 1999b). The apparentincrease in the proportion of highly active cells could also potentially be due to acovariation with other physical factors, such as temperature, which may varyindependently from nutrient and substrate availability. However, there are reportsof extremely high numbers of substrate-reactive and percentage of CTC-positivecells in very cold but nutrient-rich waters (Yager et al. 2001; Schumman et al.2003; Freese et al. 2006), so temperature itself does not appear to the main reasonfor the low apparent proportion of highly active cells in low-productivitysystems. Arıstegui et al. (2005) found 8 percent of CTC-positive prokaryotes inmesopelagic samples, a fraction similar to that in much warmer surface waters. Inaddition, the formazan granules of CTC-positive cells in the mesopelagic zonewere 30 percent larger than those in cells at the surface, suggesting that theper cell respiration rate was higher in the mesopelagic zone. Likewise, Herndlet al. (2005) reported relatively high proportions of active Archaea in deepoceanic waters.
To summarize, our analysis suggests that the relative proportion of intact and livecells does not vary significantly across marine gradients, but that the proportion ofactive cells (in terms of respiration, enzyme activity, or substrate uptake) tends toincrease along the same gradients. These observations suggest (1) that the proportionof inactive or dormant cells declines systematically along a gradient of increasingbacterial abundance and thus of system productivity, (2) that cell death andinjury may be regulated by factors that are relatively independent from those thatregulate cell activation and inactivation, and (3) that there may be changes in theselective loss processes of specific physiological fractions along these gradients,and in particular, a relatively higher removal of the more active cells in the leastproductive systems.
Distribution of Activity and Growth Among Bacterial Size Classes
Standard allometric relationships suggest that the smallest bacterial cells should havethe highest specific metabolic and growth rates, and early results supported thispattern (Fuhrman 1981), but later studies have shown evidence that the smallercells tend to have lower specific metabolic rates (Billen et al. 1990; Bjørnsen et al.1989). For example, Gasol et al. (1995) showed that most CTC-positive cells in acoastal marine assemblage were in the medium to large size range. Their calculationsof specific growth rates for each of seven size classes between 0.008 and 0.30 mm3
showed that growth rates increased from about 0.3/d to 1.4/d and biomass turnovertimes to decrease with increasing cell size, from about 2.1 days for small bacteriadown to 0.5 days for larger bacteria. Others have also observed a relationshipbetween cell size and the capacity to reduce CTC (Søndergaard and Danielsen
SINGLE-CELL CHARACTERISTICS IN MARINE BACTERIOPLANKTON 273

2001), and Bernard et al. (2000b) and Lebaron et al. (2002) confirmed this pattern bymeasuring tritiated leucine incorporation rates by bacteria sorted according to sizeusing flow cytometry. Cottrell and Kirchman (2004) also showed that largerbacteria were more likely to be taking up thymidine than smaller bacteria.
Distribution of Activity Across and WithinMajor Phylogenetic Groups
An increasing number of studies have attempted to determine the phylogeneticaffiliation of cells in different physiological states. Several of these have used cellsorting in order to isolate cells or clone genes, or have used FISH or DNA fingerprint-ing to analyze specific fractions, such as HNA and LNA cells, or CTC-positivecells. Results have been somewhat contradictory. Some indicate that these fractionsare not phylogenetically distinct (Bernard et al. 2000a; Servais et al. 2003; Fuchset al. 2005; Longnecker et al. 2005), while others suggest that the compositionmight differ between fractions (Bernard et al. 2000b). Mary et al. (2006) suggestedthat most LNA cells in open ocean environments belong to the SAR11 clade, andthat these cells do not to appear in the HNA fraction. Other studies have combinedBrdU incorporation with FISH to assess the composition of substrate-active ordividing cells. For example, Pernthaler et al. (2002) found that only 3 percent oftotal cells incorporated BrdU, indicating a very small fraction of dividing cells, atleast in early autumn in the North Sea. Use of group-specific probes allowed theidentification of the dividing cells as belonging to three main populations: SAR86,Roseobacter, and Alteromonas. Interestingly, the SAR86 group of theGammaproteobacteria accounted for over 50 percent of BrdU-positive bacteria.Hamasaki et al. (2007) combined BrdU uptake and immunocapture followed byDGGE in coastal marine samples, and found that the composition of the BrdU-incor-porating cells was substantially different from that of the total community, suggestingthat numerically dominant phylotypes may not necessarily be those that are highlyactive and growing.
An increasing number of studies have used MAR-FISH to explore the phylo-genetic affiliation of cells that are active in substrate uptake. We have collectedsome of the recently published results using this approach (Fig. 8.5), selecting thesubstrates most likely being universally incorporated, and analyzing their use bythe most abundant groups of marine bacteria. These results show (1) a wide rangein the proportion of cells active in substrate uptake within each of the major bacterialgroups, and (2) major differences in the proportion of cells apparently active in sub-strate uptake within a given group, depending on the substrate utilized. Certainsubstrates, such as thymidine, generally lead to relatively low fraction of activecells in most groups, but most other substrates that have been tested, such asamino acids and glucose, result in an extremely wide range of values, both for thesame group in different samples and for different phylogenetic groups within thesame sample. A portion of this variability is no doubt methodological and related tothe sensitivity of the FISH and MAR protocol used (Bouvier and del Giorgio 2003),
274 SINGLE-CELL ACTIVITY IN MARINE BACTERIOPLANKTON
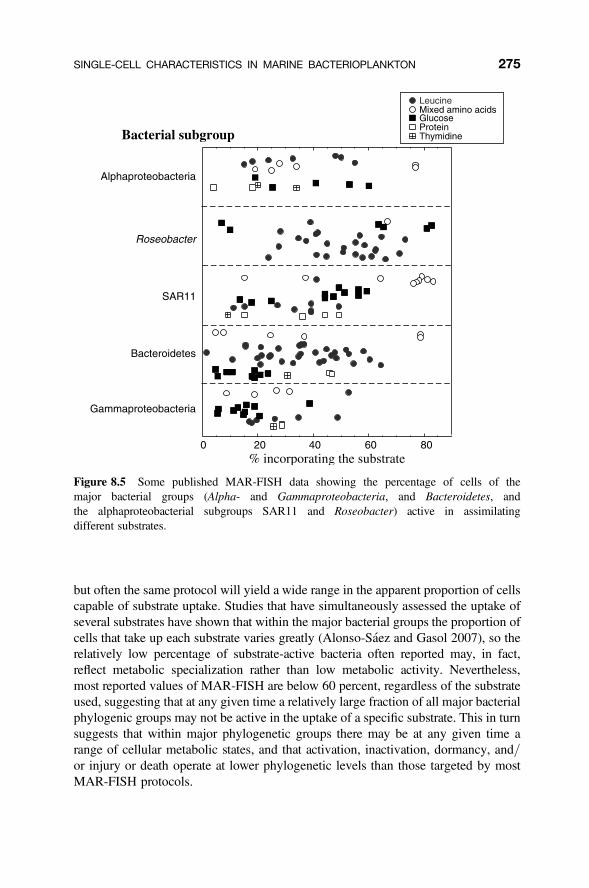
but often the same protocol will yield a wide range in the apparent proportion of cellscapable of substrate uptake. Studies that have simultaneously assessed the uptake ofseveral substrates have shown that within the major bacterial groups the proportion ofcells that take up each substrate varies greatly (Alonso-Saez and Gasol 2007), so therelatively low percentage of substrate-active bacteria often reported may, in fact,reflect metabolic specialization rather than low metabolic activity. Nevertheless,most reported values of MAR-FISH are below 60 percent, regardless of the substrateused, suggesting that at any given time a relatively large fraction of all major bacterialphylogenic groups may not be active in the uptake of a specific substrate. This in turnsuggests that within major phylogenetic groups there may be at any given time arange of cellular metabolic states, and that activation, inactivation, dormancy, and/or injury or death operate at lower phylogenetic levels than those targeted by mostMAR-FISH protocols.
Figure 8.5 Some published MAR-FISH data showing the percentage of cells of themajor bacterial groups (Alpha- and Gammaproteobacteria, and Bacteroidetes, andthe alphaproteobacterial subgroups SAR11 and Roseobacter) active in assimilatingdifferent substrates.
SINGLE-CELL CHARACTERISTICS IN MARINE BACTERIOPLANKTON 275

What is the Link Between Single-Cell Activity and PhylogeneticAffiliation?
† MAR-FISH analyses show that in most cases there is a mixture of cells thatare active and inactive in substrate uptake within any given bacterial group(see, e.g., Fig. 8.5), suggesting that the level of single-cell activity is notintrinsic but rather that members of the same group may express very differ-ent levels of activity depending on their microenvironment and of theirimmediate history.
† This scenario would further suggest that resource microheterogeneity mayplay a key role in determining the distribution of activity within bacterialassemblages.
† Alternatively, the heterogeneity of single-cell activity detected withinbroad phylogenetic groups may indicate that within these groups there is awide range of genetic diversity that is expressed as a wide range in metabolicresponses of different cells to the same set of environmental conditions.
† This establishes two extreme scenarios: (1) the physiological structure isentirely due to environmental heterogeneity, microscale patchiness, and tem-poral variability; (2) physiological heterogeneity is due entirely to geneticand phenotypic diversity. Where along this gradient lie natural bacterio-plankton assemblages is still a matter of study.
Dynamics of Single-Cell Activity and Physiological States
The dynamics of cell activation, inactivation, injury, and death are not well under-stood for marine bacterioplankton assemblages. Cells that are apparently inactiveand are thus not scored positive in activity assays can quickly activate followingchanges in resources and physical conditions. For example, Choi et al. (1996)found in a starved laboratory culture resupplied with nutrients that 100 percent ofcells without visible nucleoid developed yellow-fluorescing nucleoids before cellabundance began to increase. Likewise, Choi et al. (1999) reported that substrateadditions to a natural marine assemblage resulted in rapid increases in the proportionof CTC-positive cells, from low ambient values (,10 percent), to over 70 percentunder enriched conditions, without any significant change in cell abundance. Thesestudies suggest rapid activation upon a change in the resource environment of bac-terial cells that are either dormant or have extremely low levels of activity. There isalso evidence in situ of rapid changes in the distribution of activity within thebacterioplankton assemblages. There were large and rapid increases in the proportionof CTC-positive bacteria as a response to algal blooms in arctic waters, even at lowtemperatures (Yager et al. 2001). Gasol et al. (1998) and Hagstrom et al. (2001)observed diel cycles of NucC-containing cell abundance in several oceanic stations,with increases during the night. The relatively large (14–86 percent) shifts in NucCnumbers recorded during the diel cycles suggests that at least some non-NucC bac-teria were capable of turning on and becoming NucC-positive on short time scales.
276 SINGLE-CELL ACTIVITY IN MARINE BACTERIOPLANKTON
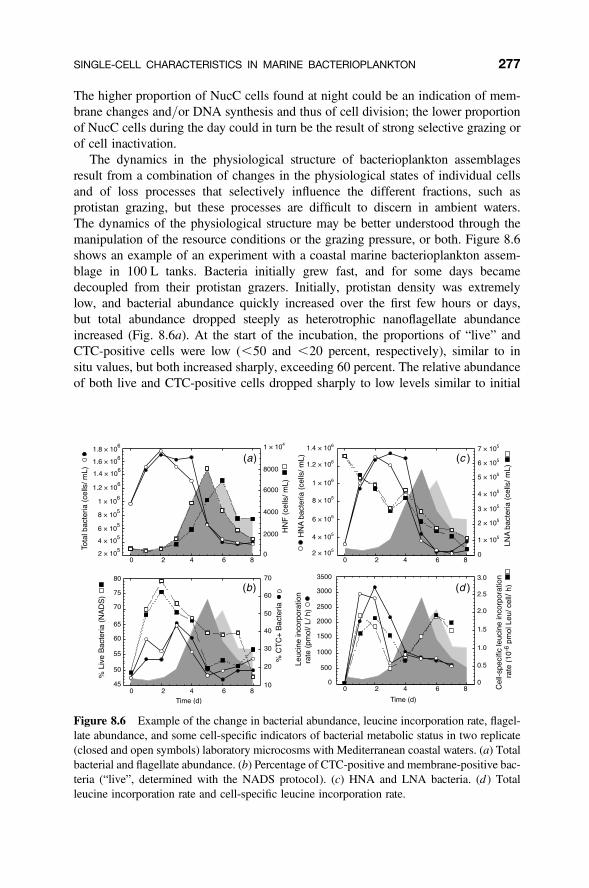
The higher proportion of NucC cells found at night could be an indication of mem-brane changes and/or DNA synthesis and thus of cell division; the lower proportionof NucC cells during the day could in turn be the result of strong selective grazing orof cell inactivation.
The dynamics in the physiological structure of bacterioplankton assemblagesresult from a combination of changes in the physiological states of individual cellsand of loss processes that selectively influence the different fractions, such asprotistan grazing, but these processes are difficult to discern in ambient waters.The dynamics of the physiological structure may be better understood through themanipulation of the resource conditions or the grazing pressure, or both. Figure 8.6shows an example of an experiment with a coastal marine bacterioplankton assem-blage in 100 L tanks. Bacteria initially grew fast, and for some days becamedecoupled from their protistan grazers. Initially, protistan density was extremelylow, and bacterial abundance quickly increased over the first few hours or days,but total abundance dropped steeply as heterotrophic nanoflagellate abundanceincreased (Fig. 8.6a). At the start of the incubation, the proportions of “live” andCTC-positive cells were low (,50 and ,20 percent, respectively), similar to insitu values, but both increased sharply, exceeding 60 percent. The relative abundanceof both live and CTC-positive cells dropped sharply to low levels similar to initial
Figure 8.6 Example of the change in bacterial abundance, leucine incorporation rate, flagel-late abundance, and some cell-specific indicators of bacterial metabolic status in two replicate(closed and open symbols) laboratory microcosms with Mediterranean coastal waters. (a) Totalbacterial and flagellate abundance. (b) Percentage of CTC-positive and membrane-positive bac-teria (“live”, determined with the NADS protocol). (c) HNA and LNA bacteria. (d ) Totalleucine incorporation rate and cell-specific leucine incorporation rate.
SINGLE-CELL CHARACTERISTICS IN MARINE BACTERIOPLANKTON 277

values, concomitant with the increase in protistan density (Fig. 8.6b). HNA cellsfollowed a similar pattern in density as the total number of cells, whereas LNAcells showed a completely different dynamics during the incubation, apparently inde-pendent of protistan grazing (Fig. 8.6c). The highest proportions of LNA cellsoccurred at the onset of the incubation, and at the peak of protistan grazing, whichcorresponded to the lowest proportions of live, CTC-positive, and HNA cells.Total leucine incorporation followed well the patterns in total and HNA abundance,but cell-specific leucine followed closely the pattern in the percentage of CTC-positive cells (Fig. 8.6d ).
These experiments suggest the following: (1) in the absence of grazing, there isevidence for both cell activation and multiplication; (2) under these circumstances,dormant and inactive cells that were originally in the assemblage are diluted,leading to high proportions of active cells; (3) protistan grazing removes all categoriesof cells, but preferentially those that are active, alive, and with HNA contents, thusimpacting not only the total abundance but the proportion of these various fractions;(4) some bacterial fractions, such as LNA cells, are not selectively removed, and canthus persist in the assemblage, even under high grazing pressure; (5) the variations incell-specific metabolic activity at the community level result not only from changes inthe overall level of activity of all the cells, but also from changes in the relative dis-tribution of highly active versus less active cells; (6) even dilute marine waters canharbor bacterial assemblages with relatively high proportions of active cells. It is diffi-cult to extrapolate from these experiments to natural conditions, but the observationsof generally low proportions of active and dividing cells, high proportions of LNAand dead/injured cells, and relatively high protistan abundance in ambient marinewaters would suggest that microbial communities in situ resemble more a regrowthassemblage after 4–5 days of incubation (Fig. 8.6) than either the initial or finalconditions found in these experiments.
That even extremely oligotrophic waters may support high proportions of highlyactive cells was also reported by del Giorgio et al. (1996) in experiments carriedout in coastal Mediterranean waters. In these experiments, the ambient bacterialassemblages were incubated in situ in dialysis bags with and without protistangrazers, and both the total abundance and the abundance of CTC-positive cellswere followed. Similar to what was observed above, the results from these dialysisbag experiments also revealed large increases in the percentage of CTC-positivecells in the absence of grazing, and a strong negative relationship between the percen-tage of CTC-positive cells and protistan density in the various treatments (del Giorgioet al. 1996). Perhaps more interestingly, these experiments allowed us to explore inmore detail the processes underlying the changes in total bacterial abundance,growth rate and production.
If only total abundance is considered (as is usually the case in most studies), theresults suggested a relatively modest net growth rate and grazing rate for the entireassemblage (0.08/d and 20.4/d) (Fig. 8.7). If, alternatively, one considers notjust total abundance but also the dynamics of CTC-positive cells, the scenario thatemerged was much more complex: most of the growth of the assemblage appeared
278 SINGLE-CELL ACTIVITY IN MARINE BACTERIOPLANKTON

due to the multiplication of a very small, highly active fraction that was present at theonset of the experimental incubations; this fraction had much higher growth rates(0.7/d) than those estimated for the bulk assemblage, and also had much higher pre-dation loss rates (20.8/d) (Fig. 8.7). In addition, modeling also indicated that therewas not only selective removal of the highly active cells during the course of theexperiment, but also inactivation of at least a portion of these newly formed cells(at a rate of 0.4/d), which then fed the pool of inactive bacteria and allowed thispool to remain relatively constant in numbers (Fig. 8.7). Although the two scenariosshown in Figure 8.7 share the same starting conditions and result in the same finaltotal bacterial abundance, the one that takes into consideration the internal heterogen-eity within the bacterial assemblages, in spite of its simplicity, provides a more rea-listic depiction of the complex interactions, mechanisms, and controls that underliethe changes at the community level, than the one that considers the assemblage asbeing homogenous.
ECOLOGICAL IMPLICATIONS OF PATTERNS INBACTERIOPLANKTON SINGLE-CELL ACTIVITY
The evidence from studies that have targeted single-cell activity suggests that bacter-ioplankton assemblages should be considered a dynamic mosaic of activity, and that
Figure 8.7 Comparison of an approach that considers the populations homogeneous withone that considers them heterogeneously formed by an active (A) and an inactive (I) pool.The values in the boxes are bacterial abundances, and the values with the arrows are ratesof change (growth), of loss to predators (arrows pointing away from the boxes), or of transfor-mation from the A to the I pool. The model used in the original publication (del Giorgio et al.1996) assumed that no cells could move from the I to the A pool.
ECOLOGICAL IMPLICATIONS OF PATTERNS IN BACTERIOPLANKTON 279

there may be as much variability in cell-specific metabolism within any single bac-terioplankton assemblage as there is in the average activity between assemblagesalong environmental gradients and between ecosystems (ultraoligotrophic gyres tohighly productive coastal and estuarine regimes). In brief, the evidence suggeststhat (1) there are dead and injured cells in all assemblages assayed so far, (2) thereare significant numbers of cells that appear to be dormant, (3) the abundance aswell as the proportion of active cells increases with system productivity, (4) the meta-bolic and growth rates of the active fraction also tend to increase, and (5) the loss pro-cesses affect these different fractions very differently. We explore possible ecologicalconsequences of these patterns in the sections below.
Community Versus Individual Cell Growth and Metabolic Rates
The concepts of specific production, growth rate, and biomass turnover are generallyapplied in aquatic microbial ecology at the population and more often at the comm-unity level. Total metabolism is scaled to total bacterial abundance, and thus theresulting growth and turnover rates represent an average for the various phylogeneticand physiological groups that comprise the assemblage. These bulk growth andspecific production rates have been the focus of research for the past three decades,and much has been learnt in terms of the magnitude and regulation of bacterialgrowth (reviewed in Chapters 9 and 10). Bacterial abundance is by far one of theleast variable parameters in oceanography, and variations in bacterial abundance ingeneral explain very little of the patterns in bulk metabolism and growth. On theother hand, there is an overall range of at least three to four orders of magnitude inthe average specific growth rates (estimated as total bacterial production divided bytotal abundance), and variation in specific respiration (bacterial respiration dividedby abundance) is somewhat smaller; the ranges for both are even greater if deepocean assemblages are considered.
The evidence presented in the previous sections would suggest that at least aportion of this range in the average specific activity across communities is dueto changes in the proportion of different physiological fractions. The keyquestion is to what extent this large range in cell-specific activity is due to shifts inthe specific activity of the entire assemblage or to shifts in the relative proportionof cells in different physiological states. For example, we could hypothesize abacterioplankton assemblage composed of cells that are mostly dormant and inmetabolic arrest, except for a small fraction of cells that upon encounter of localpatches of higher substrate concentration quickly resumes growth and divide.Bulk approaches would rightly conclude that biomass doubling time of this assem-blage is extremely long, and that growth rates for the entire assemblage aretherefore very low, and yet these estimates would mask the fact that the divisionrate of the cells that are actually dividing may be on the order of a few days oreven hours.
The average growth rates (m) for an assemblage are the net result of the contri-butions of the various physiological fractions. In the simplest of scenarios, such as
280 SINGLE-CELL ACTIVITY IN MARINE BACTERIOPLANKTON
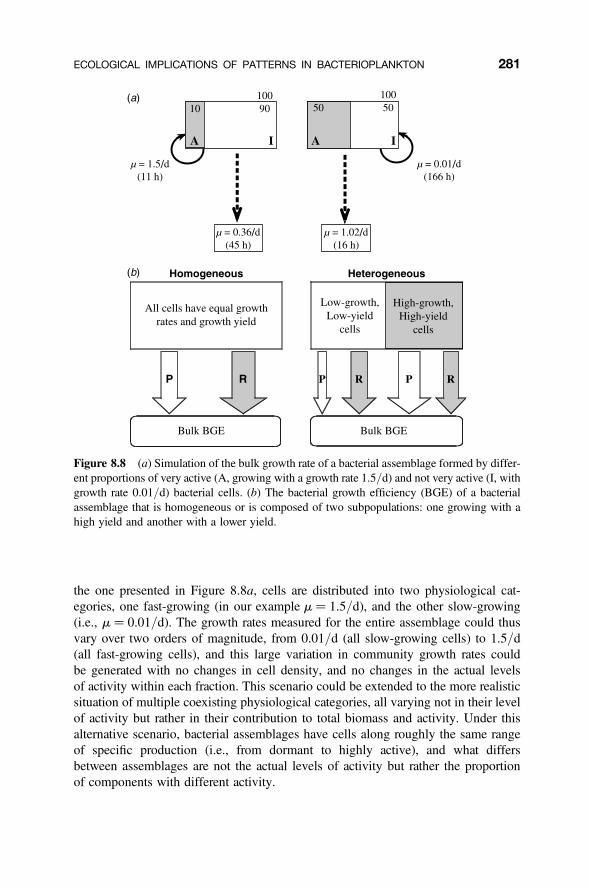
the one presented in Figure 8.8a, cells are distributed into two physiological cat-egories, one fast-growing (in our example m ¼ 1.5/d), and the other slow-growing(i.e., m ¼ 0.01/d). The growth rates measured for the entire assemblage could thusvary over two orders of magnitude, from 0.01/d (all slow-growing cells) to 1.5/d(all fast-growing cells), and this large variation in community growth rates couldbe generated with no changes in cell density, and no changes in the actual levelsof activity within each fraction. This scenario could be extended to the more realisticsituation of multiple coexisting physiological categories, all varying not in their levelof activity but rather in their contribution to total biomass and activity. Under thisalternative scenario, bacterial assemblages have cells along roughly the same rangeof specific production (i.e., from dormant to highly active), and what differsbetween assemblages are not the actual levels of activity but rather the proportionof components with different activity.
Figure 8.8 (a) Simulation of the bulk growth rate of a bacterial assemblage formed by differ-ent proportions of very active (A, growing with a growth rate 1.5/d) and not very active (I, withgrowth rate 0.01/d) bacterial cells. (b) The bacterial growth efficiency (BGE) of a bacterialassemblage that is homogeneous or is composed of two subpopulations: one growing with ahigh yield and another with a lower yield.
ECOLOGICAL IMPLICATIONS OF PATTERNS IN BACTERIOPLANKTON 281
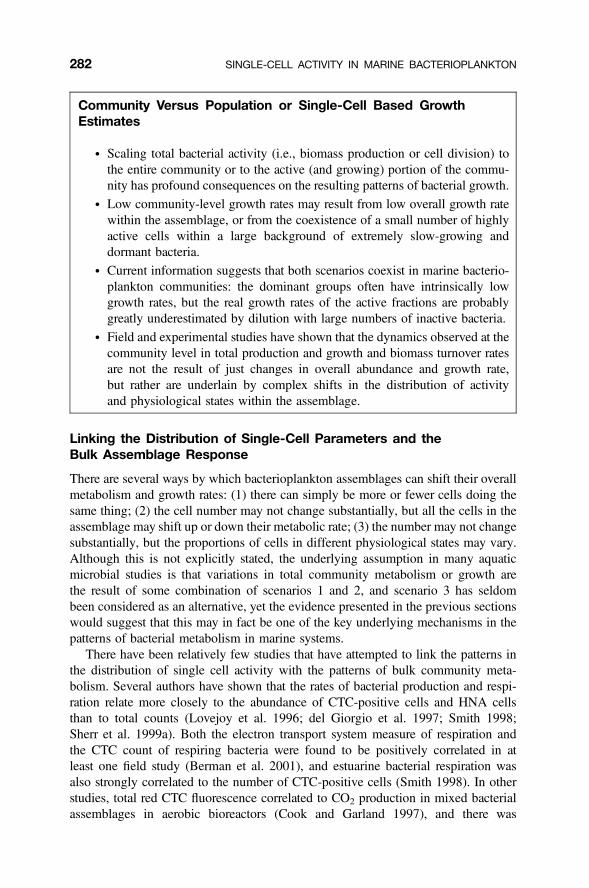
Community Versus Population or Single-Cell Based GrowthEstimates
† Scaling total bacterial activity (i.e., biomass production or cell division) tothe entire community or to the active (and growing) portion of the commu-nity has profound consequences on the resulting patterns of bacterial growth.
† Low community-level growth rates may result from low overall growth ratewithin the assemblage, or from the coexistence of a small number of highlyactive cells within a large background of extremely slow-growing anddormant bacteria.
† Current information suggests that both scenarios coexist in marine bacterio-plankton communities: the dominant groups often have intrinsically lowgrowth rates, but the real growth rates of the active fractions are probablygreatly underestimated by dilution with large numbers of inactive bacteria.
† Field and experimental studies have shown that the dynamics observed at thecommunity level in total production and growth and biomass turnover ratesare not the result of just changes in overall abundance and growth rate,but rather are underlain by complex shifts in the distribution of activityand physiological states within the assemblage.
Linking the Distribution of Single-Cell Parameters and theBulk Assemblage Response
There are several ways by which bacterioplankton assemblages can shift their overallmetabolism and growth rates: (1) there can simply be more or fewer cells doing thesame thing; (2) the cell number may not change substantially, but all the cells in theassemblage may shift up or down their metabolic rate; (3) the number may not changesubstantially, but the proportions of cells in different physiological states may vary.Although this is not explicitly stated, the underlying assumption in many aquaticmicrobial studies is that variations in total community metabolism or growth arethe result of some combination of scenarios 1 and 2, and scenario 3 has seldombeen considered as an alternative, yet the evidence presented in the previous sectionswould suggest that this may in fact be one of the key underlying mechanisms in thepatterns of bacterial metabolism in marine systems.
There have been relatively few studies that have attempted to link the patterns inthe distribution of single cell activity with the patterns of bulk community meta-bolism. Several authors have shown that the rates of bacterial production and respi-ration relate more closely to the abundance of CTC-positive cells and HNA cellsthan to total counts (Lovejoy et al. 1996; del Giorgio et al. 1997; Smith 1998;Sherr et al. 1999a). Both the electron transport system measure of respiration andthe CTC count of respiring bacteria were found to be positively correlated in atleast one field study (Berman et al. 2001), and estuarine bacterial respiration wasalso strongly correlated to the number of CTC-positive cells (Smith 1998). In otherstudies, total red CTC fluorescence correlated to CO2 production in mixed bacterialassemblages in aerobic bioreactors (Cook and Garland 1997), and there was
282 SINGLE-CELL ACTIVITY IN MARINE BACTERIOPLANKTON

coherence between the patterns in CTC-positive cell abundance and CO2 productionin E. coli cultures under varying conditions (Creach et al. 2003).
In theory, not only growth rate, but also other key processes, such as bacterialgrowth efficiency (BGE), should be linked to the distribution of growth and activitywithin the community. For example, Figure 8.8b shows two scenarios: one commu-nity where all cells have similar growth rates and growth efficiencies and thus con-tribute equally to production and respiration, and another community that iscomposed of groups with different growth rates and growth efficiencies. In thiscase, the community growth rate and BGE are a function of the proportions ofeach physiological group. This latter scenario was explored by del Giorgio andNewell (in preparation), who hypothesized that highly active, CTC-positive bacteriahave both a high growth rate and higher growth efficiency. This hypothesis was testedwith coastal and salt marsh bacterioplankton communities with a wide range in bothbulk bacterial growth rate and growth efficiency. In this study, BGE was positivelycorrelated with the proportion of CTC-positive cells (Fig. 8.9a), suggesting thatthese cells may have higher BGE than less active, CTC-negative cells, and thatcommunity BGE was the direct result of the relative contributions of these groups.Furthermore, these authors found that BGE was also positively related to the fluor-escence of the CTC cells (orange or red: Fig. 8.9b), which is itself an index ofsingle-cell metabolic activity. These results further suggest that even within theCTC-positive cells there is a range of single-cell activity and that this may also belinked to their individual growth rate and efficiency. The best predictor of BGE inthese communities was in fact a combination of both the percentage of CTC-positivecells and their average fluorescence (Fig. 8.9c), exemplifying the interaction betweenthe proportion of cells in different physiological states, and the level of activity withinthese categories, and their roles in shaping metabolism at the community level.
Ecological Role of Different Physiological Fractions
There are some conceptual as well as practical differences between the ecology ofmicrobes and that of other organisms. Marine and terrestrial ecologists working on
Figure 8.9 Relationship between percentage of CTC-positive cells and bacterial growthefficiency (BGE) of the bulk assemblage (a), average fluorescence of the CTC-positive cells(b), and a combination of both parameters (c). The data are from various estuaries and lakesin Quebec and eastern United States. Equations are: (a) BGE ¼ 0.14 þ 0.015 CTC%, r2 ¼
0.53, N ¼ 88; (b) BGE ¼ 0.10 þ 0.077F, r2 ¼ 0.49, N ¼ 88; (c) BGE ¼ 0.19 þ 0.00389%CTC � F, r2 ¼ 0.64, N ¼ 88 where F ¼ fluorescence.
ECOLOGICAL IMPLICATIONS OF PATTERNS IN BACTERIOPLANKTON 283
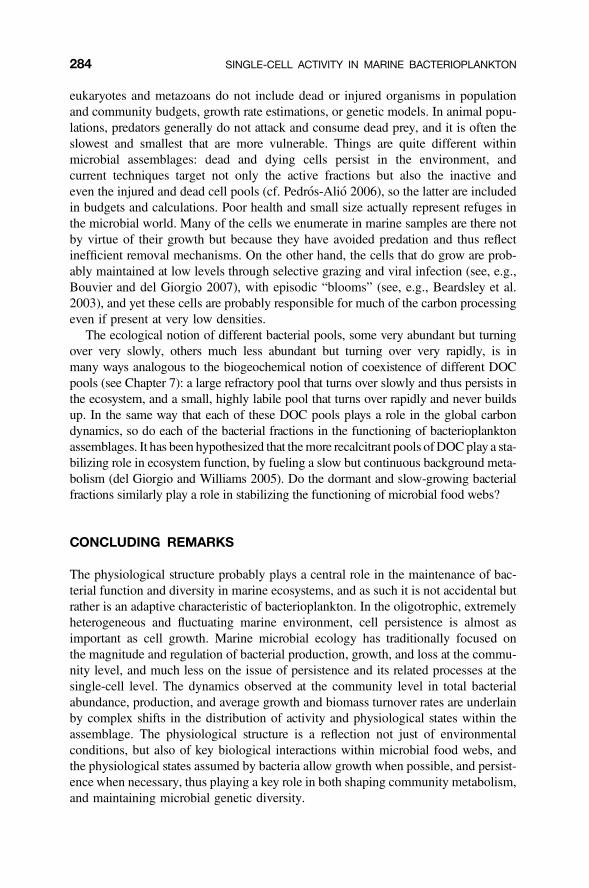
eukaryotes and metazoans do not include dead or injured organisms in populationand community budgets, growth rate estimations, or genetic models. In animal popu-lations, predators generally do not attack and consume dead prey, and it is often theslowest and smallest that are more vulnerable. Things are quite different withinmicrobial assemblages: dead and dying cells persist in the environment, andcurrent techniques target not only the active fractions but also the inactive andeven the injured and dead cell pools (cf. Pedros-Alio 2006), so the latter are includedin budgets and calculations. Poor health and small size actually represent refuges inthe microbial world. Many of the cells we enumerate in marine samples are there notby virtue of their growth but because they have avoided predation and thus reflectinefficient removal mechanisms. On the other hand, the cells that do grow are prob-ably maintained at low levels through selective grazing and viral infection (see, e.g.,Bouvier and del Giorgio 2007), with episodic “blooms” (see, e.g., Beardsley et al.2003), and yet these cells are probably responsible for much of the carbon processingeven if present at very low densities.
The ecological notion of different bacterial pools, some very abundant but turningover very slowly, others much less abundant but turning over very rapidly, is inmany ways analogous to the biogeochemical notion of coexistence of different DOCpools (see Chapter 7): a large refractory pool that turns over slowly and thus persists inthe ecosystem, and a small, highly labile pool that turns over rapidly and never buildsup. In the same way that each of these DOC pools plays a role in the global carbondynamics, so do each of the bacterial fractions in the functioning of bacterioplanktonassemblages. It has been hypothesized that the more recalcitrant pools of DOC play a sta-bilizing role in ecosystem function, by fueling a slow but continuous background meta-bolism (del Giorgio and Williams 2005). Do the dormant and slow-growing bacterialfractions similarly play a role in stabilizing the functioning of microbial food webs?
CONCLUDING REMARKS
The physiological structure probably plays a central role in the maintenance of bac-terial function and diversity in marine ecosystems, and as such it is not accidental butrather is an adaptive characteristic of bacterioplankton. In the oligotrophic, extremelyheterogeneous and fluctuating marine environment, cell persistence is almost asimportant as cell growth. Marine microbial ecology has traditionally focused onthe magnitude and regulation of bacterial production, growth, and loss at the commu-nity level, and much less on the issue of persistence and its related processes at thesingle-cell level. The dynamics observed at the community level in total bacterialabundance, production, and average growth and biomass turnover rates are underlainby complex shifts in the distribution of activity and physiological states within theassemblage. The physiological structure is a reflection not just of environmentalconditions, but also of key biological interactions within microbial food webs, andthe physiological states assumed by bacteria allow growth when possible, and persist-ence when necessary, thus playing a key role in both shaping community metabolism,and maintaining microbial genetic diversity.
284 SINGLE-CELL ACTIVITY IN MARINE BACTERIOPLANKTON
SUMMARY
1. Marine bacterioplankton assemblage have relative large proportions of cellswith extremely low metabolic rates, and which are dormant, injured or dead.
2. The low proportion of measurably active bacteria observed in many marineassemblages is not simply the result of oligotrophy and resource limitation.Selective removal processes, such as protistan grazing and viral infection,influence the physiological structure of bacterioplankton.
3. The range in physiological states reflects both the large physiological and meta-bolic versatility that characterizes individual marine bacterial strains and thehigh genetic and phenotypic diversity of bacterioplankton communities.
4. The proportion of highly active cells increases, and that of inactive or dormantcells declines systematically, along gradients of increasing system productivity.
5. The selective loss processes of specific physiological fractions change alongthese gradients, and, in particular, there is a relatively higher removal of themore active cells in the least productive systems. Cell injury and death maybe regulated by factors that are relatively independent of those that regulatecell activation and inactivation.
6. Single-cell variations in physiological state may in fact be the predominantstrategy both to cope with scarce and fluctuating resources and to escapefrom predation, viral infection, and other types of negative biological inter-actions. Low activity and eventually dormancy are part of long-term survivaland protection strategies, whereas high metabolic activity increases the poten-tial for growth, but also vulnerability to predation and death.
ACKNOWLEDGMENTS
We thank Thierry Bouvier, Erik Smith, and Laura Alonso-Saez for providing us withthe data of their compilations, Jerome Comte for ideas for Figure 8.1, and K. Jurgensand an anonymous reviewer for useful comments on the manuscript. Thomas Lefortand Lisa Fateaux helped collect the papers reviewed. We also thank Dave Kirchmanfor providing this opportunity to review the topic of bacterial single-cell activity inthe oceans. This work was supported by the National Science and EngineeringResearch Council of Canada (PdG), and projects MODIVUS (CTM2005-04795/MAR) and EU NoE MARBEF (JMG).
REFERENCES
Adolph, S., S. Bach, M. Blondel, A. Cueff, M. Moreau, G. Pohnert, S. A. Poulet, T. Wichard,and A. Zuccaro. 2004. Cytotoxicity of diatom-derived oxylipins in organisms belonging todifferent phyla. J. Exp. Biol. 207: 2935–2946.
Agogue, H., F. Joux, I. Obernosterer, and P. Lebaron. 2005. Resistance of marine bacterioneus-ton to solar radiation. Appl. Environ. Microbiol. 71: 5282–5289.
REFERENCES 285

Alonso-Saez, L., and J. M. Gasol. 2007. Seasonal variation in the contribution of different bac-terial groups to the uptake of low molecular weight-compounds in NW Mediterraneancoastal waters. Appl. Environ. Microbiol. 73: 3528–3535.
Alonso-Saez, L., J. M. Gasol, T. Lefort, J. Hofer, and R. Sommaruga. 2006. Impact of sunlightradiation on bacterial activity and differential sensitivity of natural bacterioplankton groupsin NW Mediterranean coastal waters. Appl. Environ. Microbiol. 72: 5806–5813.
Amann, R. J., B. J. Binder, R. J. Olson, S. W. Chisholm, R. Devereux, and D. A. Stahl. 1990.Combination of 16S rRNA-targeted oligonucleotide probes with flow cytometry for analy-zing mixed microbial populations. Appl. Environ. Microbiol. 56: 1919–1925.
Andersson, A., U. Larsson, and A. Hagstrom. 1986. Size-selective grazing by a microflagellateon pelagic bacteria. Mar. Ecol. Prog. Ser. 33: 51–57.
Arıstegui, J., C. M. Duarte, J. M. Gasol, and L. Alonso-Saez. 2005. Active mesopelagic pro-karyotes support high respiration in the subtropical northeast Atlantic Ocean. Geophys. Res.Lett. 32: L03608–L03612.
Arrieta, J. M., M. G. Weinbauer, and G. J. Herndl. 2000. Interspecific variability in sensitivityto UV radiation and subsequent recovery in selected isolates of marine bacteria. Appl.Environ. Microbiol. 66: 1468–1473.
Azam, F. 1998. Microbial control of oceanic carbon flux: The plot thickens. Science 280:694–696.
Bar, M., J. von Hardenberg, E. Meron, and A. Provenzale. 2002. Modelling the survival of bac-teria in drylands: The advantage of being dormant. Proc. Roy. Soc. Lond. Ser. B, Biol. Sci.269: 937–942.
Barer, M. R. 1997. Viable but non-culturable and dormant bacteria: Time to resolve an oxy-moron and a misnomer? J. Med. Microbiol. 46: 629–631.
Barer, M. R., and C. R. Harwood. 1999. Bacterial viability and culturability. Adv. Microb.Ecol. 41: 93–137.
Beardsley, C., J. Pernthaler, W. Wosniok, and R. Amann. 2003. Are readily culturable bacteriain coastal North Sea waters suppressed by selective grazing mortality? Appl. Environ.Microbiol. 69: 2624–2630.
Berman, T., B. Kaplan, S. Chava, Y. Viner, B. F. Sherr, and E. B. Sherr. 2001. Metabolicallyactive bacteria in Lake Kinneret. Aquat. Microb. Ecol. 23: 213–224.
Bernard, L., C. Courties, P. Servais, M. Troussellier, M. Petit, and P. Lebaron. 2000a.Relationships among bacterial cell size, productivity, and genetic diversity in aquaticenvironments using cell sorting and flow cytometry. Microb. Ecol. 40: 148–158.
Bernard, L., H. Schafer, F. Joux, C. Courties, G. Muyzer, and P. Lebaron. 2000b. Geneticdiversity of total, active and culturable marine bacteria in coastal seawater. Aquat.Microb. Ecol. 23: 1–11.
Billen, G., P. Servais, and S. Becquevort. 1990. Dynamics of bacterioplankton in oligotrophicand eutrophic aquatic environments: Bottom-up or top-down control? Hydrobiologia 207:37–42.
Bjørnsen, P. K., B. Riemann, J. Pock-Steen, T. G. Nielsen, and S. J. Horsted. 1989. Regulationof bacterioplankton production and cell volume in a eutrophic estuary. Appl. Environ.Microbiol. 55: 1512–1518.
Blackburn, N., F. Azam, and A. Hagstrom. 1997. Spatially explicit simulation of a microbialfood web. Limnol. Oceanogr. 42: 613–622.
Blackburn, N., T. Fenchel, and J. Mitchell. 1998. Microscale nutrient patches in planktonichabitats shown by chemotactic bacteria. Science 282: 2254–2256.
286 SINGLE-CELL ACTIVITY IN MARINE BACTERIOPLANKTON

Borneman, J. 1999. Culture-independent identification of microorganisms that respond tospecified stimuli. Appl. Environ. Microbiol. 65: 3398–3400.
Bouvier, T., and P. A. del Giorgio. 2002. Compositional changes in free-living bacterialcommunities along a salinity gradient in two temperate estuaries. Limnol. Oceanogr.47: 453–470.
Bouvier, T., and P. A. del Giorgio. 2003. Factors influencing the detection of bacterial cellsusing fluorescence in situ hybridization (FISH): A quantitative review of publishedreports. FEMS Microbiol. Ecol. 44: 3–15.
Bouvier, T., and P. A. del Giorgio. 2007. Key role of selective viral-induced mortality in deter-mining marine bacterial community composition. Environ. Microbiol. 9: 287–297.
Bouvier, T., P. A. del Giorgio, and J. M. Gasol. 2007. A comparative study of the cytometriccharacteristics of high and low nucleic-acid bacterioplankton cells from different aquaticecosystems. Environ. Microbiol. 9: 2050–2066.
Bratbak, G., M. Heldal, T. F. Thingstad, B. Riemann, and O. H. Haslund. 1992. Incorporationof viruses into the budget of microbial C-transfer. A first approach. Mar. Ecol. Prog. Ser.83: 273–280.
Brehm-Stecher, B. F., and E. A. Johnson. 2004. Single-cell microbiology: Tools, technologies,and applications. Microbiol. Molec. Biol. Rev. 68: 538–559.
Brock, T. D. 1967. Mode of filamentous growth of Leucothrix mucor in pure culture and innature, as studied by tritiated thymidine autoradiography. J. Bacteriol. 93: 985–990.
Caro, A., P. Got, and B. Baleux. 1999. Physiological changes of Salmonella typhimuriumcells under osmotic and starvation conditions by image analysis. FEMS Microbiol. Lett.179: 265–273.
Casamayor, E. O., R. Massana, S. Benlloch, et al. 2002. Changes in archaeal, bacterial andeukaryal assemblages along a salinity gradient by comparison of genetic fingerprintingmethods in a multipond solar saltern. Environ. Microbiol. 4: 338–348.
Catala, P., N. Parthuisot, L. Bernard, J. Baudart, K. Lemarchand, and P. Lebaron. 1999.Effectiveness of CSE to counterstain particles and dead bacterial cells with permeabilisedmembranes: Application to viability assessment in waters. FEMS Microbiol. Lett. 178:219–226.
Chesbro, W. M., M. Arbige, and R. Eifert. 1990. When nutrient limitation places bacteria inthe domains of slow growth: Metabolic, morphologic and cell cycle behavior. FEMSMicrobiol. Ecol. 74: 103–120.
Choi, J. W., E. B. Sherr, and B. F. Sherr. 1996. Relation between presence-absence of a visiblenucleoid and metabolic activity in bacterioplankton cells. Limnol. Oceanogr. 41:1161–1168.
Choi, J. W., B. F. Sherr, and E. B. Sherr. 1999. Dead or alive? A large fraction of ETS-inactivemarine bacterioplankton cells, as assessed by reduction of CTC, can become ETS-activewith incubation and substrate addition. Aquat. Microb. Ecol. 18: 105–115.
Chrzanowski, T. H., R. D. Crotty, J. G. Hubbard, and R. P. Welch. 1984. Applicability of thefluorescein diacetate method of detecting active bacteria in freshwater. Microb. Ecol. 10:179–185.
Clarke, R. G., and A. C. Pinder. 1998. Improved detection of bacteria by flow cyto-metry using the combination of antibody and viability markers. J. Appl. Microb. 84:577–584.
Colwell, R. R. 2000. Bacterial death revisited. In R. R. Colwell and D. J. Grimes (eds.),Nonculturable Microorganisms in the Environment. ASM Press, pp. 325–343.
REFERENCES 287
Cook, K. L., and J. L. Garland. 1997. The relationship between electron transport activity asmeasured by CTC reduction and CO2 production in mixed microbial communities.Microb. Ecol. 34: 237–247.
Cottrell, M. T., and D. L. Kirchman. 2000. Natural assemblages of marine proteobacteria andmembers of Cytophaga-Flavobacter cluster consuming low- and high-molecular-weightdissolved organic matter. Appl. Environ. Microbiol. 66: 1692–1697.
Cottrell, M. T., and D. L. Kirchman. 2003. Contribution of major bacterial groups to bacterialbiomass production (thymidine and leucine incorporation) in the Delaware estuary. Limnol.Oceanogr. 48: 168–178.
Cottrell, M. T., and D. L. Kirchman. 2004. Single-cell analysis of bacterial growth, cell size,and community structure in the Delaware estuary. Aquat. Microb. Ecol. 34: 139–149.
Creach, V., A.-C. Baudoux, G. Bertru, and B. Le Rouzic. 2003. Direct estimate of active bac-teria: CTC use and limitations. J. Microbiol. Methods 52: 19–28.
Darzynkiewicz, Z., and J. Kapuscinski. 1990. Acridine orange: A versatile probe of nucleicacids and other cell constituents. In M. R. Melamed, T. Lindmo, and M. L. Mendelsohn(eds.), Flow Cytometry and Cell Sorting, 2nd edn. Wiley-Liss, pp. 291–314.
Davey, H. M., D. H. Weichart, D. B. Kell, and A. S. Kaprelyants. 1999. Estimation of microbialviability using flow cytometry. Curr. Prot. Cytometry 11.3.1–11.3.20.
Davidson, A. T., P. G. Thompson, K. Westwood, and R. van den Enden. 2004. Estimation ofbacterioplankton activity in Tasmanian coastal waters and between Tasmania andAntarctica using stains. Aquat. Microb. Ecol. 37: 33–45.
del Giorgio, P. A., and T. C. Bouvier. 2002. Linking the physiologic and phylogenetic succes-sions in free-living bacterial communities along an estuarine gradient. Limnol. Oceanogr.47: 471–486.
del Giorgio, P. A., and G. Scarborough. 1995. Increase in the proportion of metabolically activebacteria along gradients of enrichment in freshwater and marine plankton: Implications forestimates of bacterial growth and production rates. J. Plankton Res. 17: 1905–1924.
del Giorgio, P. A., and P. J. LeB. Williams. 2005. The global significance of respiration inaquatic ecosystems: From single cells to the biosphere. In P. A. del Giorgio andP. J. LeB. Williams (eds.), Respiration in Aquatic Ecosystems. Oxford University Press,pp. 267–273.
del Giorgio, P. A., J. M. Gasol, D. Vaque, P. Mura, S. Agustı, and C. M. Duarte. 1996.Bacterioplankton community structure: Protists control net production and the proportionof active bacteria in a coastal marine community. Limnol. Oceanogr. 41: 1169–1179.
del Giorgio, P. A., Y. T. Prairie, and D. F. Bird. 1997. Coupling between rates of bacterial pro-duction and the abundance of metabolically active bacteria in lakes, enumerated using CTCreduction and flow cytometry. Microb. Ecol. 34: 144–154.
Diaper, J. P., K. Tither, and C. Edwards. 1992. Rapid assessment of bacterial viability by flowcytometry. Appl. Microbiol. Biotechnol. 38: 268–272.
Dive, C., H. Cox, J. V. Watson, and P. Workman. 1988. Polar fluorescein derivatives asimproved substrate probes for flow cytoenzymological assay of cellular esterases. Mol.Cell Probes 2: 131–145.
Eguchi, M., M. Ostrowski, F. Fegatella, J. Bowman, D. Nichols, T. Nishino, andR. Cavicchioli. 2001. Sphingomonas alaskensis strain AFO1, an abundant oligotrophicultramicrobacterium from the North Pacific. Appl. Environ. Microbiol. 67: 4945–4954.
288 SINGLE-CELL ACTIVITY IN MARINE BACTERIOPLANKTON

Epstein, S. S., and J. Rossel. 1995. Methodology of in situ grazing experiments: Evaluation of anew vital dye for preparation of fluorescently labeled bacteria. Mar. Ecol. Prog. Ser. 128:143–150.
Epstein, S. S., and M. P. Shiaris. 1992. Size-selective grazing of coastal bacterioplankton bynatural assemblages of pigmented flagellates, colorless flagellates, and ciliates. Microb.Ecol. 23: 211–225.
Fagerbakke, K. M., S. Norland, and M. Heldal. 1999. The inorganic ion content of nativeaquatic bacteria. Can. J. Microbiol. 45: 304–311.
Fegatella, F., and R. Cavicchioli. 2000. Physiological responses to starvation in the marine oli-gotrophic ultramicrobacterium Sphingomonas sp. strain RB2256. Appl. Environ. Microbiol.66: 2037–2044.
Fenchel, T. 1980. Suspension feeding in ciliated protozoa: Feeding rates and their ecologicalsignificance. Microb. Ecol. 6: 13–25.
Ferenci, T. 2001. Hungry bacteria—definition and properties of a nutritional state. Environ.Microbiol. 3: 605–611.
Fiksdal, L., and I. Tryland. 1999. Effect of U.V. light irradiation, starvation and heat onEscherichia coli b-D-galactosidase activity and other potential viability parameters. J.Appl. Microbiol. 87: 62–71.
Francisco, D. E., R. A. Mah, and A. C. Rabin. 1973. Acridine orange-epifluorescence tech-nique for counting bacteria in natural waters. Trans. Am. Microsc. Soc. 93: 416–421.
Freese, H. M., U. Karsten, and R. Schumann. 2006. Bacterial abundance, activity, and viabilityin the eutrophic river Warnow, Northeast Germany. Microb. Ecol. 51: 117–127.
Freifelder, D. 1987. Microbial Genetics. Jones and Bartlett.
Fuchs, B., D. Woebken, M. V. Zubkov, P. Burkill, and R. Amann. 2005. Molecular identifi-cation of picoplankton populations in contrasting waters of the Arabian Sea. Aquat.Microb. Ecol. 39: 145–157.
Fuhrman, J. A. 1981. Influence of methods on the apparent size distribution of bacterioplank-ton cells: Epifluorescence microscopy compared to scanning electron microscopy. Mar.Ecol. Prog. Ser. 5: 103–106.
Gasol, J. M., and J. Arıstegui. 2007. Cytometric evidence reconciling the toxicity and useful-ness of CTC as a marker of bacterial activity. Aquat. Microb. Ecol. 46: 71–83.
Gasol, J. M., and P. A. del Giorgio. 2000. Using flow cytometry for counting natural planktonicbacteria and understanding the structure of planktonic bacterial communities. ScientiaMarina 64: 197–224.
Gasol, J. M., P. A. del Giorgio, R. Massana, and C. M. Duarte. 1995. Active versus inactivebacteria: Size-dependence in a coastal marine plankton community. Mar. Ecol. Prog.Ser. 128: 91–97.
Gasol, J. M., M. D. Doval, J. Pinhassi, J. I. Calderon-Paz, N. Guixa-Boixareu, D. Vaque, andC. Pedros-Alio. 1998. Diel variations in bacterial heterotrophic production in theNortwestern Mediterranean Sea. Mar. Ecol. Prog. Ser. 164: 125–133.
Gasol, J. M., U. L. Zweifel, F. Peters, J. A. Fuhrman, and A. Hagstrom. 1999. Significance ofsize and nucleic acid content heterogeneity as measured by flow cytometry in natural plank-tonic bacteria. Appl. Environ. Microbiol. 65: 4475–4483.
Gasol, J. M., I. Joint, K. Garde, et al. 2004. Control of heterotrophic prokaryotic abundance andgrowth rate in hypersaline planktonic environments. Aquat. Microb. Ecol. 34: 193–206.
REFERENCES 289

Gonzalez, J. M., E. B. Sherr, and B. F. Sherr. 1990. Size-selective grazing on bacteria bynatural assemblages of estuarine flagellates and ciliates. Appl. Environ. Microbiol. 56:583–589.
Gonzalez, J. M., E. B. Sherr, and B. F. Sherr. 1993. Differential feeding by marine flagellateson growing versus starving, and on motile versus non-motile, bacterial prey. Mar. Ecol.Prog. Ser. 102: 257–267.
Gregori, G., S. Citterio, A. Ghiani, M. Labra, S. Sgorbati, S. Brown, and M. Denis. 2001.Resolution of viable and membrane-compromised bacteria in freshwater and marinewaters based on analytical flow cytometry and nucleic acid double staining. Appl.Environ. Microbiol. 67: 4662–4670.
Gribbon, L. T., and M. R. Barer. 1995. Oxidative metabolism in nonculturable Heliobacterpylori and Vibrio vulnificus cells studied by substrate-enhanced tetrazolium reduction anddigital image processing. Appl. Environ. Microbiol. 61: 3379–3384.
Gross, E. M. 2003. Allelopathy of aquatic autotrophs. Crit. Rev. Plant Sci. 22: 313–339.
Grossart, H.-P., L. Riemann, and F. Azam. 2001. Bacterial motility in the sea and its ecologicalimplications. Aquat. Microb. Ecol. 25: 247–258.
Hagstrom, A., J, Pinhassi, and U. L. Zweifel. 2001. Marine bacterioplankton show bursts ofrapid growth induced by substrate shifts. Aquat. Microb. Ecol. 24: 109–115.
Hamasaki, K., A. Taniguchi, Y. Tada, R. A. Long, and F. Azam. 2007. Actively growingbacteria in the Inland Sea of Japan, identified by combined bromodeoxyuridine immu-nocapture and denaturing gradient gel electrophoresis. Appl. Environ. Microbiol. 73:2787–2798.
Haugland, R. P. 2005. A Guide to Fluorescent Probes and Labeling Technologies, 10th edn.Invitrogen Corp.
Heissenberger, A., G. G. Leppard, and G. J. Herndl. 1996. Relationship between the intracellu-lar integrity and the morphology of the capsular envelope in attached and free-living marinebacteria. Appl. Environ. Microbiol. 62: 4521–4528.
Heldal, M., D. J. Scanlan, S. Norland, F. Thingstad, and N. H. Mann. 2003. Elemental com-position of single cells of various strains of marine Prochlorococcus and Synechococcususing X-ray microanalysis. Limnol. Oceanogr. 48: 1732–1743.
Herndl, G. J., G. Muller-Niklas, and J. Frick. 1993. Major role of ultraviolet-B in controllingbacterioplankton growth in the surface layer of the ocean. Nature 361: 717–719.
Herndl, G. J., T. Reinthaler, E. Teira, H. van Aken, C. Veth, A. Pernthaler, and J. Pernthaler.2005. Contribution of Archaea to total prokaryotic production in the deep Atlantic Ocean.Appl. Environ. Microbiol. 71: 2303–2309.
Hollibaugh, J. T. 1976. The biological degradation of arginine and glutamic acid in seawater inrelation to the growth of phytoplankton. Mar. Biol. 36: 303–312.
Hoppe, H.-G. 1976. Determination and properties of actively metabolizing heterotrophicbacteria in the sea, investigated by means of micro-autoradiography. Mar. Biol.36: 291–302.
Howard-Jones, M. H., M. E. Frischer, and P. G. Verity. 2001. Determining the physiologicalstatus of individual bacterial cells. In J. Paul (ed.), Methods in Microbiology. AcademicPress, pp. 175–205.
Ihssen, J., and T. Egli. 2005. Global physiological analysis of carbon- and energy-limitedgrowing Escherichia coli confirms a high degree of catabolic flexibility and preparednessfor mixed substrate utilization. Environ. Microbiol. 7: 1568–1581.
290 SINGLE-CELL ACTIVITY IN MARINE BACTERIOPLANKTON
Jannasch, H. W., and G. E. Jones. 1959. Bacterial populations in sea water as determined bydifferent methods of enumeration. Limnol. Oceanogr. 4: 128–139.
Jepras, R. I., J. Carter, S. C. Pearson, F. E. Paul, and M. J. Wilkinson. 1995. Development of arobust flow cytometric assay for determining numbers of viable bacteria. Appl. Environ.Microbiol. 61: 2696–2701.
Jochem, F. J., P. J. Lavrentyev, and M. R. First. 2004. Growth and grazing rates of bacteria groupswith different apparent DNA content in the Gulf of Mexico. Mar. Biol. 145: 1213–1225.
Joux, F., and P. Lebaron. 1997. Ecological implications of an improved direct viable countmethod for aquatic bacteria. Appl. Environ. Microbiol. 63: 3643–3647.
Joux, F., and P. Lebaron. 2000. Use of fluorescent probes to assess physiological functions ofbacteria at single-cell level. Microbes Infect. 2: 1523–1535.
Joux, F., P. Lebaron, and M. Troussellier. 1997a. Succession of cellular states in a Salmonellatyphimurium population during starvation in artificial seawater microcosms. FEMSMicrobiol. Ecol. 22: 65–76.
Joux, F., P. Lebaron, and M. Troussellier. 1997b. Changes in cellular states of the marine bac-terium Deleya aquamarina. Appl. Environ. Microbiol. 63: 2686–2694.
Joux, F., W. H. Jeffrey, P. Lebaron, and D. L. Mitchell. 1999. Marine bacterial isolatesdisplay diverse responses to UV-B radiation. Appl. Environ. Microbiol. 65: 3820–3827.
Jurgens, K., and H. Gude. 1994. The potential importance of grazing-resistant bacteria inplanktonic systems. Mar. Ecol. Prog. Ser. 112: 169–188.
Karner, M., and J. A. Fuhrman. 1997. Determination of active marine bacterioplankton: a com-parison of universal 16S rRNA probes, autoradiography, and nucleoid staining. Appl.Environ. Microbiol. 63: 1208–1213.
Kawai, M., N. Yamaguchi, and M. Masu. 1999. Rapid enumeration of physiologically activebacteria in purified water used in the pharmaceutical manufacturing process. J. Appl.Microbiol. 86: 496–504.
Kell, D. B., A. S. Kaprelyants, D. H. Weichart, C. R. Harwood, and M. R. Barer. 1998.Viability and activity in readily culturable bacteria: a review and discussion of the practicalissues. Antonie van Leeuwenhoek 73: 169–187.
Kieber, D. J., J. McDaniel, and K. Mopper. 1989. Photochemical source of biological sub-strates in sea water: Implications for carbon cycling. Nature 341: 637–639.
Kirchman, D. L., A. I. Dittel, R. R. Malmstrom, and M. T. Cottrell. 2005. Biogeography ofmajor bacterial groups in the Delaware estuary. Limnol. Oceanogr. 50: 1697–1706.
Kjelleberg, S., M. Hermansson, P. Marden, and G. W. Jones. 1987. The transient phasebetween growth and nongrowth of heterotrophic bacteria, with emphasis on the marineenvironment. Annu. Rev. Microbiol. 41: 25–49.
Kjelleberg, S., N. Albertson, K. F1ardh, L. Holmquist, A. Jouper-Jaan, R. Marouga, J. Ostling,B. Svenblad, and D. Weichart. 1993. How do non-differentiating bacteria adapt to star-vation? Antonie van Leeuwenhoek 63: 333–341.
Koch, A. L. 1997. Microbial physiology and ecology of slow growth. Microbiol. Mol. Biol.Rev. 61: 1092–2172.
Kogure, K, U. Simidu, and N. Taga. 1979. A tentative direct microscopic method for countingliving marine bacteria. Can. J. Microbiol. 25: 415–420.
Kogure, K., U. Simidu, N. Taga, and R. R. Colwell. 1987. Correlation of direct viable countwith heterotrophic activity for marine bacteria. Appl. Environ. Microbiol. 53: 2332–2337.
REFERENCES 291

Konopka, A. 2004. Theoretical analysis of the starvation response under subtrate pulses.Microb. Ecol. 38: 321–329.
Lebaron, P., P. Catala, and N. Parthuisot. 1998. Effectiveness of SYTOX Green Stain for bac-terial viability assessment. Appl. Environ. Microbiol. 64: 2697–2700.
Lebaron, P., P. Servais, H. Agogue, C. Courties, and F. Joux. 2001. Does the high nucleic acidcontent of individual bacterial cells allow us to discriminate between active cells andinactive cells in aquatic systems? Appl. Environ. Microbiol. 67: 1775–1782.
Lebaron, P., P. Servais, A.-C. Baudoux, M. Bourrain, C. Courties, and N. Parthuisot. 2002.Variations of bacterial-specific activity with cell size and nucleic acid content assessedby flow cytometry. Aquat. Microb. Ecol. 28: 131–140.
Lee, N., P. H. Nielsen, K. H. Andreasen, S. Juretschko, J. L. Nielsen, K.-H. Schleifer, andM. Wagner. 1999. Combination of fluorescent in situ hybridization and microautoradio-graphy—a new tool for structure-function analyses in microbial ecology. Appl. Environ.Microbiol. 65: 1289–1297.
Leyval, D., F. Debay, J.-M. Engasser, and J.-L. Goergen. 1997. Flow cytometry for the intra-cellular pH measurement of glutamate producing Corynebacterium glutamicum. J.Microbiol. Meth. 29: 121–127.
Li, W. K. W., J. F. Jellett, and P. M. Dickie. 1995. DNA distributions in planktonic bacteriastained with TOTO or TO-PRO. Limnol. Oceanogr. 40: 1485–1495.
Long, R. A., and F. Azam. 2001. Antagonistic interactions among marine pelagic bacteria.Appl. Environ. Microbiol. 67: 4975–4983.
Longnecker, K., B. F. Sherr, and E. B. Sherr. 2005. Activity and phylogenetic diversity of bac-terial cells with High and Low nucleic acid content and electron transport system activity inan upwelling ecosystem. Appl. Environ. Microbiol. 71: 7737–7749.
Longnecker, K., D. S. Homen, E. B. Sherr, and B. F. Sherr. 2006. Similar community structureof biosynthetically active prokaryotes across a range of ecosystem trophic states. Aquat.Microb. Ecol. 42: 265–276.
Lopez-Amoros, R., J. Comas, and J. Vives-Rego. 1995a. Flow cytometric assessment ofEscherichia coli and Salmonella typhimurium starvation-survival in seawater using rhoda-mine 123, propidium iodine, and oxonol. Appl. Environ. Microbiol. 61: 2521–2526.
Lopez-Amoros, R., D. J. Mason, and D. Lloyd. 1995b. Use of two oxonols and a fluorescenttetrazolium dye to monitor starvation of Escherichia coli in seawater by flow cytometry. J.Microbiol. Meth. 22: 165–176.
Lovejoy, C., L. Legendre, B. Klein, J.-E. Tremblay, R. G. Ingram, and J.-C. Therriault. 1996.Bacterial activity during early winter mixing (Gulf of St. Lawrence, Canada). Aquat.Microb. Ecol. 10: 1–13.
Luna, G. M., E. Manini, and R. Danovaro. 2002. Large fraction of dead and inactive bacteria incoastal marine sediments: Comparison of protocols for determination and ecological signifi-cance. Appl. Environ. Microbiol. 68: 3509–3513.
Maalej, A., M. Denis, and S. Dukan. 2004. Temperature and growth-phase effects onAeromonas hydrophila survival in natural seawater microcosms: Role of protein synthesisand nucleic acid content on viable but temporarily nonculturable response. Microbiology150: 181–187.
McCarthy, M. D., J. I. Hedges, and R. Benner. 1998. Major bacterial contribution to marinedissolved organic nitrogen. Science 281: 231–234.
292 SINGLE-CELL ACTIVITY IN MARINE BACTERIOPLANKTON

Maki, J. S., and C. C. Remsen. 1981. Comparison of two direct-count methods for determiningmetabolizing bacteria in freshwater. Appl. Environ. Microbiol. 41: 1132–1138.
Malits, A., F. Peters, M. Bayer-Giraldi, C. Marrase, A. Zoppini, O. Guadayol, and M. Alcaraz.2004. Effects of small-scale turbulence on bacteria: A matter of size. Microb. Ecol. 48:287–299.
Manini, E., and R. Danovaro. 2006. Synoptic determination of living/dead and active/dormantbacterial fractions in marine sediments. FEMS Microbiol. Ecol. 55: 416–423.
Maranger, R., P. A. del Giorgio, and D. F. Bird. 2002. Accumulation of damaged bacteria andviruses in lake water exposed to solar radiation. Aquat. Microb. Ecol. 28: 213–227.
Mary, I., J. L. Heywood, B. M. Fuchs, R. Amann, G. A. Tarran, P. H. Burkill, andM. V. Zubkov. 2006. SAR11 dominance among metabolically active low nucleic acidbacterioplankton in surface waters along an Atlantic meridional transect. Aquat. Microb.Ecol. 45: 107–113.
Mason, C. A., G. Hamer, and J. D. Bryers. 1986. The death and lysis of microorganisms inenvironmental processes. FEMS Microbiol. Lett. 39: 373–384.
Mason, D. J., R. Lopez-Amoros, R. Allman, J. M. Stark, and D. Lloyd. 1995. The ability ofmembrane potential dyes and calcafluor white to distinguish between viable and non-viable bacteria. J. Appl. Bacteriol. 78: 309–315.
Matz, C., and K. Jurgens. 2001. Effects of hydrophobic and electrostatic cell surface propertiesof bacteria on feeding rates of heterotrophic nanoflagellates. Appl. Environ. Microbiol. 67:814–820.
Meyer-Reil, L.-A. 1978. Autoradiography and epifluorescence microscopy combined for thedetermination of number and spectrum of actively metabolizing bacteria in naturalwaters. Appl. Environ. Microbiol. 36: 506–512.
Middelboe, M, A. Hagstrom, N. Blackburn, B. Sinn, U. Fischer, N. H. Borch, J. Pinhassi,K. Simu, and M. G. Lorenz. 2001. Effects of bacteriophages on the population dynamicsof four strains of pelagic marine bacteria. Microb. Ecol. 42: 395–406.
Miller, M. B., and B. L. Bassler. 2001. Quorum sensing in bacteria. Annu. Rev. Microbiol. 55:165–199.
Miskin, I., G. Rhodes, K. Lawlor, J. R. Saunders, and R. W. Pickup. 1998. Bacteria in post-glacial freshwater sediments. Microbiology 144: 2427–2439.
Monger, B. C., M. R. Landry, and S. L. Brown. 1999. Feeding selection of heterotrophicmarine nanoflagellates based on the surface hydrophobicity of their picoplankton prey.Limnol. Oceanogr. 44: 1917–1927.
Moran, M. A., and R. G. Zepp. 1997. Role of photoreactions in the formation of biologicallylabile compounds from dissolved organic matter. Limnol. Oceanogr. 42: 1307–1316.
Morita, R. Y. 1997. Bacteria in Oligotrophic Environments. Chapman and Hall.
Munro, P. M., M. J. Gauthier, V. A. Breittmayer, and J. Bongiovanni. 1989. Influence ofosmoregulation processes on starvation survival of Escherichia coli in seawater. Appl.Environ. Microbiol. 55: 2017–2024.
Nagata, T. 2000a. “Picopellets” produced by phagotrophic nanoflagellates: Role in materialcycling within marine environments. In N. Handa, E. Tanoue, and T. Hama (eds.),Dynamics and Characterization of Marine Organic Matter. Terrapub/Kluwer, pp. 241–256.
Nagata, T. 2000b. Production mechanisms of dissolved organic matter. In D. L. Kirchman(ed.), Microbial Ecology of the Oceans, 1st edn. Wiley-Liss, pp. 121–152.
REFERENCES 293
Nagata, T., and D. L. Kirchman. 2000. Bacterial mortality: A pathway for the formation ofrefractory DOM? In C. R. Bell, M. Brylinsky, and P. Johnson-Green (eds.), MicrobialBiosystems: New Frontiers—Proceedings of the 8th International Symposium onMicrobial Ecology. Atlantic Canada Society for Microbial Ecology, pp. 153–158.
Nebe-von Caron, G., P. J. Stephens, C. J. Hewitt, J. R. Powell, and R. A. Badley. 2000.Analysis of bacterial function by multi-colour fluorescence flow cytometry and singlecell sorting. J Microbiol. Meth. 42: 97–114.
Newell, S. Y., R. D. Fallon, and P. S. Tabor. 1986. Direct microscopy of natural assemblages.In J. S. Poindexter, and E. R. Leadbetter (eds.), Bacteria in Nature, Vol. 1. Plenum Press,pp. 1–48.
Nir, R., Y. Yisraeli, R. Lamed, and E. Sahar. 1990. Flow cytometry sorting of viable bacteriaand yeasts according to b-galactosidase activity. Appl. Environ. Microbiol. 56: 3861–3866.
Noble, R. T., and J. A. Fuhrman. 1997. Virus decay and its causes in coastal waters. Appl.Environ. Microbiol. 63: 77–83.
Novo, D., N. G. Perlmutter, R. H. Hunt, and H. M. Shapiro. 1999. Accurate flow cytometricmembrane potential measurement in bacteria using diethyloxacarbocyanine and a radio-metric technique. Cytometry 35: 55–63.
Nystrom, T., R. M. Olsson, and S. Kjelleberg. 1992. Survival, stress resistance and alterationsin protein expression in the marine Vibrio sp. S14 during starvation for different individualnutrients. Appl. Environ. Microbiol. 58: 55–65.
Oda, Y., S.-J. Slagman, W. G. Meijer, L. J. Forney, and J. C. Gottschal. 2000. Influence ofgrowth rate and starvation on fluorescent in situ hybridization of Rhodopseudomonas palu-stris. FEMS Microbiol. Ecol. 32: 205–213.
Oliver, J. D. 2000. The viable but nonculturable state and cellular resuscitation. In C. R. Bell,M. Brylinsky, and P. Johnson-Green (eds.), Microbial Biosystems: New Frontiers—Proceedings of the 8th International Symposium on Microbial Ecology. Atlantic CanadaSociety for Microbial Ecology, pp. 723–730.
Ouverney, C. C., and J. A. Fuhrman. 1999. Combined microautoradiography-16S rRNA probetechnique for determination of radioisotope uptake by specific microbial cell types in situ.Appl. Environ. Microbiol. 65: 1746–1552.
Painchaud, J., J.-C. Therriault, and L. Legendre. 1995. Assessment of salinity-related mortalityof freshwater bacteria in the Saint Lawrence estuary. Appl. Environ. Microbiol. 61:205–208.
Pearce, I., A. T. Davidson, E. M. Bell, and S. Wright. 2007. Seasonal changes in the concen-tration and metabolic activity of bacteria and viruses at an Antarctic coastal site. Aquat.Microb. Ecol. 47: 11–23.
Pedros-Alio, C. 2006. Marine microbial diversity: Can it be determined? Trends Microbiol. 14:257–262.
Pedros-Alio, C., and S. Y. Newell. 1989. Microautoradiographic study of thymidine uptake inbrackish waters around Sapelo Island, Georgia, USA. Mar. Ecol. Prog. Ser. 55: 83–94.
Pernthaler, J., T. Posch, K. Simek, J. Vrba, R. Amann, and R. Psenner. 1997. Contrasting bac-terial strategies to coexist with a flagellate predator in an experimental microbial assem-blage. Appl. Environ. Microbiol. 63: 596–601.
Pernthaler, A., J. Pernthaler, M. Schattenhofer, and R. Amann. 2002. Identification of DNA-synthesizing bacterial cells in coastal North Sea plankton. Appl. Environ. Microbiol. 68:5728–5736.
294 SINGLE-CELL ACTIVITY IN MARINE BACTERIOPLANKTON

Pirker, H., C. Pausz, K. E. Storedegger, and G. J. Herndl. 2005. Simultaneous measurement ofmetabolic activity and membrane integrity in marine bacterioplankton determined by con-focal laser-scanning microscopy. Aquat. Microb. Ecol. 39: 225–233.
Pomeroy, L. R. 1974. The ocean’s food web, a changing paradigm. BioScience 24: 499–504.
Pomeroy, L. R., and W. J. Wiebe. 2001. Temperature and substrates as interactive limitingfactors for marine heterotrophic bacteria. Aquat. Microb. Ecol. 23: 187–204.
Porter, J., J. Diaper, C. Edwards, and R. Pickup. 1995. Direct measurements of natural planktonicbacterial community viability by flow cytometry. Appl. Environ. Microbiol. 61: 2783–2786.
Posch, T., J. Pernthaler, A. Alfreider, and R. Psenner. 1997. Cell-specific respiratory activity ofaquatic bacteria studied with the tetrazolium reduction method, cyto-clear slides, and imageanalysis. Appl. Environ. Microbiol. 63: 863–873.
Price, N. M., P. J. Harrison, M. R. Landry, F. Azam, and K. J. F. Hall. 1986. Toxic effects oflatex and Tygon tubing on marine phytoplankton, zooplankton and bacteria. Mar. Ecol.Prog. Ser. 34: 41–49.
Quinn, J. P. 1984. The modification and evaluation of some cytochemical techniques for theenumeration of metabolically active heterotrophic bacteria in the aquatic environment. J.Appl. Bacteriol. 57: 51–57.
Rae, R., and W. F. Vincent. 1998. Effects of temperature and ultraviolet radiation on microbialfoodweb structure: potential responses to global change. Freshwater Biol. 40: 747–758.
Rappe, M. S., S. A. Connon, K. L. Vergin, and S. J. Giovanonni. 2002. Cultivation of the ubi-quitous SAR11 marine bacterioplankton clade. Nature 418: 630–633.
Robertson, B. R., and D. K. Button. 1989. Characterizing aquatic bacteria according to popu-lation, cell size, and apparent DNA content by flow cytometry. Cytometry 10: 70–76.
Rodrıguez, G. G., D. Phipps, K. Ishiguro, and H. F. Ridgway. 1992. Use of a fluorescent redoxprobe for direct visualization of actively respiring bacteria. Appl. Environ. Microbiol. 58:1801–1808.
Roszak, D. B., and R. R. Colwell. 1987. Survival strategies of bacteria in the natural environ-ment. Microbiol. Rev. 51: 365–379.
Roth, B. L., M. Poot, S. T. Yue, and P. J. Millard. 1997. Bacterial viability and antibiotic sus-ceptibility testing with SYTOX green nucleic acid stain. Appl. Environ. Microbiol. 63:2421–2431.
Saunders, G. W. Jr. 1959. The application of radioactive tracers to the study of lake meta-bolism. PhD Thesis, University of Michigan.
Schultz, G. E., and H. Ducklow. 2000. Changes in bacterioplankton metabolic capabilities along asalinity gradient in the York River estuary, Virginia, USA. Aquat. Microb. Ecol. 22: 163–174.
Schumann, R., U. Schiewer, U. Karsten, and T. Rieling. 2003. Viability of bacteria from differ-ent aquatic habitats. II. Cellular fluorescent markers for membrane integrity and metabolicactivity. Aquat. Microb. Ecol. 32: 137–150.
Schut, F., R. A. Prins, and J. C. Gottschal. 1997. Oligotrophy and pelagic marine bacteria:Facts and fiction. Aquat. Microb. Ecol. 12: 177–202.
Servais, P., C. Courties, P. Lebaron, and M. Troussellier. 1999. Coupled bacterial activitymeasurements with cell sorting by flow cytometry. Microb. Ecol. 38: 180–189.
Servais, P., E. O. Casamayor, C. Courties, P. Catala, N. Parthuisot, and P. Lebaron. 2003.Activity and diversity of bacterial cells with high and low nucleic acid content. Aquat.Microb. Ecol. 33: 41–51.
REFERENCES 295
Servais, P., H. Agogue, C. Courties, F. Joux, and P. Lebaron. 2001. Are the actively respiringcells (CTCþ) those responsible for bacterial production in aquatic environments? FEMSMicrobiol. Ecol. 35: 171–179.
Seymour, J. R., J. G. Mitchell, and L. Seuront. 2004. Microscale heterogeneity in the activity ofcoastal bacterioplankton communities. Aquat. Microb. Ecol. 35: 1–16.
Sherr, B. F., P. A. del Giorgio, and E. B. Sherr. 1999a. Estimating abundance and single-cellcharacteristics of respiring bacteria via the redox dye CTC. Aquat. Microb. Ecol. 18: 117–131.
Sherr, E. B., B. F. Sherr, and C. T. Sigmon. 1999b. Activity of marine bacteria under incubatedand in situ conditions. Aquat. Microb. Ecol. 20: 213–223.
Sherr, E. B., B. F. Sherr, and T. J. Cowles. 2001. Mesoscale variability in bacterial activity inthe Northeast Pacific Ocean off Oregon, USA. Aquat. Microb. Ecol. 25: 21–30.
Sherr, E. B., B. F. Sherr, and P. G. Verity. 2002. Distribution and relation of total bacteria,active bacteria, bacterivory, and volume of organic detritus in Atlantic continental shelfwaters off Cape Hatteras NC, USA. Deep-Sea Res. 49: 4571–4585.
Sieracki, M. E., T. L. Cucci, and J. Nicinski. 1999. Flow cytometric analysis of 5-cyano-2,3-ditolyl tetrazolium chloride activity of marine bacterioplankton in dilution cultures. Appl.Environ. Microbiol. 65: 2409–2417.
Simek, K., J. Vrba, and P. Hartman. 1994. Size-selective feeding by Cyclidium sp. on bacterio-plankton and various sizes of cultured bacteria. FEMS Microbiol. Ecol. 14: 157–168.
Simek, K., J. Vrba, J. Pernthaler, T. Posch, P. Hartman, J. Nedoma, and R. Psenner. 1997.Morphological and compositional shifts in an experimental bacterial community influencedby protists with contrasting feeding modes. Appl. Environ. Microbiol. 63: 587–595.
Simu, K., K. Holmfeldt, U. L. Zweifel, and A. Hagstrom. 2005. Culturability and coexistenceof colony-forming and single-cell marine bacterioplankton. Appl. Environ. Microbiol. 71:4793–4800.
Sintes, E., and G. J. Herndl. 2006. Quantifying substrate uptake by individual cells of marinebacterioplankton by catalyzed reporter deposition fluorescence in situ hybridization com-bined with microautoradiography. Appl. Environ Microbiol. 72: 7022–7028.
Smith, E. M. 1998. Coherence of microbial respiration rate and cell-specific bacterial activity ina coastal planktonic community. Aquat. Microb. Ecol. 16: 27–35.
Smith, E. M., and P. A. del Giorgio. 2003. Low fractions of active bacteria in natural aquaticcommunities? Aquat. Microb. Ecol. 31: 203–208.
Smith, J. J., and G. A. McFeters. 1997. Mechanisms of INT (2-(4-iodophenyl)-3-(4-nitrophenyl)-5-phenyl tetrazolium chloride) and CTC (5-cyano-2,3-ditolyl tetrazolium chloride) reduction inEscherichia coli K-12. J. Microbiol. Meth. 29: 161–175.
Smith, J. J., J. P. Howington, and G. A. McFeters. 1994. Survival, physiological response, andrecovery of enteric bacteria exposed to a polar marine environment. Appl. Environ.Microbiol. 60: 2977–2984.
Sommaruga, R., A. Oberleiter, and R. Psenner. 1996. Effect of UV radiation on the bacterivoryof a heterotrophic nanoflagellate. Appl. Environ. Microbiol. 62: 4395–4400.
Søndergaard, M., and M. Danielsen. 2001. Active bacteria (CTCþ) in temperate lakes:Temporal and cross-system variations. J. Plankton Res. 23: 1195–1206.
Staley, J. T., and A. Konopka. 1985. Measurement of in situ activities of nonphotosyntheticmicroorganisms in aquatic and terrestrial habitats. Annu. Rev. Microbiol. 39: 321–346.
296 SINGLE-CELL ACTIVITY IN MARINE BACTERIOPLANKTON

Stevenson, L. N. 1978. A case for bacterial dormancy in aquatic systems. Microb. Ecol. 4:127–133.
Storedegger, K. E., and G. J. Herndl. 2001. Visualization of the exopolysaccharide bacterialcapsule and its distribution in oceanic environments. Aquat. Microb. Ecol. 26: 195–199.
Storedegger, K. E., and G. J. Herndl. 2002. Distribution of capsulated bacterioplankton in theNorth Atlantic and North Sea. Microb. Ecol. 44: 154–163.
Suller, M. T. E., and D. Lloyd. 1999. Fluorescence monitoring of antibiotic-induced bacterialdamage using flow cytometry. Cytometry 35: 235–241.
Suttle, C. A., and F. Chen. 1992. Mechanisms and rates of decay of marine viruses in seawater.Appl. Environ. Microbiol. 58: 3721–3729.
Tabor, P. S., and R. A. Neihof. 1984. Direct determination of activities for microorganisms ofChesapeake Bay populations. Appl. Environ. Microbiol. 48: 1012–1019.
Tandoleke, R. D., D. Planas, and M. Lucotte. 2005. Microbial food webs in boreal humic lakesand reservoirs: Ciliates as a major factor related to the dynamics of the most active bacteria.Microb. Ecol. 49: 325–341.
Teixeira, P., H. Castro, C. Mohacsi-Farkas, and R. Kirby. 1997. Identification of sites of injuryin Lactobacillus bulgaricus during heat stress. J. Appl. Microbiol. 83: 219–226.
Thingstad, T. F., L. Øvreas, J. K. Egge, T. Løvdal, and M. Heldal. 2005. Use of non-limitingsubstrates to increase size; a generic strategy to simultaneously optimize uptake and mini-mize predation in pelagic osmotrophs? Ecol. Lett. 8: 675–682.
Tolker-Nielsen, T., M. H. Larn, H. Kyed, and S. Molin. 1997. Effects of stress treatments on thedetection of Salmonella typhimurium by in situ hybridization. Int. J. Food Microbiol. 34:251–258.
Troussellier, M., C. Courties, P. Lebaron, and P. Servais. 1999. Flow cytometric discriminationof bacterial populations in seawater based on SYTO 13 staining of nucleic acids. FEMSMicrobiol. Ecol. 29: 319–330.
Ullrich, S., B. Karrasch, H.-G. Hoppe, K. Jeskulke, and M. Mehrens. 1996. Toxic effects onbacterial metabolism of the redox dye 5-cyano-2,3-ditolyl tetrazolium chloride Appl.Environ. Microbiol. 62: 4587–4593.
Ullrich, S., B. Karrasch, and H.-G. Hoppe. 1999. Is the CTC dye technique an adequateapproach for estimating active bacterial cells? Aquat. Microb. Ecol. 17: 207–209.
Urbach, E., K. L. Vergin, and S. J. Giovannoni. 1999. Immunochemical detection and isolationof DNA from metabolically active bacteria. Appl. Environ. Microbiol. 65: 1207–1213.
Van Loodsrecht, M. C. M., J. Lyklema, W. Norde, G. Schraa, and A. J. B. Zehnder. 1987. The roleof bacterial cell wall hydrophobicity in adhesion. Appl. Environ. Microbiol. 53: 1893–1897.
Veldhuis, M. J. W., G. W. Kraay, and K. R. Timmermans. 2001. Cell death in phytoplankton:Correlation between changes in membrane permeability, photosynthetic activity, pigmen-tation and growth. Eur. J. Phycol. 36: 167–177.
Vollertsen, J., A. Jahn, J. L. Nielsen, T. Hvitved-Jacobsen, and P. H. Nielsen. 2001.Comparison of methods for determination of microbial biomass in wastewater. WaterRes. 35: 1649–1658.
Waterbury, J. B., and F. W. Valois. 1993. Resistance to co-occurring phages enables marineSynechococcus communities to coexist with cyanophages abundant in seawater. Appl.Environ. Microbiol. 59: 3393–3399.
REFERENCES 297

Weichart, D. H. 2000. Stability and survival of VBNC cells—conceptual and practicalimplications. In C. R. Bell, M. Brylinsky, and P. Johnson-Green (eds.), MicrobialBiosystems: New Frontiers—Proceedings of the 8th International Symposium onMicrobial Ecology. Atlantic Canada Society for Microbial Ecology, pp. 731–736.
Weinbauer, M. G. 2004. Ecology of prokaryotic viruses. FEMS Microbiol. Rev. 28: 127–181.
Wiebe, W. J., W. M. Sheldon Jr., and L. R. Pomeroy. 1992. Bacterial growth in the cold:Evidence for an enhanced substrate requirement. Appl. Environ. Microbiol. 58: 359–364.
Wilhelm, S. W., M. G. Weinbauer, C. A. Suttle, R. J. Pledger, and D. L. Mitchell. 1998.Measurements of DNA damage and photoreactivation imply that most viruses in marinesurface waters are infective. Aquat. Microb. Ecol. 14: 215–222.
Williams, S. C., Y. Hong, D. C. A. Danavall, M. H. Howard-Jones, D. Gibson, M. E. Frischer,and P. G. Verity. 1998. Distinguishing between living and nonliving bacteria: Evaluation ofthe vital stain propidium iodine and its combined use with molecular probes in aquaticsamples. J. Microbiol. Meth. 32: 225–236.
Xenopoulos, M. A., and D. F. Bird. 1997. Effect of acute exposure to hydrogen peroxide on theproduction of phytoplankton and bacterioplankton in a mesohumic lake. Photochem.Photobiol. 66: 471–478.
Yager, P. L., T. L. Connelly, B. Mortazavi, K. E. Wommack, N. Bano, J. E. Bauer, S. Opsahl,and J. T. Hollibaugh. 2001. Dynamic bacterial and viral response to an algal bloom atsubzero temperatures. Limnol. Oceanogr. 46: 790–801.
Yakimov, M. M., G. Gentile, V. Bruni, S. Cappello, G. D’Auria, P. N. Golyshin, andL. Giuliano. 2004. Crude oil-induced structural shift of coastal bacterial communities ofrod bay (Terra Nova Bay, Ross Sea, Antarctica) and characterization of cultured cold-adapted hydrocarbonoclastic bacteria. FEMS Microbiol. Ecol. 49: 419–432.
Yamaguchi, N., and M. Nasu. 1997. Flow cytometric analysis of bacterial respiratory and enzy-matic activity in the natural aquatic environment. J. Appl. Microbiol. 83: 43–52.
Yokokawa, T., and T. Nagata. 2005. Growth and grazing mortality rates of phylogenetic groupsof bacterioplankton in coastal marine environments. Appl. Environ. Microbiol. 71:6799–6807.
Yokomaku, D., N. Yamaguchi, and M. Nasu. 2000. Improved direct viable count procedure forquantitative estimation of bacterial viability in freshwater environments. Appl. Environ.Microbiol. 66: 5544–5548.
Zampino, D., R. Zaccone, and R. La Ferla. 2004. Determination of living and active bacterio-plankton: A comparison of methods. Chem. Ecol. 20: 411–422.
Zimmermann, R., R. Iturriaga, and J. Becker-Birck. 1978. Simultaneous determination of thetotal number of aquatic bacteria and the number thereof involved in respiration. Appl.Environ. Microbiol. 36: 926–935.
Zubkov, M. V., B. M. Fuchs, P. H. Burkill, and R. Aman. 2001. Comparison of cellular andbiomass specific activities of dominant bacterioplankton groups in stratified waters of theCeltic Sea. Appl. Environ. Microbiol. 67: 5210–5218.
Zubkov, M. V., J. I. Allen, and B. M. Fuchs. 2004. Coexistence of dominant groups in marinebacterioplankton community—a combination of experimental and modelling approaches. J.Mar. Biol. Assoc. UK 84: 519–529.
Zweifel, U. L., and A. Hagstrom. 1995. Total counts of marine bacteria include a large fractionof non-nucleoid-containing bacteria (ghosts). Appl. Environ. Microbiol. 61: 2180–2185.
298 SINGLE-CELL ACTIVITY IN MARINE BACTERIOPLANKTON