Physiological sensors and EEG A short introduction to (neuro-)physiological measurements.
35
Physiological sensors and EEG A short introduction to (neuro-)physiological measurements
-
Upload
sybil-boyd -
Category
Documents
-
view
231 -
download
1
Transcript of Physiological sensors and EEG A short introduction to (neuro-)physiological measurements.
Physiological sensors and EEGA short introduction to (neuro-)physiological measurements
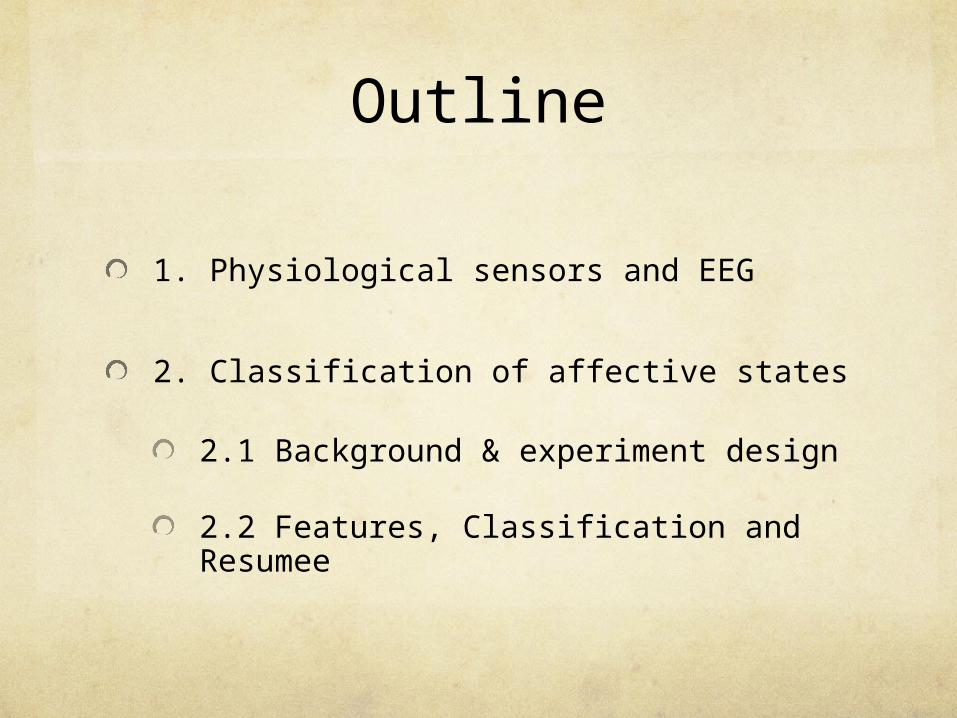
Outline
1. Physiological sensors and EEG
2. Classification of affective states
2.1 Background & experiment design
2.2 Features, Classification and Resumee
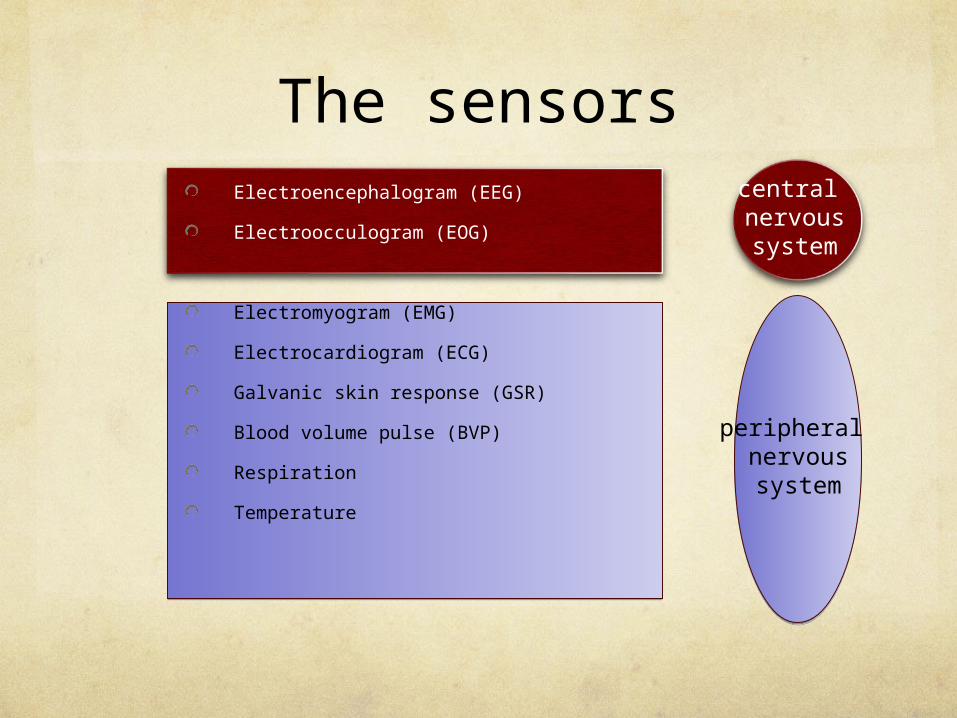
The sensorsElectroencephalogram (EEG)
Electroocculogram (EOG)
Electromyogram (EMG)
Electrocardiogram (ECG)
Galvanic skin response (GSR)
Blood volume pulse (BVP)
Respiration
Temperature
central nervoussystem
peripheral nervoussystem
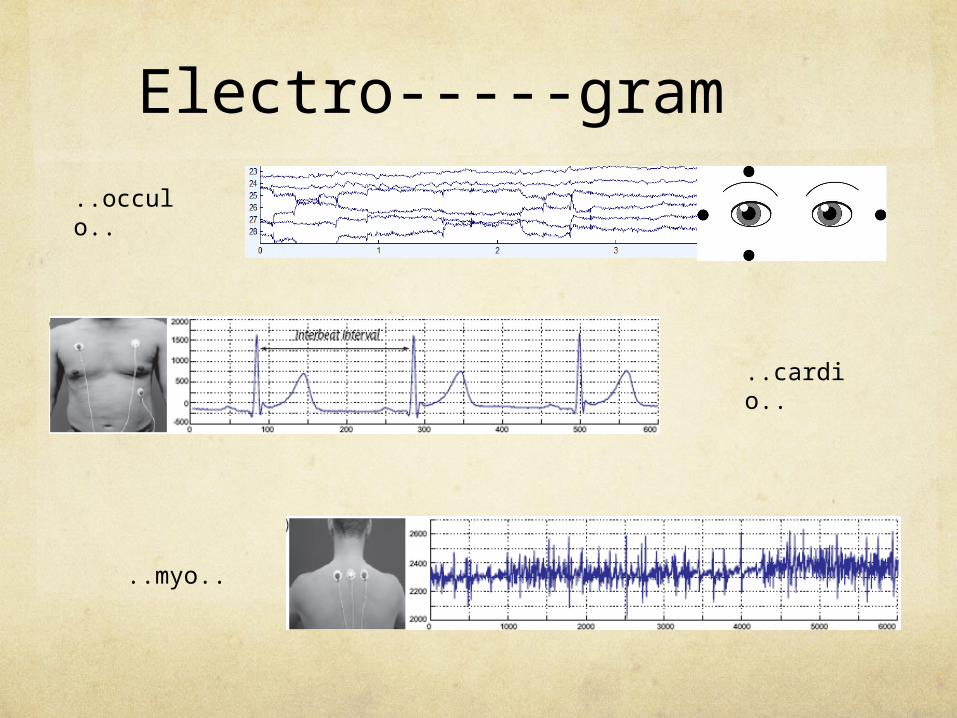
Electro-----gram
..occulo..
..myo..
..cardio..
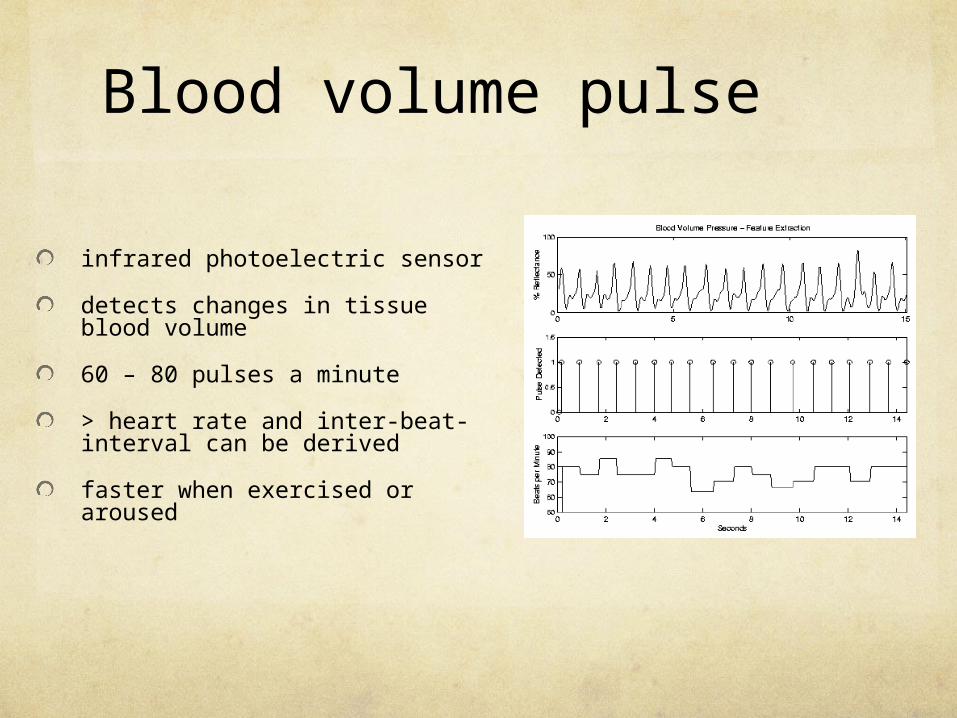
Blood volume pulse
infrared photoelectric sensor
detects changes in tissue blood volume
60 – 80 pulses a minute
> heart rate and inter-beat-interval can be derived
faster when exercised or aroused
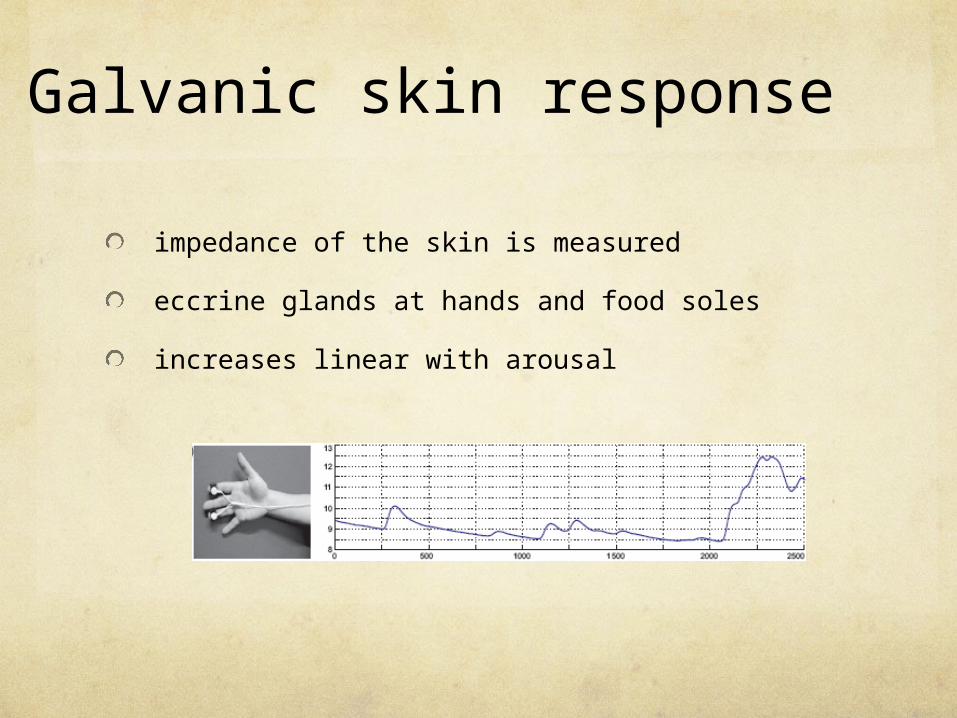
Galvanic skin response
impedance of the skin is measured
eccrine glands at hands and food soles
increases linear with arousal
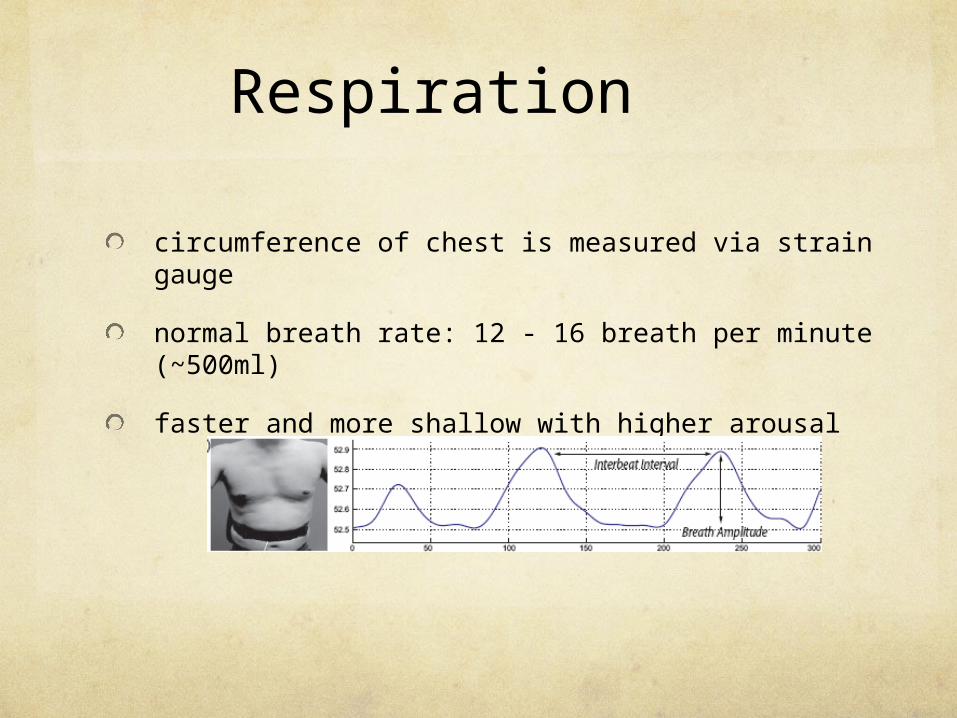
Respiration
circumference of chest is measured via strain gauge
normal breath rate: 12 - 16 breath per minute (~500ml)
faster and more shallow with higher arousal
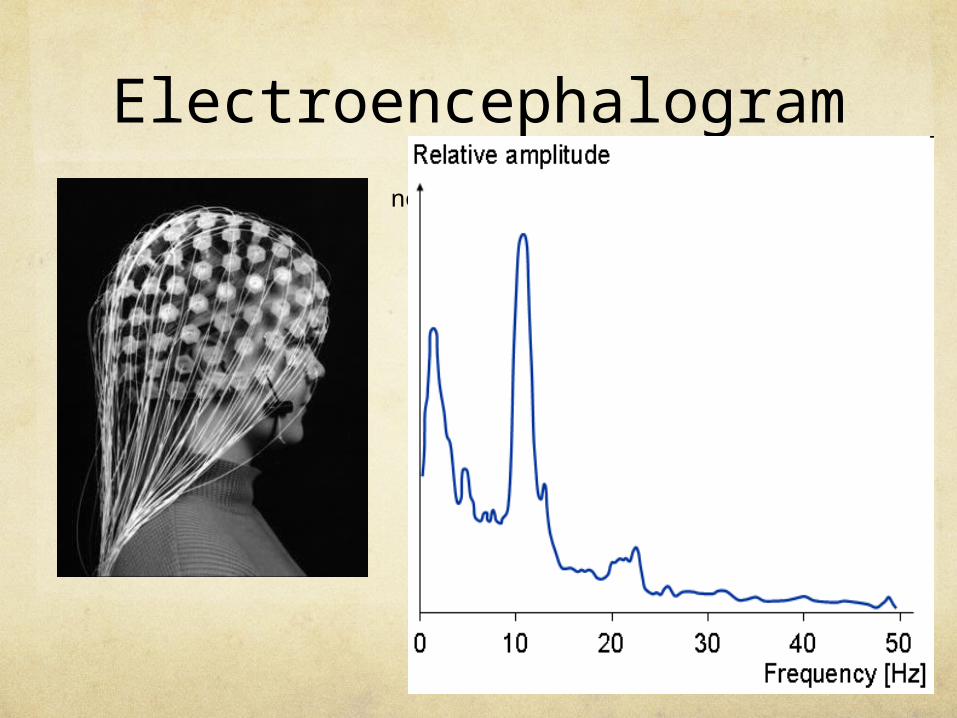
Electroencephalogramnormal signal
theta band
alpha band
beta band
gamma band
0 – 1000 Hz
4 – 8 Hz
13 – 30 Hz
8 – 12 Hz
30 – 100 Hz
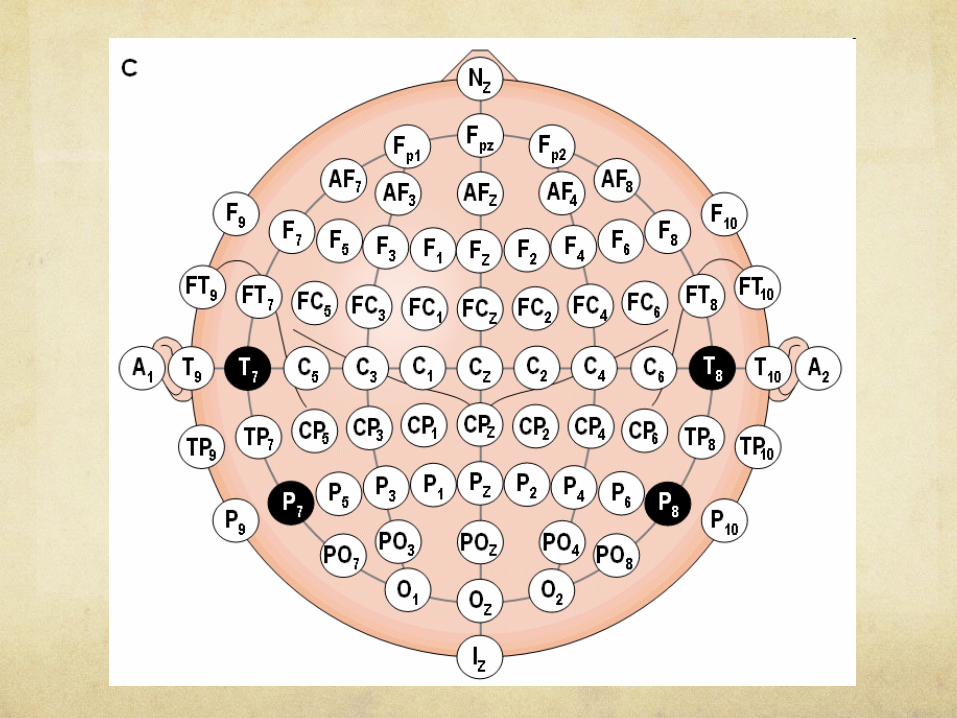
The 10 – 20 system
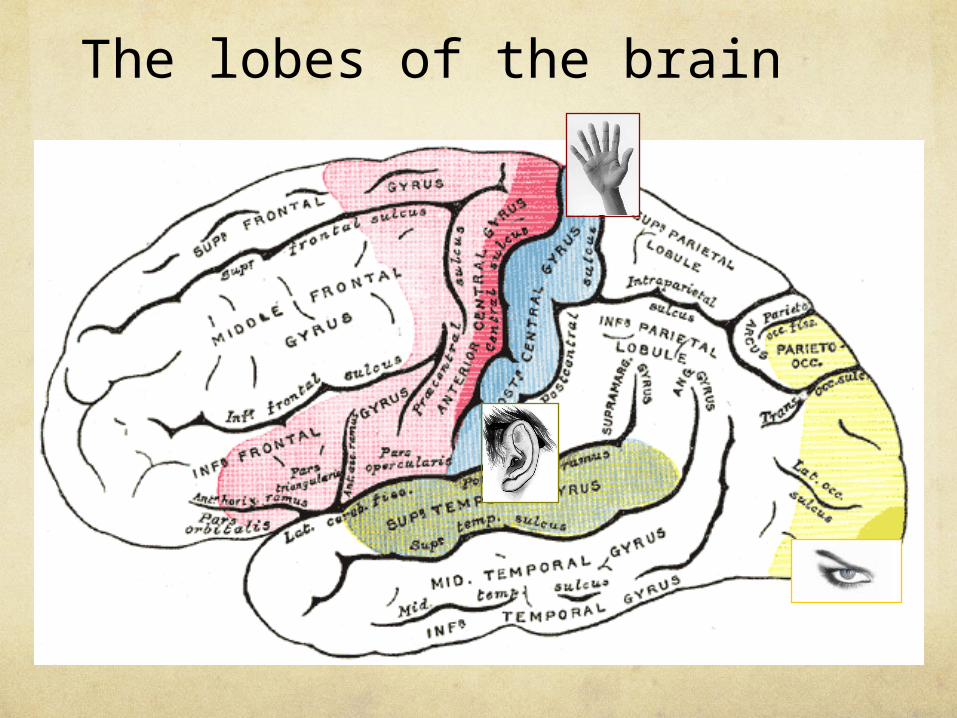
The lobes of the brain
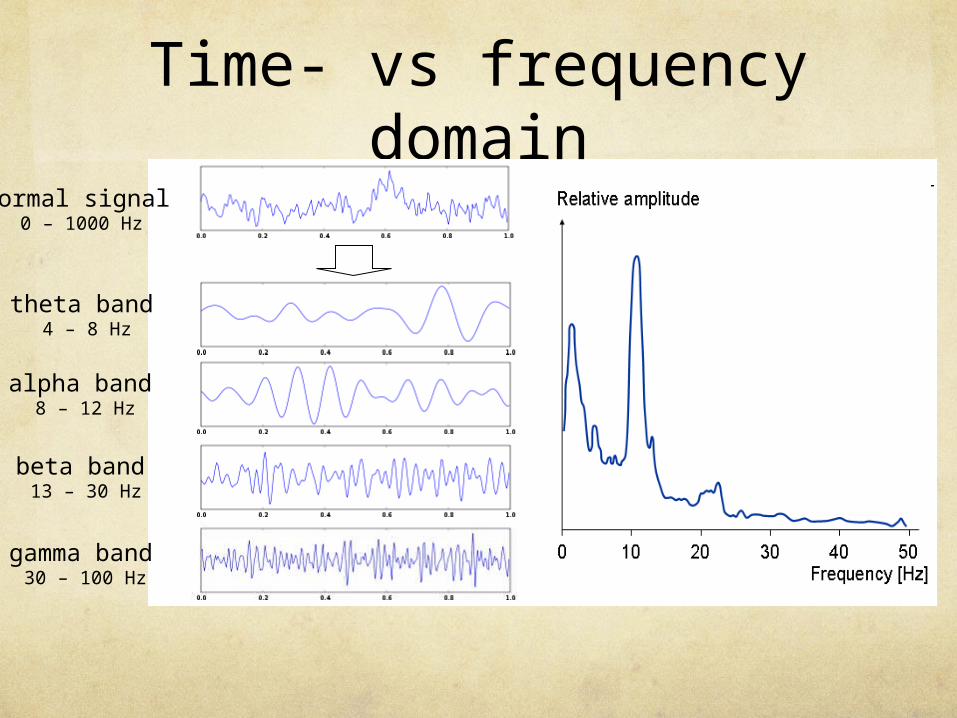
Time- vs frequency domain
normal signal
theta band
alpha band
beta band
gamma band
0 – 1000 Hz
4 – 8 Hz
13 – 30 Hz
8 – 12 Hz
30 – 100 Hz
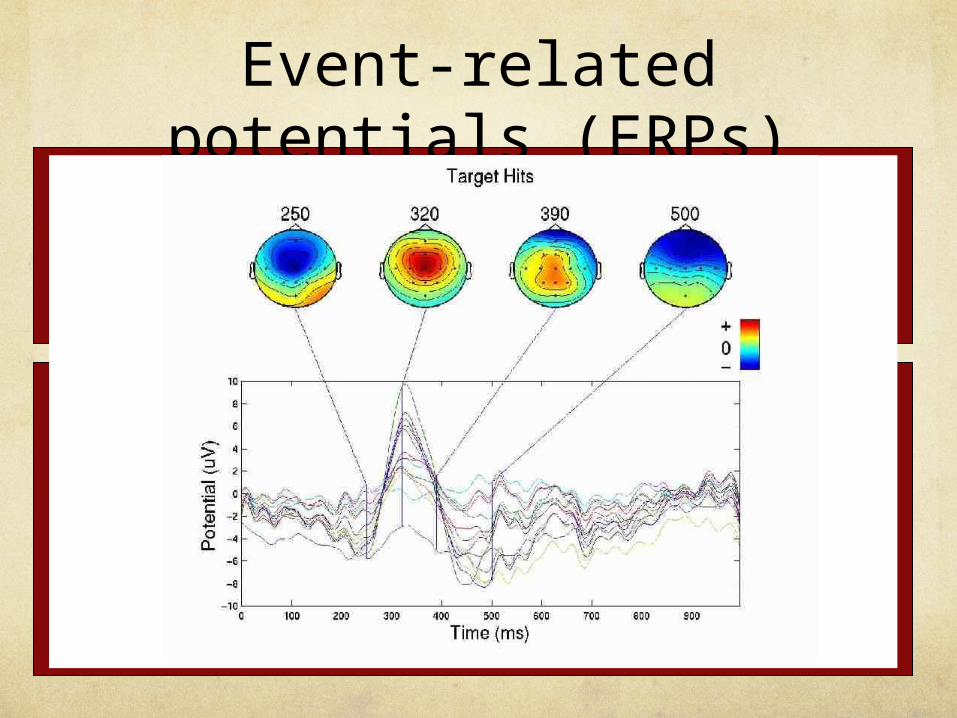
Event-related potentials (ERPs)
The raw signal with stimuli presentations
The averaging of the raw signal epochsleading to the ERP
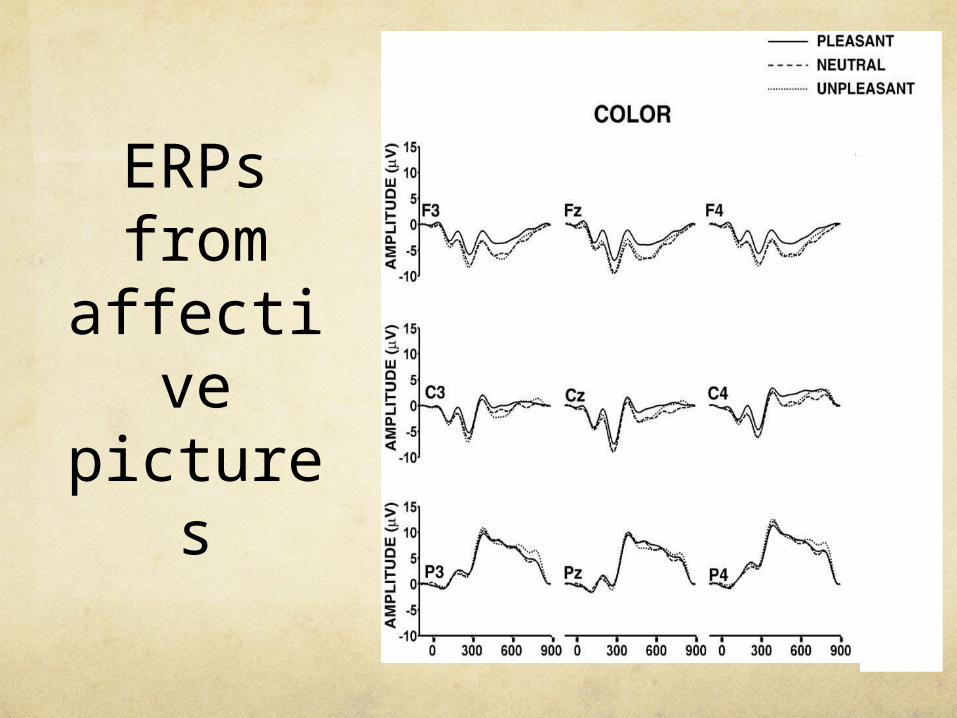
ERPs from
affective pictures
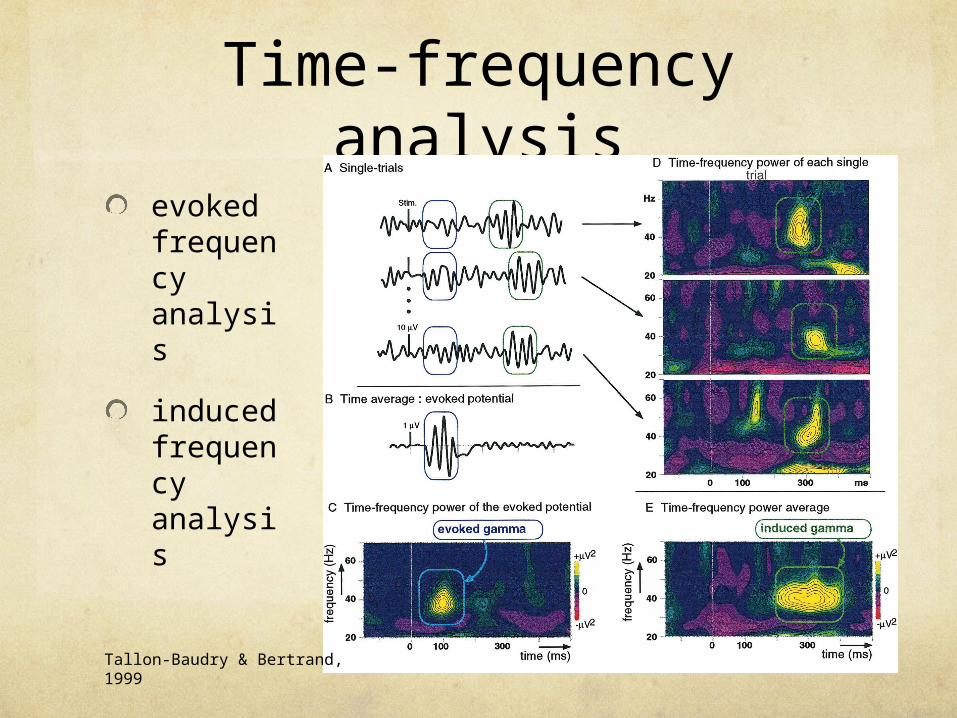
Time-frequency analysis
evoked frequency analysis
induced frequency analysis
Tallon-Baudry & Bertrand, 1999
Recapitulation
EEG measures the electrical potentials from synchroneously active pyramidal cells in the cortex
high temporal resolution vs low spatial resolution
only weak signals from deeper structures & closed fields “blindness”
ERP analysis in time domain shows mainly low frequency components
analysis in frequency domain (evoked vs induced) also pics up high frequency components

Classification of
affective states
Background & experiment design
Motivation
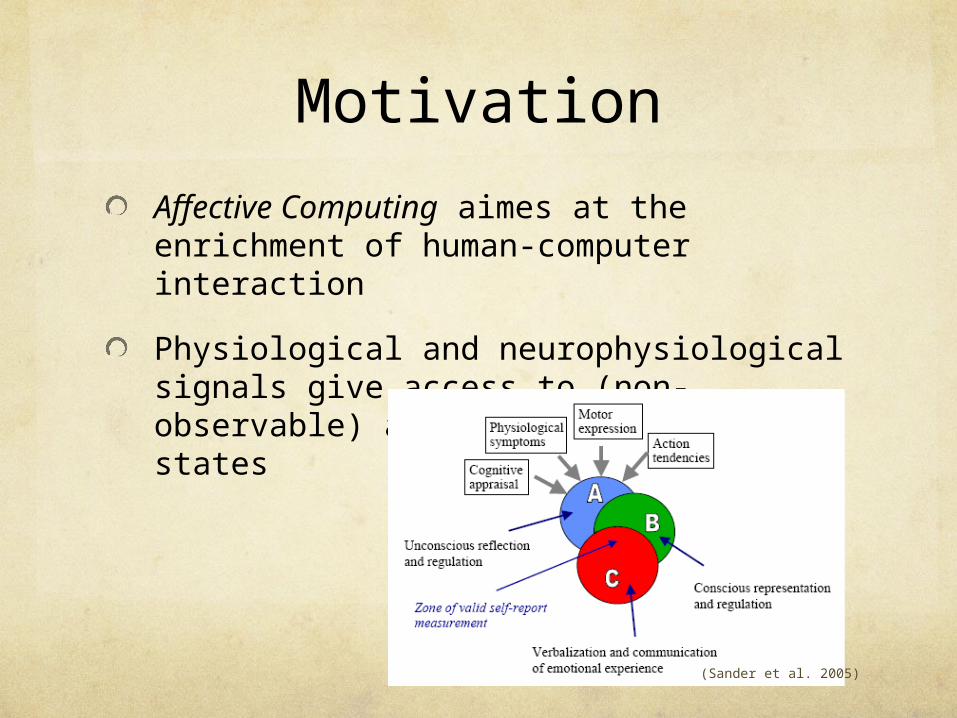
Affective Computing aimes at the enrichment of human-computer interaction
Physiological and neurophysiological signals give access to (non-observable) affective and cognitive states
(Sander et al. 2005)
Emotion Models
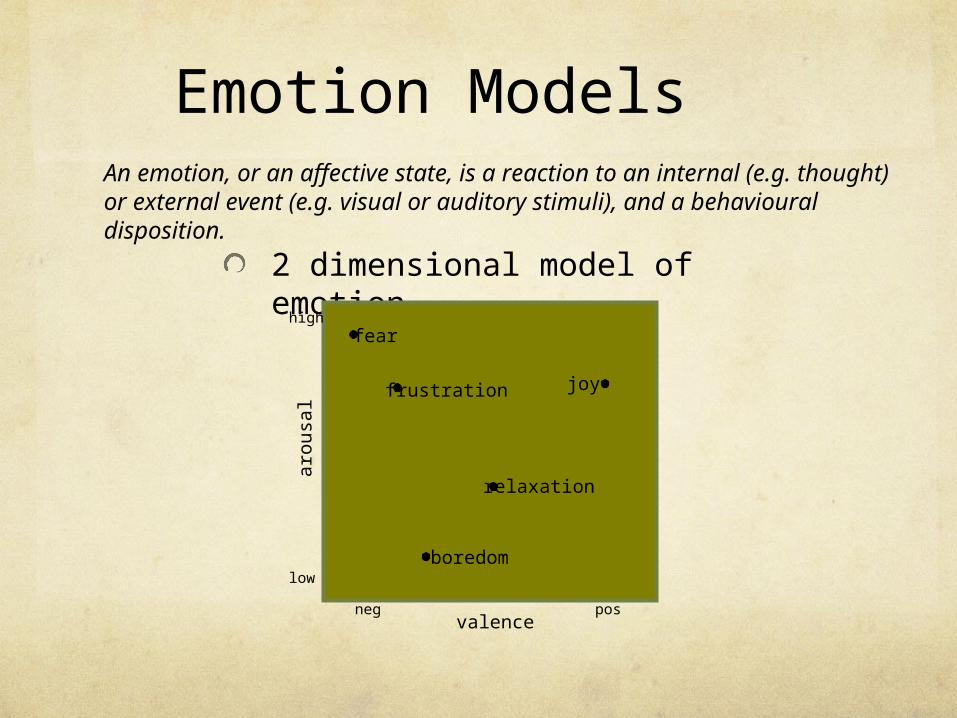
2 dimensional model of emotion
valence
arou
sal
posneg
low
high
boredom
joy
fear
relaxation
An emotion, or an affective state, is a reaction to an internal (e.g. thought)or external event (e.g. visual or auditory stimuli), and a behavioural disposition.
frustration
Regulation
Affective State
Appraisal
Stimulus presentation
+/-
+/-
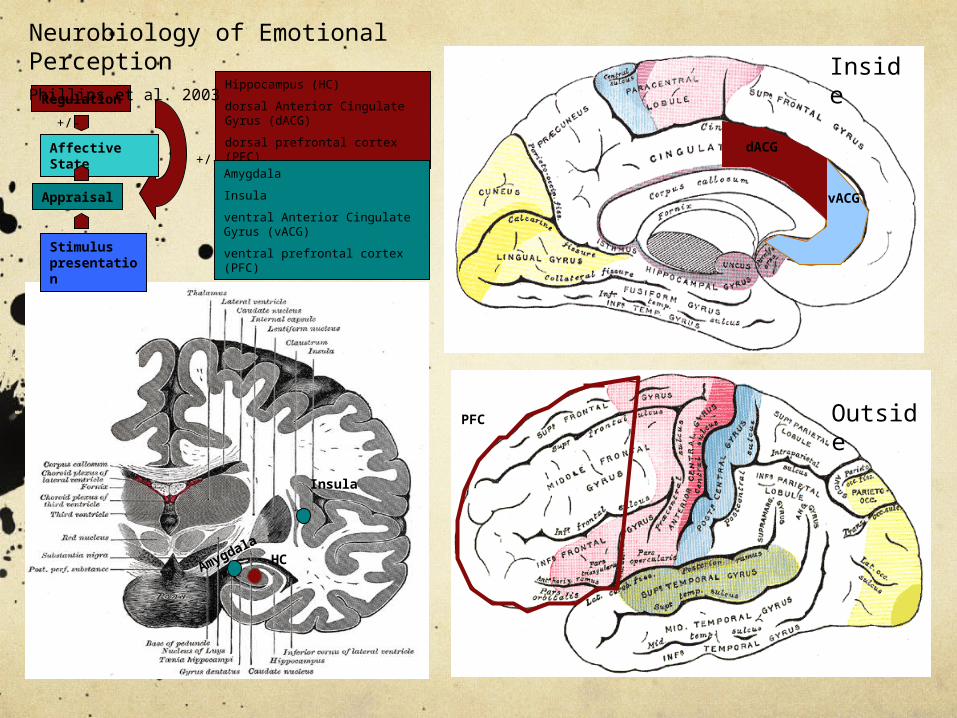
Hippocampus (HC)
dorsal Anterior Cingulate Gyrus (dACG)
dorsal prefrontal cortex (PFC)
Amygdala
Insula
ventral Anterior Cingulate Gyrus (vACG)
ventral prefrontal cortex (PFC)
Inside
Outside
HC
Insula
Amygdala
dACG
vACG
PFC
Neurobiology of Emotional PerceptionPhillips et al. 2003
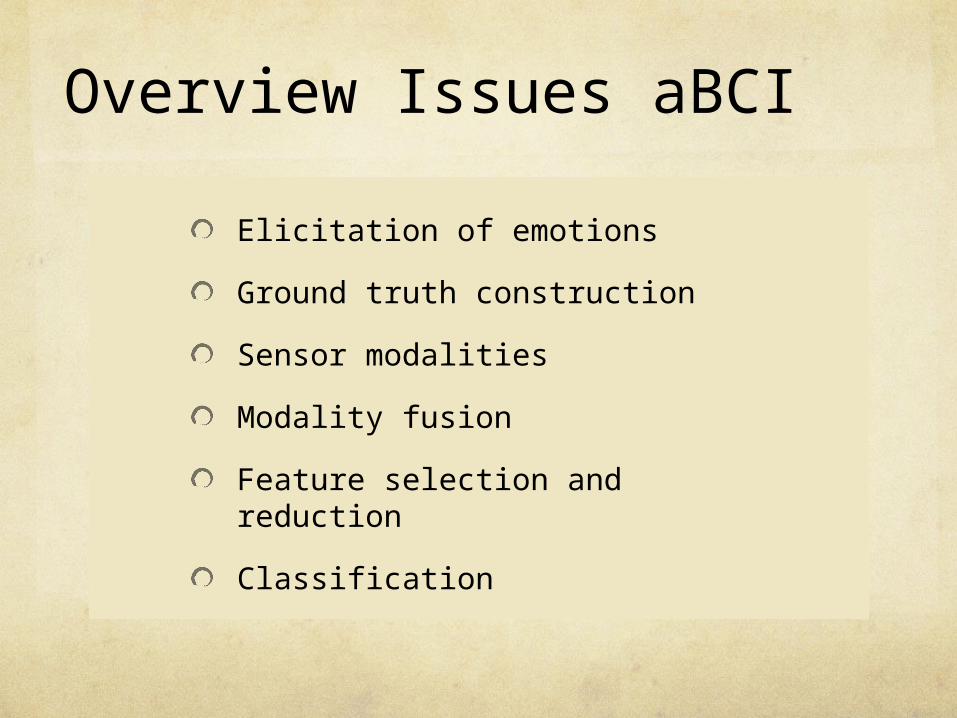
Overview Issues aBCI
Elicitation of emotions
Ground truth construction
Sensor modalities
Modality fusion
Feature selection and reduction
Classification
Example Study
Elicitation of emotions
not easy to establish a natural context of emotion elicitation:
subject- vs event-elicited
lab setting vs. real world
expression vs feeling
open vs hidden recording
emotion vs other purpose (for subject)
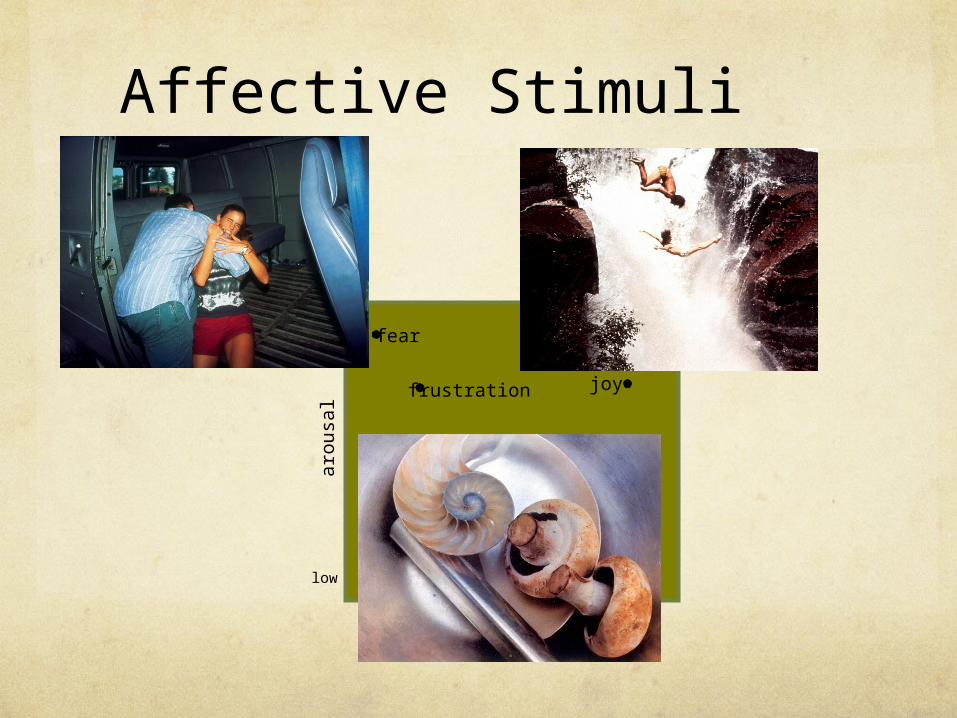
Affective Stimuli
valence
arou
sal
posneg
low
high
boredom
joy
fear
relaxation
frustration
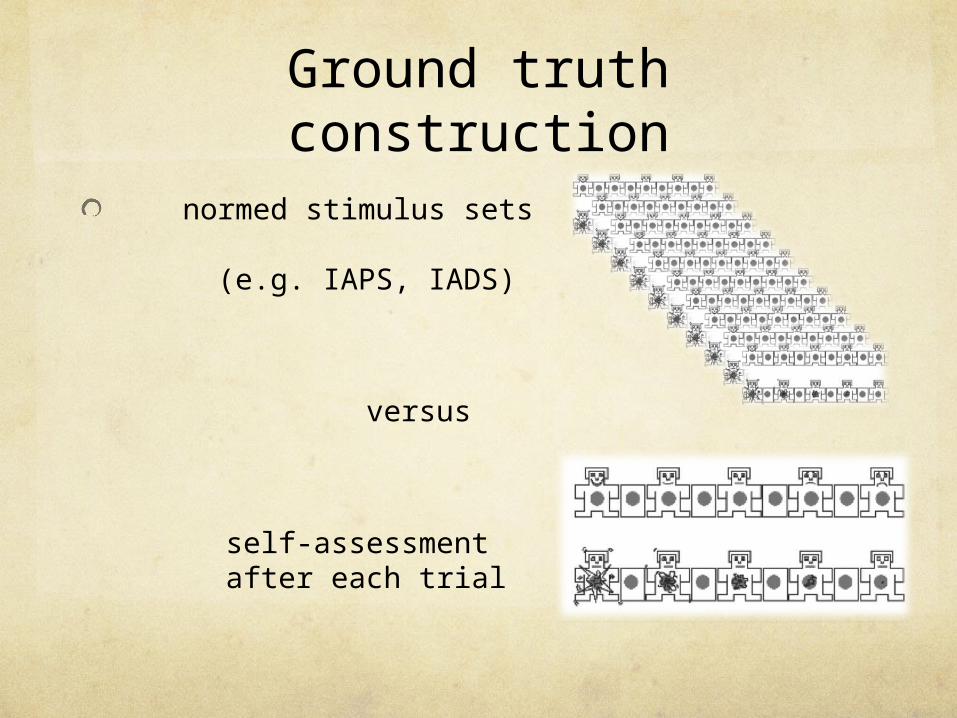
Ground truth construction
normed stimulus sets (e.g. IAPS, IADS)
versus
self-assessment after each trial
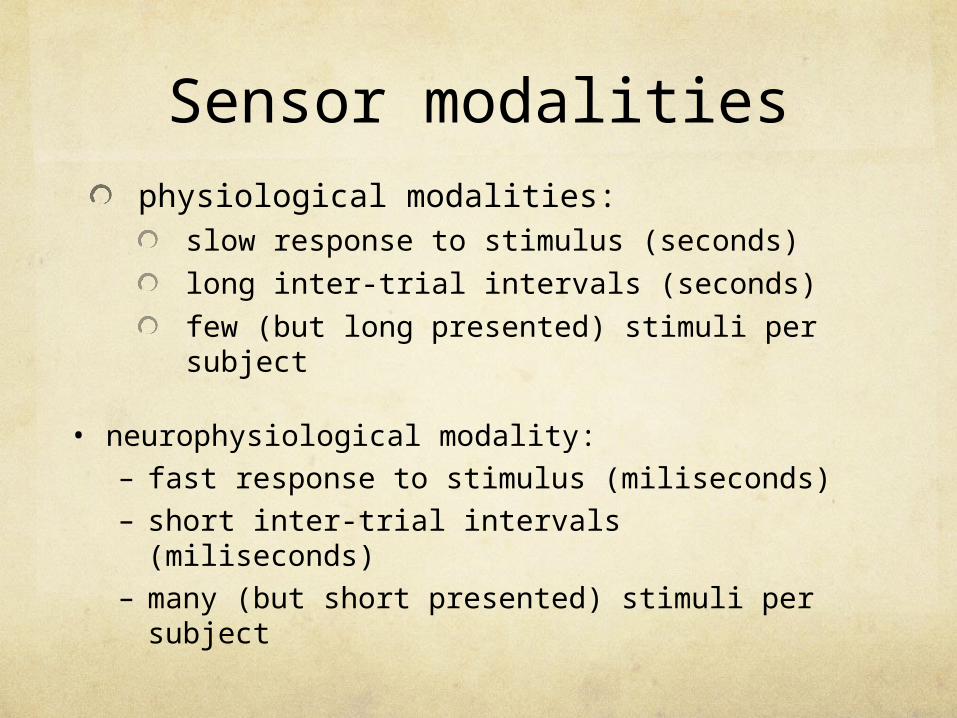
Sensor modalitiesphysiological modalities:
slow response to stimulus (seconds)
long inter-trial intervals (seconds)
few (but long presented) stimuli per subject
• neurophysiological modality:– fast response to stimulus (miliseconds)– short inter-trial intervals (miliseconds)– many (but short presented) stimuli per subject
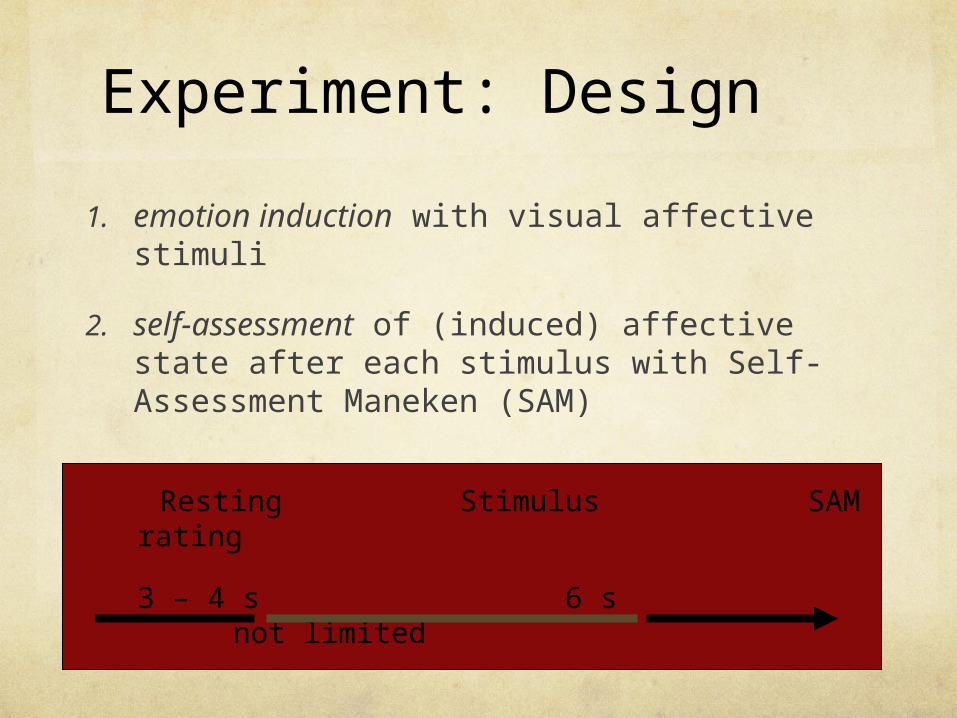
Experiment: Design
Resting Stimulus SAM rating
3 – 4 s 6 s not limited
1. emotion induction with visual affective stimuli
2. self-assessment of (induced) affective state after each stimulus with Self-Assessment Maneken (SAM)

Classification of
affective states
Features, Classification and Resumee
Modality fusion
data-level fusion
feature-level fusion
decision-level fusion
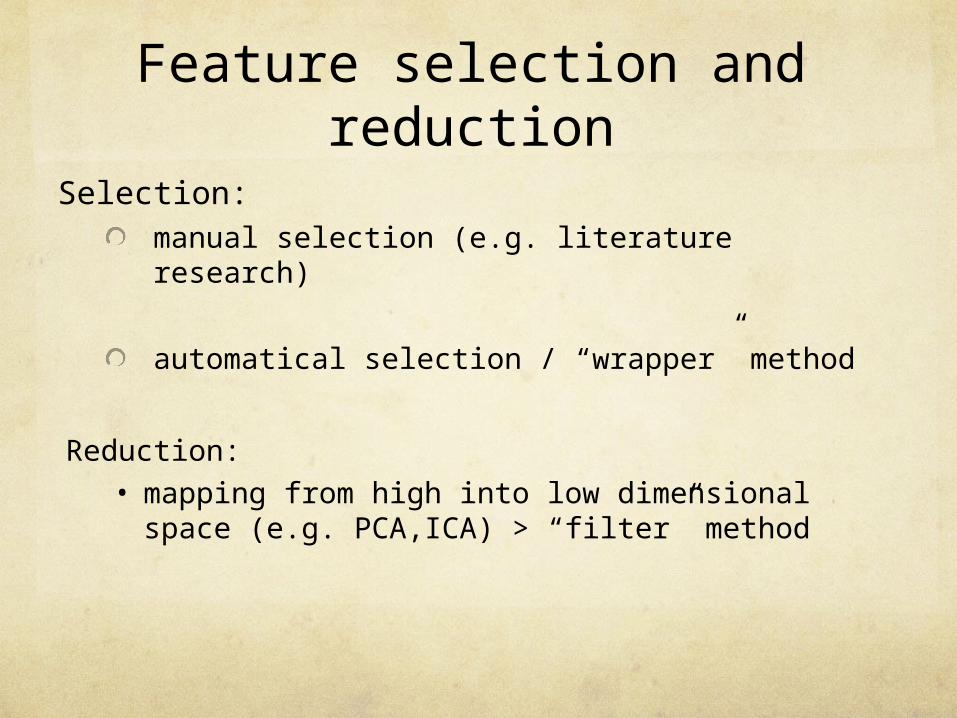
Feature selection and reduction
Selection:manual selection (e.g. literature research)
automatical selection / “wrapper” method
Reduction:• mapping from high into low dimensional space
(e.g. PCA,ICA) > “filter” method
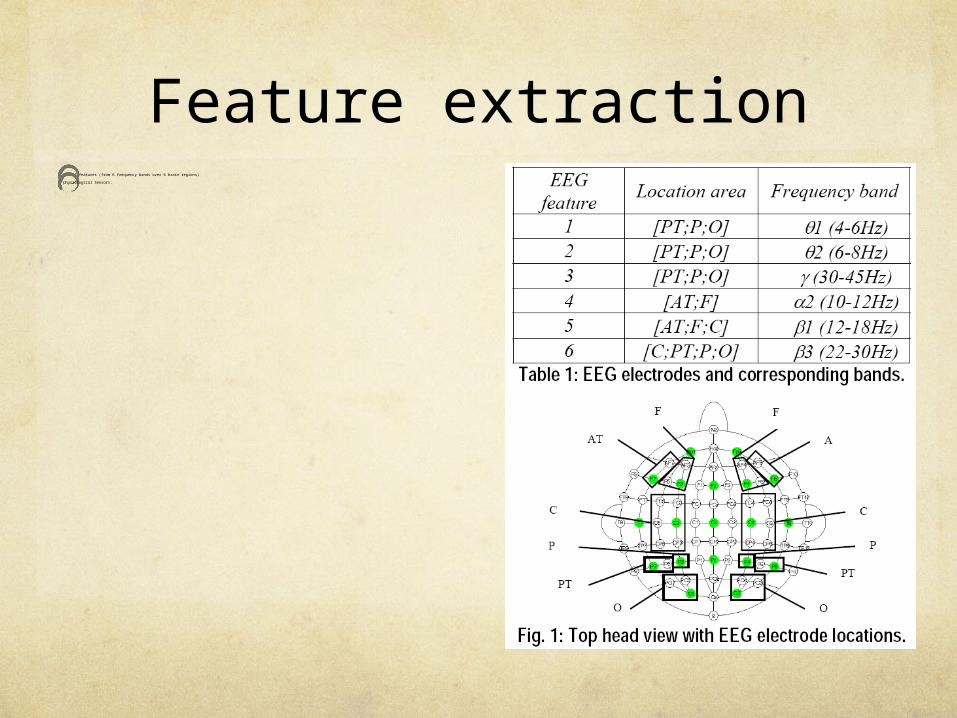
Feature extractionEEG: 6 features (from 6 frequency bands over 6 brain regions)
physiological Sensors: m
ean, variance, and
(minimum & maximum)
from GSR, blood pressure,
heart rate, respiration, and
temperature
Classification
• many possible classification approaches:decision trees, linear discriminant analysis, support vector machine, neural networks…
• optimal method depends on structure of data
• !keep training trials appart from test data, to avoid the contamination of the classifier.. !
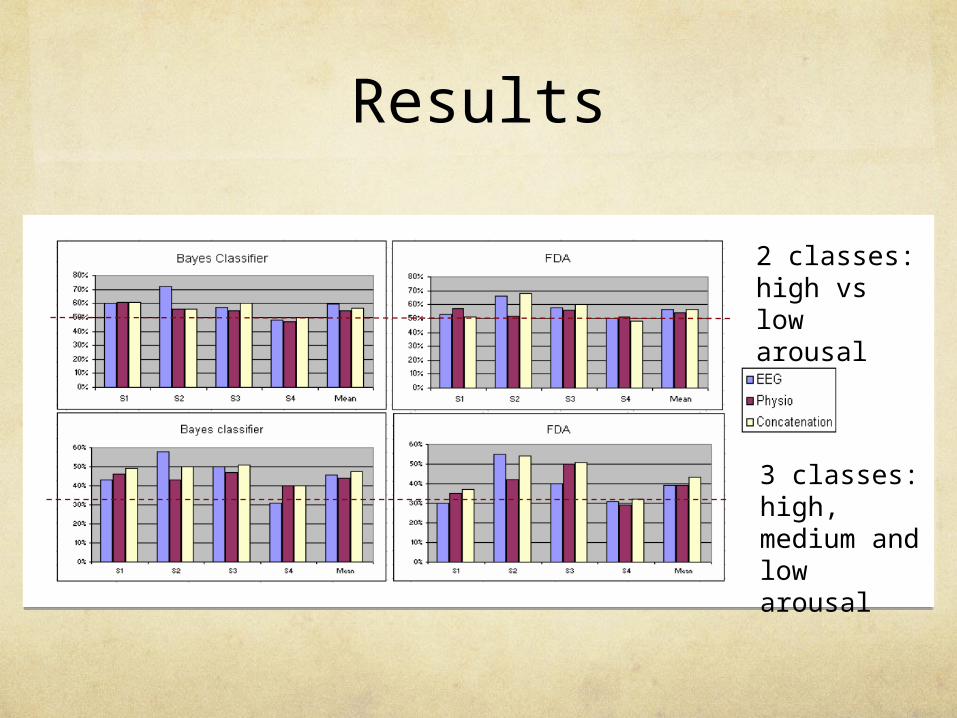
Results
2 classes: high vs low arousal
3 classes: high, medium and low arousal
Classification• physiological studies:
– 4 class: up to 95%– 8 class: 81% (!)– generalization of classifiers over subjects and time
• neurophysiological studies:– 3 class: up to 67%– 2 class: up to 79% – ? generalization of classifiers over subjects and
time ?
Recapitulation
• natural context of emotion elicitation
• characteristics of sensors are important
• many different approaches for data fusion, feature selection/reduction and classification – no optimal method per se
• still a long way toward an affect classification in an natural and multimodal real-world setting.. but we are getting there!

Thanks