Physiological Effects of Barley: Examining the Effects of ... · first exam. Special thanks to Dr...
145
Physiological Effects of Barley: Examining the Effects of Cultivar, Processing and Food Form on Glycemia, Glycemic Index, Satiety and the Physico-Chemical Properties of β-glucan by Ahmed Aldughpassi A thesis submitted in conformity with the requirements for the degree of Doctor of Philosophy Department of Nutritional Sciences University of Toronto © Copyright by Ahmed Aldughpassi (2013)
Transcript of Physiological Effects of Barley: Examining the Effects of ... · first exam. Special thanks to Dr...

Physiological Effects of Barley: Examining the Effects of
Cultivar, Processing and Food Form on Glycemia,
Glycemic Index, Satiety and the Physico-Chemical
Properties of β-glucan
by
Ahmed Aldughpassi
A thesis submitted in conformity with the requirements
for the degree of Doctor of Philosophy
Department of Nutritional Sciences
University of Toronto
© Copyright by Ahmed Aldughpassi (2013)
ii
Physiological Effects of Barley: Examining the Effects of Cultivar, Processing
and Food Form on Glycemia, Glycemic Index, Satiety and the Physico-
Chemical Properties of β-glucan
Ahmed Aldughpassi
Doctor of Philosophy
Department of Nutritional Sciences
University of Toronto
2013
Barley has been receiving increased attention as a human food due to the health benefits associated
with β-glucan fiber and its potential as a low glycemic index (GI) functional food. Research has shown a
relationship between the physico-chemical properties of β-glucan and the physiological effects, which may
be altered by processing. However, it is not known if the physiological effects of consuming barley are
affected by variations in chemical composition among cultivars or by common processing methods such as
pearling or milling. The primary objective of this thesis was to characterize the effects of differences in
cultivar starch and fibre content, level of pearling and milling on the GI, satiety and the physico-chemical
properties of β-glucan. Nine barley cultivars varying in starch-type and β-glucan content were studied in
three experiments in separate groups of ten healthy participants. Blood glucose and satiety ratings were
measured and the GI was calculated. Total starch, total fibre, β-glucan, molecular weight (MW), solubility
and β-glucan viscosity were determined in vitro. Results showed that GI varied by cultivar (CDC-Fibar, 26
± 3 vs. AC-Parkhill, 35 ± 4, P < 0.05) and pearling (WG, 26 ± 4 vs. WP 35 ± 3, P < 0.05). When two
cultivars were milled and processed to wet pasta the GI increased by 184% (P < 0.05). The pearled wet
pasta had a significantly lower GI compared to the whole grain (P < 0.05). Boiled barley kernels tended to
elicit greater satiety than white bread, but the difference was not significant. In both the boiled barley
kernels and the wet pasta, pearling did not affect the MW, viscosity and solubility. MW did not
significantly differ between cultivars but solubility and viscosity did (P < 0.05). The wet pasta had
significantly lower MW, solubility, viscosity but not β-glucan content than the boiled barley kernels (P <
0.05). In conclusion, pearling did not have an effect but milling and extruding resulted in significant
reduction in MW, solubility and viscosity. The GI of barley is influenced significantly by cultivar, pearling
and milling. Further studies are required to determine the effect on satiety.

iii
Acknowledgment
The work presented in this thesis would have not been accomplished if it wasn’t for the
kindness and support of many individuals. First, I would like to thank my supervisor, Dr.
Thomas Wolever. Tom you have been a most compassionate and sensible supervisor, your
guidance and continuous support have been instrumental in my development as a researcher.
Your genius and passion to the field and toward your students is inspiring. Thank you to my co-
supervisor, Dr. Elsayed Abdelaal, my utmost appreciation goes to you. I am in debt to you; this
thesis would not have been completed if it wasn’t for your invaluable support. Not only did you
provide me with guidance and enduring support, but you expanded my knowledge beyond the
field of Nutrition.
Thank you to my committee members Dr. David Jenkins and Dr. Anthony Hanley and to
Dr. Paul Pencharz for being my departmental examiner and Dr. Harvey Anderson for chairing the
first exam. Special thanks to Dr. Amanda Wright, my external examiner, you were splendid. I am
honored to be your first external examinee.
No doubt that if it wasn’t for the prayers and continued support of my family, my journey
would have been impossible. My mother, Monerah and my Father Dahi, you are my greatest
source of motivation and the joy of my life; this is all for you. Rashed, my brother and best friend,
thank you for holding down the fort. Thank you to my brother Khaled and my sisters Duha and
Ghiada, your love and words of wisdom has lighted my path. Thank you to all my charming
nieces and nephews; you are the apple of my eyes.
Along this journey there were numerous friends and colleagues that paved the path with
support, laughter and an open heart. Thank you to the kindest person I ever met, Elizabeth
Sutherland, you were my rock. Thank you for the many friends, colleagues and staff at the
Wolever lab and the department of Nutritional Sciences for all their support and kind words. I
would also like to thank the staff at Glycemic Index Laboratories, especially Janice Campbell, for
all the support. Special thanks to all the subjects that participated in my studies. Thank you for
everyone that assisted me and made me smile at Guelph Food Research Centre especially the staff
at the Abdelaal Lab, Danielle Grant, Iowna Rabalski and Dr. Tamer Gamal.
I would like to thank and acknowledge the Agriculture and Agri-Food Canada-Matching
Investment Initiative, Ontario Ministry of Agriculture, Food and Rural Affairs, Gilbertson and
Page, Grain Process Enterprise, Cribit Seeds/Wintermar Farms, Oat and Barley Council of
Ontario for their financial support and to Cribit Seeds and Dr. B. Rossnagel from the University
of Saskatchewan for kindly providing the barley materials.
Last but not least thank you to Kuwait university scholarship program for supporting me
financially. Thank you for the Department of Food and Nutrition, Kuwait University for all your
support.

iv
List of Abbreviations
AACCI American Association of Cereal Chemists International
ANOVA Analysis of Variance
BG Blood Glucose
CFG Canada Food Guide
CHO Carbohydrates
CI Confidence Interval
CP Commercially Pearled
CVD Cardiovascular Disease
db Dry Basis
EFSA European Food Safety Authority
EU European Union
FAO Food and Agriculture Organization of the United Nations
FBG Fasting Blood Glucose
FDA The Food and Drug Administration
FIA flow-injection analysis
g Gram
GI Glycemic Index
HbA1c Glycated Hemoglobin
iAUC Incremental Area Under the Curve
L Liter
LDL cholesterol Low density lipoprotein cholesterol
Min Minutes
ml Milliliter
MW Molecular Weight
PP Pot Pearled
PRBG Peak Rise Blood Glucose
RAG Rapidly Available Glucose
RCT Randomized Clinical Trial
RDS Rapidly Digested Starch
RR Relative Risk
RS Resistant Starch
RVA Rapid Visco Analyzer
SD Standard Deviation
SDS Slowly Digested Starch
SEM Standard Error of the Mean
SI Satiety Index
Type2DM Type 2 Diabetes Mellitus
WB White Bread
WG Whole Grain
WHO World Health Organization
WP White Pearled
v
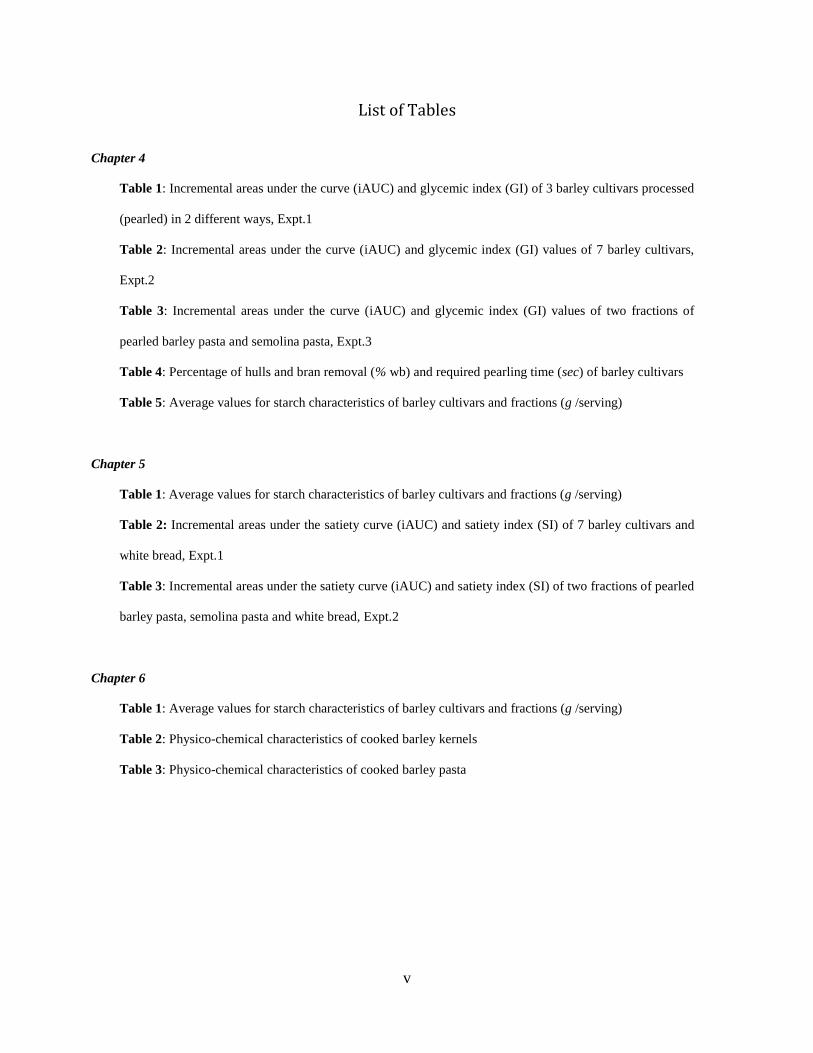
List of Tables
Chapter 4
Table 1: Incremental areas under the curve (iAUC) and glycemic index (GI) of 3 barley cultivars processed
(pearled) in 2 different ways, Expt.1
Table 2: Incremental areas under the curve (iAUC) and glycemic index (GI) values of 7 barley cultivars,
Expt.2
Table 3: Incremental areas under the curve (iAUC) and glycemic index (GI) values of two fractions of
pearled barley pasta and semolina pasta, Expt.3
Table 4: Percentage of hulls and bran removal (% wb) and required pearling time (sec) of barley cultivars
Table 5: Average values for starch characteristics of barley cultivars and fractions (g /serving)
Chapter 5
Table 1: Average values for starch characteristics of barley cultivars and fractions (g /serving)
Table 2: Incremental areas under the satiety curve (iAUC) and satiety index (SI) of 7 barley cultivars and
white bread, Expt.1
Table 3: Incremental areas under the satiety curve (iAUC) and satiety index (SI) of two fractions of pearled
barley pasta, semolina pasta and white bread, Expt.2
Chapter 6
Table 1: Average values for starch characteristics of barley cultivars and fractions (g /serving)
Table 2: Physico-chemical characteristics of cooked barley kernels
Table 3: Physico-chemical characteristics of cooked barley pasta

vi
List of Figures
Chapter 1
Figure 1: Barley grain with enlarged cross section
Figure 2: Principle of the mixed-linkage β-glucan assay procedure.
Chapter 4
Figure 1: Correlations between the GI and Amylose (A), RAG (B), RDS (C), SDS (D), RS (E), and Total
Fiber (F) in WG and WP barley consumed by n = 10 (Expt. 1) or n = 10 (Expt. 2) healthy participants.
Figure 2: GI values of WG and WP fractions of each cultivar and Pasta consumed by n = 10 (Expt. 1) or
n = 10 (Expt. 3) healthy participants.
Figure 3: Blood glucose concentration in healthy participants after the ingestion of white bread and pearled
barley cultivars (Expt1).
Figure 4: Blood glucose concentration in healthy participants after the ingestion of white bread and pearled
barley pastas (Expt1).
Chapter 5
Figure 1. Average satiety AUC for healthy subjects after the consumption of 10 different barley cultivars
and the reference food (white bread).
Figure 2. Average satiety AUC for healthy subjects after the consumption of 10 different barley cultivars
and the reference food (white bread).
Chapter 6
Figure 1. Correlation between the glycemic index (GI) and log10 MW (A), log10 Viscosity (B), log10
Extract Viscosity (C), log10 % β-glucan extract viscosity (D), Peak blood glucose rise (PBGR) (E) and
log10 solubility (F) for boiled barley kernels.
Figure 2. Correlation between the peak blood glucose rise (PBGR) and log10 MW (A), log10 Viscosity (B),
log10 Extract Viscosity (C) and log10 % β-glucan extract viscosity (D), for milled barley pasta.

vii
Publications and Presentations
Published:
Ahmed Aldughpassi, El-Sayed M. Abdel-Aal, Thomas MS Wolever. Glycemic Response to Barley
Products: Influence of Cultivar, Processing, Compositional Characteristics and Foods Form on the
Glycemic Index. Journal of Nutrition. 142: 1666-1671, 2012.
To be submitted:
Ahmed Aldughpassi, El-Sayed M. Abdel-Aal, Thomas MS Wolever. Comparison of the effects of
Chemical Composition, Processing and Food Form on the Satiety of Barley.
Ahmed Aldughpassi, Thomas MS Wolever, El-Sayed M. Abdel-Aal. The Relationship between the
Physico-Chemical Properties of Barley and Postprandial Glycemia and the Glycemic Index.
Book Chapters:
Ahmed Aldughpassi, El-Sayed M. Abdel-Aal, Thomas MS Wolever. Barley In: The Encyclopedia of Food
and Health 2013. Oxford: Elsevier. (To be submitted)
Abstracts and Presentations:
Ahmed Aldughpassi, Thomas MS Wolever, El-Sayed M. Abdel-Aal. The Relationship between the
Physico-Chemical Properties of Barley β-glucan and Postprandial Glycemia and the Glycemic Index.
Submitted as a late breaking abstract to Canadian Nutrition Society Meeting, Québec City, QC May 30 –
June 2nd
24, 2013.
Ahmed Aldughpassi, El-Sayed M. Abdel-Aal, Thomas MS Wolever. Comparison of the Effects of
Chemical Composition, Processing and Food Form on The Satiety of Barley. Submitted as an abstract to
Experimental Biology Meeting, Boston,U.S.A. April 20-24, 2013.
Ahmed Aldughpassi, El-Sayed M. Abdel-Aal, Thomas MS Wolever. Influence of Cultivar, Processing and
Foods Form on the Glycemic Index of Barley. FASEB J March 29, 2012 26:638.16 (Poster). Ahmed
Aldughpassi, El-Sayed M. Abdel-Aal, Thomas MS Wolever. Influence of Cultivar, Processing and Foods
Form on the Glycemic Index of Barley. Invited Speaker, Carbohydrate Metabolism Mini-symposium,
Experimental biology Meeting 2012, San Diego, CA, U.S.A; PhD research.
viii
Table of Contents Abstract ........................................................................................................................... ii
Acknowledgment ........................................................................................................... iii
List of Abbreviations ..................................................................................................... iv
List of Tables .................................................................................................................. v
List of Figures ................................................................................................................ vi
Publications and Presentations ...................................................................................... vii
1. Introduction ................................................................................................................. 1
2. Literature Review ........................................................................................................ 6
2.1. Whole Grains ........................................................................................................ 6
2.2. Whole Grains and Disease Prevention ................................................................. 9
2.2.1. Prospective cohort studies ............................................................................. 9
2.2.2. Randomized clinical trials ........................................................................... 10
2.3. Barley ..................................................................................................................... 12
2.3.1. Barley cultivars ............................................................................................... 13
2.3.2. Chemical composition ................................................................................ 15
2.3.3. Available carbohydrates .............................................................................. 15
2.3.4. Fibre ............................................................................................................ 17
2.3.5. β-glucan .......................................................................................................... 17
2.3.6. Physico-chemical Characteristics of β-glucan ............................................ 19
2.3.7. Barley Processing and Cooking .................................................................. 22
2.4. Health benefits of barley ................................................................................. 24
2.4.1. Barley and blood lipids ............................................................................... 24
2.4.2. Barley and Glycemia ................................................................................... 26
2.5. The Glycemic Index ............................................................................................... 28
2.5.1. Overview ........................................................................................................ 28
2.5.2. Definition ........................................................................................................ 29
2.5.3. Glycemic Index Methodology ........................................................................ 30
2.5.4. Clinical Utility and Implications of Glycemic Index ..................................... 31
2.5.5. Glycemic index and satiety ............................................................................. 33
3. Research Questions ................................................................................................... 37
ix
3.1 Objectives .............................................................................................................. 37
4. Barley Cultivar, Kernel Composition and Processing Affects the Glycemic Index . 39
4.1. Abstract .............................................................................................................. 40
4.2. Introduction ........................................................................................................ 41
4.3. Materials and Methods ....................................................................................... 42
4.4. Results ................................................................................................................ 48
4.5. Discussion .......................................................................................................... 50
5. Comparison of the effects of Chemical Composition, Processing and Food Form on
the Satiety of Barley .......................................................................................................... 64
5.1. Abstract .............................................................................................................. 65
5.2. Introduction ........................................................................................................ 66
5.3. Materials and Methods ....................................................................................... 67
5.4. Results ................................................................................................................ 71
5.5. Discussion .......................................................................................................... 72
6. The Relationship between the Physico-Chemical Characteristics of Barley and
Postprandial Glycemia and the Glycemic Index ............................................................... 81
6.1. Abstract .............................................................................................................. 82
6.2. Introduction ........................................................................................................ 83
6.3. Materials and Methods ....................................................................................... 85
6.4. Results ................................................................................................................ 89
6.5. Discussion .......................................................................................................... 91
7. Overall Discussion ............................................................................................... 101
7.1. Discussion ........................................................................................................ 102
8. Conclusion ........................................................................................................... 107
9. References ............................................................................................................ 110
10. Appendices ....................................................................................................... 124

1
1. Introduction
Carbohydrates (CHO) are omnipresent in our diets representing a major source of
energy for humans. They typically account for 45-70% of our total energy intake (1)
.
Traditionally, carbohydrates have been classified into two categories: ‘simple’ or
‘complex’ (2)
. However, a major concern with this classification is the lack of ability to
predict plasma blood glucose and insulin responses (3)
, which are thought to be crucial
factors in the etiology of many health complications. Type 2 diabetes (T2D), coronary
heart disease, metabolic syndrome and cancer are highly prevalent chronic illness where
carbohydrates have an underlying pathophysiological relevance (4, 5)
. Yet, the source and
type of CHO for optimal health and disease prevention is continually debated (6)
.
Despite the lack of consensus on the optimal CHO source, type and amount (7)
, there
is wide agreement on the importance of whole grains (WG) and their beneficial effects in
preventing weight gain and illness such as (T2D) and cardiovascular disease (CVD) (8)
.
Other than being a dominant source of carbohydrates in our diet, cereal grains contain a
myriad of beneficial nutrients and phytochemicals that can be lost during processing (9)
.
Not all grains are equal, the health benefits seen from consuming one whole grain may
not necessarily reflect the same magnitude of benefits from another whole grain. There is
a wide diversity in the chemical composition between grains, in particular in starch and
type of fibre, which in turn dictate the physico-chemical characteristics and their health
promotion capacity.
Likewise, there is an abundance of evidence indicating that the type and quality of
CHO plays a significant role with respect to health, disease prevention and management

2
(10, 11). A physiological measure of the quality of CHO, the Glycemic Index (GI), which
classifies CHO rich foods based on their impact on glycemia, has been well established
with respect to its importance in assessing CHO quality (12, 13)
. Low-GI foods and diets
have been repeatedly found to produce favorable effects on a number of physiological
parameters including: postprandial glycemia in normal and T2D individuals (14, 15)
,
glycated hemoglobin (HbA1c) (16)
, lipids (17)
, and inflammatory markers (18)
.
Consequently, these effects result in reducing the risk of developing T2D, CVD and
metabolic syndrome (15)
.
In the latest Health Canada’s food guide, released in 2007 (19)
and the 2010 U.S.
dietary Guidelines (20)
, eating whole grain foods was highly encouraged. Although this
advice seems appropriate because most whole grains contain high levels of important
nutrients such as dietary fibre and magnesium, not all sources of whole grains or Fibre
are equal with respect to their physiological effects (21)
. On one hand, because of their
varied chemical composition and physical form the rate and degree to which the different
types of whole grains are digested and absorbed from the small intestine varies. On the
other hand, whole grains that can be processed and reconstituted into a variety of
different forms, will not necessarily have a low GI and may not exert the same benefits as
the original whole grains. Consequently, these differences may lead to unfavorable
effects on glycemia, GI and satiety. This puts forward the need for improved methods of
how we classify whole grains.
Epidemiological studies repeatedly show that whole grains are protective against a
number of chronic diseases and weight gain (8)
, yet data are scarce in distinguishing
between the different whole grains and exploring the biological mechanisms responsible

3
for these effects. Fibre has been extensively examined as a key player in the favorable
effects incurred by whole grains but this is not conclusive (22)
. Other factors such as
chemical composition, processing and food form may have a significant role in this
relationship, yet they are not copiously investigated when considering the quality of
whole grains. It is still debated whether all whole grains are equally protective and how
consumers can easily distinguish friend from foe when choosing a whole grain food
product. A recent report examining the relationship of whole grains and CVD health-
claims using the FDA definition of whole grains concluded that the health benefits seen
from consuming one whole grain do not necessarily reflect the same magnitude of
benefits from other whole grain (23)
. This has created interest in whole grains with intact
kernels that are slowly digested, specifically barley.
Recently, United States Food and Drug Administration (FDA) approved a health
claim for certain barley-containing products linking the ingestion of β-glucan with
reduced risk of coronary heart disease (24)
. This has propagated wide interest in barley
among consumers and subsequently industry has responded with a wide range of β-
glucan and barley-containing products. Similarly, Health Canada has also approved a
food health claim for barley in 2012 (25)
. Despite this, barley is not extensively consumed
in North America compared to oats or other cereals, with the average individual
consuming approximately 0.5 kg/year/person (26)
. On the other hand, the desire to develop
palatable barley based products raises a number of concerns regarding the impact of
processing and refinement of barley on physiological parameters such as glycemia, GI
and subjective satiety.
Elucidation of the role of whole grains quality in health promotion requires a
4
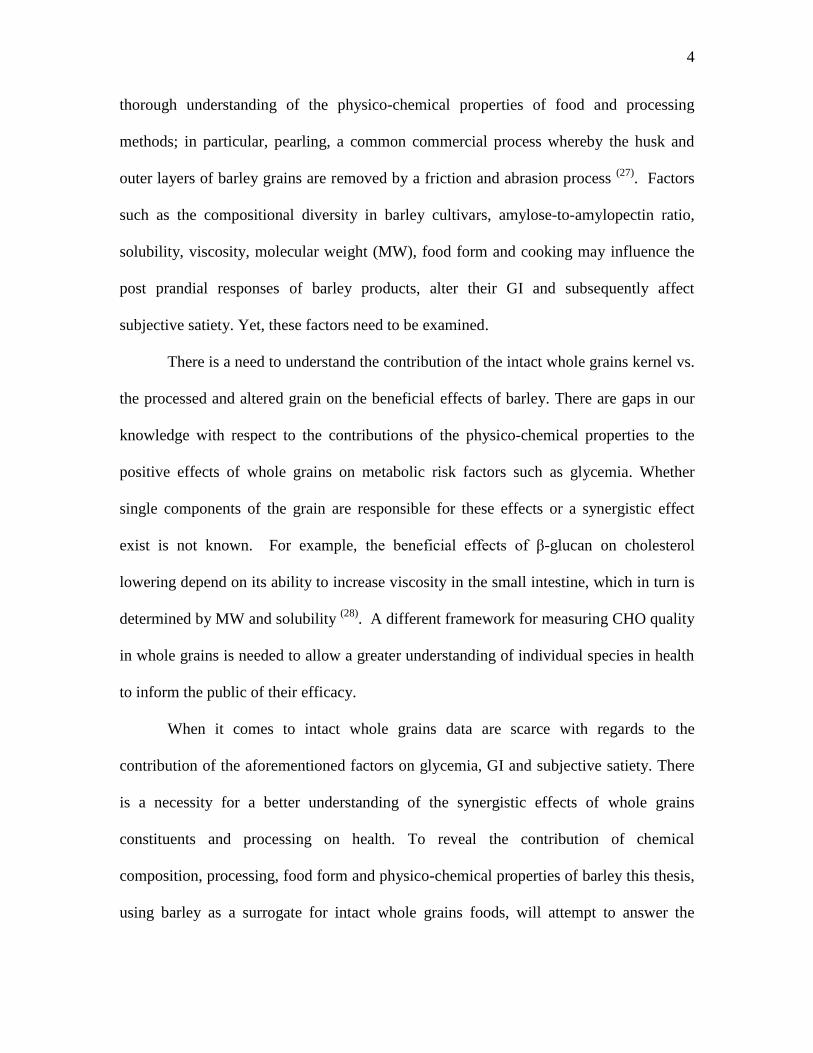
thorough understanding of the physico-chemical properties of food and processing
methods; in particular, pearling, a common commercial process whereby the husk and
outer layers of barley grains are removed by a friction and abrasion process (27)
. Factors
such as the compositional diversity in barley cultivars, amylose-to-amylopectin ratio,
solubility, viscosity, molecular weight (MW), food form and cooking may influence the
post prandial responses of barley products, alter their GI and subsequently affect
subjective satiety. Yet, these factors need to be examined.
There is a need to understand the contribution of the intact whole grains kernel vs.
the processed and altered grain on the beneficial effects of barley. There are gaps in our
knowledge with respect to the contributions of the physico-chemical properties to the
positive effects of whole grains on metabolic risk factors such as glycemia. Whether
single components of the grain are responsible for these effects or a synergistic effect
exist is not known. For example, the beneficial effects of β-glucan on cholesterol
lowering depend on its ability to increase viscosity in the small intestine, which in turn is
determined by MW and solubility (28)
. A different framework for measuring CHO quality
in whole grains is needed to allow a greater understanding of individual species in health
to inform the public of their efficacy.
When it comes to intact whole grains data are scarce with regards to the
contribution of the aforementioned factors on glycemia, GI and subjective satiety. There
is a necessity for a better understanding of the synergistic effects of whole grains
constituents and processing on health. To reveal the contribution of chemical
composition, processing, food form and physico-chemical properties of barley this thesis,
using barley as a surrogate for intact whole grains foods, will attempt to answer the
5
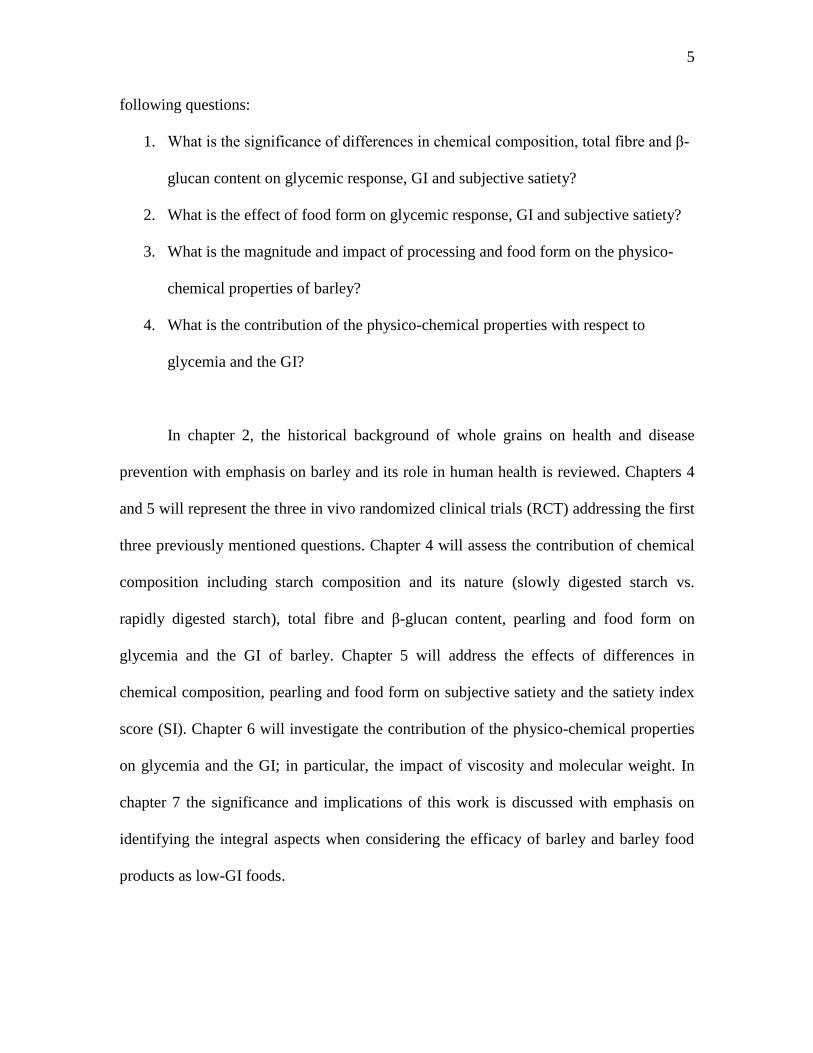
following questions:
1. What is the significance of differences in chemical composition, total fibre and β-
glucan content on glycemic response, GI and subjective satiety?
2. What is the effect of food form on glycemic response, GI and subjective satiety?
3. What is the magnitude and impact of processing and food form on the physico-
chemical properties of barley?
4. What is the contribution of the physico-chemical properties with respect to
glycemia and the GI?
In chapter 2, the historical background of whole grains on health and disease
prevention with emphasis on barley and its role in human health is reviewed. Chapters 4
and 5 will represent the three in vivo randomized clinical trials (RCT) addressing the first
three previously mentioned questions. Chapter 4 will assess the contribution of chemical
composition including starch composition and its nature (slowly digested starch vs.
rapidly digested starch), total fibre and β-glucan content, pearling and food form on
glycemia and the GI of barley. Chapter 5 will address the effects of differences in
chemical composition, pearling and food form on subjective satiety and the satiety index
score (SI). Chapter 6 will investigate the contribution of the physico-chemical properties
on glycemia and the GI; in particular, the impact of viscosity and molecular weight. In
chapter 7 the significance and implications of this work is discussed with emphasis on
identifying the integral aspects when considering the efficacy of barley and barley food
products as low-GI foods.
6
2. LITERATURE REVIEW
2.1. Whole Grains
In order to appreciate the significance of investigating factors such as the
compositional diversity in barley cultivars, solubility, viscosity, molecular weight (MW)
(i.e physico-chemical properties), and food form on the efficacy of barley requires a
review of whole grains literature to grasp the gaps in our knowledge. The work below
will include a discussion of whole grains definition, or lack off. An attempt to underline
the consequences of lack of consideration of the aforementioned factors on the efficacy of
whole grains, barley and barley food products in previous studies including prospective
cohorts and intervention studies is reviewed. A review of barley constituents, processing
methods and significance to health and disease will also be undertaken. Finally, the
significance of the glycemic index and how it relates to whole grains and barley will be
highlighted.
According to the International Association for Cereal Science and Technology
(ICC), and the European Health Grain Project, “the term ‘Grain’ applies to the genera and
species of the grass family Poaceae”. Whole grains are whole cereals such as wheat, rice,
maize, oats, barley and pseudocereals such as quinoa and amaranth. Grains that belong to
the Poaceae family are related at the structural and biochemical levels, which also
include pseudocereals (29)
.
Currently the most widely accepted definition, introduced over a decade ago, is
that of the American Association of Cereal Chemists International (AACC). The AACC
defines whole grains as consisting of the “ Intact, ground, cracked or flaked caryopsis
7
[grain], whose principle components – the starchy endosperm, germ and bran – are
present in the same relative proportions as they exist in the intact caryopsis” (30)
. This
definition provides the basis for food labeling, dietary recommendations and food health
claims in Canada, the U.S., and a number of European countries.
Most intact whole grains have to be processed before consumption which includes
milling the grain into flour and less damaging processes such as flaking, cracking and
rolling. These processes create flour for foods like bread or cookies and rolled oats
orbreakfast cereals. The metabolic consequences of such processing on the characteristics
of whole grains and the effects of separating whole grain constituents during milling for a
later recombination are underappreciated. Currently, the definition includes milled whole
grains into flour and the product is still considered a whole grain, otherwise known as a
whole grain food. Whether the intact whole grain kernel is nutritionally different than the
milled whole grain flour and if it will sustain the same physiological effects is not clear.
The lack of a global standardized definition along with scarcity in data in
differentiating whole grains that are intact kernels vs. whole grain foods may have
resulted in less than optimal labeling standards (31)
. The current labeling standards
promote a potentially misleading label on many whole grain products and causes
confusion among consumer and clinicians. For example, Health Canada allows the labels
“Whole Wheat” and “Whole Grain” to be used on products but they don’t mean the same
thing and many consumers and clinician are not aware of such knowledge. The Canadian
Food and Drug Regulation standards for whole wheat flour allows for the exclusion of
5% of the wheat grain which means a loss of about 70% of the germ and some of the bran
(32), this permits the label “Whole Wheat” but not a “ Whole Grain” because of the loss of
8
bran.
Similarly, the U.S. FDA defines a whole grain food as any product containing >
51% whole grain by weight per reference amount customarily consumed (RACC) per
day. This definition provided the basis for the 1999 FDA claim which was modified in
2003 and allows the following statement: “Diets rich in whole grain foods and other plant
foods and low in total fat, saturated fat, and cholesterol may reduce the risk of heart
disease and some cancers” (33)
. Similar claims are also seen in European countries like
the United Kingdom and Sweden. However, in 2010 the European Food Safety Authority
(EFSA) did not approve a similar whole grain health claim. According to ESFA expert
panel whole grain foods including whole grain flour are defined differently across the
European Union countries (EU). The panel decision was based on the inability to
characterize the food constituent of a whole grain (34)
. Health Canada rejected a similar
health claim for whole grains due to insufficient evidence from prospective cohort studies
and clinical trials and notes that the benefits seen from consuming specific whole grains
such as barley and oats cannot be extrapolated to other grains such is wheat, which is the
dominant grain in many parts of the world (35)
.
Nonetheless, whole grains and whole grain foods provide a myriad of important
nutrients and recommending their consumption is emphasized in many countries. The
Canada Food Guide (CFG) recommends Canadians to consume half of their grains in the
form of whole grains. Similar recommendations are seen in the U.S. Dietary Guidelines
2010. Despite this, whole grains consumption is very low worldwide with some
exception in Scandinavia, Eastern Europe, North Africa, Japan and Tibet.

9
2.2. Whole Grains and Disease Prevention
2.2.1. Prospective cohort studies
Intact whole grains and whole grain foods have been associated with many health
outcomes, from promoting gut health (36)
to reducing the risk disease biomarkers and
developing chronic illness such as T2D (37)
, CVD (38)
, blood pressure (39)
, metabolic
syndrome (40)
and cancer (41)
. The bulk of evidence comes from prospective cohort studies
providing robust indicators of the relationship between whole grains consumption and
health outcomes. There have been a number of meta-analyses further augmenting these
associations (8, 42)
. Ye et al (8)
conducted a recent systematic review and a meta-analysis
examining the association between both whole grains intake and the risk of T2D, CVD
and weight gain. Ye and colleagues found that subjects who consume an average of 48 -
80 g/d of whole grains had a 26% reduction in T2D, a 21% reduction in CVD risk and
consistently less weight gain (1.27 vs. 1.64 kg) during 8 – 13 y of follow up compared to
those who rarely or never consume whole grains. The range of reduction in relative risk
(RR) in a multivariable-adjusted model was between 14% - 35% for 6 studies comprised
of 2,919,482 person-years of follow-up and 12% - 31% for 10 studies comprised of
4,336,411 person-years of follow-up for T2D and CVD respectively.
On the other hand, most of the observational studies examining the relationship
between whole grains and health outcomes suffer from methodological difficulties that
hinder their comparisons; the method for measuring whole grain intake varied among
studies and in some cases may be imprecise. For example, dark bread is considered to be
whole grain bread in many of these studies regardless of its chemical composition. There
are other data that are based on a more rigorous approach; De Moura et al (23)
assessed the
10
effect of applying the FDA definition of whole grains on the precision of scientific
evidence supporting the claims for risk reduction of CVD. This approach resulted in the
exclusion of many studies with only five eligible studies. De Moura and colleagues
concluded that when considering only studies that fulfilled the FDA definition of whole
grains, there is insufficient scientific evidence to support the claim associating whole
grains intake and the reduction in the risk of CVD. However, the claim is supported only
when using a broader definition that included studies considering the intake of fibre rich
bran and germ as well as the whole grain. De Moura further states that despite the
similarities whole grains share as a class, there are significant differences among the
individual grains not only in fibre content or bran but in the content of putative bioactive
compounds and thus the diverse grains may have significantly different health benefits.
2.2.2. Randomized clinical trials
Despite the robust indications of a strong relationship between a wider definition
of whole grains and health outcomes from prospective cohort studies, randomized clinical
trials (RCT) have not demonstrated similar results on a number of metabolic risk factors
of chronic illness such as T2D, CVD and metabolic syndrome. This is further
complicated by the fact that majority of clinical studies of the effects of whole grains on
T2D and/or CVD risk biomarkers were conducted using single grains such as oats and
barley or products with functional fibre (43, 44)
, thus limiting their generalizability to all
the different whole grains. There is a lack of evidence from dietary intervention studies
with large number of subjects showing the benefits of whole grains and disease
outcomes. Nonetheless, there is a few RCT’s with small numbers of subjects and short
duration that provide some insight to the relationship between WG and health.

11
Pereira et al (45)
conducted a 6 week intervention of 7 servings of WG/day
compared with equivalent as refined grain in 11 overweight hyperinsulinemic men with
all the foods being supplied during the study. Pereira and colleagues found a 10%
reduction in fasting insulin concentration and improved insulin sensitivity measured by
euglycemic hyperinsulinemic clamp, which is considered the gold standard in measuring
insulin sensitivity. However, study by Andersson et al (46)
found no change in peripheral
insulin sensitivity, measured by a euglycemic hyperinsulinemic clamp, in 22
postmenopausal women and 8 men fed 112 g of WG/day compared with equivalent
amount of refined grain for 6 weeks. More recently a large European RCT, the
WHOLEheart study, investigated the effects of CVD risk markers of substituting WG for
refined grains. The study consisted of 316 non WG consumers randomized to three
groups: control (no dietary intervention, intervention 1 (60g WG/d for 16 weeks) and
intervention 2 (60g WG/d for 8 weeks followed by 120g WG/d for 8 weeks). The study
findings showed no significant differences between groups in body mass index (BMI),
percentage body fat, waist circumference, fasting plasma lipid profile, glucose, insulin,
inflammatory markers and endothelial function (47)
. A possible explanation for the lack
of effect may be attributed to the intervention choice of test foods, mostly hi-GI and
glycemic load (GL) processed and reconstituted whole grain foods rather than intact
kernels; a choice made based on a realistic reflection of whole grain products sold in the
study location. In the De Moura (23)
comprehensive review they assessed 15
interventional studies, seven of which only tested oats with one showing no effect on total
cholesterol (TC), 1 barley only and the rest included brown rice and wheat. They note
“that the positive effect of barley reported across different populations, gender and health
12
status adds strength to the evidence for a beneficial health effect of barley on plasma TC
and LDL-C levels”.
Despite the consistent epidemiological evidence supporting the notion that whole
grains substantially lower the risk of disease metabolic markers and chronic illness,
evidence from intervention studies is conflicted. The evidence repeatedly indicates that
certain whole grains are superior to others in promoting health outcomes, in particular
barley.
2.3. Barley
Barley, Hordeum vulgare vulgare L, is an ancient grain with cultivation dating
back to 8000 BC in the fertile crescent in the Middle East (48)
. In North America barley
was mainly used as a human food but in the 19th and 20th centuries it evolved largely
into an animal feed, malting and brewing grain. These uses drastically reduced barley
human consumption, due in part to improved conditions of wheat production, along with
the increase use of rice and maize in the human diet. Yet, barley is still a staple food in
many parts of the world including Asia, Middle East, North Africa and Eastern Europe
(49). In Tibet barley provides 80% of the calories in the diet of rural Tibetans
(26).
Similarly, in Morocco the average person consumes 68.3 kg of barley a year (50)
. In
comparison, most individuals in the North America and Europe consume less than 1
kg/person/year with Canadians eating approximately 0.5 kg/year. In Canada, between 55
and 60% of barley is used as animal feed, 25-30% for brewing, 2-5% for seed and 2-5%
for human consumption (51)
.
Barley is an important crop ranking fifth among all crops in dry matter production
13
in the world (52)
. In Canada, barley ranks third in grain production after wheat and maize.
In the 2010/2011 market year, Canada ranked fifth worldwide in total barley production
with 7,755,700 metric tons, and was responsible for 22% of the barley exported
worldwide.
2.3.1. Barley cultivars
Barley may be one of the most widely adaptable grains allowing it to be cultivated
in contrasting climates and various locations worldwide (53)
; it is a genetically diverse
grain. This genetic diversity allows barley to be classified as either spring or winter types.
Barley is further categorized as either a two-row or six-row; and hulled or hull-less. Two-
row barley has 2 rows of seeds on each spike and six-row has 6 rows of seeds on each
spike (botanically: two-row has 1 fertile floret per rachis node and a six-row has 3 fertile
florets per rachis node) (48)
. Hulled and hull-less barleys are distinguished by the presence
or absence of a hull tightly wrapping the grain. Any of these types can be further
classified into either malting or feed barley depending on the end-use of the grain.
Kernels from two-row barleys are generally larger and more uniform in size than those
from six-rowed barleys due to crowding of spikelet’s on the spike in the latter. Hull-less
barley are free threshing or naked grains. According to the grain chemical composition
barley grains are further classified as normal, waxy, high amylose starch type, high
lysine, and high β-glucan (54)
.
The physical and chemical characteristics of barley are an important aspect to be
considered to reinstate barley as a human food. These aspects can be affected by
processing, a necessary step in preparing barley for human consumption. The most
common barley processing method is pearling, a common commercial process whereby

14
the husk and outer layers of barley grains are removed by a friction and abrasion. There
has been a general preference, by consumers and food manufacturers alike, for a bright
white colour of pearled barley and milled barley flour (50)
. Yet, in recent years the rising
interest in whole grains and their products such as whole grain flour by consumers has
diminished the demand for white food products such as white bread and pasta.
Figure 1. Barley grain with enlarged cross section (54)
.

15
2.3.2. Chemical composition
Barley cultivars vary widely in their chemical composition due to differences in
genotype, growing environment and the interaction between the two (55)
. Normal barley
generally consists of approximately 60 – 70% starch per dry matter (dm), making starch
the most abundant constituent and found mostly in the endosperm (56)
. The next chief
constituents are total fibre ranging from 11 – 34% and protein 10 – 20%; of total fibre 3 –
20% is soluble dietary fibre with 5 – 10% β-glucan depending on the cultivar. Other
constituents include 2 – 3% free lipids and 1.5 – 2.5% minerals (57)
. Barley also contains a
myriad of other components including a number of antioxidants and phenolic compounds
(58), however, it is beyond the scope of this thesis and for that reason this review will
discuss only the chief components of barley.
2.3.3. Available carbohydrates
In general, barley is predominantly composed of glycemic carbohydrates and
dietary fibre. There is a small concentration of low molecular weight carbohydrates
which must be included with starch, the predominant constituent, when calculating the
composition of glycemic carbohydrates in barley. Barley has a small percentage of
simple sugars like glucose, fructose, sucrose, maltose and raffinose (range 0.03 – 0.83 %
db). Starch is the predominant glycemic carbohydrates in barley; in normal barley starch
consists of amylose and amylopectin polymers. Amylose is an essentially linear molecule
consisting of glucose monomers joined by α 1-4 bonds. In contrast amylopectin is a
branched α 1-4 and α 1-6 linked molecules (56)
. The content of amylose in barley depends
on the barley type with normal barley starch consisting of approximately 1:3 ratio of
amylose to amylopectin while waxy barleys can range from 0-5% amylose of total starch
16
(59-61).
The rate of glucose release into the blood stream from different starches can vary
significantly (2)
. Therefore for physiological and nutritional purposes starch can be further
classified depending on its rate of glucose release into rapidly digested starch (RDS) and
slowly digested starch (SDS). This classification is based on in vitro measurements by
Englyst methods (2)
. RDS represent the amount of glucose released within the initial 20
min of digestion, whereas SDS represents the amount of glucose released between 20 and
120 min of digestion. The rate of digestion can be influenced by factors like the branched
structure of amylopectin which makes it more susceptible to hydrolysis than amylose (67)
,
therefore the amylose to amylopectin ratio have a significant effect on glycemia.
Available dietary carbohydrates include starch and glycemic carbohydrates such as
glucose and maltose. Classifications such as rapidly available glucose and slowly
available glucose from sugar and starch can provide further insight into the physiological
effects of carbohydrates. These measurements are done by measuring free glucose as
well as glucose release after 20 and 120 min incubation at 37 °C in the presence of
pancreatic amylase and amyloglucosidase to determine rapidly and slowly digestible
starch content as well as the starch digestion index and rapidly available glucose.
Starch can be further characterized into resistant starch (RS), defined as “the
starch and starch degradation products that on average resist digestion in the small
intestine” (2)
. There are four types of RS; RS1 is physically inaccessible starch, most seen
in whole grains. RS2 are native starch granules that are not digested because of
conformation or structure shielding. RS3 are non-granular starch-derived materials
formed during retrogradation, which is due to cooling or storing gelatinized starch,
17
defined as the irreversible swelling and/or disruption of the starch granules (62)
. Finally
RS4 starches are chemically modified starches (63)
. In cereal grains and products the RS
proportion of starch is relatively small, typically 0-5% of starch (64)
. The amount of RS is
influenced by factors like the amount of starch present, food processing, and how the
food is cooked and stored (65)
. The concentration of RS in barley can be increased
through extrusion cooking and pelleting of barley products (51, 66)
.
2.3.4. Fibre
Since the establishment of the fibre hypothesis by Burkitt and Trowell (68)
our
understanding of dietary carbohydrates has progressed greatly with a distinctive interest
and role of fibre. The most widely used fibre definition is “the nondigestable
carbohydrates and lignin that are intrinsic and intact in plants” (69)
. In barley, fibre
represents the second major constituent of the grain after starch, but unlike starch, fibre is
found throughout the kernel. Fibre can be classified into soluble and insoluble forms. The
content of total fibre in barley ranges from 11–34% of which 3–20% is soluble dietary
fibre mostly in the form of β-glucan (57, 70, 71)
.
2.3.5. β-glucan
β-glucans are soluble fibres found in many cereal grains, they are large linear
polysaccharides of glucose monomers. Specifically, the mixed linkage (13, 14)-β-D-
glucans, are linear homopolymers of D-glucopyranosyl residues. Barley is considered to
be the richest source of β-glucans which account for approximately 75% of the total cell
wall polysaccharides in the endosperm cell walls; the rest consists of arabinoxylans,
cellulose, glucamannans and proteins (57)
. The recent focus and renewed interest in

18
barley as a human food is largely due to the health benefits attributed to β-glucan. The β-
glucan content of barley can range from approximately 2-11%, which is generally higher
than oats (2.2–7.8) and wheat (0.4-1.4%) (57)
. The health benefits associated with
consuming β-glucan rich foods include lowering blood glucose, insulin and blood lipids,
in particular, serum total and LDL-cholesterol (28)
. Some of these effects have been shown
to depend on the capacity of β-glucan to increase the viscosity (defined as a measure of
resistance to flow) of intestinal content, which in turn depends on β-glucan molecular
weight (MW) and solubility (28)
. Wolever et al (72)
conducted a double blind parallel
design RCT to determine the physiological effectiveness of high-MW oat β-glucan
compared to a medium and low-MW oat β-glucan in lowering LDL cholesterol in 345
subjects. Wolever and colleagues showed that when subjects with high LDL cholesterol
consumed a breakfast cereal containing 3 g high-MW oat β-glucan cereal/day, LDL was
lowered by 5% but the effect was reduced by 50% in subjects consuming a breakfast
meal with a low-MW oat β-glucan. However, the relationship between MW and glycemia
or the GI has not been fully examined yet. The consequence of differences in chemical
composition, processing, and food form on the MW, viscosity, solubility of β-glucan and
their interactions have also not been fully explored.
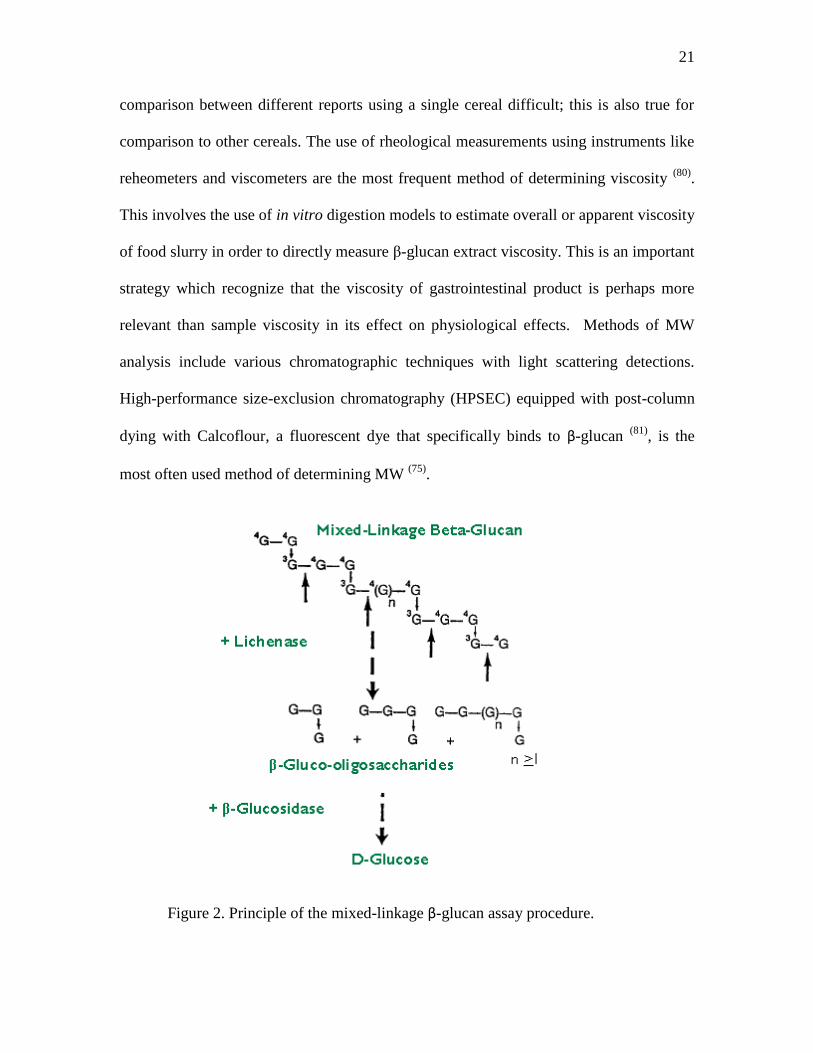
The process of determining the quality of barley and the physiological
effectiveness of barley β-glucan on physiological responses requires the determination of
the amount of β-glucan. Total β-glucan content is generally determined based on the
overall sample. The most common method for β-glucan determination is the AOAC (73)
.
The method is also known as the McCleary and Codd (74)
; it involves β-glucan dissolution
in a buffer where its hydrolysed to oligosaccharides and glucose using the lichenase and

19
β-glucanase enzymes respectively. Other available methods include the use of dyes such
as Calcoflour which is a specific dye for β-glucan.
2.3.6. Physico-chemical Characteristics of β-glucan
The physico-chemical properties of β-glucan in barley have been suggested to
have a key role in affecting postprandial responses in humans. The number of parameters
that include the following: MW, solubility, viscosity, microstructure, particle size, chain
length, and concentration of β-glucan among other parameters. The physico-chemical
properties denote an interaction between the physical properties ( e.g. Structure and MW)
and the chemical properties ( viscosity and chain length) and their impact on
physiological activity in vivo. Data in the literature indicate a strong correlation and
interdependence between these factors (28, 72, 75-77)
and glycemia and the GI. In particular,
viscosity and MW are thought to have a superior role and they are mutually associated
with the physiological effectiveness of β-glucan. Viscosity is defined as the resistant of a
solution to flow and MW, a measure of the size and weight of the polysaccharides in β-
glucan, is defined as the following:
(77)
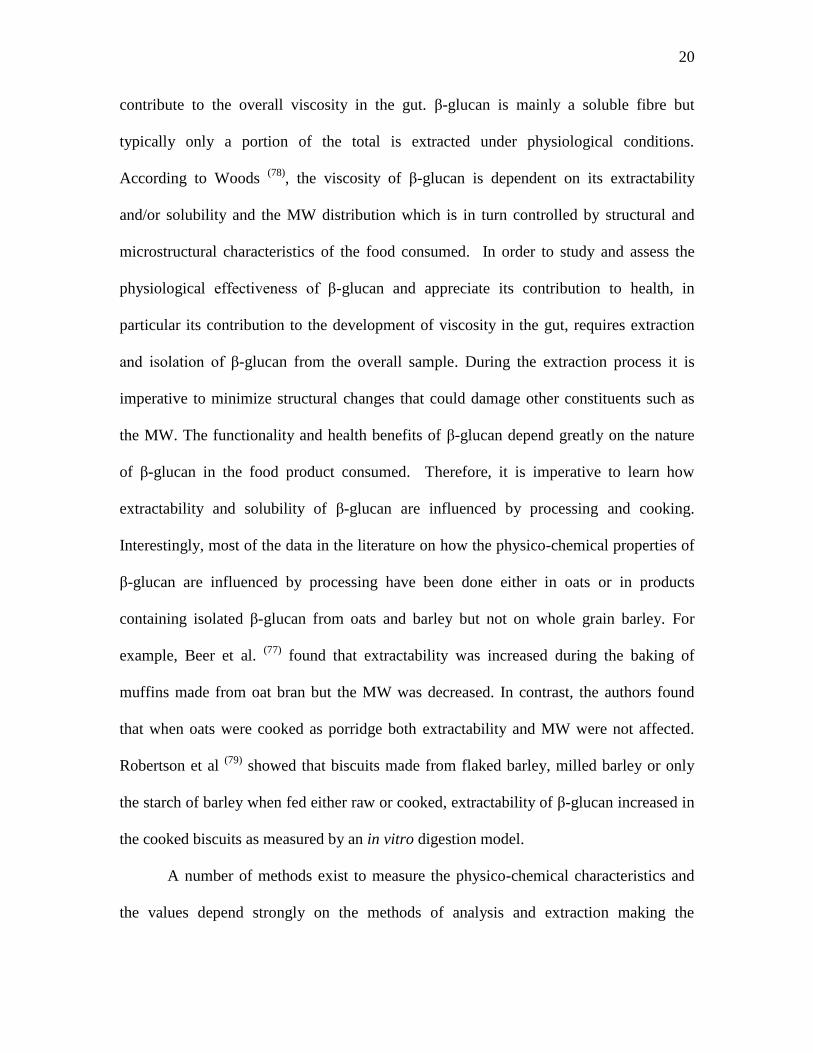
The physiological effectiveness of β-glucan depends greatly on its ability to
20
contribute to the overall viscosity in the gut. β-glucan is mainly a soluble fibre but
typically only a portion of the total is extracted under physiological conditions.
According to Woods (78)
, the viscosity of β-glucan is dependent on its extractability
and/or solubility and the MW distribution which is in turn controlled by structural and
microstructural characteristics of the food consumed. In order to study and assess the
physiological effectiveness of β-glucan and appreciate its contribution to health, in
particular its contribution to the development of viscosity in the gut, requires extraction
and isolation of β-glucan from the overall sample. During the extraction process it is
imperative to minimize structural changes that could damage other constituents such as
the MW. The functionality and health benefits of β-glucan depend greatly on the nature
of β-glucan in the food product consumed. Therefore, it is imperative to learn how
extractability and solubility of β-glucan are influenced by processing and cooking.
Interestingly, most of the data in the literature on how the physico-chemical properties of
β-glucan are influenced by processing have been done either in oats or in products
containing isolated β-glucan from oats and barley but not on whole grain barley. For
example, Beer et al. (77)
found that extractability was increased during the baking of
muffins made from oat bran but the MW was decreased. In contrast, the authors found
that when oats were cooked as porridge both extractability and MW were not affected.
Robertson et al (79)
showed that biscuits made from flaked barley, milled barley or only
the starch of barley when fed either raw or cooked, extractability of β-glucan increased in
the cooked biscuits as measured by an in vitro digestion model.
A number of methods exist to measure the physico-chemical characteristics and
the values depend strongly on the methods of analysis and extraction making the
21
comparison between different reports using a single cereal difficult; this is also true for
comparison to other cereals. The use of rheological measurements using instruments like
reheometers and viscometers are the most frequent method of determining viscosity (80)
.
This involves the use of in vitro digestion models to estimate overall or apparent viscosity
of food slurry in order to directly measure β-glucan extract viscosity. This is an important
strategy which recognize that the viscosity of gastrointestinal product is perhaps more
relevant than sample viscosity in its effect on physiological effects. Methods of MW
analysis include various chromatographic techniques with light scattering detections.
High-performance size-exclusion chromatography (HPSEC) equipped with post-column
dying with Calcoflour, a fluorescent dye that specifically binds to β-glucan (81)
, is the
most often used method of determining MW (75)
.
Figure 2. Principle of the mixed-linkage β-glucan assay procedure.
22
2.3.7. Barley Processing and Cooking
Preparing barley for human consumption requires processing and cooking, since
most barley cultivars are hulled, removing the hulls or dehulling is necessary. The most
common method of processing is “Pearling” considered as one of the oldest practices
used in the processing of barley. This process of abrasion of the barley kernel involves
the successive removal of grain tissue starting with the outer layers of barley and working
inward. Dehulling by pearling still renders the barley grain as a whole grain, because the
germ, endosperm and bran layers are still intact. Depending on the amount of materials
removed, the rate of pearling, which is dictated by cultural preferences, can produce
barley cultivars labelled as: wholegrain (only the husk was removed), pot ( dehulled and
further removal of pericarp) and white-pearled (WP) (all the bran and most of the germ
and crease removed) (27)
( Figure 1). Varying the degree of pearling time resulted in
significant alterations in the chemical and nutritional composition of barley. These
changes include decreasing total fibre but not soluble fibre (82)
, increased concentration of
starch and β-glucan; this can be done without significant effects on the endosperm (83)
but
only up to a pearling degree of 15% (84)
. Pearling is considered as a beneficial method of
creating barley fraction with specific characteristics (i.e. high/low starch, high β-glucan)
for different end uses such as the addition of smaller amount of barley to foods or to
incorporate barley as a functional food ingredient. Barley can also be milled using a
roller mill to produce barley flour and bran, this is considered an uncommon practice and
needs to be further explored (85)
. It’s generally assumed that barley bran consists of the
testa, pericarp, germ, aleurone and the subaleurone layers; however, since barley is
23
pearled before milling, the bran and flour composition may differ depending on the
degree of pearling (27)
. Abrasion milling and sieving is another form of barley milling,
which involves the milling of dehulled or hull-less barley by an abrasion mill and sieving
the ground material through a series of sieves with an option of different sizes for the
openings.
Extrusion cooking is a popular industrial technique for the production of breakfast
cereals, breads, pasta and cooked flour (27)
. This process employs simultaneous actions of
temperature, pressure and shear at differing level of intensities. Other forms of cooking
include hydrothermal treatments (27)
. These processing methods are thought to aim
principally on enhancing the nutritional value of barley and creating longer shelf-life and
convenient barley based products. Nonetheless, their impact on the metabolic effect of
barley in humans is not known. Further, the effect of these processes on the physico-
chemical properties of barley is also unknown.
Processing and cooking cause’s major changes in the architecture of the grain, mostly
in the cell wall matrix. Exposing starch rich foods to boiled water can result in
significant changes to starch properties. Starch can go through transformations that can
affect its digestibility such as gelatinization. Gelatinization occurs when starch is heated
in water; it is the disruption of molecular structures within the starch granule. This leads
to swelling in the granules due to increased water absorption which coincides with
leaching of material from the starch granules, mostly amylose (61 -62)
. Changes can also
occur to the particle size either due to pearling, milling or cooking thereby reducing the
particle size. This leads to more exposure per surface area to digestive enzymes and
consequently accelerates starch hydrolysis and the digestion and absorption processes.
24
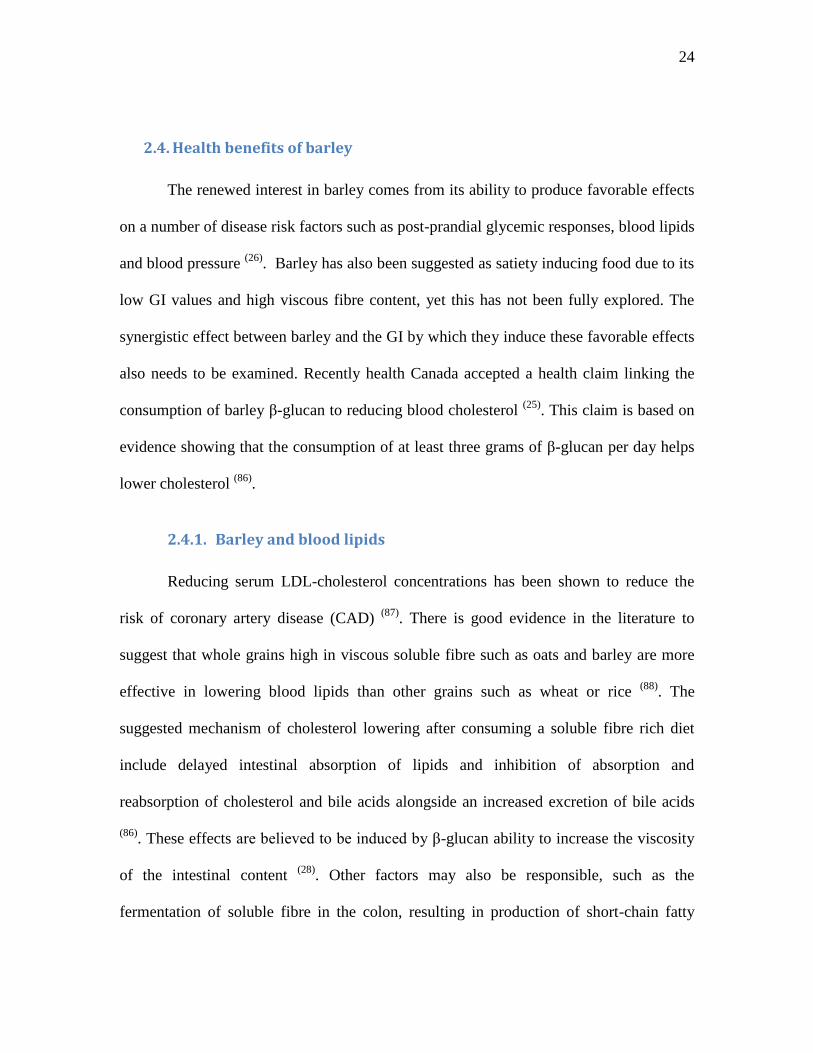
2.4. Health benefits of barley
The renewed interest in barley comes from its ability to produce favorable effects
on a number of disease risk factors such as post-prandial glycemic responses, blood lipids
and blood pressure (26)
. Barley has also been suggested as satiety inducing food due to its
low GI values and high viscous fibre content, yet this has not been fully explored. The
synergistic effect between barley and the GI by which they induce these favorable effects
also needs to be examined. Recently health Canada accepted a health claim linking the
consumption of barley β-glucan to reducing blood cholesterol (25)
. This claim is based on
evidence showing that the consumption of at least three grams of β-glucan per day helps
lower cholesterol (86)
.
2.4.1. Barley and blood lipids
Reducing serum LDL-cholesterol concentrations has been shown to reduce the
risk of coronary artery disease (CAD) (87)
. There is good evidence in the literature to
suggest that whole grains high in viscous soluble fibre such as oats and barley are more
effective in lowering blood lipids than other grains such as wheat or rice (88)
. The
suggested mechanism of cholesterol lowering after consuming a soluble fibre rich diet
include delayed intestinal absorption of lipids and inhibition of absorption and
reabsorption of cholesterol and bile acids alongside an increased excretion of bile acids
(86). These effects are believed to be induced by β-glucan ability to increase the viscosity
of the intestinal content (28)
. Other factors may also be responsible, such as the
fermentation of soluble fibre in the colon, resulting in production of short-chain fatty

25
acids inhibiting cholesterol biosynthesis (89)
.
Since the approval of a food health claim of the cholesterol lowering abilities of
oat β-glucan by the FDA in 1997, numerous reports of the effects of oats and barley
products on blood lipids, mostly with oats, have been published. Interest in barley gained
further attention due to its high content of soluble fibre, mostly β-glucan and its very low
GI values (20 – 46) (90)
. This has been translated into a number of health claims for
barley per se (25, 91)
. Most of the available data on barley or barley products are related to
cholesterol lowering ability with a few investigating other disease end point and
metabolic markers such as glycemia, hypertension, inflammation and satiety. More
importantly, most of the interventions are done in harshly processed barley, barley
enriched food products and extracted β-glucan with a few using intact whole grain barley
kernels.
Recently, AbuMweis et al (86)
conducted a meta-analysis to accurately quantify
the effect of barley β-glucan on blood lipids concentrations in humans and assess factors
that could affect its efficacy. AbuMweis and colleagues identified 11 studies
investigating the effect of barley β-glucan on blood lipids, of which 2 studies did not find
an effect (92, 93)
. Overall, they found a reduction in weighted mean effect size of 0.30
mmol/l (95% CI: -0.39, to -0.21, P<0.00001) and 0.27 mmol/l (95% CI: -0.34, to -0.20,
P<0.00001) for total and LDL cholesterol compared with control without finding a dose-
dependent response. The authors note that the lack of effects in the two studies are due to
issues like MW and the use of extracted barley β-glucan in different food products and
forms, factors that have not been comprehensively investigated when assessing the
effects of barley on glycemia and satiety. They also note the importance of barley

26
physico-chemical characteristic such as MW and solubility as determinants of barley’s
ability to lower cholesterol, an observation that have been reconfirmed recently (72)
. The
authors further conducted a subgroup analysis comparing the interventions that used
barley vs. extractable β-glucan from barley, they found that the reduction in total
cholesterol was only significant in barley but not the extracted β-glucan products
(P<0.00001).
2.4.2. Barley and Glycemia
Global data show an un-abating upward trajectory in diabetes rates with 366
million people suffering from diabetes in 2011-2012 worldwide (94)
. T2D is characterized
by insulin resistance and reduced insulin secretion (95)
. Therefore, food products that
decrease plasma glucose and insulin demands may plausibly reduce the risk of
developing T2D (96)
. Data also shows that increased blood glucose responses produce
undesirable consequences on health, an occurrence known as hyperglycemia (97)
. Post-
prandial hyperglycemia is characterized by high blood glucose concentrations post meal,
which is a strong predictor for developing T2D. Hyperglycemia and constant fluctuations
in blood glucose have been further associated with increasing oxidative stress, protein
glycylation and inflammatory responses (98)
, all of which are risk factors for a number of
chronic illness that share a common underlying pathophysiological mechanism (96)
.
Barley and barley food products have been shown to produce favorable effects on
glycemia (44)
. The mechanism responsible for these effects have been suggested to be
related to the ability of barley β-glucan in its original state which possess a very high-
MW that exhibits high viscosity at a low concentration. Consuming β-glucan rich barley
can increase the viscosity of the meal bolus in the stomach reducing the mixing of food

27
with digestive enzymes and delaying gastric emptying (99)
. Increasing the viscosity has
also been shown to retard the absorption of glucose (100)
and slow the rate of starch
digestion in in vitro digestion model studies (75, 101, 102)
.
Tosh (103)
conducted a recent comprehensive review of human studies
investigating the role of barley and oat food products in lowering post-prandial blood
glucose. Of the 34 studies identified by the author to fit the selection criteria, 10 studies
used barley products in the intervention and 6 used both barley and oat food products.
The treatments included 64 barley products of which only 64% demonstrated a
significant effect in reducing AUC or the GI (GI reduction in a barley enriched products
such as bread). The average β-glucan dose in barley products was 4.7 ± 2.5 g with a range
of change in AUC − 1.4 to − 147 mmol.min/l (the average AUC change was -54 ± 39
mmol.min/l), a reduction that may be considered clinically relevant. Studies with intact
barley kernels are scarce, only two previous studies have used intact barley (102, 104)
, and
evidence of an association between the naturally occurring β-glucan in intact barley and
the presumed health benefits is limited. Most studies in the literature have used barley
enriched products or extracted and concentrated barley β-glucan to assess the effects of
barley on postprandial responses, an extrapolation that may not be precise.
Granfeldt et al (102)
conducted an intervention using boiled intact (rice replacement) and
milled (porridge) barley kernels with different amylose – amylopectin ratio to assess the
glucose and insulin responses to these products. All the barley kernels and porridge
products elicited a lower blood glucose response compared to the control, a white wheat
bread (P<0.05). The intact barley kernels produced a significantly lower response than
their corresponding boiled flours (porridge) (P<0.05) with no differences among the

28
intact kernels or in the GI among all treatments. The authors also measured the insulin
AUC and an insulin index and found no significant differences between barley products
including the milled flour.
The Granfeldt et al study has limitation that makes it difficult to interpret; (1) all
the barley test foods were consumed as part of a meal which included protein (19g), fat
(8.4g) 200 ml of water and 150 ml of coffee or tea. This may dilute the interpretation of
the direct observations due to effects like stomach distension, visual perception and
feelings of fullness due to increased meal volume and energy content; (2) the barley
cultivars tested may not be applicable to cultivars grown in Canada or North America in
general. The study also lacks a comprehensive characterisation of starch and the physico-
chemical properties of barley cultivars.
As mentioned previously there is strong evidence that the main factor responsible
for the low glycemic response to barley foods is related to the viscosity of β-glucan,
therefore studies assessing barley impact on postprandial responses should take into
consideration such characteristics and examine factors that impact them. This was first
revealed by Jenkins et al (105)
, where they were the first to demonstrate that the capability
of certain soluble fibres to lower post-prandial glycemia was lost after acid hydrolysis;
the authors also observed a relationship between viscosity and glycemic responses. This
work was the prelude to the conception of the glycemic index by the same group.
2.5. THE GLYCEMIC INDEX
2.5.1. Overview
During the 1970s, interest in comparing glycemic responses elicited by different
29
carbohydrates began to rise leading to indications that post-prandial blood glucose
responses are not the same in different CHO rich foods (3, 105-109)
. The systematic
classification of foods according to their glycemic responses was first undertaken by Otto
and Niklas (110)
, as an approach to incorporate foods into diabetic diets in quantities
inversely proportional to their glycemic responses. In 1981, the glycemic index concept
was introduced by Jenkins and his colleagues as a physiological metric classification that
provided scientists and clinicians with a physiological ranking of CHO rich food potential
to raise blood glucose (12)
. The concept was an extension of the Fibre hypothesis of
Burkitt and Trowell (68)
, which suggests that foods that are slowly absorbed may have
metabolic benefits in relation to diabetes and to the reduction of coronary heart disease.
Initially, it was thought that GI was only relevant in the treatment of Diabetes (14)
.
However, the increased interest in research related to the GI has progressed and further
clinical utilities have been revealed.
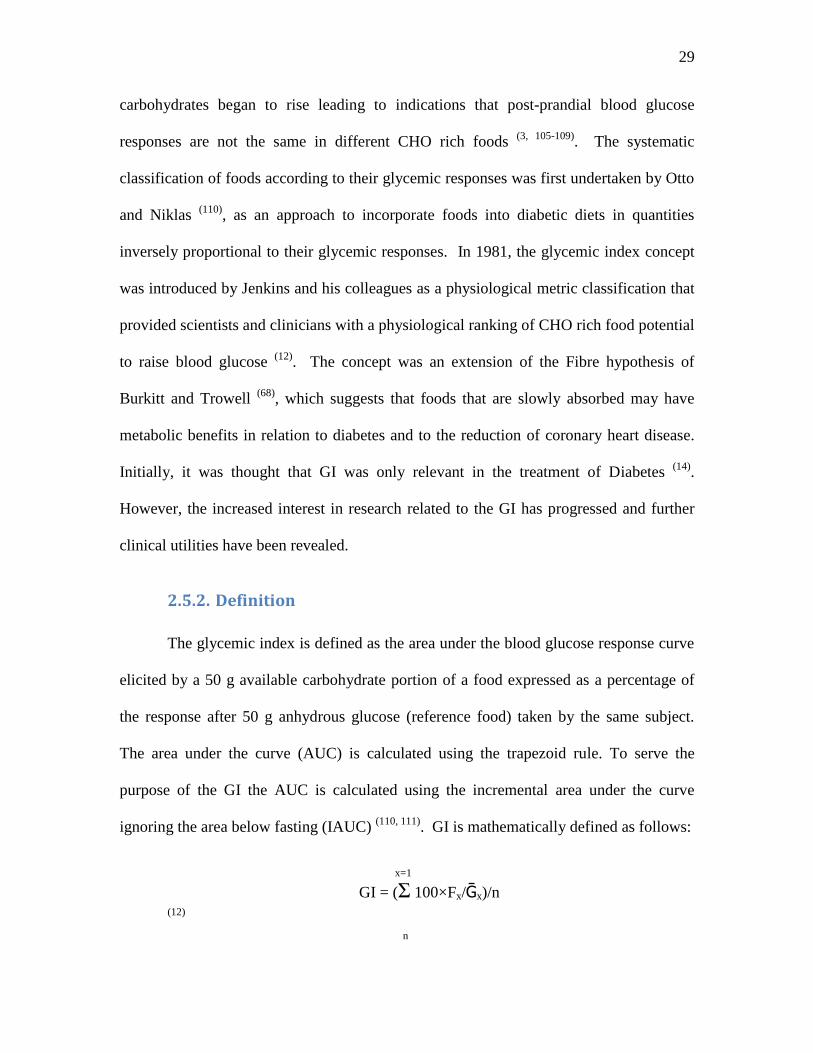
2.5.2. Definition
The glycemic index is defined as the area under the blood glucose response curve
elicited by a 50 g available carbohydrate portion of a food expressed as a percentage of
the response after 50 g anhydrous glucose (reference food) taken by the same subject.
The area under the curve (AUC) is calculated using the trapezoid rule. To serve the
purpose of the GI the AUC is calculated using the incremental area under the curve
ignoring the area below fasting (IAUC) (110, 111)
. GI is mathematically defined as follows:
x=1
GI = (Σ 100×Fx/Ḡx)/n
(12)
n
30
where Fx is the incremental area under the blood glucose response curve (AUC) in
subject x elicited by 50g available carbohydrate from the test food and Ḡx is mean the
AUC in subject x elicited by 50g glucose tested on 2 or 3 separate occasions. The GI is
the mean of these values in n subjects; the current internationally accepted GI method (13)
stipulates that n≥10. Thus, any so-called GI value not based on equation [cite] with n ≥
10 is not a valid GI. Several key implications of the definition of GI as given in equation
are (12)
: GI is a property of foods which is measured in human subjects; GI is not a
glycemic response; and GI is a property of high carbohydrate foods tested alone (not as
part of a mixed meal).
2.5.3. Glycemic Index Methodology
In 1998, GI methodology was discussed as part of a global meeting on the role of
dietary carbohydrates in nutrition. The joint committee of FAO/WHO Expert
Consultation has agreed on a reference methodology (1)
, and provided recommendation in
regards to the practical application of GI. The recommendation included “the glycemic
index can be used, in conjunction with information about food composition, to guide food
choices” and “at least 55% of energy be derived from carbohydrates and that the bulk of
carbohydrate foods be those rich in dietary fibre and with a low glycemic index”. The
methodology has since gone a more detailed review in 2005 (112)
and an Australian
method was recognized in 2007 (113)
. These methods were further evaluated in an
international inter-laboratory studies in 2003 (114)
and 2008 (115)
to further enhance the
precision and validity of the methods. More recently, an official International Standards

31
Organization (ISO) method for the GI has been published (13)
.
The protocol is recommended to adhere to the following procedures: The
recruitment of healthy male or female subjects between the ages of 18-75, for most
purposes 10 subjects or more is recommended. Subjects should be studied in morning
between the hours 7:00-9:30 am after an overnight fast of 10-14 hours. On each test
occasion the subject is weighed and two fasting blood samples are obtained by finger-
prick, after that the subjects start to consume the test meal within 10-15 minutes, where a
timer is started with the first bite of the test meal. Additional blood samples are obtained
at 15, 30, 45, 60, 90, and 120 minutes after starting to eat. The test meals consist of
portions of the test food containing 50 g available carbohydrate. Subjects should have a
drink with the test meal, and can choose to have one or two cups of water, tea or coffee
with or without 2% milk (30 ml) and artificial sweetener. The volume and type of drink
the subject choose should remain the same for all tests done by that subject. GI studies
are mostly done in a series of tests including a certain number of test foods and at least
three tests of the reference food. Reference food can be in the form of anhydrous glucose
or white bread which is used most often. The IAUC is calculated using the trapezoid rule.
The individual IAUC values for each test food in each subject are expressed as a
percentage of the mean IAUC value for the repeated reference food tests taken by the
same subject. The mean of the resulting values for each food is the GI value for that food
(ISO, 2010) (13)
.
2.5.4. Clinical Utility and Implications of Glycemic Index
Originally the intended utility of the GI was to be used in supplement with
information about the composition of foods in planning diets for diabetic patients. This is

32
supported by strong evidence showing that reducing the GI of diet improves glycemic
control (15, 16)
. A meta-analysis by Brand-Miller et al., which included 14 studies showed
that low-GI diets significantly reduced HbA1c by 0.43% , (the 95% confidence interval:
0.72 - 0.13) compared to a high-GI diets . This evidence is reinforced by a number of
large studies (116-118)
. In the last decade interest in the GI concept has exponentially
increased revealing further clinical utilities of the GI, beyond that of managing or
reducing the risk of developing diabetes (119)
, and that may be relevant to a wide range of
individuals. These include: weight maintenance (120)
and reducing the risk for CVD (10)
,
Stroke (121)
, metabolic syndrome (122)
, inflammation (18)
and a number of cancers (123, 124)
.
The GI is most commonly used to rank foods as low-GI (≤ 55), medium-GI (56-69) or
high-GI (≥70) to be utilized in clinical practices guiding the consumption of low-GI foods
more often (13)
. Indeed, there is evidence to suggest that low-GI diets have at least as
many, if not more, statistically significant health positive effects than there is for whole
grains and fibre (13, 16)
. Jenkins et al compared the effects of a low-GI diet on glycemic
control compared to a high-cereal fibre diet in 210 T2D individuals for 6 months and
found that the low-GI diet reduced HbA1c by − 0.50% ( 95% CI, − 0.61% to − 0.0.39%)
compared to the high-cereal fibre diet − 0.18% ( 95% CI, − 0.29% to − 0.07%) (P <
0.001); such reduction is considered clinically meaningful in the management of diabetic
individuals. Therefore, it appears that soluble and viscous fibre rich whole grains and the
GI share a synergistic effect and complement each other. Taken together, such effects
have promoted the interest in whole grains that are low-GI and rich source of viscous
fibre. Such low-GI foods have been suggested to hold a higher potential as satiety
inducing foods (54, 125)
33
2.5.5. Glycemic index and satiety
Satiety is defined as the state in which further eating is inhibited and occurs as a
response of having eaten (126)
. Low-GI diets have been promoted for weight loss and
maintenance due to a number of factors including their positive effects on glycemia and
satiety, which consequently may have a role in regulating appetite (17, 18, 127-130)
. This is
consistent in part with the glucostatic hypothesis postulated by Mayer (131)
60 years ago.
The low-GI satiety hypothesis stipulates that low-GI foods are absorbed slowly resulting
in a slowed gastric emptying, which then produces less variation in glycemic responses
and in turn could increase satiety and appetite regulation (128)
. However, this claim is in
contrast to evidence indicating that satiety is no longer influenced by glycemic responses
per se over 2 hours after eating (132)
. In addition there is further evidence showing early
satiating effect of high-GI CHO such as glucose in suppressing short term food intake 60-
90 min after the ingestion of a preload compared to a low GI food (133)
. Moreover, two
recent experimental studies found that low-GI test meals had no effect on satiety or food
intake (134, 135)
. On the other hand, Low-GI foods are generally also high in fibre, which
may play a role in its effects on appetite. In epidemiological studies, fibre have been
found to reduce weight gain over time and have favorable effects on glycemia (136)
and in
short-term experimental studies fibre has been found to increase satiety and reduce food
intake (137-139)
, but not all studies found an effect (126)
. For example, Mattes tested a
combination of functional fibre systems and found no effect of guar and alginate fibres in
a solid food matrix on appetite (140)
. This observation is thought to be due to the use of
extracted fibre and/or use of synthetic fibre.
Literature in this area is still inconclusive and warrants further research. As
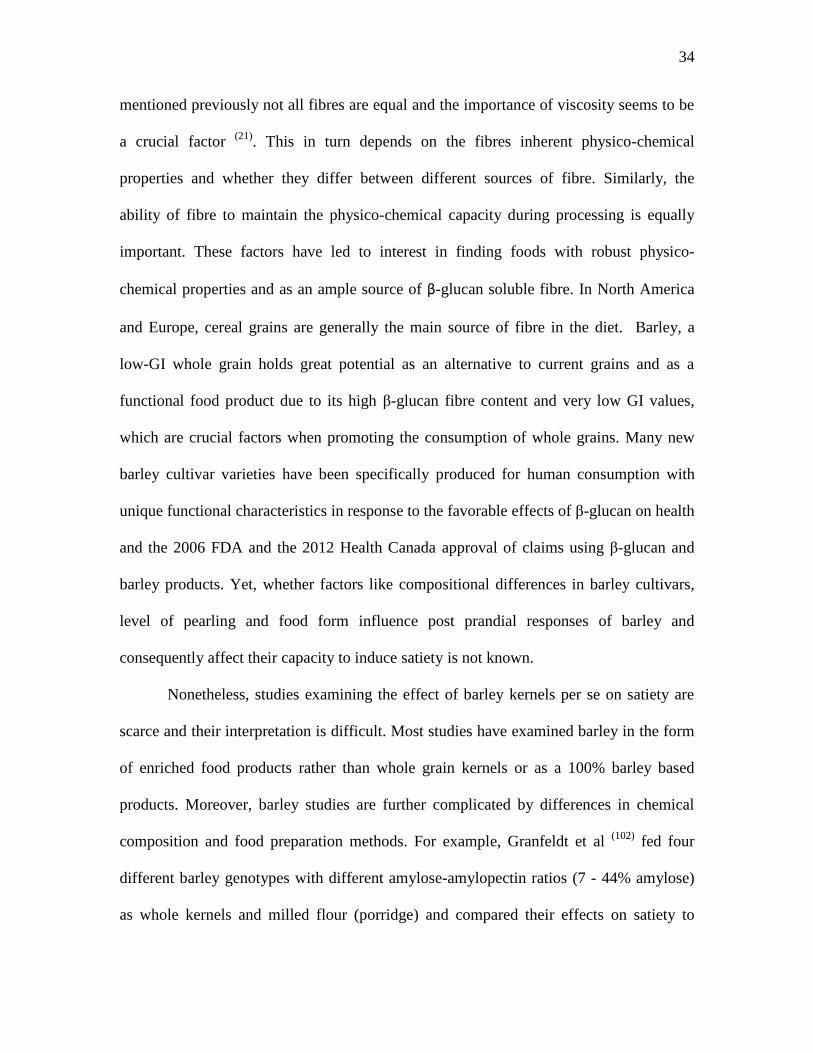
34
mentioned previously not all fibres are equal and the importance of viscosity seems to be
a crucial factor (21)
. This in turn depends on the fibres inherent physico-chemical
properties and whether they differ between different sources of fibre. Similarly, the
ability of fibre to maintain the physico-chemical capacity during processing is equally
important. These factors have led to interest in finding foods with robust physico-
chemical properties and as an ample source of β-glucan soluble fibre. In North America
and Europe, cereal grains are generally the main source of fibre in the diet. Barley, a
low-GI whole grain holds great potential as an alternative to current grains and as a
functional food product due to its high β-glucan fibre content and very low GI values,
which are crucial factors when promoting the consumption of whole grains. Many new
barley cultivar varieties have been specifically produced for human consumption with
unique functional characteristics in response to the favorable effects of β-glucan on health
and the 2006 FDA and the 2012 Health Canada approval of claims using β-glucan and
barley products. Yet, whether factors like compositional differences in barley cultivars,
level of pearling and food form influence post prandial responses of barley and
consequently affect their capacity to induce satiety is not known.
Nonetheless, studies examining the effect of barley kernels per se on satiety are
scarce and their interpretation is difficult. Most studies have examined barley in the form
of enriched food products rather than whole grain kernels or as a 100% barley based
products. Moreover, barley studies are further complicated by differences in chemical
composition and food preparation methods. For example, Granfeldt et al (102)
fed four
different barley genotypes with different amylose-amylopectin ratios (7 - 44% amylose)
as whole kernels and milled flour (porridge) and compared their effects on satiety to
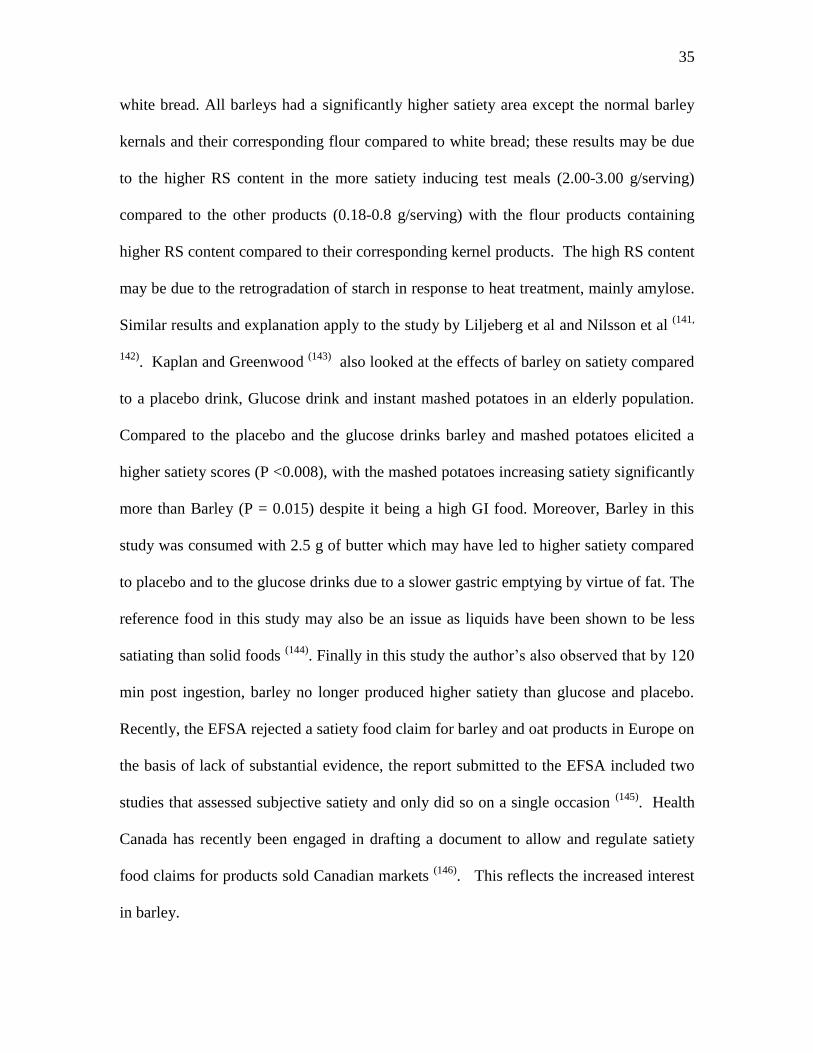
35
white bread. All barleys had a significantly higher satiety area except the normal barley
kernals and their corresponding flour compared to white bread; these results may be due
to the higher RS content in the more satiety inducing test meals (2.00-3.00 g/serving)
compared to the other products (0.18-0.8 g/serving) with the flour products containing
higher RS content compared to their corresponding kernel products. The high RS content
may be due to the retrogradation of starch in response to heat treatment, mainly amylose.
Similar results and explanation apply to the study by Liljeberg et al and Nilsson et al (141,
142). Kaplan and Greenwood
(143) also looked at the effects of barley on satiety compared
to a placebo drink, Glucose drink and instant mashed potatoes in an elderly population.
Compared to the placebo and the glucose drinks barley and mashed potatoes elicited a
higher satiety scores (P <0.008), with the mashed potatoes increasing satiety significantly
more than Barley (P = 0.015) despite it being a high GI food. Moreover, Barley in this
study was consumed with 2.5 g of butter which may have led to higher satiety compared
to placebo and to the glucose drinks due to a slower gastric emptying by virtue of fat. The
reference food in this study may also be an issue as liquids have been shown to be less
satiating than solid foods (144)
. Finally in this study the author’s also observed that by 120
min post ingestion, barley no longer produced higher satiety than glucose and placebo.
Recently, the EFSA rejected a satiety food claim for barley and oat products in Europe on
the basis of lack of substantial evidence, the report submitted to the EFSA included two
studies that assessed subjective satiety and only did so on a single occasion (145)
. Health
Canada has recently been engaged in drafting a document to allow and regulate satiety
food claims for products sold Canadian markets (146)
. This reflects the increased interest
in barley.

36
The increased interest in barley stems from 2 major reasons: (1) its demonstrated
health effects; (2) potential as replacement for many stable refined grains found in our
diets such as white bread and rice. The establishment of government regulated health
claims for barley reflects its heightened consumer demand. Despite the demonstrated
health effects of barley we still lack an understanding of the effects of chemical
differences and processing methods on the health benefits of barley. Factors such as the
compositional diversity in barley cultivars, solubility, viscosity, molecular weight (MW),
food form and cooking may influence the post prandial responses of barley products, alter
their GI and subsequently affect subjective satiety. There are gaps in our knowledge with
respect to the contributions of the physico-chemical properties to the positive effects of
whole grains on metabolic risk factors such as glycemia. Questions remain unanswered
regarding the contribution of the GI, fibre, physical structure to the positive effects of
barley and whether these effects are modified by any of the aforementioned factors.
In the next chapter, chapter 2, I will present my work examining the contribution of
chemical composition including starch composition and its nature (slowly digested starch
vs. rapidly digested starch), total fibre and β-glucan content, pearling and food form on
glycemia and the GI of different barley cultivars.
37
3. Research Questions
This thesis will attempt to answer the following questions:
5. What is the significance of differences in chemical composition, total fibre and β-
glucan content on glycemic response, GI and subjective satiety?
6. What is the effect of food form on glycemic response, GI and subjective satiety?
7. What is the magnitude and impact of processing and food form on the physico-
chemical properties of barley; is there a synergistic effect of the physico-chemical
properties?
8. What is the contribution of the physico-chemical properties with respect to
glycemia and the GI?
3.1 Objectives
• Primary Objective:
• Examine the effects of differences in barley cultivars and chemical
composition on glycemic response, GI and subjective satiety
• Examine the effects of differences in level of pearling on glycemic
response, GI and subjective satiety
• Examine the effects of changing the food form on glycemic response, GI
and subjective satiety
Chapters 4 and 5 will represent the three in vivo randomized clinical trials (RCT)
addressing the first three previously mentioned questions. Chapter 4 will assess the
contribution of chemical composition including starch composition and its nature (slowly
38
digested starch vs. rapidly digested starch), total fibre and β-glucan content, pearling and
food form on glycemia and the GI of barley. Chapter 5 will address the effects of
differences in chemical composition, pearling and food form on subjective satiety and the
satiety index score (SI). Chapter 6 will investigate the contribution of the physico-
chemical properties on glycemia and the GI; in particular, the impact of molecular
weight, viscosity, solubility and the bioactivity of β-glucan using an in vitro digestive
model. Chapter 7 will explore the significance and implications of this work and
synthesise chapters 4, 5 and 6. This will help identify determinates of the quality of
barley and barley food products and their impact on physiological health outcomes.
Ultimately, our intention is to use barley as a surrogate measure of how we classify whole
grains.
39
4. Barley Cultivar, Kernel Composition and Processing Affects the Glycemic Index
The following Chapter is a reproduction of a manuscript that has been published in the
Journal of Nutrition
Journal of Nutrition, September 2012,J Nutr 142(9), 1666-1671
40
4.1. Abstract
Barley has a low Glycemic Index (GI), but it is unknown whether its GI is affected by
variation in carbohydrate composition in different cultivars and by food-processing and
food-form. To examine the effect of these factors on GI, 9 barley cultivars varying in
amylose and β-glucan content, were studied in 3 experiments in separate groups of 10
healthy participants. Experiment 1: three barley cultivars underwent 2 levels of
processing: hull removal (wholegrain, WG) and bran, germ, and crease removal (white-
pearled, WP). GI varied by cultivar (CDC-Fibar, 26 ± 3 vs. AC-Parkhill, 35 ± 4, P <
0.05) and pearling (WG, 26 ± 4 vs. WP 35 ± 3, P < 0.05) with no cultivar×pearling
interaction. Experiment 2: the GI of 7 WG cultivars ranged from 21 ± 4 to 36 ± 8 (P =
0.09). Experiment 3: WG and WP AC-Parkhill and Celebrity cultivars were ground and
made into wet pasta. The GI of AC-Parkhill pasta, 69 ± 3, was similar to that of
Celebrity pasta, 64 ± 4 , but unlike Experiment 1, the GI of WP pasta, 61 ± 3, was less
than WG pasta, 72 ± 4 (P < 0.05). Pooled data from experiments 1 and 2 showed that GI
was correlated with total fiber (r = -0.75, P = 0.002) but not with measures of starch
characteristics. We conclude that the GI of barley is influenced by cultivar, processing
and food form, but is not predicted by its content of amylose or other starch
characteristics.
41
4.2. Introduction
The growing availability and intake of refined carbohydrates especially those with
high glycemic index (GI) combined with rise in the obesity epidemic have contributed to
a rise in cardio-metabolic disorders (10)
. The latest reports from international studies show
an un-abating upward trajectory in diabetes rates with 366 million people suffering from
diabetes in 2011 worldwide (94)
. Type 2 diabetes is characterized by insulin resistance
and reduced insulin secretion (119, 147)
. Therefore, food products that decrease plasma
glucose and insulin demands plausibly reduce the risk of type 2 diabetes (148)
. This has
renewed interest in wholegrain cereals with intact botanical structure that are slowly
digested and have a low-GI. The GI introduced 30 years ago, is a physiological indicator
that ranks carbohydrate rich foods based on their potential to raise blood glucose. By
replacing high-GI refined carbohydrates such as white rice or white bread with low-GI
wholegrain products such as barley, consumers can meet nutrition recommendations to
consume wholegrain foods daily and reduce diet GI, maneuvers which may slow the
progression of chronic diseases. However, the consumption of barley in North America is
very low, at least in part due to lack of availability of barley food products which are
convenient to purchase and prepare. Recently, many new barley cultivars have been
specifically produced for food use with unique functional characteristics that improve
their versatility for use as food products with enhanced health benefits such as high β-
glucan and slowly digested starch (SDS) barley. The genetic and compositional diversity
in barley cultivars and other factors such as the level of pearling, amylose-to-amylopectin
ratio, food form and cooking may influence post prandial responses of barley products
and alter their GI. It has been suggested that GI values do not necessarily indicate the

42
rate and extent of carbohydrate absorption, but rather are determined by the combined
effect of all the properties of the grain which influence the rate of entry and removal of
glucose from the blood stream (149)
. Elucidation of the role of carbohydrate quality in
health promotion requires a better understanding of how the physico-chemical
characteristics of food and processing methods such as pearling, a common commercial
process whereby the husk and outer layers of barley grains are removed by a friction and
abrasion process, relate to their physiological responses. This will also provide additional
insight to the concept of GI. Therefore, the objective of this study was to examine the
effects of pearling, barley cultivar, physico-chemical properties and food form on the GI
of 9 barley cultivars in healthy participants. This project was completed in 3 separate
experiments, the purpose of study 1 and 2 was to examine the effects of barley cultivar
and level of pearling (e.g. wholegrain, commercial pearled, pot pearled and white
pearled). In study 3 a novel in-house wet pasta-like product was manufactured from
100% barley flour to assess the effect of food form on the glycemic index.
4.3. Materials and Methods
All experiments were performed using protocols approved by the Research Ethics
Board at the University of Toronto. All participants provided written informed consent to
participate. A total of 3 experiments, each with a randomized design were performed in
separate groups of 10 healthy participants in the morning after a 10-12 h overnight fast.
Barley Samples
Nine Canadian barley cultivars were selected based on diversity in starch,
amylose and β-glucan content and also agronomic purposes. The selected barley cultivars

43
included 3 two-row, hulled, normal barleys (AC parkhill, Chief, GB 992027); 3 six-
rowed, hulled, normal barleys (AC Klink, Celebrity, OAC Kawathra); 1 two-row hull-
less, normal barley (AC Alberta); and 2 two-row, hull-less, waxy barley ( CDC Fibar,
CDC Rattan). Kernels from two-row barleys are generally larger and more uniform in
size than those from six-rowed barleys due to crowding of spikelet’s on the spike in the
latter. Hull-less barley are free-threshing or naked grains. Normal barley contains starch
with an amylose-to-amylopectin ratio of ≈ 1:3, whereas the starch in waxy barleys is
almost entirely amylopectin. Characteristics of a majority of the selected barley cultivars
and their grains were reported previously (150, 151)
. All cultivars were from Canadian
suppliers, the majority obtained from Cribit Seeds (West Montrose, ON, Canada). The
waxy cultivars were supplied by the University of Saskatchewan (Saskatoon, SK,
Canada). Samples were provided in 25 kg amounts and a 3 kg representative sample of
each cultivar was obtained from the original bags for this study. Barley kernels were
pearled in 100g batches for various times to achieve the desired level using an abrasive
mill (model TM05, Satake, Tokyo, Japan) (Supporting materials, Table 4). Only barley
fractions used in the current study are presented in Table 4, the entire fractions were
described in a previous study (82)
.
Carbohydrate Analysis
The results of carbohydrate analysis have been reported previously (82)
but are
included briefly here for comparison with in vivo glycemic responses. Barley wholegrain
and pearled fractions were ground for chemical analysis using a cyclone sample mill
(Udy, Fort Collins, CO) equipped with a 0.5-mm screen and stored at 4ºC prior to
analysis. Moisture and total starch were determined using AACC Approved Methods 44-

44
16 and 76-13, respectively (152)
. Glucose was measured using glucose oxidase/peroxidase
reagent and Carey 3C UV-visible spectrophotometer (Varian Techtron, Australia).
Amylose and amylopectin were measured using a commercially available method
(Megazyme, Wicklow, Ireland). Rapidly digestible starch (RDS), slowly digestible
starch (SDS), and rapidly available glucose (RAG) were determined according to Englyst
et al. Method (2)
. Resistant starch (RS) was determined using AACC Approved Method
32-40 and total, soluble, and insoluble dietary fiber using an enzymatic gravimetric
procedure AACC Approved Method 32-07 (152)
. The barley test meals were fed in
portions containing 50g available carbohydrate, which was defined as available starch
plus free sugars.
Experiment 1
The participants in experiment 1 were 6 women and 4 men aged 40.6 ± 2.7 y, with
BMI, 27.6 ± 1.2 kg/m². The objective was to determine the effect on GI of two extreme
levels of pearling in 3 cultivars of barley varying in amylose and β-glucan content. The
cultivars chosen for this experiment were AC Parkhill (high amylose, low β-glucan),
Celebrity (high amylose, medium β-glucan) and CDC Fibar (low amylose, high β-glucan)
(Table 1). The levels of pearling included wholegrain (WG) (only the husk was
removed) and white-pearled (WP) (all the bran and most of the germ and crease
removed).
Participants came to the laboratory between 07:30 and 09:45h on 9 separate
occasions after 10-12h overnight fasts. On each occasion, after being weighed and giving
a fasting blood sample, participants consumed a test meal containing 50g available
carbohydrate within 15min and further finger-prick blood samples were obtained at 15,
45
30, 45, 60, 90 and 120min after starting to eat. Participants chose to drink with the test
meal a cup of water, tea, or coffee with 30 mL of 2% milk and/or artificial sweetener if
desired. Type of drink chosen by subject stayed constant during the whole study. During
the course of the 2h test period, participants remained seated. Six of the test meals
consumed by each subject consisted of the 3 different cultivars of barley each pearled to 2
different levels (WG or WP); these were cooked as described below and fed in
randomized order. Participants also tested the reference food, white bread, 3 times (1st,
5th
and 9th
tests). White bread was baked in an automatic bread maker as previously
described (153)
.
Experiment 2
The participants in experiment 2 were 6 women and 4 men aged 46.6 ± 4.4 y with
BMI 26.4 ± 1.1 kg/m². The objective was to examine the effect on GI of 6 additional
barley cultivars and of two additional intermediate pearling levels. Seven barley cultivars
were included (Tables 1 and 2); 6 were studied only in the WG state, while 1 cultivar
(Celebrity) was pearled to reproduce four fractions: WG, commercial pearled (CP) (some
bran and germ were also removed), pot pearled (PP) (all bran and most of the germ
removed) and WP. Participants were, therefore, studied on 13 occasions; they consumed
10 different barley test meals in randomized order and white bread 3 times using the same
procedures as described for experiment 1.
Experiment 3
The participants in experiment 3 were 8 women and 2 men aged 40.5 ± 4.7y with
BMI 28.3 ± 2.0 kg/m2. The objective was to determine the effect on GI of making pasta
from barley flour, using barley cultivars shown in experiments 1 and 2 to have different
46
GI values (AC Parkhill and Celebrity) each pearled to different levels (WG and WP).
Barley samples were milled into flour using an analytical mill (A-10, Tekmar, Cincinnati,
OH) and made into a wet pasta-like product using 100% barley flour from each cultivar.
Barley flour (100 g) was mixed with water (60-70 mL) to form a paste which was
extruded using a pasta maker (PastaMatic® MX700, Treviso, Italy). As a control, wet
durum semolina pasta (100 g) mixed with water (35 mL) was manufactured under the
same conditions using commercial durum semolina (Robin Hood®, Cargill, Incorporated,
Minneapolis, MN). All products were analyzed for dry matter (DM) and wet and dry loss.
Salt (1g), xanthan (1g) and 85µL of annato solution (2.8%) were added per 100g barley
flour to improve flavor, texture and color, respectively, and overall appearance. After
extruding the pasta, products were refrigerated overnight at 4 C° before being cooked on
the next morning.
Cooking Procedures
Based on the in vitro carbohydrate analysis, samples of each barley cultivar were
cooked in portions that provide 50 g available carbohydrate (Supporting Materials, Table
5). Single portions of barley grains were rinsed with cold water, added to boiling salted
water (1:5 ratio barley: water, w/v), covered and boiled for 25 min (WG and CP
fractions) or 30 min (PP and WP fractions), and allowed to sit at room temperature for 10
min prior to being served to the participants . Pasta was cooked in boiling water for 5 min
for the barley products and 20 min for the semolina product to obtain aldente (firm to the
bite) texture. A ratio of 1:8 pasta: water, w/v, was used to minimize losses of nutrients
due to cooking in large amount of water.
47
Blood Glucose Analysis
Capillary blood samples were collected into flat-bottomed 5-mL plastic tubes with
a push cap containing a small amount of sodium fluoride and potassium oxalate as an
anticoagulant and preservative and stored at -20ºC prior to analysis of whole blood
glucose using an automatic analyzer (Model 2300 STAT, Yellow Springs Instruments,
WI).
Statistical Analysis
Results are expressed as means ±SEM. Statistical analysis was done using SAS
version 9.3. Incremental areas under the curve (iAUC), ignoring area below the baseline,
were calculated using the trapezoid rule as previously described (14). The iAUC for each
test meal was expressed as a percentage of the same subject's mean iAUC after white
bread, and the resulting values multiplied by 0.71 to convert to the glucose scale (i.e. the
GI of glucose = 100). The mean of these values was the GI of the food. Because
experiments 1 and 3 had a partly balanced factorial design with 2 factors for the barley
test meals (cultivar and level of pearling) but not for the control (white bread), the data
from experiments 1 and 2 were analyzed in 2 ways. To determine the significance of the
differences in glycemic response between the barley meals and white bread the GI and
iAUC values for all the test meals (including white bread) were analyzed using repeated
measures analysis of variance (ANOVA). To determine the effects of cultivar and
pearling in experiments 1 and 3 the mean iAUC and GI values of the barley test meals
(not including white bread controls) were subjected to repeated measures ANOVA to
determine the main effects of cultivar and level of pearling and the cultivar × pearling
interaction. Similarly, blood glucose concentrations at each time point were subjected to

48
repeated measures ANOVA in experiments 1 and 3. Since experiment 2 did not have a
factorial design, the iAUC and GI values for all test meals were analyzed using repeated
measures ANOVA. In all cases, after demonstration of significant heterogeneity by
ANOVA, differences between individual means was assessed using Tukey's test to adjust
for multiple comparisons. In experiment 1, one subject missed one test meal (Celebrity
WG) and the missing result was imputed using a procedure described by Snedecor and
Cochrane (154)
; to account for the imputed value in the statistical analysis, the error
degrees of freedom was reduced by 1. Pearson correlation analysis was used to identify
relationships between chemical composition and GI values of the barley products in
experiments 1 and 2 combined. The criterion used for statistical significance was 2-tailed
P < 0.05.
4.4. Results
Experiment 1
All 6 barley test meals elicited significantly lower glycemic responses than white
bread (P < 0.001) (Table 1 and Fig.1). When only the barley test meals were included in
the statistical analysis, there was a significant main effect of cultivar (P = 0.008) for
iAUC with the response of CDC Fibar being significantly less than that of AC-Parkhill.
Pearling tended to increase mean iAUC (P = 0.07). However, there were main effects of
both cultivar (P = 0.013) and pearling (P = 0.046) on GI; the GI of CDC Fibar was
significantly less than that of AC-Parkhill by 9 GI units and pearling (WP) increased GI
by 9 units compared to WG. There was no significant cultivar×pearling interaction for
either iAUC (P = 0.89) or GI (P = 0.87).
Experiment 2
49
All barley test meals elicited significantly lower glycemic responses than white
bread. The mean GI values of the barley cultivars processed as WG ranged from 21 to 36
but the differences among barley cultivars were not statistically significant (Table 2).
When the celebrity cultivar was subjected to progressively greater degrees of pearling,
from WG to CP, PP and WP, mean GI values were 21 ± 4, 25 ± 3, 22 ± 3 and 32 ± 6 (P =
0.09).
Experiment 3
The glycemic responses elicited by the barley pastas did not differ significantly
from those elicited by semolina pasta or white bread, and the response elicited by
semolina pasta was similar to that after white bread (Table 3 and Fig.2). When only the
barley test meals were included in the statistical analysis, there was no significant main
effect of cultivar for iAUC (P = 0.31) or GI (P = 0.29). In contrast to the results from
Experiment 1, pearling significantly decreased both the AUC (P = 0.016) and GI (P =
0.029) of barley pasta. There was no significant cultivar×pearling interaction for either
iAUC (P = 0.80) or GI (P = 0.81).
Correlation between GI values and barley composition
There was no significant correlation between the GI values of the barley kernels
tested in experiments 1 and 2 and either the amylose, RAG, RDS or RS contents of the
test meals (Fig.1). These correlations were not significant whether the results for pearled
barley were included or not. The relationship between GI and SDS was not significant
when only the WG test meals were included (r = -0.38, n = 9, P = 0.32), but approached
50
significance when the results for pearled barley were included (Fig.1). The only nutrient
in barley to correlate significantly with GI was total fiber, and the correlation was
significant whether the WP, PP and CP test meals were included (Figure 1) or not (r = -
0.81, n = 9, P = 0.008). The correlation between GI and β-glucan (r = -0.44, n = 14, P =
0.11) was not as good as that between GI and total fiber (r = -0.75, n = 14, P = 0.002).
4.5. Discussion
The results of these experiments suggest that processing, cultivar, chemical properties
and food form are all factors that impact the GI of barley. All of the 9 barley cultivars and
fractions were low GI (GI range: 21-41) (Tables 1 and 2). This is similar to values
reported previously (90, 155)
. In experiment 1 pearling resulted in a higher GI in all 3 of the
cultivars tested. In addition, the cultivars differed in GI with CDC Fibar having a lower
GI than AC-Parkhill. This is of interest because of all the barley cultivars tested CDC
Fibar contained the lowest amount of amylose and highest amount of β-glucan.
Amylose (unbranched -(1-4) linked molecules) and amylopectin (branched 1-4) and
1-6) linkages) are the two chief components of starch. Generally, normal barley
starch has a 3:1 ratio of amylopectin to amylose; while waxy starch consists almost
entirely of amylopectin. The normal barley cultivars examined in the study had
amylopectin: amylose ratio of 3.3:1-3.9:1 and starches in the waxy cultivars, CDC Fibar
and CDC rattan were composed of about 96-100% amylopectin. The branched structure
of amylopectin is more susceptible to hydrolysis than the nearly linear structure of
amylose which increases the rate of digestion (61)
. The amylose-to-amylopectin ratio
influences the rate of starch digestion and in turn dictates the concentration of RDS and
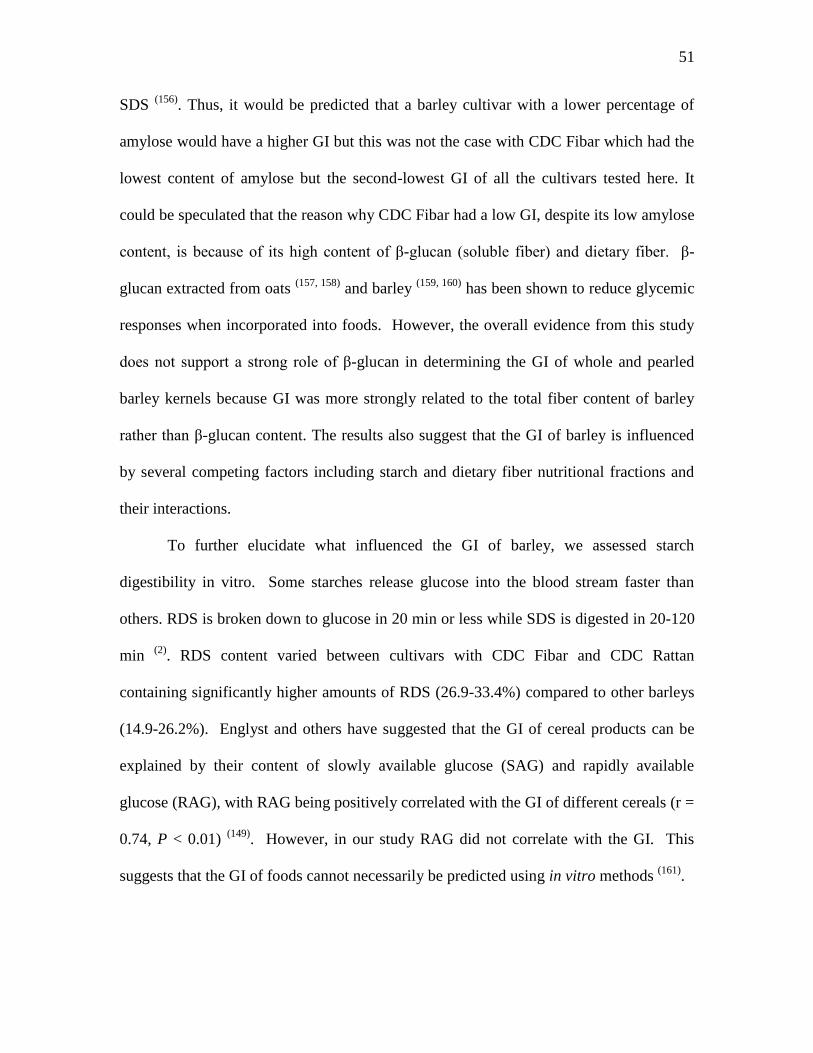
51
SDS (156)
. Thus, it would be predicted that a barley cultivar with a lower percentage of
amylose would have a higher GI but this was not the case with CDC Fibar which had the
lowest content of amylose but the second-lowest GI of all the cultivars tested here. It
could be speculated that the reason why CDC Fibar had a low GI, despite its low amylose
content, is because of its high content of β-glucan (soluble fiber) and dietary fiber. β-
glucan extracted from oats (157, 158)
and barley (159, 160)
has been shown to reduce glycemic
responses when incorporated into foods. However, the overall evidence from this study
does not support a strong role of β-glucan in determining the GI of whole and pearled
barley kernels because GI was more strongly related to the total fiber content of barley
rather than β-glucan content. The results also suggest that the GI of barley is influenced
by several competing factors including starch and dietary fiber nutritional fractions and
their interactions.
To further elucidate what influenced the GI of barley, we assessed starch
digestibility in vitro. Some starches release glucose into the blood stream faster than
others. RDS is broken down to glucose in 20 min or less while SDS is digested in 20-120
min (2)
. RDS content varied between cultivars with CDC Fibar and CDC Rattan
containing significantly higher amounts of RDS (26.9-33.4%) compared to other barleys
(14.9-26.2%). Englyst and others have suggested that the GI of cereal products can be
explained by their content of slowly available glucose (SAG) and rapidly available
glucose (RAG), with RAG being positively correlated with the GI of different cereals (r =
0.74, P < 0.01) (149)
. However, in our study RAG did not correlate with the GI. This
suggests that the GI of foods cannot necessarily be predicted using in vitro methods (161)
.

52
In barley the major form of RS is resistant starch type 1 (RS1), physically inaccessible
starch (66)
. Previous studies have shown a negative correlation between RS and the GI of
barley (162)
. However, in this study the RS content of all barley cultivars was low, ranging
from 0.11-0.49 g/serving. In addition, degree of pearling had a little impact on RS
content. On the other hand, total fiber was negatively correlated with the GI of the barley
cultivars (r = -0.81, n = 9, P = 0.008). Being high in dietary fiber is not necessarily an
essential prerequisite of a low-GI food; many common cereals with naturally occurring
levels of viscous fiber have a minimal impact on glycemia (102)
. Instead, dietary fiber as
part of an intact botanical structure, as in barley may be more significant. In this context
it is of interest that pearling reduced the total fiber content of barley to a greater extent
than that of the β-glucan. This suggests that the starch in the outer layers of barley
kernels which are removed by pearling is protected by fiber (not β-glucan) to a greater
extent and has a lower GI than the starch in the center of the barley kernels. This might
explain why white pearling, which removes 25-30% of the starch from barley, increases
the GI of barley.
In the current study RS was directly measured in barley products, and thus its
content is relatively small, and the summation of RDS, SDS and RS contents are lower
than total starch content (Supporting materials, Table 5). This discrepancy is due to
differences of how starch components were measured; a common practice among
researchers is to estimate RS by difference which is not as accurate as the direct
measurement of RS used in the current study.
The results of experiments 1 suggest that the matrix structure of barley is a more
important determinant of GI than its content of RDS, SDS, RS or β-glucan. This was

53
also shown by the results of experiment 3 in which disruption of the matrix structure of
barley by milling of wholegrain barley greatly increased the GI, despite the pasta
containing the same chemical constituents as the wholegrain barley. Our barley pastas
had unexpectedly relatively high GI values since pasta is considered to have a low GI.
However, we believe our pasta had a high GI because we produced wet or fresh pastas,
whereas pasta is usually available as dry pasta. The drying process could harden the
matrix structure and make it less accessible to enzymes, and also inactivate indigenous β-
glucan degrading enzymes, while wet pasta is more readily available or accessible to
indigenous and external enzymes. This was supported by the high GI of the control wet
pasta made from semolina flour compared with dry semolina pasta (GI ≈ 41) (90)
. It is of
interest that pasta made from pearled barley had a lower GI than wholegrain barley pasta,
whereas pearling increased the GI of intact barley kernels. We speculate that this may be
because there were more particles of insoluble fiber in the wholegrain pasta which gave it
a weaker structure and thus more readily able to break apart and be digested.
In the latest 2010 U.S. dietary Guidelines eating wholegrain foods was
encouraged. Although we agree with this advice because whole grains contain high
levels of important nutrients such as dietary fiber and magnesium, the results of this study
are consistent with those of previous studies which suggest that whole grains, that can be
processed into a variety of different forms, do not necessarily have a low GI . Therefore,
there is a need for improved methods of how whole grains are classified. Selecting a low
GI barley cultivar can help not only blunt high postprandial blood glucose levels but also
reduce the overall glycemic load of a meal, a dietary maneuver that could produce
enhanced public health benefits.

54
We did not measure insulin responses in this study because the added expense
would have limited the number of different cultivars and processing methods we could
have tested. In addition, previous studies have shown that barley food products with a
low GI also elicit low insulin responses (102)
. Although we only studied normal subjects,
the values may apply to other populations because previous studies suggest that the GI
values of starchy foods are similar in normal, hyperinsulinemic and diabetic subjects (163)
.
In conclusion this study showed that barley cultivar, chemical composition, processing
and food form are all significant factors that influence the physico-chemical characteristic
of barley and in turn alter the GI. The chemical composition and processing appear to
have the biggest impact on the quality of the carbohydrates which may be a determining
factor of variations in the GI values of cereal products.
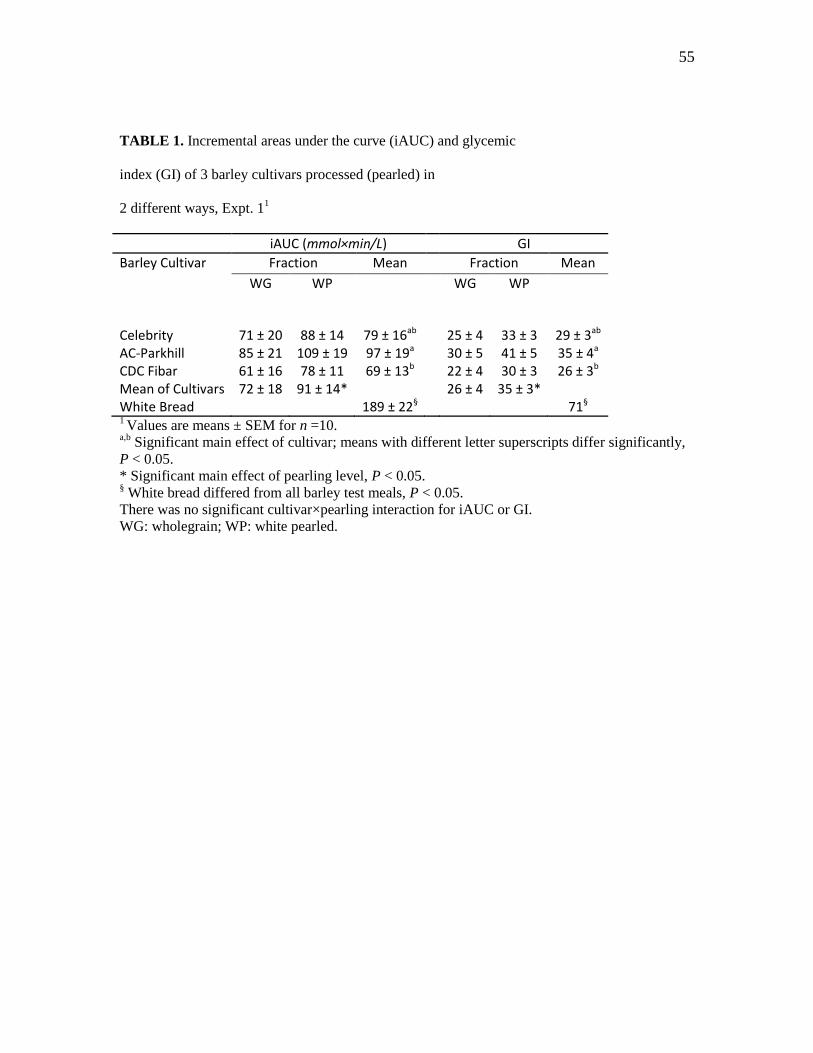
55
TABLE 1. Incremental areas under the curve (iAUC) and glycemic
index (GI) of 3 barley cultivars processed (pearled) in
2 different ways, Expt. 11
iAUC (mmol×min/L) GI
Barley Cultivar Fraction Mean Fraction Mean
WG WP WG WP
Celebrity 71 ± 20 88 ± 14 79 ± 16ab 25 ± 4 33 ± 3 29 ± 3ab AC-Parkhill 85 ± 21 109 ± 19 97 ± 19a 30 ± 5 41 ± 5 35 ± 4a CDC Fibar 61 ± 16 78 ± 11 69 ± 13b 22 ± 4 30 ± 3 26 ± 3b Mean of Cultivars 72 ± 18 91 ± 14* 26 ± 4 35 ± 3* White Bread 189 ± 22§ 71§ 1 Values are means ± SEM for n =10.
a,b Significant main effect of cultivar; means with different letter superscripts differ significantly,
P < 0.05.
* Significant main effect of pearling level, P < 0.05. § White bread differed from all barley test meals, P < 0.05.
There was no significant cultivar×pearling interaction for iAUC or GI.
WG: wholegrain; WP: white pearled.
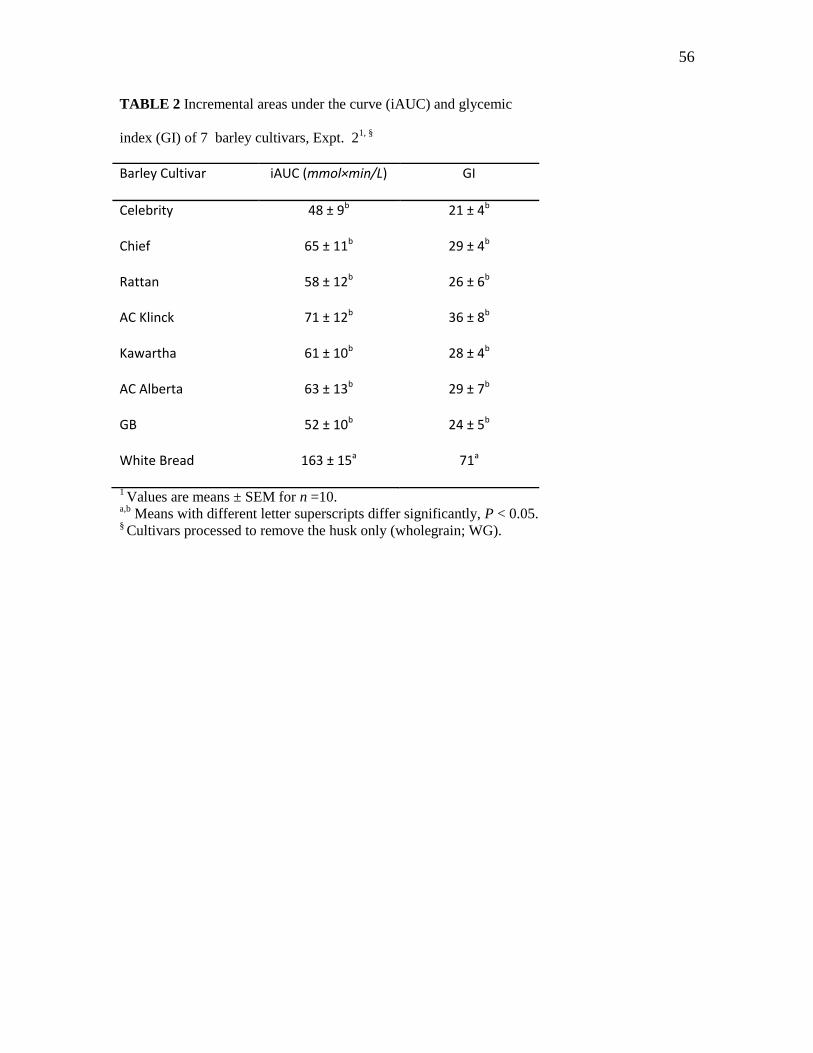
56
TABLE 2 Incremental areas under the curve (iAUC) and glycemic
index (GI) of 7 barley cultivars, Expt. 21, §
Barley Cultivar iAUC (mmol×min/L) GI
Celebrity 48 ± 9b 21 ± 4b
Chief 65 ± 11b 29 ± 4b
Rattan 58 ± 12b 26 ± 6b
AC Klinck 71 ± 12b 36 ± 8b
Kawartha 61 ± 10b 28 ± 4b
AC Alberta 63 ± 13b 29 ± 7b
GB 52 ± 10b 24 ± 5b
White Bread 163 ± 15a 71a
1 Values are means ± SEM for n =10.
a,b Means with different letter superscripts differ significantly, P < 0.05.
§ Cultivars processed to remove the husk only (wholegrain; WG).
57
TABLE 3 Incremental areas under the curve (iAUC) and glycemic index
(GI) of two fractions of pearled barley pasta and semolina pasta
, Expt. 31, §
iAUC (mmol×min/L) GI
Barley Cultivar Fraction Mean Fraction Mean
WG WP WG WP
Celebrity pasta 137 ± 17 115 ± 17 126 ± 14 71 ± 6 58 ± 4 64 ± 4
AC-Parkhill pasta 141 ± 17 127 ± 12 133 ± 13 73 ± 7 64 ± 4 69 ± 3
Mean of Cultivars 139 ± 14 121 ± 13* 72 ± 4 61 ± 3*
Semolina pasta 151 ± 20 78 ± 8
White Bread 142 ± 16 71
1 Values are means ± SEM for n = 10.
* Significant main effect of pearling level, P < 0.05.
There was no significant main effect of cultivar and no significant cultivar×pearling interaction
for iAUC or GI.
WG: wholegrain; WP: white pearled. § Pasta made from 2 barley cultivars pearled in 2 different ways and semolina pasta as a control.
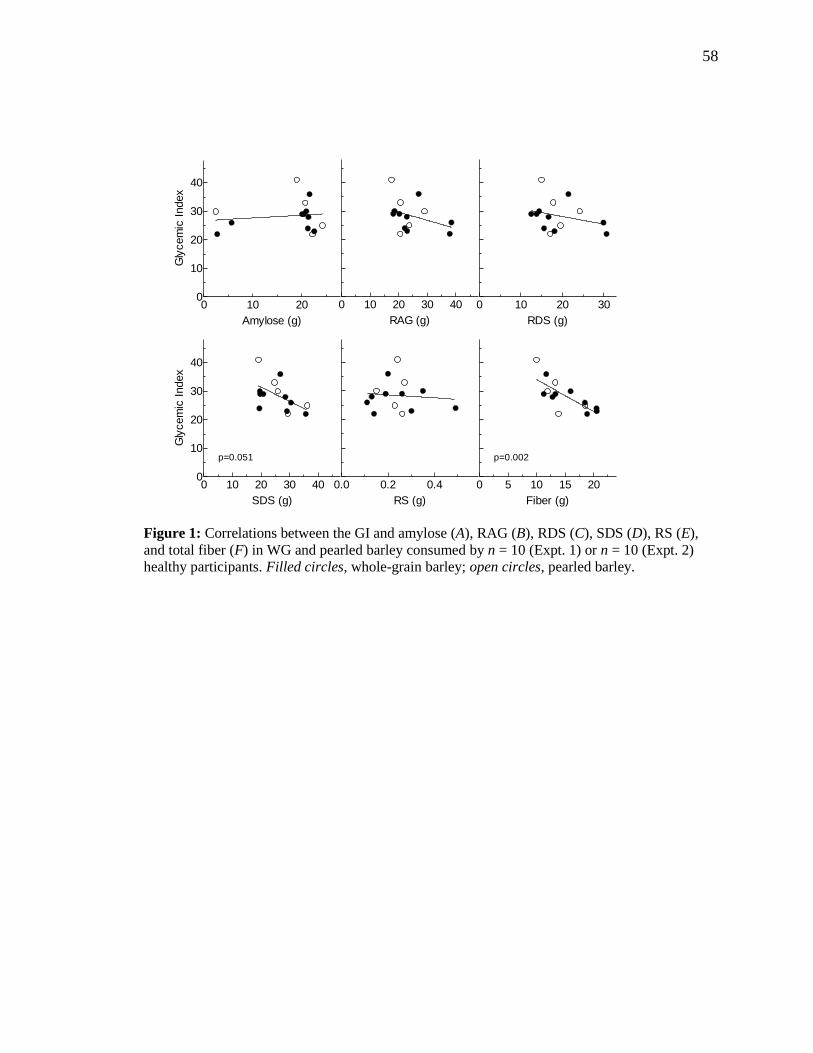
58
Amylose (g)
Gly
cem
ic I
ndex
0 10 200
10
20
30
40
RAG (g)
0 10 20 30 40
RDS (g)
0 10 20 30
SDS (g)
Gly
cem
ic I
ndex
0 10 20 30 400
10
20
30
40
p=0.051
RS (g)
0.0 0.2 0.4
Fiber (g)
0 5 10 15 20
p=0.002
Figure 1: Correlations between the GI and amylose (A), RAG (B), RDS (C), SDS (D), RS (E),
and total fiber (F) in WG and pearled barley consumed by n = 10 (Expt. 1) or n = 10 (Expt. 2)
healthy participants. Filled circles, whole-grain barley; open circles, pearled barley.
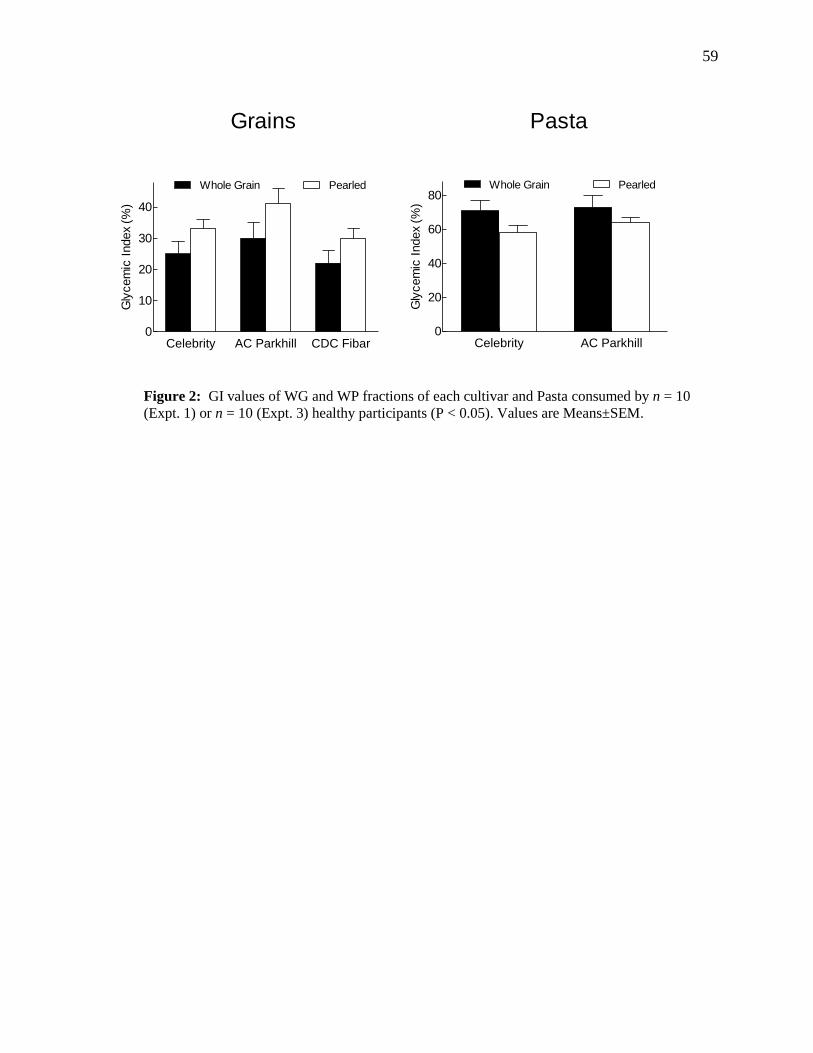
59
Gly
cem
ic I
ndex
(%)
Celebrity AC Parkhill CDC Fibar0
10
20
30
40
Whole Grain Pearled
Gly
cem
ic I
ndex
(%)
Celebrity AC Parkhill0
20
40
60
80Whole Grain Pearled
Grains Pasta
Figure 2: GI values of WG and WP fractions of each cultivar and Pasta consumed by n = 10
(Expt. 1) or n = 10 (Expt. 3) healthy participants (P < 0.05). Values are Means±SEM.
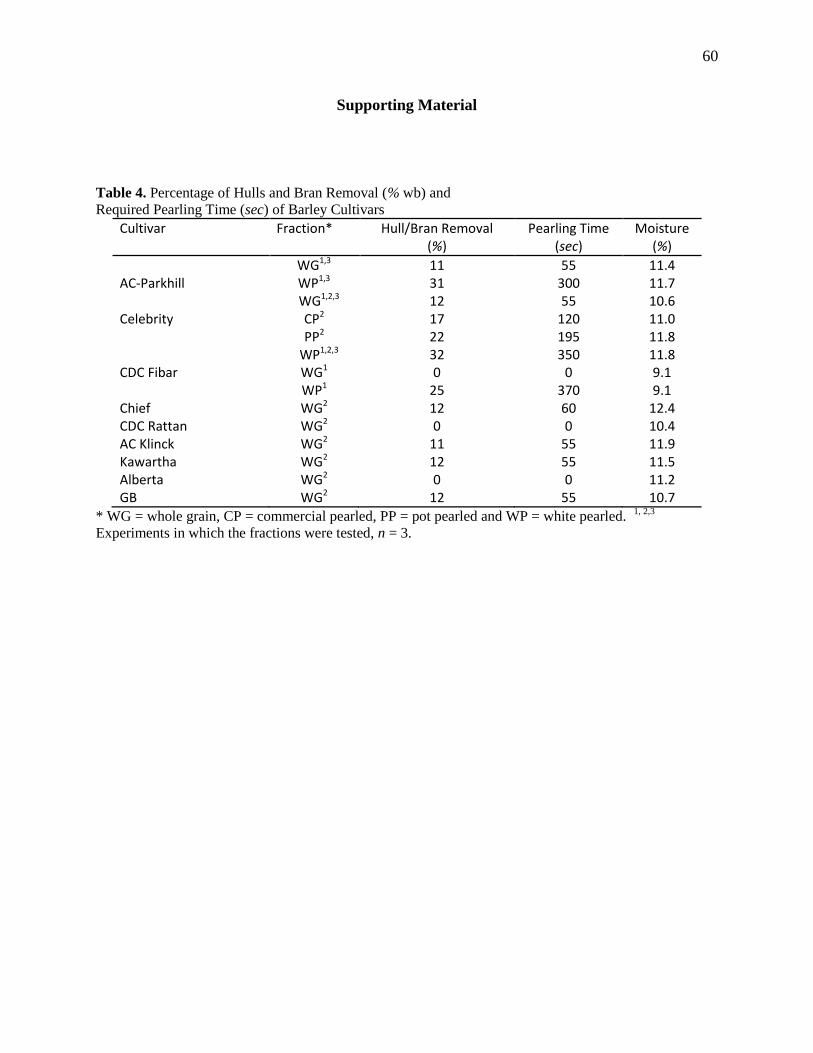
60
Supporting Material
Table 4. Percentage of Hulls and Bran Removal (% wb) and
Required Pearling Time (sec) of Barley Cultivars
Cultivar Fraction* Hull/Bran Removal (%)
Pearling Time (sec)
Moisture (%)
AC-Parkhill
WG1,3 11 55 11.4 WP1,3 31 300 11.7
Celebrity
WG1,2,3 12 55 10.6 CP2 17 120 11.0 PP2 22 195 11.8
WP1,2,3 32 350 11.8 CDC Fibar WG1 0 0 9.1
WP1 25 370 9.1 Chief WG2 12 60 12.4 CDC Rattan WG2 0 0 10.4 AC Klinck WG2 11 55 11.9 Kawartha WG2 12 55 11.5 Alberta WG2 0 0 11.2 GB WG2 12 55 10.7
* WG = whole grain, CP = commercial pearled, PP = pot pearled and WP = white pearled. 1, 2,3
Experiments in which the fractions were tested, n = 3.
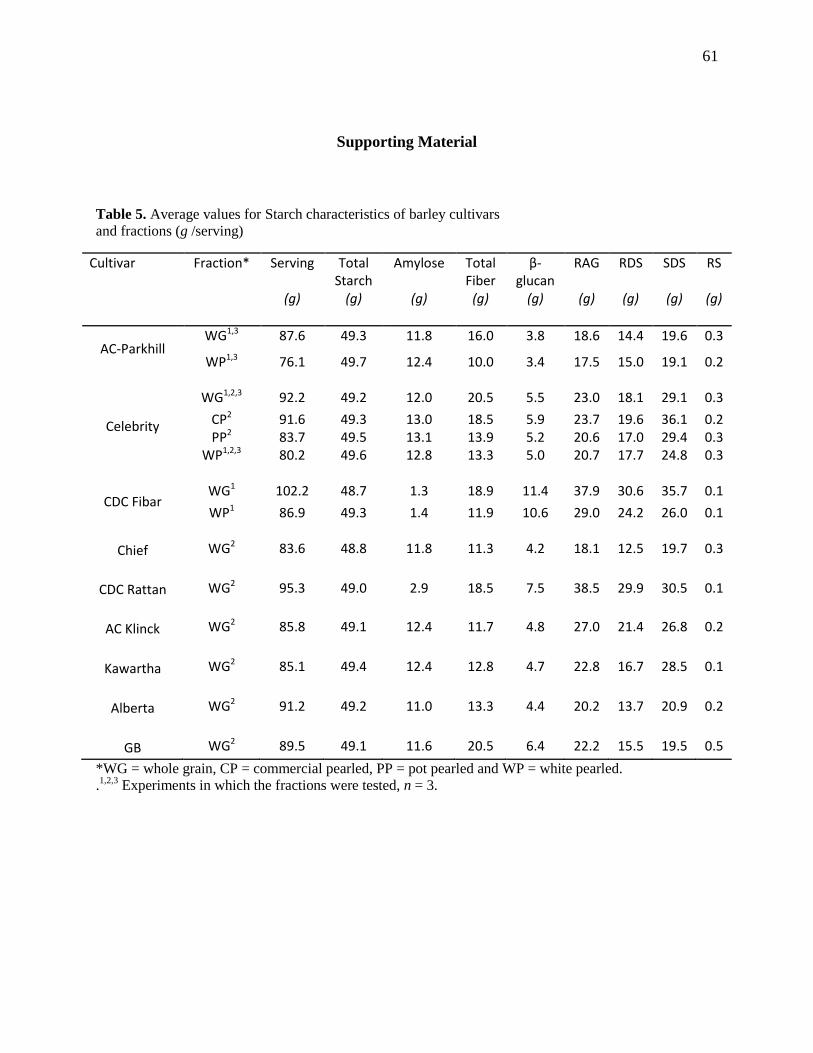
61
Supporting Material
Table 5. Average values for Starch characteristics of barley cultivars
and fractions (g /serving)
*WG = whole grain, CP = commercial pearled, PP = pot pearled and WP = white pearled.
.1,2,3
Experiments in which the fractions were tested, n = 3.
Cultivar Fraction* Serving
(g)
Total Starch
(g)
Amylose
(g)
Total Fiber
(g)
β-glucan
(g)
RAG
(g)
RDS
(g)
SDS
(g)
RS
(g)
AC-Parkhill WG1,3 87.6 49.3 11.8 16.0 3.8 18.6 14.4 19.6 0.3
WP1,3 76.1 49.7 12.4 10.0 3.4 17.5 15.0 19.1 0.2
Celebrity
WG1,2,3
92.2
49.2
12.0
20.5
5.5
23.0
18.1
29.1
0.3
CP2 91.6 49.3 13.0 18.5 5.9 23.7 19.6 36.1 0.2 PP2 83.7 49.5 13.1 13.9 5.2 20.6 17.0 29.4 0.3
WP1,2,3 80.2 49.6 12.8 13.3 5.0 20.7 17.7 24.8 0.3
CDC Fibar
WG1
102.2
48.7
1.3
18.9
11.4
37.9
30.6
35.7
0.1
WP1 86.9 49.3 1.4 11.9 10.6 29.0 24.2 26.0 0.1
Chief
WG2
83.6
48.8
11.8
11.3
4.2
18.1
12.5
19.7
0.3
CDC Rattan
WG2
95.3
49.0
2.9
18.5
7.5
38.5
29.9
30.5
0.1
AC Klinck
WG2
85.8
49.1
12.4
11.7
4.8
27.0
21.4
26.8
0.2
Kawartha
WG2
85.1
49.4
12.4
12.8
4.7
22.8
16.7
28.5
0.1
Alberta
WG2
91.2
49.2
11.0
13.3
4.4
20.2
13.7
20.9
0.2
GB
WG2
89.5
49.1
11.6
20.5
6.4
22.2
15.5
19.5
0.5
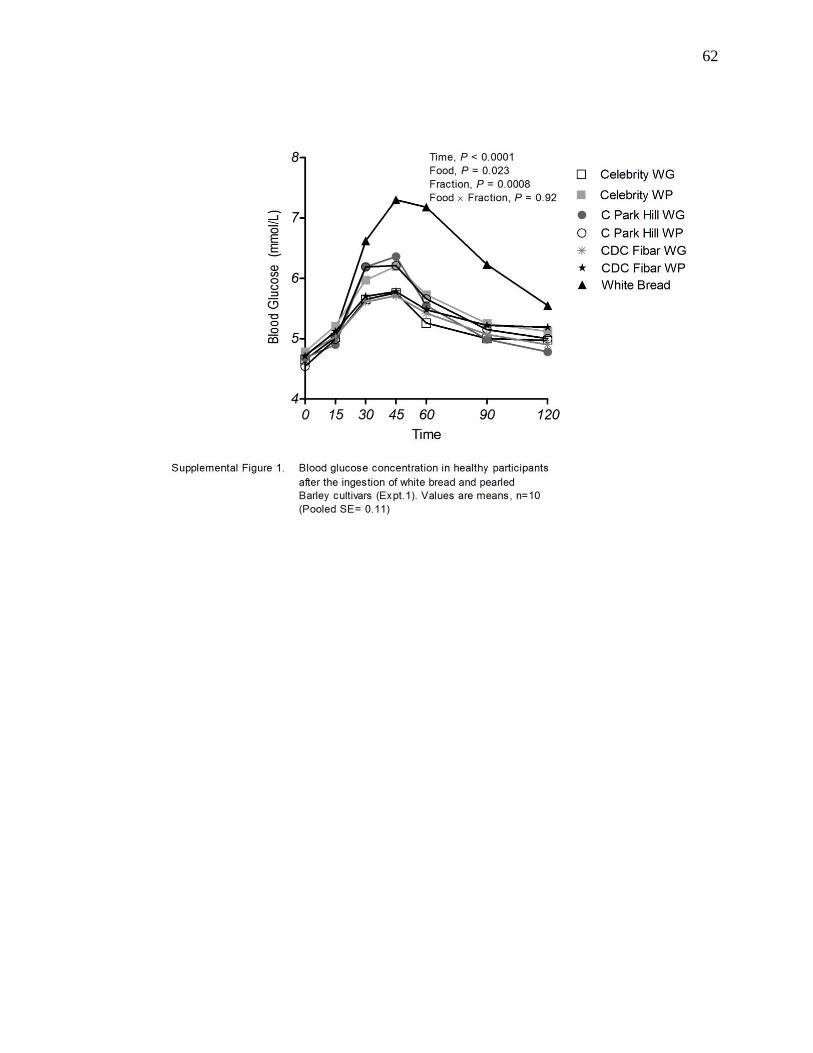
62
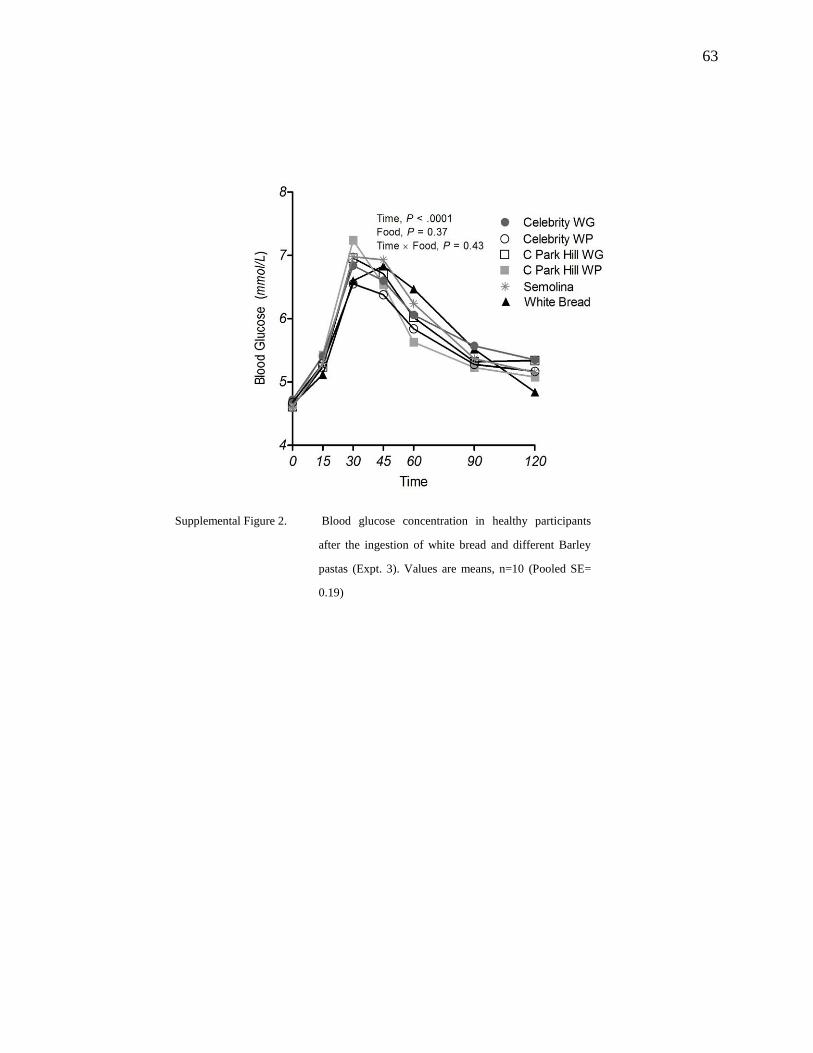
63
Supplemental Figure 2. Blood glucose concentration in healthy participants
after the ingestion of white bread and different Barley
pastas (Expt. 3). Values are means, n=10 (Pooled SE=
0.19)

64
5. Comparison of the effects of Chemical Composition, Processing
and Food Form on the Satiety of Barley
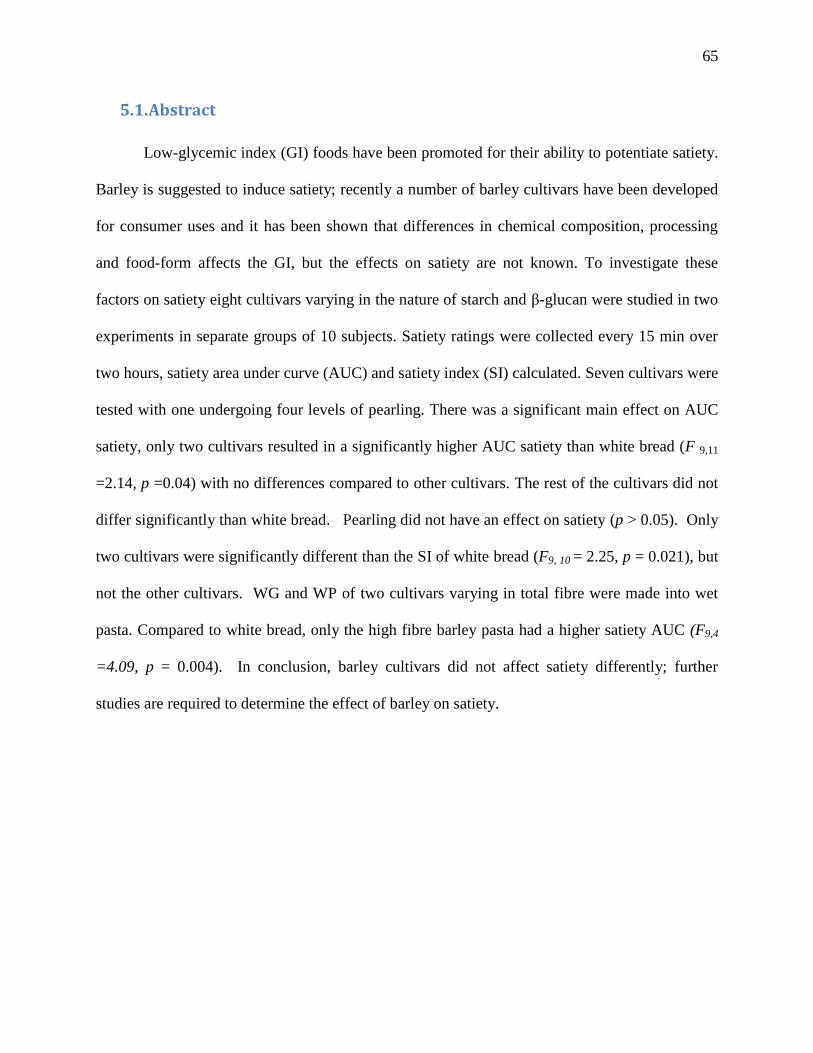
65
5.1. Abstract
Low-glycemic index (GI) foods have been promoted for their ability to potentiate satiety.
Barley is suggested to induce satiety; recently a number of barley cultivars have been developed
for consumer uses and it has been shown that differences in chemical composition, processing
and food-form affects the GI, but the effects on satiety are not known. To investigate these
factors on satiety eight cultivars varying in the nature of starch and β-glucan were studied in two
experiments in separate groups of 10 subjects. Satiety ratings were collected every 15 min over
two hours, satiety area under curve (AUC) and satiety index (SI) calculated. Seven cultivars were
tested with one undergoing four levels of pearling. There was a significant main effect on AUC
satiety, only two cultivars resulted in a significantly higher AUC satiety than white bread (F 9,11
=2.14, p =0.04) with no differences compared to other cultivars. The rest of the cultivars did not
differ significantly than white bread. Pearling did not have an effect on satiety (p > 0.05). Only
two cultivars were significantly different than the SI of white bread (F9, 10 = 2.25, p = 0.021), but
not the other cultivars. WG and WP of two cultivars varying in total fibre were made into wet
pasta. Compared to white bread, only the high fibre barley pasta had a higher satiety AUC (F9,4
=4.09, p = 0.004). In conclusion, barley cultivars did not affect satiety differently; further
studies are required to determine the effect of barley on satiety.

66
5.2. Introduction
Low-GI diets have been promoted for weight loss and maintenance due to their positive
effects on glycemia and on appetite regulation (18, 164, 165)
. This is consistent in part with the
glucostatic hypothesis postulated by Mayer almost 60 years ago (131)
. The low-GI and satiety
hypothesis stipulates that low-GI foods may potentially reduce gastric emptying and lead to a
slower absorption producing less variation in glycemic responses which in turn could increase
satiety and appetite regulation. However, data from another trial indicate that satiety is no longer
influenced by glycemic responses per se 2 hours after the termination of a meal (132)
. In addition
there is further evidence showing early satiating effect of high-GI CHO such as glucose in
suppressing short term food intake 60-90 min after the ingestion of a preload compared to a low
GI food (133)
. Moreover, two recent experimental studies found that low-GI test meals had no
effect on satiety or food intake (134, 135)
. On the other hand, low-GI foods are generally high in
fiber, which may play a role in appetite regulation (166)
. In epidemiological studies fiber has been
found to be associated with reduced weight gain over time and improved glycemia (136)
and in
short-term experimental studies fiber has been found to increase satiety and reduce food intake
(137-139). But not all studies found an effect; Mattes tested a combination of fiber systems and
found no effect of guar and alginate fibers in a solid food matrix on appetite (140)
. Literature in
this area is still inconclusive and warrants further research. Nevertheless, there is interest in
finding foods that are slowly digested and increase satiety as alternatives to common refined
carbohydrate (CHO) staples such as bread and rice. Such foods have been implicated with the
obesity epidemic (167)
. Barley, a low-GI whole grain holds great potential as an alternative to
current grains and as a functional food product due to its high β-glucan fiber content and low GI.
Many new barley cultivar varieties have been specifically produced for human consumption with
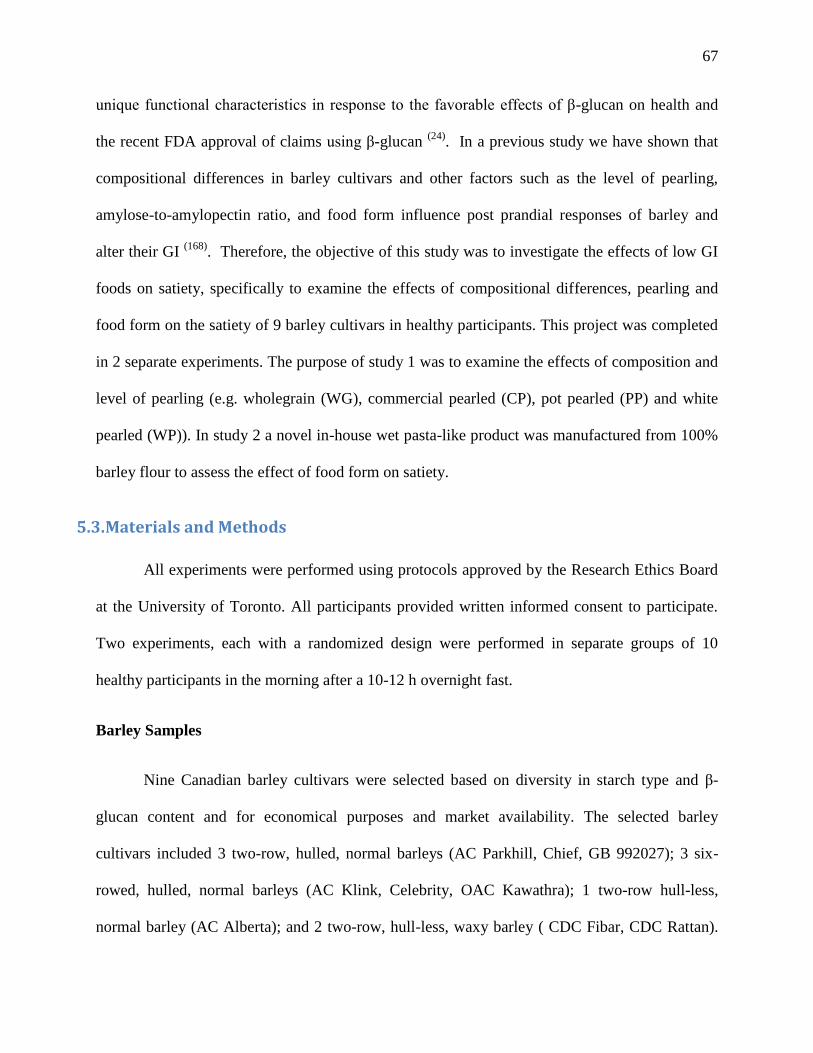
67
unique functional characteristics in response to the favorable effects of β-glucan on health and
the recent FDA approval of claims using β-glucan (24)
. In a previous study we have shown that
compositional differences in barley cultivars and other factors such as the level of pearling,
amylose-to-amylopectin ratio, and food form influence post prandial responses of barley and
alter their GI (168)
. Therefore, the objective of this study was to investigate the effects of low GI
foods on satiety, specifically to examine the effects of compositional differences, pearling and
food form on the satiety of 9 barley cultivars in healthy participants. This project was completed
in 2 separate experiments. The purpose of study 1 was to examine the effects of composition and
level of pearling (e.g. wholegrain (WG), commercial pearled (CP), pot pearled (PP) and white
pearled (WP)). In study 2 a novel in-house wet pasta-like product was manufactured from 100%
barley flour to assess the effect of food form on satiety.
5.3. Materials and Methods
All experiments were performed using protocols approved by the Research Ethics Board
at the University of Toronto. All participants provided written informed consent to participate.
Two experiments, each with a randomized design were performed in separate groups of 10
healthy participants in the morning after a 10-12 h overnight fast.
Barley Samples
Nine Canadian barley cultivars were selected based on diversity in starch type and β-
glucan content and for economical purposes and market availability. The selected barley
cultivars included 3 two-row, hulled, normal barleys (AC Parkhill, Chief, GB 992027); 3 six-
rowed, hulled, normal barleys (AC Klink, Celebrity, OAC Kawathra); 1 two-row hull-less,
normal barley (AC Alberta); and 2 two-row, hull-less, waxy barley ( CDC Fibar, CDC Rattan).
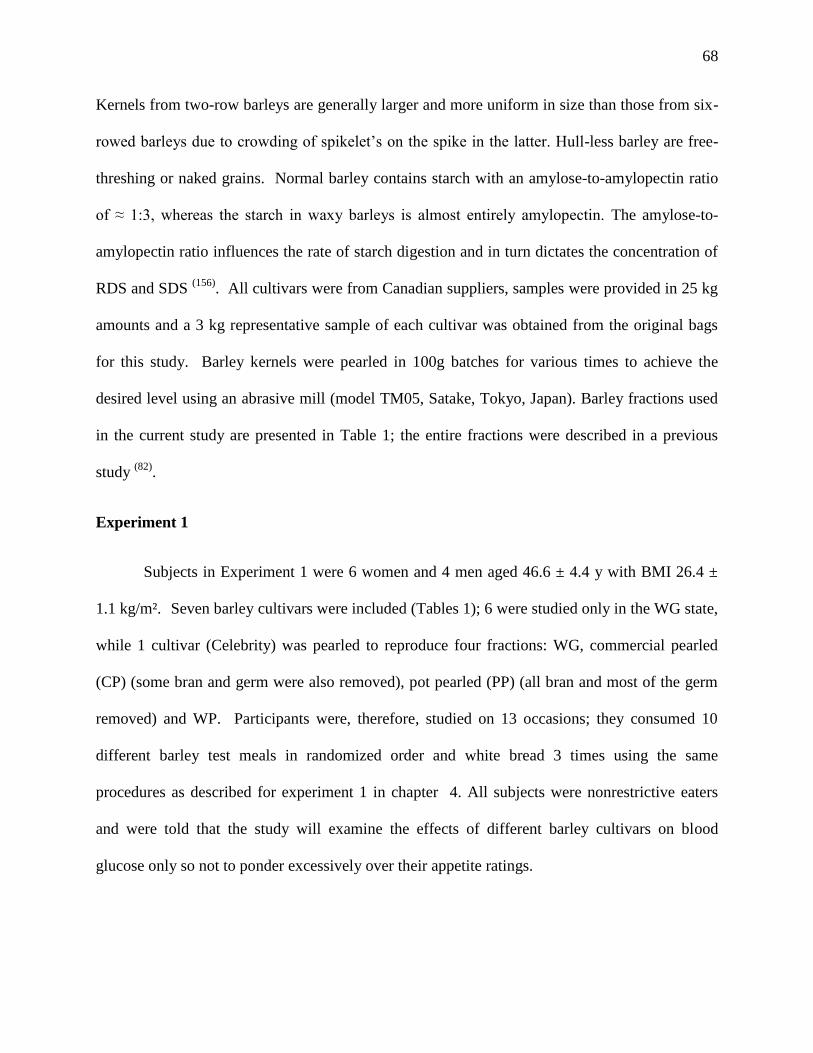
68
Kernels from two-row barleys are generally larger and more uniform in size than those from six-
rowed barleys due to crowding of spikelet’s on the spike in the latter. Hull-less barley are free-
threshing or naked grains. Normal barley contains starch with an amylose-to-amylopectin ratio
of ≈ 1:3, whereas the starch in waxy barleys is almost entirely amylopectin. The amylose-to-
amylopectin ratio influences the rate of starch digestion and in turn dictates the concentration of
RDS and SDS (156)
. All cultivars were from Canadian suppliers, samples were provided in 25 kg
amounts and a 3 kg representative sample of each cultivar was obtained from the original bags
for this study. Barley kernels were pearled in 100g batches for various times to achieve the
desired level using an abrasive mill (model TM05, Satake, Tokyo, Japan). Barley fractions used
in the current study are presented in Table 1; the entire fractions were described in a previous
study (82)
.
Experiment 1
Subjects in Experiment 1 were 6 women and 4 men aged 46.6 ± 4.4 y with BMI 26.4 ±
1.1 kg/m². Seven barley cultivars were included (Tables 1); 6 were studied only in the WG state,
while 1 cultivar (Celebrity) was pearled to reproduce four fractions: WG, commercial pearled
(CP) (some bran and germ were also removed), pot pearled (PP) (all bran and most of the germ
removed) and WP. Participants were, therefore, studied on 13 occasions; they consumed 10
different barley test meals in randomized order and white bread 3 times using the same
procedures as described for experiment 1 in chapter 4. All subjects were nonrestrictive eaters
and were told that the study will examine the effects of different barley cultivars on blood
glucose only so not to ponder excessively over their appetite ratings.

69
Experiment 2
8 women and 2 men aged 40.5 ± 4.7y with BMI 28.3 ± 2.0 kg/m2
were recruited for this
experiment. The objective was to determine the effect on satiety of making pasta from barley
flour, using barley cultivars known to have different GI values (AC Parkhill and Celebrity) each
pearled to different levels (WG and WP). Barley samples were milled into flour using an
analytical mill (A-10, Tekmar, Cincinnati, OH) and made into a wet pasta-like product using
100% barley flour from each cultivar. Barley flour (100 g) was mixed with water (60-70 mL) to
form a paste which was extruded using a pasta maker (PastaMatic® MX700, Treviso, Italy). As
a control, wet durum semolina pasta (100 g) mixed with water (35 mL) was manufactured under
the same conditions using commercial durum semolina (Robin Hood®, Cargill, Incorporated,
Minneapolis, MN). All products were analyzed for dry matter (DM) and wet and dry loss. Salt
(1g), xanthan (1g) and 85µL of annato solution (2.8%) were added per 100g barley flour to
improve flavor, texture and color, respectively, and overall appearance. After extruding the
pasta, products were refrigerated overnight at 4 C° before being cooked on the next morning.
Cooking Procedures
Based on the in vitro carbohydrate analysis, samples of each barley cultivar were cooked
in portions that provide 50 g available carbohydrate (Table 1). Single portions of barley grains
were rinsed with cold water, added to boiling salted water (1:5 ratio barley: water, w/v), covered
and boiled for 25 min (WG and CP fractions) or 30 min (PP and WP fractions), and allowed to
sit at room temperature for 10 min prior to being served to the participants . Pasta was cooked in
boiling water for 5 min for the barley products and 20 min for the semolina product to obtain
70
aldente (firm to the bite) texture. A ratio of 1:8 pasta: water, w/v, was used to minimize losses of
nutrients due to cooking in large amount of water.
Satiety Ratings
Subjective satiety was assessed immediately before each test meal and for 120 minutes after
using the tool described by Holt et al (182)
using an equilateral 7-point rating scale which
consisted of a 125 mm horizontal line anchored by 7 vertical ticks spaced equally from one end
to the other. Above the 7 vertical ticks were printed the following phrases from left to right:
‘extremely hungry’, ‘hungry’, semi hungry’, ‘no particular feeling’, semi satisfied’, ‘satisfied’
and ‘extremely full’. Subjects were asked to make a mark along the horizontal line indicating
their satiety at that moment. The 7 rating scales for each experiment were printed on one sheet of
paper; thus, while subjects were asked not to discuss their ratings with others, they were able to
see their own previous ratings for the current test. Subjective satiety was scored in mm from the
left end (extremely hungry) of the scale. Immediately after they finished eating, the subjects
recorded the time taken to eat the test meal and then they rated: how much they liked the test
meal. A satiety index score (SI) was calculated as described by Holt et al (185)
. Palatability was
rated on a 100 mm scale ranging from ‘very unpalatable’ to ‘very palatable’
Statistical Analysis
Results are expressed as means ± SEM. Statistical analysis was done using SAS version
9.3. Incremental areas under the satiety response curve (iAUC), ignoring area below the
baseline, were calculated using the trapezoid rule as previously described (111)
. Satiety index
scores (SI) were obtained by dividing the satiety AUC value for the test food by the mean of
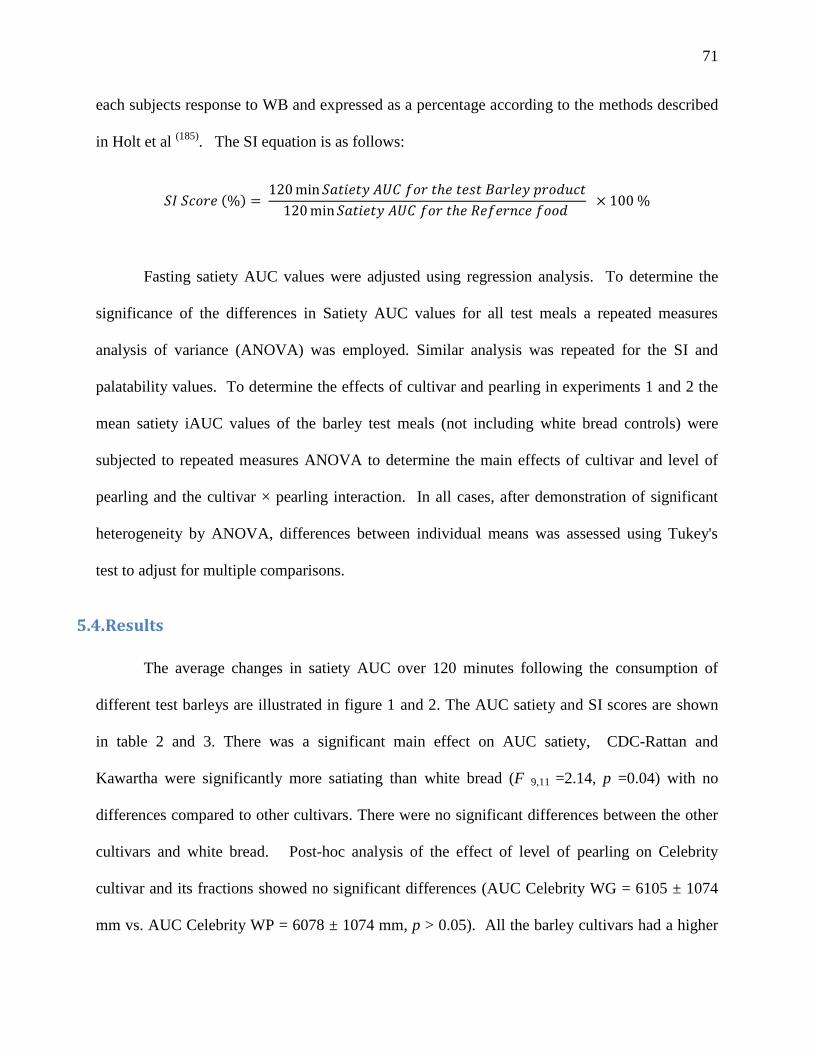
71
each subjects response to WB and expressed as a percentage according to the methods described
in Holt et al (185)
. The SI equation is as follows:
( )
Fasting satiety AUC values were adjusted using regression analysis. To determine the
significance of the differences in Satiety AUC values for all test meals a repeated measures
analysis of variance (ANOVA) was employed. Similar analysis was repeated for the SI and
palatability values. To determine the effects of cultivar and pearling in experiments 1 and 2 the
mean satiety iAUC values of the barley test meals (not including white bread controls) were
subjected to repeated measures ANOVA to determine the main effects of cultivar and level of
pearling and the cultivar × pearling interaction. In all cases, after demonstration of significant
heterogeneity by ANOVA, differences between individual means was assessed using Tukey's
test to adjust for multiple comparisons.
5.4. Results
The average changes in satiety AUC over 120 minutes following the consumption of
different test barleys are illustrated in figure 1 and 2. The AUC satiety and SI scores are shown
in table 2 and 3. There was a significant main effect on AUC satiety, CDC-Rattan and
Kawartha were significantly more satiating than white bread (F 9,11 =2.14, p =0.04) with no
differences compared to other cultivars. There were no significant differences between the other
cultivars and white bread. Post-hoc analysis of the effect of level of pearling on Celebrity
cultivar and its fractions showed no significant differences (AUC Celebrity WG = 6105 ± 1074
mm vs. AUC Celebrity WP = 6078 ± 1074 mm, p > 0.05). All the barley cultivars had a higher

72
SI compared to WB (range 133-175%) and only CDC-Rattan and Kawartha were significantly
different than the SI of white bread (F9, 10 = 2.25, p = 0.021).
In experiment 2 similar results were seen, there was a main effect of differences between
the treatments, compared to white bread both Celebrity and Semolina pasta had a higher AUC
(AUC WB = 5011 ± 875 mm vs. AUC Celebrity WG = 7118 ± 839 mm, F9,4 =4.09, p = 0.004);
AC-Park Hill pasta was not significantly differences than white bread or the other pastas ( Table
2). The Satiety index of Celebrity and Semolina pasta was also significantly different than that
of white bread but not AC-Park Hill pasta (F 9,5 = 3.26, p = 0.01).
In experiment 1 palatability ratings did not differ between cultivars or compared to white
bread. In experiment two, the WP celebrity pasta was significantly less palatable than its
respective WG fraction (p = 0.002). There were no differences between the other pastas
compared to semolina pasta or white bread. Palatability was not associated with satiety AUC in
both the cooked barley kernels (p = 0.99) and Barley Pasta (p = 0.75). There were no significant
correlations between satiety AUC, SI and either AUC of blood glucose (data not shown) or the
GI.
5.5. Discussion
These results offer estimates of visual and orosensory perceptions. These cues provide
important information to factors that contribute to appetite regulation. They suggest, at least as
measured by the instrument used, that cooked whole grain barley kernels and its pearled
fractions do not potentiate satiety differently than a high-GI food (white bread). Our data are in
agreement with previous reports that satiety and feelings of fullness are not part of the
mechanism by which low-GI foods regulate appetite or weight maintenance (134, 135)
. In

73
experiment one only two cultivars ( CDC-Rattan and Kawartha) were more satiating than the
reference food, white bread, but not compared to the other cultivars. This could be due to the fact
that the cultivars did not differ in their GI values and may potentiate satiety equally but in this
case it may be other factors that are involved in potentiating satiety such as food appearance and
food volume. Nonetheless, studies examining the effect of boiled barley kernels per se on
satiety are scarce and limited, where most studies have examined barley as a food component
rather than whole intact grain. Moreover, Barley studies are further complicated by differences in
chemical composition and food preparation methods. For example, Granfeldt et al (102)
fed four
different barley genotypes as whole kernels and milled flour (Porridge) and compared their effect
on satiety to white bread. All barley products produced a significantly higher satiety compared to
white bread. The results from that study are not consistent with ours; however, the discrepancy
could be explained by the differences in resistance starch (RS) content. In our study RS was
negligible ranging from 0.11 - 0.49 g/serving compared to 2.0 -3.0 g/serving in the Granfeldt et
al study. Similar results and explanation apply to Liljeberg et al (141)
and Nilsson et al (142)
.
Kaplan and Greenwood (143)
investigated the effects of barley on satiety compared to a placebo
drink, glucose drink and instant mashed potatoes in an elderly population. Compared to the
placebo and the glucose drinks barley and mashed potatoes elicited a higher satiety scores (P
<0.008), with the mashed potatoes increasing satiety significantly more than barley (P = 0.015)
despite it being a high GI food. Moreover, Barley in this study was consumed with 2.5 g of
butter which may have led to higher satiety compared to placebo and glucose drinks due to a
slower gastric emptying by virtue of fat. The reference food in that study may also be an issue as
liquids are known to be less satiating than solid foods (169, 170)
. Finally in Kaplan and Greenwood
study they observed that by 120 min post ingestion, barley no longer produced higher satiety

74
than glucose and placebo. However, our results are in line with studies examining barley
incorporated in different food products (171, 172)
.
In experiment two results were slightly different as there was a main effect on satiety
after the consumption of barley pasta made from the high-fibre cultivar (Celebrity). Pasta made
from the Celebrity cultivar was more satiating compared to white bread (P = 0.004). These
results are not surprising; food form and volume may have contributed to these effects. Barley
pasta had a larger volume and weight per serving (224 g) compared to the same cultivar in
Kernel form (92 g). These results are in line with studies that fed mixed meals with differing GI
indices to examine their effect on satiety. For example, Liu et al (135)
fed mixed meals differing in
GI and CHO content and found no differences in ratings of hunger, fullness or satiety between
the meals. Similar results and conclusion were also shown by Aston et al (134)
and Gelibter et al
(173). The notion that low-GI foods confer effects on satiety or appetite regulation stem partly
from the glucostatic theory. The theory postulates that appetite increases when the blood glucose
concentration falls. Wolever et al (132)
examined the effects of day to day variations in glycemic
responses after feeding different portions of white bread, there were significant differences in
satiety but these differences were not related to blood glucose concentrations. The barleys used
in this study had very low RS content which may be responsible for potentiating satiety in
previous studies. Nonetheless, all cultivars had very low GI values and were shown to elicit
lower glycemic responses compared to WB in previous studies (168)
. Objective measures of
satiety such as gut hormones and measures of energy intake would have provided valuable data
to this project. This study did not have statistical power or an adequate number of subjects to
measure satiety, nonetheless, it provide a valuable insight to the satiety index and its relationship
to the low-GI and satiety hypothesis. In conclusion, boiled barley kernels with similar GI values

75
do not have a significant effect on satiety that is beyond the effect of white bread - a high-GI
food. Barley pasta with higher total fibre content potentiate satiety more than the low fibre one
regardless of pearling indicating a potential interaction between food form and fibre content. Our
results do not support the hypothesis that low-GI foods increase satiety or have an effect on
appetite. Satiety index appears to have no associated with glycemic responses. Further studies
with are required to confirm the effect of barley on satiety.
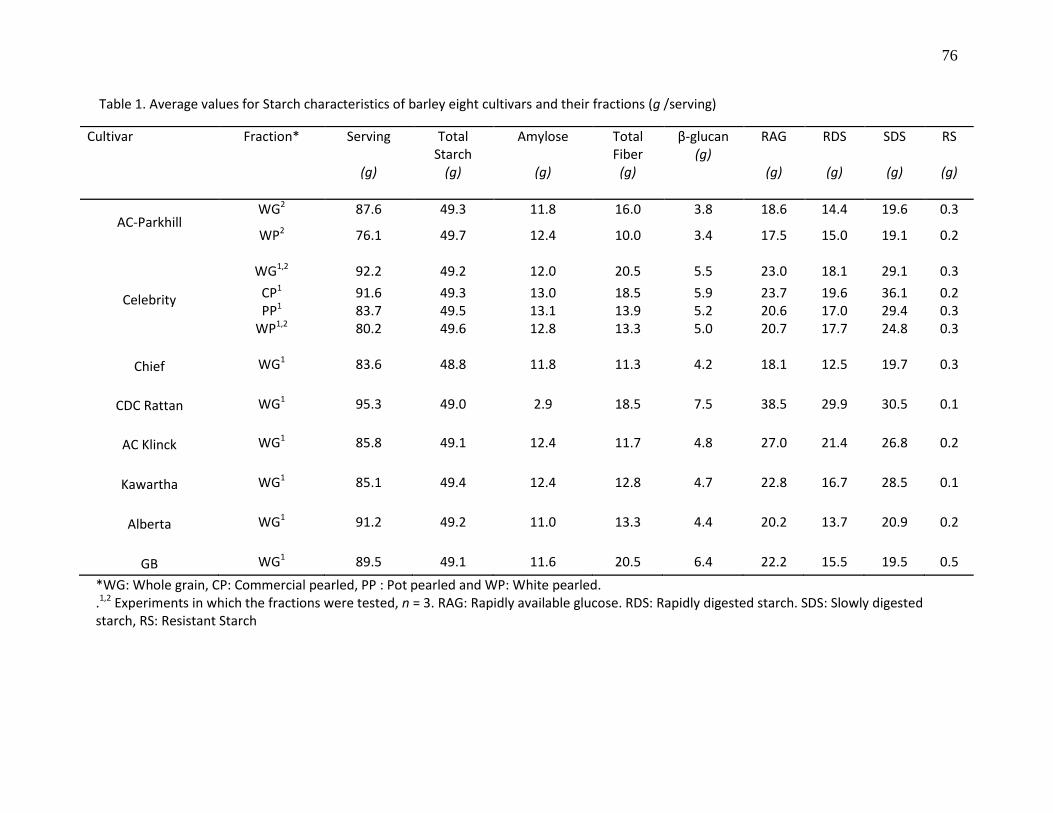
76
Table 1. Average values for Starch characteristics of barley eight cultivars and their fractions (g /serving)
*WG: Whole grain, CP: Commercial pearled, PP : Pot pearled and WP: White pearled. .1,2 Experiments in which the fractions were tested, n = 3. RAG: Rapidly available glucose. RDS: Rapidly digested starch. SDS: Slowly digested starch, RS: Resistant Starch
Cultivar Fraction* Serving
(g)
Total Starch
(g)
Amylose
(g)
Total Fiber
(g)
β-glucan (g)
RAG
(g)
RDS
(g)
SDS
(g)
RS
(g)
AC-Parkhill WG2 87.6 49.3 11.8 16.0 3.8 18.6 14.4 19.6 0.3
WP2 76.1 49.7 12.4 10.0 3.4 17.5 15.0 19.1 0.2
Celebrity
WG1,2
92.2
49.2
12.0
20.5
5.5
23.0
18.1
29.1
0.3
CP1 91.6 49.3 13.0 18.5 5.9 23.7 19.6 36.1 0.2 PP1 83.7 49.5 13.1 13.9 5.2 20.6 17.0 29.4 0.3
WP1,2 80.2 49.6 12.8 13.3 5.0 20.7 17.7 24.8 0.3
Chief
WG1
83.6
48.8
11.8
11.3
4.2
18.1
12.5
19.7
0.3
CDC Rattan
WG1
95.3
49.0
2.9
18.5
7.5
38.5
29.9
30.5
0.1
AC Klinck
WG1
85.8
49.1
12.4
11.7
4.8
27.0
21.4
26.8
0.2
Kawartha
WG1
85.1
49.4
12.4
12.8
4.7
22.8
16.7
28.5
0.1
Alberta
WG1
91.2
49.2
11.0
13.3
4.4
20.2
13.7
20.9
0.2
GB
WG1
89.5
49.1
11.6
20.5
6.4
22.2
15.5
19.5
0.5
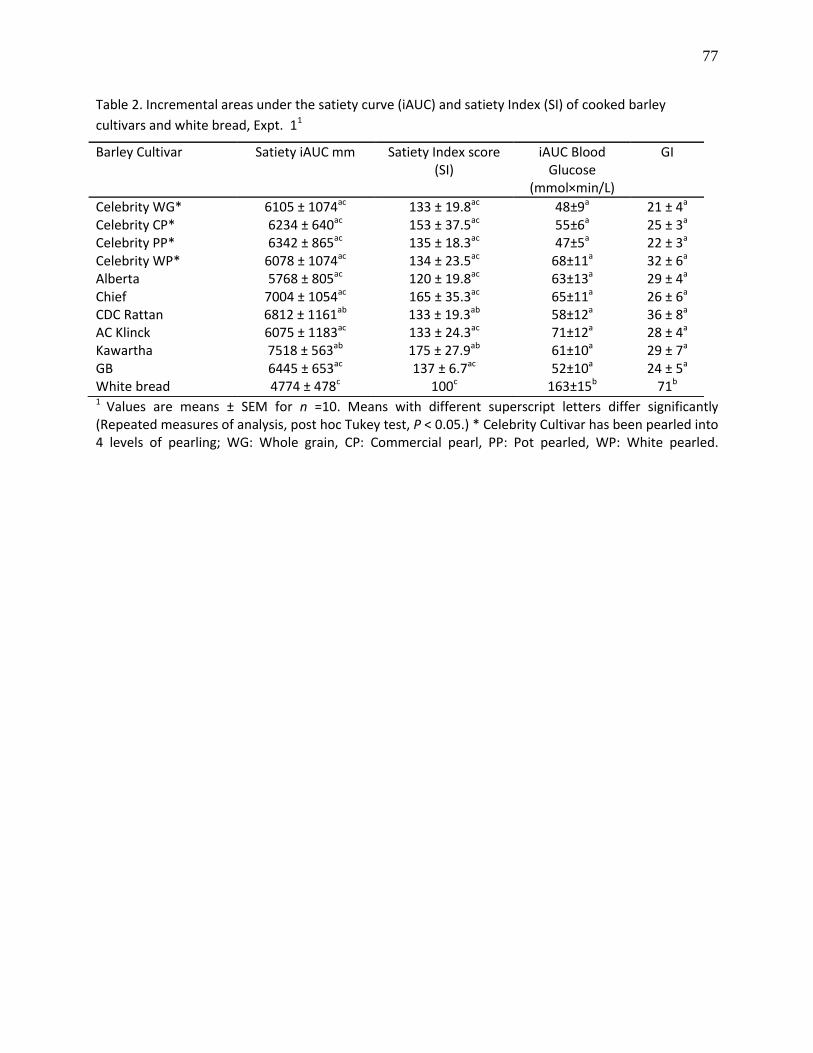
77
Table 2. Incremental areas under the satiety curve (iAUC) and satiety Index (SI) of cooked barley
cultivars and white bread, Expt. 11
1 Values are means ± SEM for n =10. Means with different superscript letters differ significantly (Repeated measures of analysis, post hoc Tukey test, P < 0.05.) * Celebrity Cultivar has been pearled into 4 levels of pearling; WG: Whole grain, CP: Commercial pearl, PP: Pot pearled, WP: White pearled.
Barley Cultivar Satiety iAUC mm Satiety Index score (SI)
iAUC Blood Glucose
(mmol×min/L)
GI
Celebrity WG* 6105 ± 1074ac 133 ± 19.8ac 48±9a 21 ± 4a
Celebrity CP* 6234 ± 640ac 153 ± 37.5ac 55±6a 25 ± 3a
Celebrity PP* 6342 ± 865ac 135 ± 18.3ac 47±5a 22 ± 3a
Celebrity WP* 6078 ± 1074ac 134 ± 23.5ac 68±11a 32 ± 6a
Alberta 5768 ± 805ac 120 ± 19.8ac 63±13a 29 ± 4a
Chief 7004 ± 1054ac 165 ± 35.3ac 65±11a 26 ± 6a
CDC Rattan 6812 ± 1161ab 133 ± 19.3ab 58±12a 36 ± 8a
AC Klinck 6075 ± 1183ac 133 ± 24.3ac 71±12a 28 ± 4a
Kawartha 7518 ± 563ab 175 ± 27.9ab 61±10a 29 ± 7a
GB 6445 ± 653ac 137 ± 6.7ac 52±10a 24 ± 5a
White bread 4774 ± 478c 100c 163±15b 71b
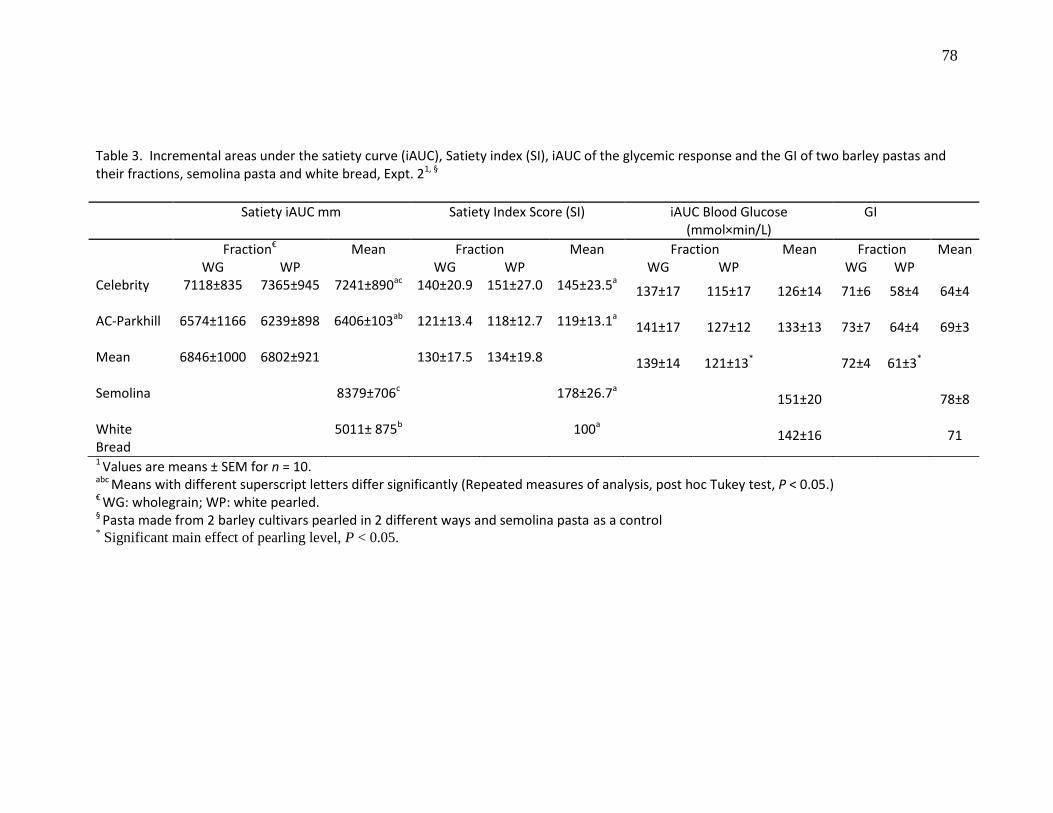
78
Table 3. Incremental areas under the satiety curve (iAUC), Satiety index (SI), iAUC of the glycemic response and the GI of two barley pastas and their fractions, semolina pasta and white bread, Expt. 21, §
1 Values are means ± SEM for n = 10. abc Means with different superscript letters differ significantly (Repeated measures of analysis, post hoc Tukey test, P < 0.05.) € WG: wholegrain; WP: white pearled. § Pasta made from 2 barley cultivars pearled in 2 different ways and semolina pasta as a control * Significant main effect of pearling level, P < 0.05.
Satiety iAUC mm Satiety Index Score (SI) iAUC Blood Glucose (mmol×min/L)
GI
Fraction€ Mean Fraction Mean Fraction Mean Fraction Mean WG WP WG WP WG WP WG WP
Celebrity 7118±835 7365±945 7241±890ac 140±20.9 151±27.0 145±23.5a
137±17 115±17 126±14 71±6 58±4 64±4
AC-Parkhill 6574±1166 6239±898 6406±103ab 121±13.4 118±12.7 119±13.1a
141±17 127±12 133±13 73±7 64±4 69±3
Mean 6846±1000 6802±921 130±17.5 134±19.8 139±14 121±13* 72±4 61±3*
Semolina 8379±706c 178±26.7a
151±20 78±8
White Bread
5011± 875b 100a
142±16 71
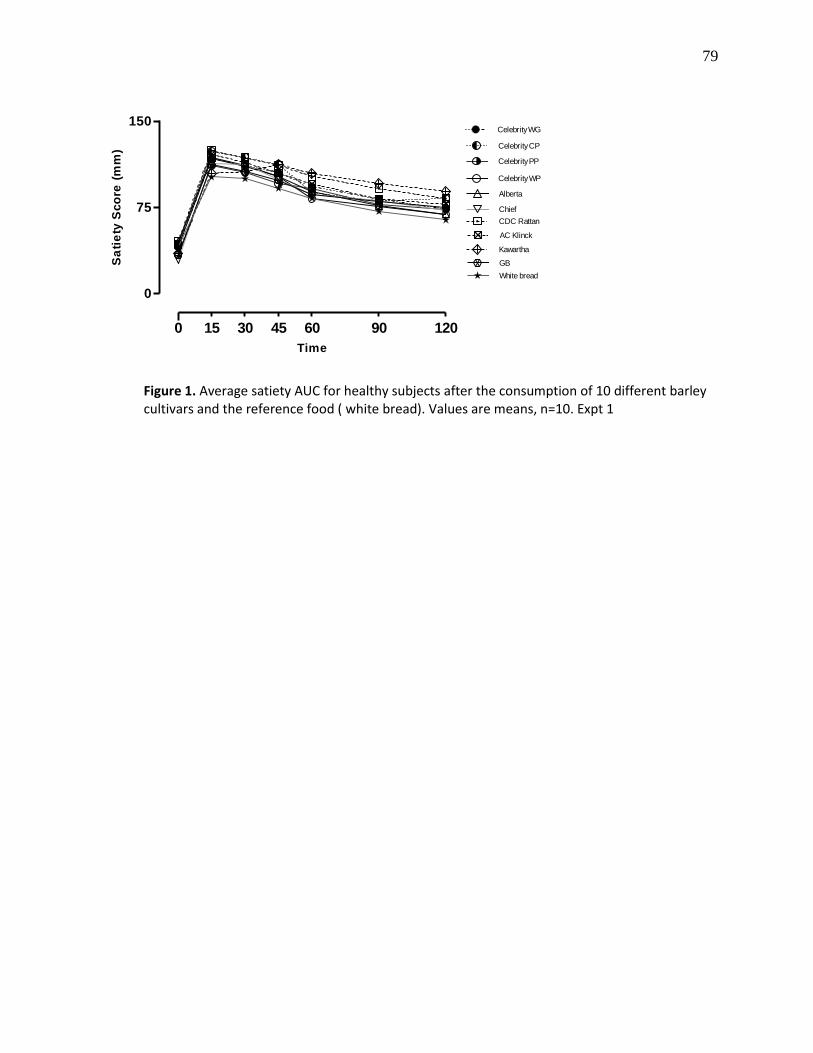
79
0
75
150Celebrity WG
Celebrity CP
Celebrity PP
Celebrity WP
Alberta
Chief
CDC Rattan
AC Klinck
Kawartha
GB
White bread
0 15 30 45 60 90 120
Time
Sa
tie
ty S
co
re (
mm
)
Figure 1. Average satiety AUC for healthy subjects after the consumption of 10 different barley cultivars and the reference food ( white bread). Values are means, n=10. Expt 1
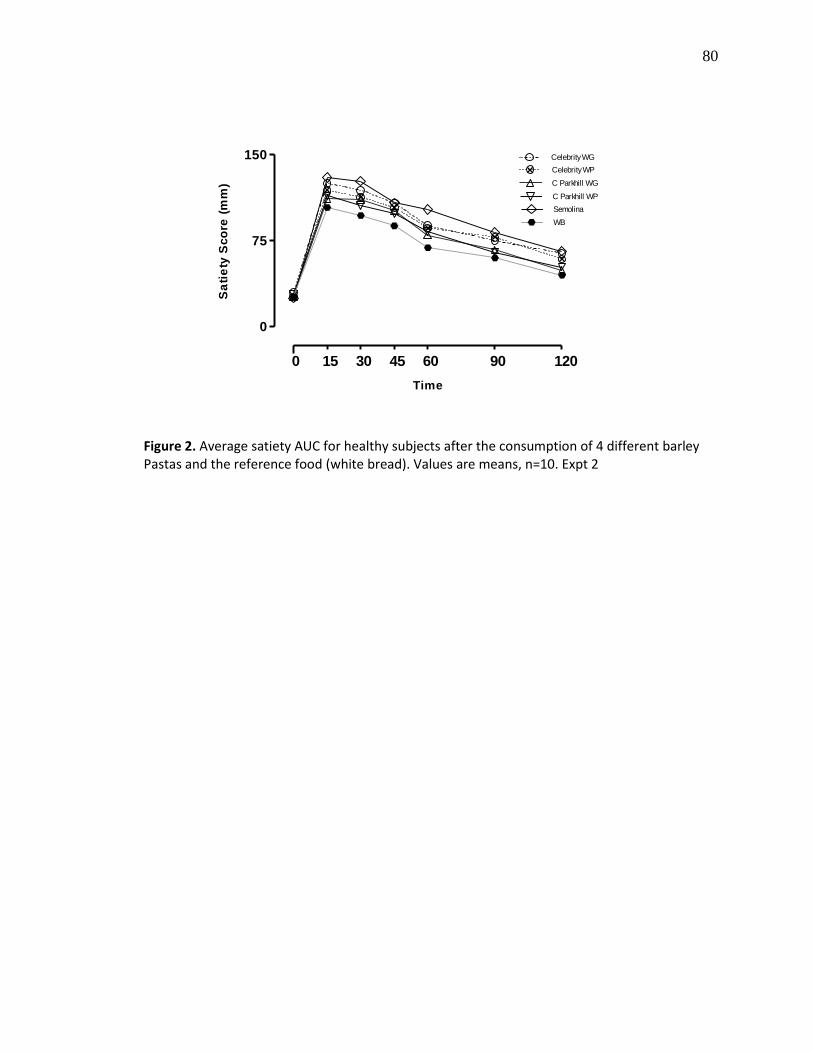
80
0
75
150 Celebrity WG
Celebrity WP
C Parkhill WG
C Parkhill WP
Semolina
WB
0 15 30 45 60 90 120
Time
Sa
tie
ty S
co
re (
mm
)
Figure 2. Average satiety AUC for healthy subjects after the consumption of 4 different barley Pastas and the reference food (white bread). Values are means, n=10. Expt 2

81
6. The Relationship between the Physico-Chemical Characteristics
of Barley and Postprandial Glycemia and the Glycemic Index
82
6.1. Abstract
Recently a number of governmental regulating agencies have approved food health claims
for barley. This has prompted the development of barley cultivars specifically for human
consumption. Differences in chemical composition, processing method and food-form affect
post-prandial glycemia and glycemic index (GI), but it is unknown whether this is related to
differences in physico-chemical properties. To investigate this, 3 cultivars varying in nature of
starch and β-glucan content, which have been tested previously in a clinical trial to determine
their GI, were analyzed to characterize their molecular weight (MW), solubility and β-glucan
viscosity in an in vitro digestive model. 12 cooked barley products were tested either in boiled
grain form (rice replacement) or a fresh pasta-like product and each cultivar was pearled into
either a whole grain or white pearled fraction. β -glucan content did not differ significantly
between kernels and pastas but MW, viscosity, β-glucan contribution to viscosity, and solubility
were significantly reduced in the fresh barley pasta products compared to the grains. Peak blood
glucose rise (PBGR) and the GI were correlated with log MW (PBGR, r = -0.83, P = 0.003, GI, r
= -0.72, P = 0.018) and log β-glucan viscosity (PBGR, r = -0.85, P = 0.002, GI, r = -0.80, P =
0.005). The GI of barley is inversely related to β-glucan viscosity which depends on its MW.
Pearling does not affect the physico-chemical characteristics significantly, but milling and
extruding barley grains to create fresh barley pasta resulted in a sharp reduction in MW and
viscosity.
83
6.2. Introduction
Barley has received abundant interest in the past decade not only as a functional food
ingredient but also as a whole grain substitute to current highly refined grains. This interest is
due in part to barley’s high content of the soluble fibre β-glucan. Several studies have shown that
the mixed linkage (13, 14)-β-D-glucan has the capacity to attenuate postprandial responses of
glucose, insulin and blood lipids in human subjects (28, 174)
. Most recent research suggests that it
may also have favorable effects on satiety inducing gut hormones (175)
. The physiological effects
of β-glucan on a number of postprandial markers have been mostly attributed to its ability to
increase viscosity in the digesta thereby modifying starch digestibility and retarding glucose
absorption (28)
. In view of that, various food and health organizations have approved health
claims for barley, the first of which was in the United States (24)
. More recently, Health Canada
(25) and the European Food Safety Authority (EFSA)
(176) have approved similar health claims for
barley. All of these health claims associate the consumption of barley β-glucan with a reduction
of cholesterol except for the EFSA claim which includes the maintenance of normal glycemia.
The magnitude of these physiological effects depends on β-glucan viscosity which in turn
depends on the physico-chemical properties of the β-glucan in food. This has been demonstrated
for β-glucan capacity to reduce serum cholesterol and low-density lipoprotein (LDL). Wolever
et al (72)
conducted a double blind parallel design randomized trial to determine the physiological
effectiveness of high-MW vs. medium and low-MW oat β-glucan cereal on lowering LDL
cholesterol in 345 hypercholesterolemic subjects. The results show that when subjects with high
LDL cholesterol consumed a breakfast meal containing a 3 g high or medium-MW oat β-glucan
cereal, LDL was lowered by 5% but the effect was reduced by 50% in subjects consuming a
breakfast meal with a low-MW oat β-glucan. This relationship has been established for foods

84
enriched with β-glucan, mainly from oat, such as muffins and ready-to-eat (RTE) cereals (75, 76,
158, 177) but surprisingly not for barley or for β-glucan in its naturally occurring state within the
intact kernel.
The consumption of barley grains as a rice substitute requires processing for a number of
reasons including: meeting consumer demand for a white bright grain colour, increasing the
palatability and/or producing fractions with high β-glucan. Yet, the effects of different levels of
pearling, a common commercial process whereby the husk and outer layers of barley grains are
removed by a friction and abrasion process, on barley physico-chemical properties have not been
comprehensively examined; in particular the association between the physico-chemical products
and postprandial responses. In RTE oat based cereals different methods of processing can be
employed to manipulate the physico-chemical properties including MW and viscosity. Tosh et al
(76) modified MW and solubility by extrusion cooking of oat bran RTE cereals. The authors
noted that reducing MW coincided with an apparent drop in viscosity in an in vitro digestion
model. We have previously shown that differences in chemical composition between cultivars,
pearling and changing the food form of barley kernels results in significantly different post
prandial blood glucose responses and alter the glycemic index (GI) significantly (168)
. Whether
these effects are due to changes in the physico-chemical properties are not known.
Barley β-glucan has not been extensively studied in comparison to oats and recently a
number of barley cultivars have been produced for human consumption. Data are limited when it
comes to characterising the physico-chemical properties of different barley cultivars. The effects
of processes like pearling and milling on the physico-chemical properties is similarly
underappreciated, whether the differences in physico-chemical properties will have a
physiological effect on glycemia and the GI is not yet known. The objectives of this study were:

85
1) characterize the physico-chemical properties of 3 different barley cultivars; 2) assess the
impact of pearling on the physico-chemical properties of each cultivar; 3) examine the effects of
milling and extrusion cooking on the physico-chemical properties and their corresponding
physiological responses, and finally, (4) assess the relationship between the physico-chemical
properties and postprandial glycemia and the GI. The main outcomes include: MW, viscosity,
solubility, β-glucan content, blood glucose and the GI.
6.3. Materials and Methods
Experimental foods
Three Canadian barley cultivars were selected based on diversity in starch, amylose, β-
glucan content and for agronomic purposes. The cultivars chosen were AC Parkhill (high
amylose, low β-glucan), Celebrity (high amylose, medium β-glucan) and CDC Fibar (low
amylose, high β-glucan) (Table 1). Barley kernels were pearled in 100g batches at various times
to achieve the desired pearling level using an abrasive mill (model TM05, Satake, Tokyo, Japan).
Each cultivar was pearled into two fractions, wholegrain (WG) (only the husk was removed) and
white-pearled (WP) (all the bran and most of the germ and crease removed). Botanically the
selected barley cultivars were: 1, two-row, hulled, normal barley (AC Parkhill); 1, six-rowed,
hulled, normal barley (Celebrity); and 1 two-row, hull-less, waxy barley (CDC Fibar). Kernels
from two-row barleys are generally larger and more uniform in size than those from six-rowed
barleys due to crowding of spikelet’s on the spike in the latter. Hull-less barley are free-threshing
or naked grains. Normal barley contains starch with an amylose-to-amylopectin ratio of ≈ 1:3,
whereas the starch in waxy barleys is almost entirely amylopectin. Samples were provided in 25
86
kg amounts and a 3 kg representative sample of each cultivar was obtained from the original
bags.
In vitro digestion and viscosity measurement
Each test food was prepared and cooked according to the same condition of the clinical
trials (168)
. The Rapid Visco Analyzer (RVA) method previously described (178)
was used for
digestion and direct measurement of β-glucan viscosity. Cooked barley grains and pasta were
milled using a M2 universal mill (IKA-Werke, Staufen, Germany), and a portion of sample
containing 0.25g β-glucan content (dry base) was weighed into the RVA canister. Sodium
phosphate buffer (20 mM, pH 6.9) containing 10 mM NaCl was added to the canister with 100
μL of human saliva amylase EC.3.2.1.1. (Sigma/Aldrich A1031) (300 U/mL in 3.2 mM CaCl2
solution), 300 μL of pepsin EC. 3.4.23.1 (Sigma/Aldrich P7012) (1130 U/mL in 0.9% NaCl
solution) and 600 μL of pancreatin (Sigma/Aldrich P7545) (0.5 mg/mL in sodium phosphate
buffer). The amount of buffer was calculated as 100 g minus the weight of sample moisture. The
RVA (Model RVA-4, Newport Scientific Pty Ltd, Australia) equipped with thermocline software
version 2.2. for windows was held constant at 37ºC, and the mixing speed was set at 480 rpm for
10 sec followed by 160 rpm during the run. Viscosity, was recorded every 8 sec during the 2
hour digestion.
β-Glucan content, molecular weight, solubility and extract viscosity
Total β-glucan content was determined by the enzymatic method (AOAC 995.16). The
amount of extractable β-glucan obtained after digestion and centrifugation at 8000×g and 20°C
for 10 minutes was measured using flow-injection analysis (FIA) as described previously (76)
.
The percent solubility was calculated as amount of soluble β-glucan/ total β-glucan × 100. The

87
weight average molecular weight (Mw) was determined using size exclusion-HPLC with
calcofluor detection as previously described (76)
. A controlled strain rheometer (ARES, TA
Instruments, New Castle, DE) was used to measure the viscosity of extracts after digestion and
centrifugation at 8000×g and 20°C for 10 minutes. Up and down shear ramps were conducted
over a shear rate range of 0.1 - 400 s-1
at 37 °C using a cone-and-plate geometry (angle of 0.04
radians, diameter of 50 mm). Apparent viscosity was recorded at a shear rate 30 s-1
on down
cycle, primarily for consistency with the literature.
Carbohydrate Analysis
The methods and results of carbohydrate analysis have been reported previously (82)
and
will only used in this study for correlation analyses with the in vivo glycemic responses, the in
vitro digestion model and the physico-chemical data.
Clinical Trial
The results from the clinical trials are given in chapter 4. The blood glucose (BG), area
under the curve (AUC) and GI values were used to assess the association with the physico-
chemical properties. The trial was conducted in two experiments with 10 separate subjects for
each trail. In study 1: Six of the test meals consumed by each subject consisted of the 3 different
cultivars of barley as explained previously and were cooked as described below and fed in
randomized order. In study 2: The objective was to determine the effect on the GI of making
pasta from barley flour, using two barley cultivars shown in experiments 1 to have different GI
values (AC Parkhill and Celebrity) each pearled to different levels (WG and WP). Barley
samples were milled into flour using an analytical mill (A-10, Tekmar, Cincinnati, OH) and
made into a wet pasta-like product using 100% barley flour from each cultivar. Barley flour

88
(100 g) was mixed with water (60-70 mL) to form a paste which was extruded using a pasta
maker (PastaMatic® MX700, Treviso, Italy). All products were analyzed for dry matter (DM)
and wet and dry loss. Salt (1g), xanthan (1g) and 85µL of annato solution (2.8%) were added per
100g barley flour to improve flavor, texture and color, respectively, and overall appearance.
After extruding the pasta, products were refrigerated overnight at 4 C° before being cooked on
the next morning.
Cooking Procedures
Based on the in vitro carbohydrate analysis, samples of each barley cultivar were cooked
in portions that provide 50 g available carbohydrate (Table 1). Single portions of barley grains
were rinsed with cold water, added to boiling salted water (1:5 ratio barley: water, w/v), covered
and boiled for 25 min (WG and CP fractions) or 30 min (PP and WP fractions), and allowed to
sit at room temperature for 10 min prior to being served to the participants . Pasta was cooked in
boiling water for 5 min for the barley products and 20 min for the semolina product to obtain
aldente (firm to the bite) texture. A ratio of 1:8 pasta: water, w/v, was used to minimize losses of
nutrients due to cooking in large amount of water.
Statistical Analysis
Results are expressed as mean ± SD. Statistical analysis was done using SAS version 9.3.
β-glucan content and the physico-chemical data ( solubility, extract viscosity and MW) of all
treatments were compared by a multivariate analysis of variance (MANOVA) examining the
effects of cultivar, pearling and food form. After demonstration of significant heterogeneity by
ANOVA, differences between individual means was assessed using Tukey's test to adjust for
multiple comparisons. Peak Blood Glucose Rise (PBGR) was calculated as the difference of each
89
subject’s peak and fasting glucose values. Pearson correlation analysis was used to identify
relationships between physico-chemical data and BG, AUC and the GI values. The criterion
used for statistical significance was 2-tailed P < 0.05.
6.4. Results
Physico-chemical data
Boiled barley kernels
β-glucan content of the cooked barley kernels ranged from 4.2 ± 0.04 to 11.1 ± 0.4 (%
db) (Table 2). The waxy cultivar CDC-Fibar had significantly higher β-glucan content compared
to the 2-row hulled, normal cultivar AC-Parkhill and the hulled normal cultivar Celebrity (P <
0.05), with no cultivar×fraction interactions for all the boiled barley kernels. β-glucan MW
ranged from 1460 ± 320 to 2310 ± 600 (g/mol×103
). The MW did not differ significantly
between the boiled barley kernels with no cultivar×fraction interaction. There was a trend for a
decline in MW within each cultivar for boiled barleys when pearled but without any statistical
differences. Solubility was significantly different between cultivars; CDC-Fibar had higher
solubility compared to Celebrity and AC-Parkhill (P < 0.05) with no cultivar×fraction
interaction. β-glucan Viscosity differed between barley kernels, CDC-Fibar was significantly
different than AC-Parkhill but not from Celebrity with no cultivar×fraction interactions (P <
0.05). Similarly, extract viscosity differed between cultivars, CDC-Fibar was significantly
different then AC-Parkhill (P < 0.05) (Table 2). There was a trend for increasing viscosity with
pearling, yet not statistically significant. There were also apparent differences in the percent
contribution of β-glucan to viscosity between cultivars, though not consistent (Table 2).
Barley Pasta
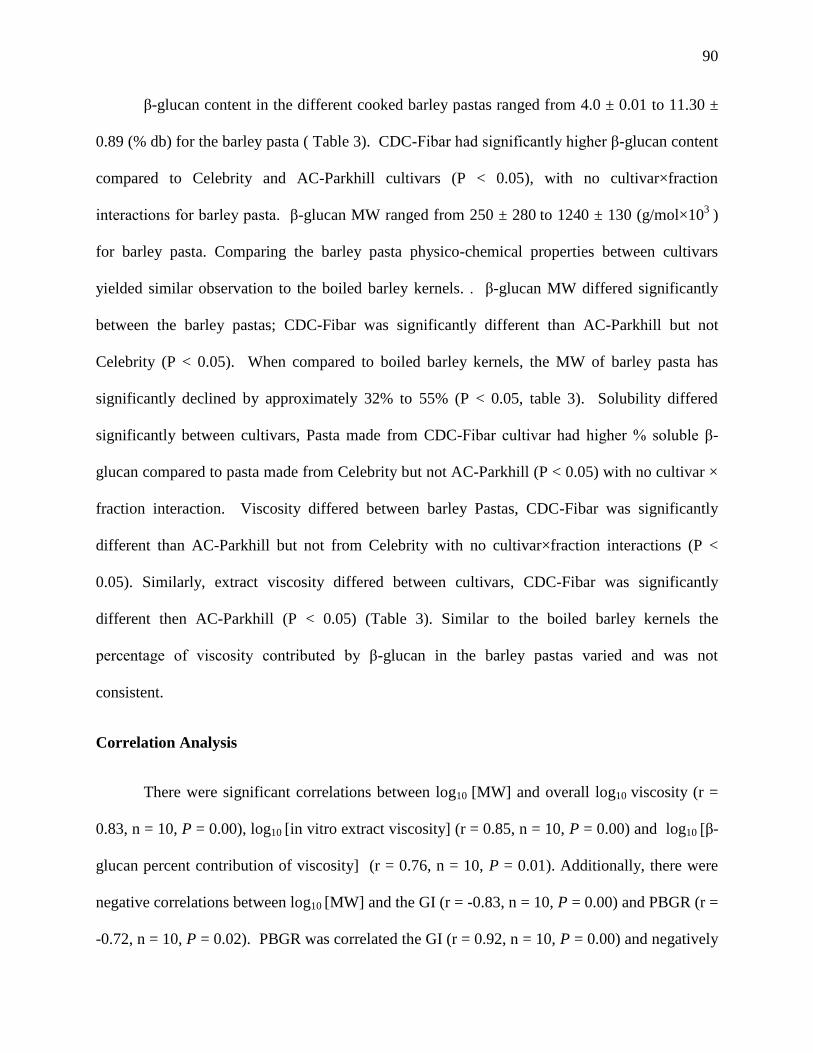
90
β-glucan content in the different cooked barley pastas ranged from 4.0 ± 0.01 to 11.30 ±
0.89 (% db) for the barley pasta ( Table 3). CDC-Fibar had significantly higher β-glucan content
compared to Celebrity and AC-Parkhill cultivars (P < 0.05), with no cultivar×fraction
interactions for barley pasta. β-glucan MW ranged from 250 ± 280 to 1240 ± 130 (g/mol×10
3 )
for barley pasta. Comparing the barley pasta physico-chemical properties between cultivars
yielded similar observation to the boiled barley kernels. . β-glucan MW differed significantly
between the barley pastas; CDC-Fibar was significantly different than AC-Parkhill but not
Celebrity (P < 0.05). When compared to boiled barley kernels, the MW of barley pasta has
significantly declined by approximately 32% to 55% (P < 0.05, table 3). Solubility differed
significantly between cultivars, Pasta made from CDC-Fibar cultivar had higher % soluble β-
glucan compared to pasta made from Celebrity but not AC-Parkhill (P < 0.05) with no cultivar ×
fraction interaction. Viscosity differed between barley Pastas, CDC-Fibar was significantly
different than AC-Parkhill but not from Celebrity with no cultivar×fraction interactions (P <
0.05). Similarly, extract viscosity differed between cultivars, CDC-Fibar was significantly
different then AC-Parkhill (P < 0.05) (Table 3). Similar to the boiled barley kernels the
percentage of viscosity contributed by β-glucan in the barley pastas varied and was not
consistent.
Correlation Analysis
There were significant correlations between log10 [MW] and overall log10 viscosity (r =
0.83, n = 10, P = 0.00), log10 [in vitro extract viscosity] (r = 0.85, n = 10, P = 0.00) and log10 [β-
glucan percent contribution of viscosity] (r = 0.76, n = 10, P = 0.01). Additionally, there were
negative correlations between log10 [MW] and the GI (r = -0.83, n = 10, P = 0.00) and PBGR (r =
-0.72, n = 10, P = 0.02). PBGR was correlated the GI (r = 0.92, n = 10, P = 0.00) and negatively
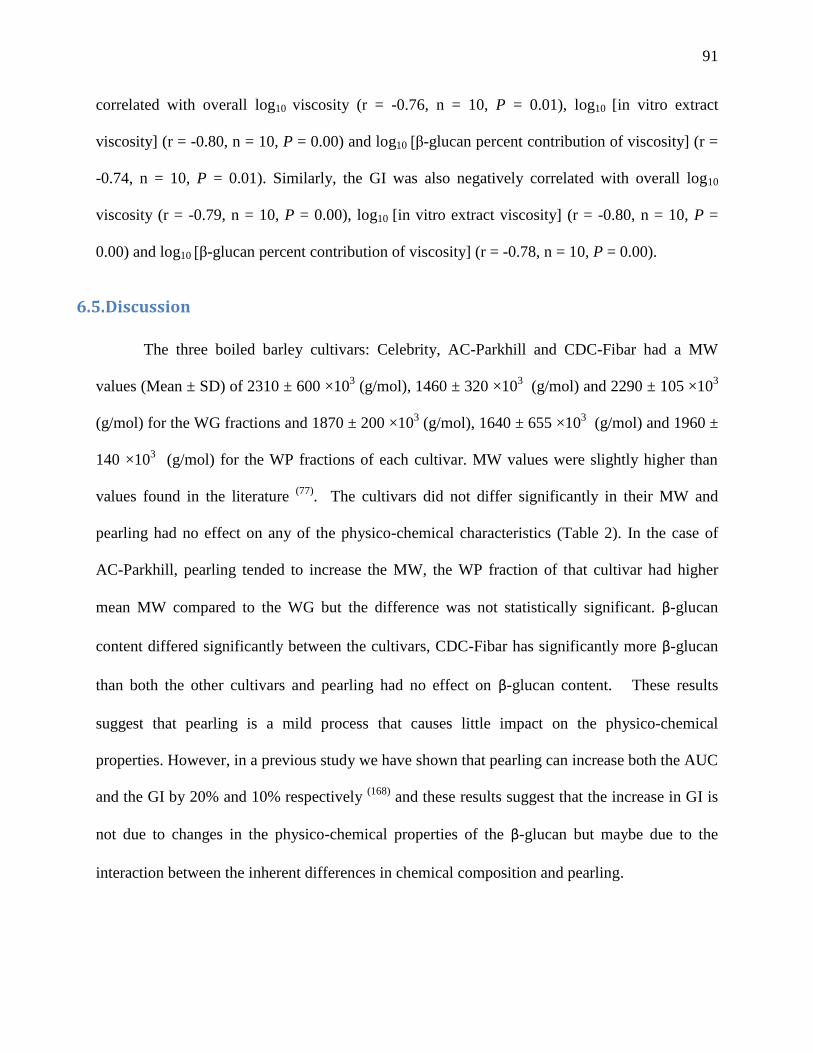
91
correlated with overall log10 viscosity (r = -0.76, n = 10, P = 0.01), log10 [in vitro extract
viscosity] (r = -0.80, n = 10, P = 0.00) and log10 [β-glucan percent contribution of viscosity] (r =
-0.74, n = 10, P = 0.01). Similarly, the GI was also negatively correlated with overall log10
viscosity (r = -0.79, n = 10, P = 0.00), log10 [in vitro extract viscosity] (r = -0.80, n = 10, P =
0.00) and log10 [β-glucan percent contribution of viscosity] (r = -0.78, n = 10, P = 0.00).
6.5. Discussion
The three boiled barley cultivars: Celebrity, AC-Parkhill and CDC-Fibar had a MW
values (Mean ± SD) of 2310 ± 600 ×103 (g/mol), 1460 ± 320 ×10
3 (g/mol) and 2290 ± 105 ×10
3
(g/mol) for the WG fractions and 1870 ± 200 ×103 (g/mol), 1640 ± 655 ×10
3 (g/mol) and 1960 ±
140 ×103 (g/mol) for the WP fractions of each cultivar. MW values were slightly higher than
values found in the literature (77)
. The cultivars did not differ significantly in their MW and
pearling had no effect on any of the physico-chemical characteristics (Table 2). In the case of
AC-Parkhill, pearling tended to increase the MW, the WP fraction of that cultivar had higher
mean MW compared to the WG but the difference was not statistically significant. β-glucan
content differed significantly between the cultivars, CDC-Fibar has significantly more β-glucan
than both the other cultivars and pearling had no effect on β-glucan content. These results
suggest that pearling is a mild process that causes little impact on the physico-chemical
properties. However, in a previous study we have shown that pearling can increase both the AUC
and the GI by 20% and 10% respectively (168)
and these results suggest that the increase in GI is
not due to changes in the physico-chemical properties of the β-glucan but maybe due to the
interaction between the inherent differences in chemical composition and pearling.

92
Similar results were observed for solubility, the cultivars differed significantly with no
pearling effects. CDC-Fibar had significantly higher solubility compared to the other two
cultivars which may be due to the significantly higher content of β-glucan. This observation is to
be expected as solubility is a function of MW (158)
, and since MW was not affected significantly
by pearling therefore, solubility was not affected.
Viscosity of β-glucan , a measure of the resistance to flow (21)
, is an important attribute
of determining the quality of β-glucan and its considered to play a significant role in the health
benefits associated with consuming barley and barley β-glucan products. Our results show that
cultivars differed significantly in terms of the viscosity their constituents induced (Table 2).
These results are partly in line with previous work. Gray et al (179)
, found that food product
viscosity of the same barley cultivars was significantly affected by both cultivar and pearling
level. In this study there was a trend of increasing viscosity with the WP fractions although not
significant but this indicates that pearling may result in more accessible and bioactive β-glucan
leading to increased viscosity. β-glucan is mainly a soluble fibre but typically only a portion of
the total is extracted under physiological conditions. Pearling reduced the viscosity of the β-
glucan extract in only Celebrity regardless of retaining the overall viscosity (Table 2). This
indicates that other components may be responsible for the developed viscosity. The opposite
occurred in CDC-Fibar and AC-Parkhill where pearling increased the viscosity of the extract,
differences were not significant (Table 2). These results suggest that cultivars have different
rheological behaviors. This may be due to differences in their botanical anatomy (2-row vs. 6-
row) and nature of starch (Normal vs. Waxy). For example, Celebrity a 6-row normal hulled
cultivar had a significantly more total starch in the WP fraction compared to the WG fraction (82)
which explains the decline in β- glucan contribution to viscosity in the WP fraction. During
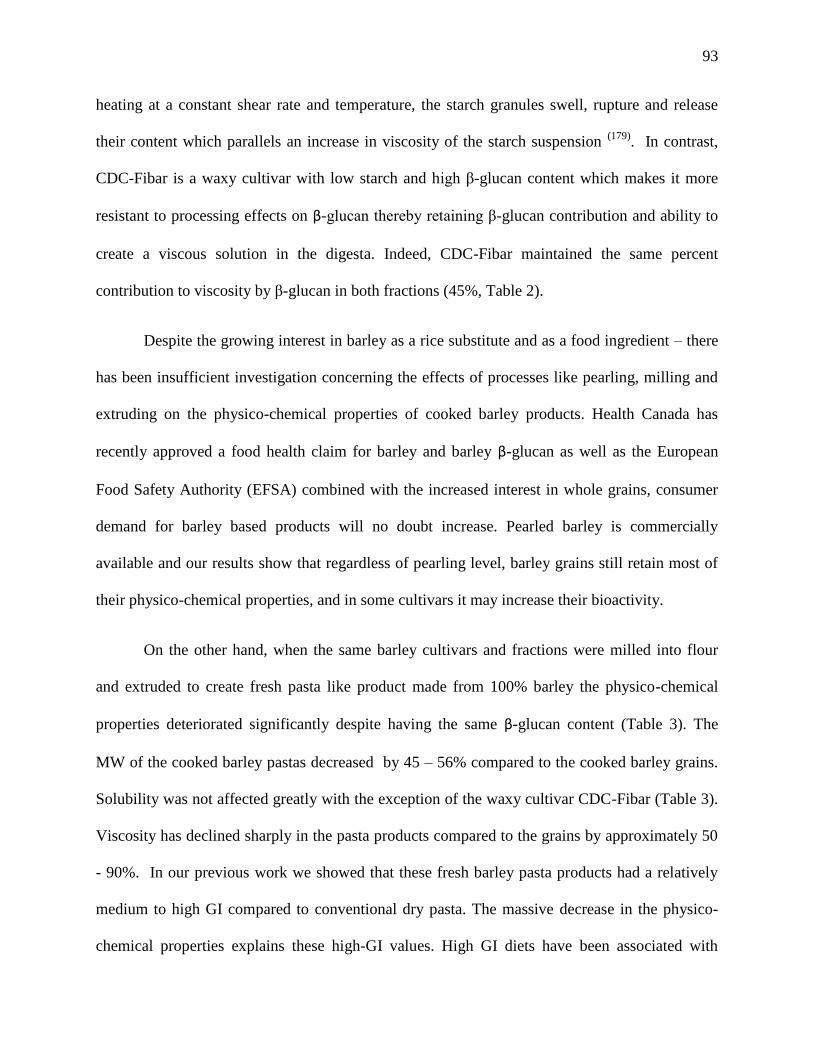
93
heating at a constant shear rate and temperature, the starch granules swell, rupture and release
their content which parallels an increase in viscosity of the starch suspension (179)
. In contrast,
CDC-Fibar is a waxy cultivar with low starch and high β-glucan content which makes it more
resistant to processing effects on β-glucan thereby retaining β-glucan contribution and ability to
create a viscous solution in the digesta. Indeed, CDC-Fibar maintained the same percent
contribution to viscosity by β-glucan in both fractions (45%, Table 2).
Despite the growing interest in barley as a rice substitute and as a food ingredient – there
has been insufficient investigation concerning the effects of processes like pearling, milling and
extruding on the physico-chemical properties of cooked barley products. Health Canada has
recently approved a food health claim for barley and barley β-glucan as well as the European
Food Safety Authority (EFSA) combined with the increased interest in whole grains, consumer
demand for barley based products will no doubt increase. Pearled barley is commercially
available and our results show that regardless of pearling level, barley grains still retain most of
their physico-chemical properties, and in some cultivars it may increase their bioactivity.
On the other hand, when the same barley cultivars and fractions were milled into flour
and extruded to create fresh pasta like product made from 100% barley the physico-chemical
properties deteriorated significantly despite having the same β-glucan content (Table 3). The
MW of the cooked barley pastas decreased by 45 – 56% compared to the cooked barley grains.
Solubility was not affected greatly with the exception of the waxy cultivar CDC-Fibar (Table 3).
Viscosity has declined sharply in the pasta products compared to the grains by approximately 50
- 90%. In our previous work we showed that these fresh barley pasta products had a relatively
medium to high GI compared to conventional dry pasta. The massive decrease in the physico-
chemical properties explains these high-GI values. High GI diets have been associated with
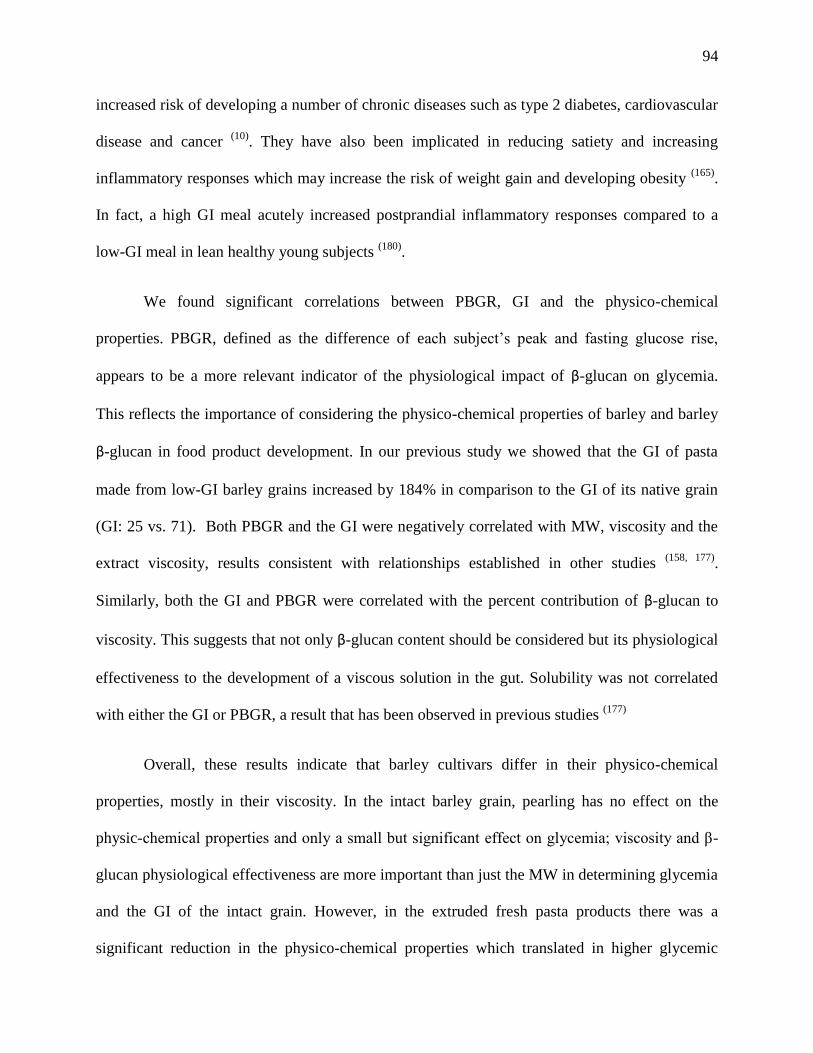
94
increased risk of developing a number of chronic diseases such as type 2 diabetes, cardiovascular
disease and cancer (10)
. They have also been implicated in reducing satiety and increasing
inflammatory responses which may increase the risk of weight gain and developing obesity (165)
.
In fact, a high GI meal acutely increased postprandial inflammatory responses compared to a
low-GI meal in lean healthy young subjects (180)
.
We found significant correlations between PBGR, GI and the physico-chemical
properties. PBGR, defined as the difference of each subject’s peak and fasting glucose rise,
appears to be a more relevant indicator of the physiological impact of β-glucan on glycemia.
This reflects the importance of considering the physico-chemical properties of barley and barley
β-glucan in food product development. In our previous study we showed that the GI of pasta
made from low-GI barley grains increased by 184% in comparison to the GI of its native grain
(GI: 25 vs. 71). Both PBGR and the GI were negatively correlated with MW, viscosity and the
extract viscosity, results consistent with relationships established in other studies (158, 177)
.
Similarly, both the GI and PBGR were correlated with the percent contribution of β-glucan to
viscosity. This suggests that not only β-glucan content should be considered but its physiological
effectiveness to the development of a viscous solution in the gut. Solubility was not correlated
with either the GI or PBGR, a result that has been observed in previous studies (177)
Overall, these results indicate that barley cultivars differ in their physico-chemical
properties, mostly in their viscosity. In the intact barley grain, pearling has no effect on the
physic-chemical properties and only a small but significant effect on glycemia; viscosity and β-
glucan physiological effectiveness are more important than just the MW in determining glycemia
and the GI of the intact grain. However, in the extruded fresh pasta products there was a
significant reduction in the physico-chemical properties which translated in higher glycemic
95
responses and GI. This may have happened due to a significant depolymerization of β-glucan as
indicated in the decline of β-glucan ability to induce viscosity (75)
.
In conclusion, our results suggest that cultivar differed in their physico-chemical
properties and pearling did not have a significant impact on these properties. In contrast, milling
and extruding barley grains to create fresh barley pasta resulted in significant decline in the
physico-chemical properties an observation that should be considered by both regulating bodies
and food manufacturing industry when developing barley based products. MW, viscosity and β-
glucan content and contribution to viscosity appear to be the controlling factors of the ability of
barley to attenuate glycemic responses and the GI.
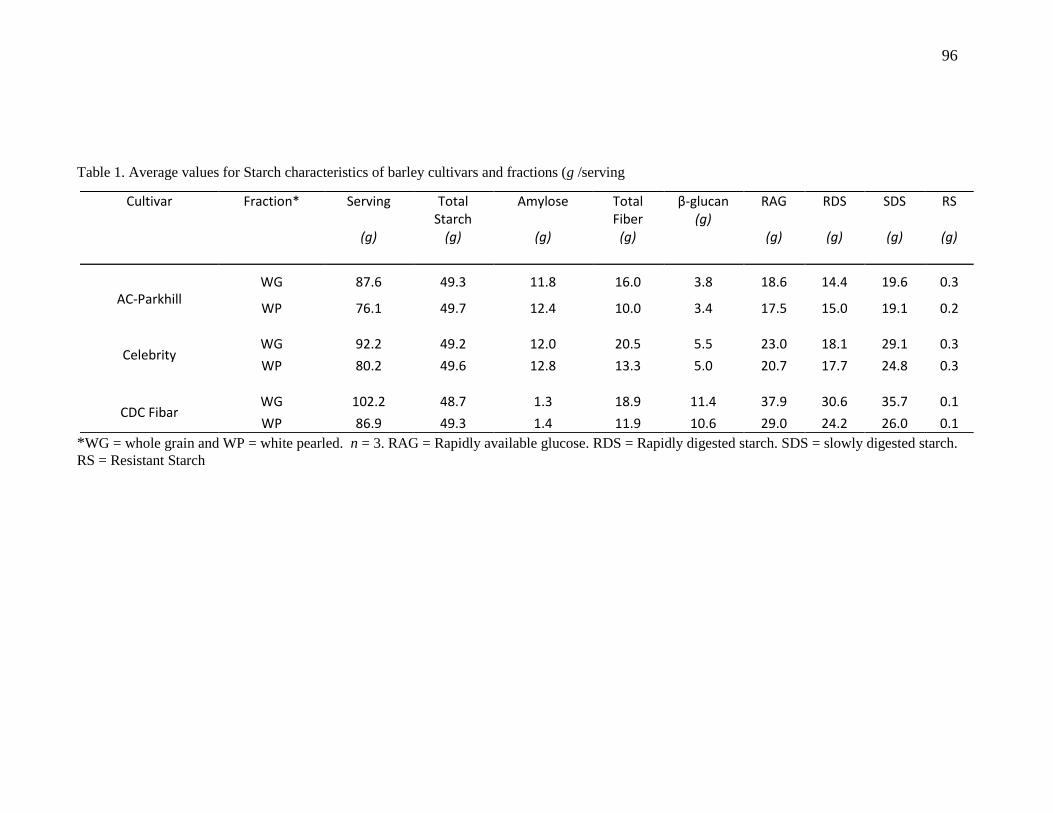
96
Table 1. Average values for Starch characteristics of barley cultivars and fractions (g /serving
*WG = whole grain and WP = white pearled. n = 3. RAG = Rapidly available glucose. RDS = Rapidly digested starch. SDS = slowly digested starch.
RS = Resistant Starch
Cultivar Fraction* Serving
(g)
Total Starch
(g)
Amylose
(g)
Total Fiber
(g)
β-glucan (g)
RAG
(g)
RDS
(g)
SDS
(g)
RS
(g)
AC-Parkhill WG 87.6 49.3 11.8 16.0 3.8 18.6 14.4 19.6 0.3
WP 76.1 49.7 12.4 10.0 3.4 17.5 15.0 19.1 0.2
Celebrity
WG
92.2
49.2
12.0
20.5
5.5
23.0
18.1
29.1
0.3
WP 80.2 49.6 12.8 13.3 5.0 20.7 17.7 24.8 0.3
CDC Fibar
WG
102.2
48.7
1.3
18.9
11.4
37.9
30.6
35.7
0.1
WP 86.9 49.3 1.4 11.9 10.6 29.0 24.2 26.0 0.1
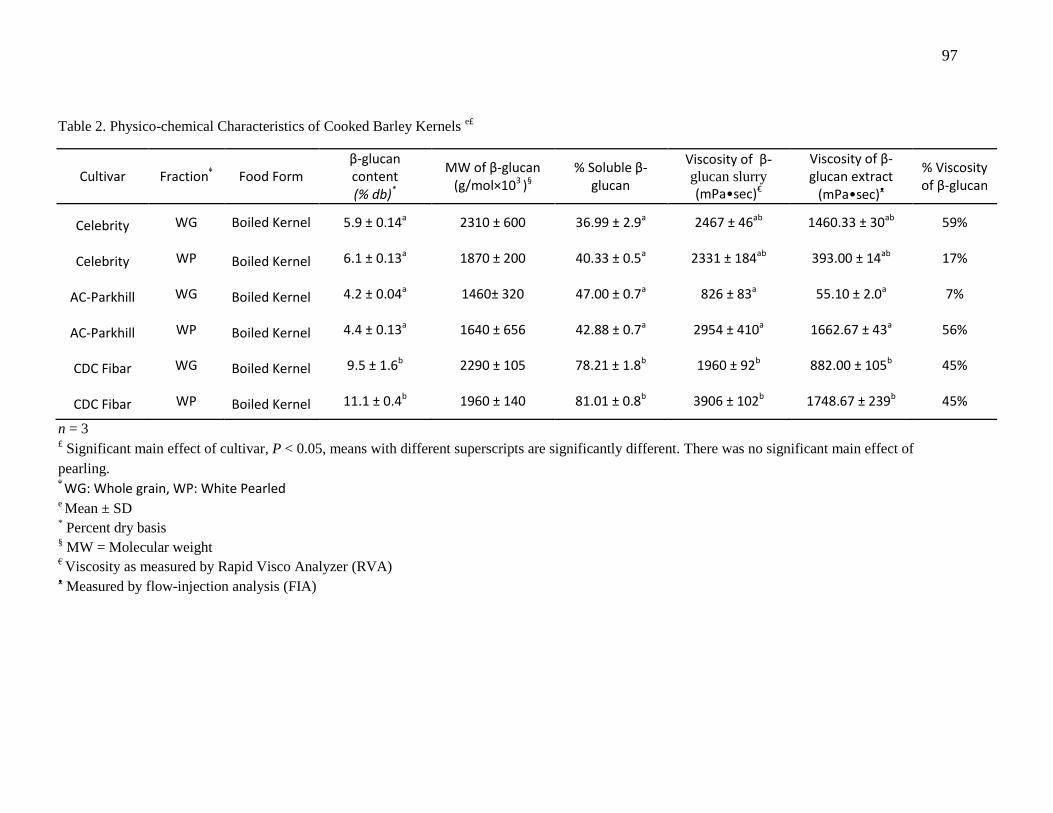
97
Table 2. Physico-chemical Characteristics of Cooked Barley Kernels e£
n = 3 £ Significant main effect of cultivar, P < 0.05, means with different superscripts are significantly different. There was no significant main effect of
pearling. ᵠ WG: Whole grain, WP: White Pearled e Mean ± SD
* Percent dry basis
§ MW = Molecular weight € Viscosity as measured by Rapid Visco Analyzer (RVA)
ᴥ Measured by flow-injection analysis (FIA)
Cultivar Fractionᵠ Food Form β-glucan content (% db)*
MW of β-glucan (g/mol×103 )§
% Soluble β-glucan
Viscosity of β-
glucan slurry (mPa•sec)€
Viscosity of β-glucan extract
(mPa•sec)ᴥ
% Viscosity of β-glucan
Celebrity WG Boiled Kernel 5.9 ± 0.14a 2310 ± 600 36.99 ± 2.9a 2467 ± 46ab 1460.33 ± 30ab 59%
Celebrity WP Boiled Kernel 6.1 ± 0.13a 1870 ± 200 40.33 ± 0.5a 2331 ± 184ab 393.00 ± 14ab 17%
AC-Parkhill WG Boiled Kernel 4.2 ± 0.04a 1460± 320 47.00 ± 0.7a 826 ± 83a 55.10 ± 2.0a 7%
AC-Parkhill WP Boiled Kernel 4.4 ± 0.13a 1640 ± 656 42.88 ± 0.7a 2954 ± 410a 1662.67 ± 43a 56%
CDC Fibar WG Boiled Kernel 9.5 ± 1.6b 2290 ± 105 78.21 ± 1.8b 1960 ± 92b 882.00 ± 105b 45%
CDC Fibar WP Boiled Kernel 11.1 ± 0.4b 1960 ± 140 81.01 ± 0.8b 3906 ± 102b 1748.67 ± 239b 45%
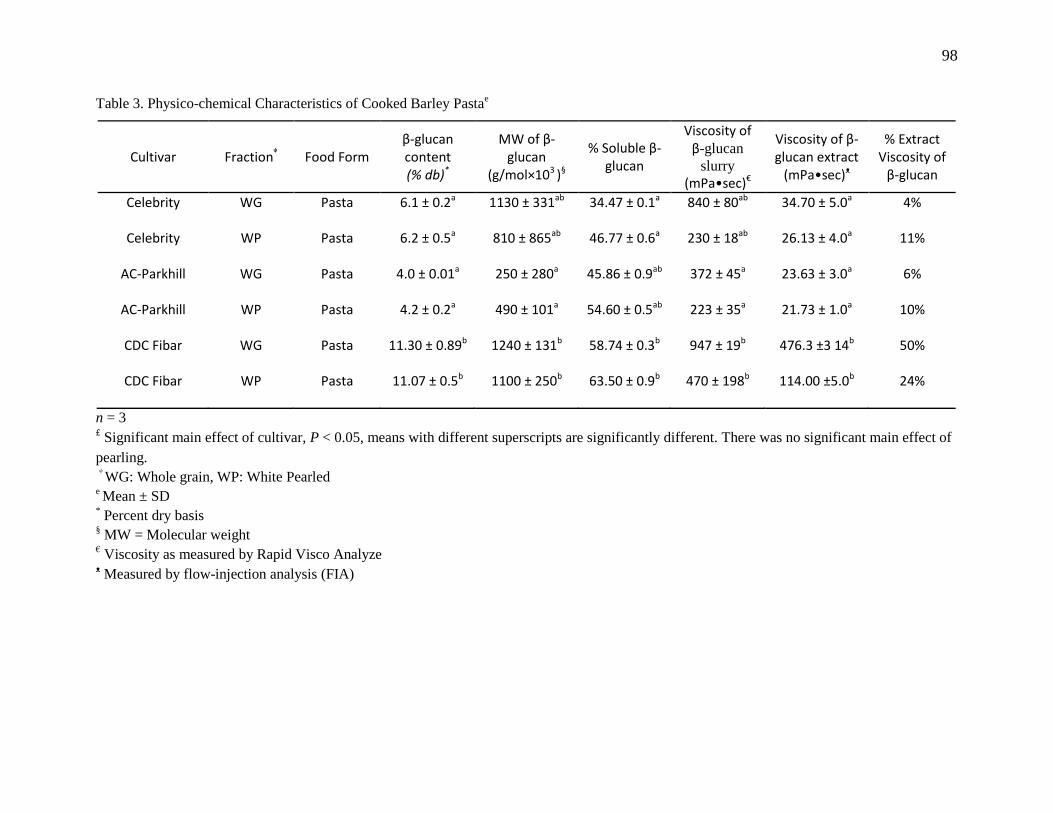
98
Table 3. Physico-chemical Characteristics of Cooked Barley Pastae
n = 3 £ Significant main effect of cultivar, P < 0.05, means with different superscripts are significantly different. There was no significant main effect of
pearling.
ᵠ WG: Whole grain, WP: White Pearled
e Mean ± SD
* Percent dry basis
§ MW = Molecular weight
€ Viscosity as measured by Rapid Visco Analyze
ᴥ Measured by flow-injection analysis (FIA)
Cultivar Fractionᵠ Food Form β-glucan content (% db)*
MW of β-glucan
(g/mol×103 )§
% Soluble β-glucan
Viscosity of β-glucan
slurry (mPa•sec)€
Viscosity of β-glucan extract
(mPa•sec)ᴥ
% Extract Viscosity of
β-glucan
Celebrity WG Pasta 6.1 ± 0.2a 1130 ± 331ab 34.47 ± 0.1a 840 ± 80ab 34.70 ± 5.0a 4%
Celebrity WP Pasta 6.2 ± 0.5a 810 ± 865ab 46.77 ± 0.6a 230 ± 18ab 26.13 ± 4.0a 11%
AC-Parkhill WG Pasta 4.0 ± 0.01a 250 ± 280a 45.86 ± 0.9ab 372 ± 45a 23.63 ± 3.0a 6%
AC-Parkhill WP Pasta 4.2 ± 0.2a 490 ± 101a 54.60 ± 0.5ab 223 ± 35a 21.73 ± 1.0a 10%
CDC Fibar WG Pasta
11.30 ± 0.89b 1240 ± 131b 58.74 ± 0.3b 947 ± 19b 476.3 ±3 14b 50%
CDC Fibar WP Pasta
11.07 ± 0.5b 1100 ± 250b 63.50 ± 0.9b 470 ± 198b 114.00 ±5.0b 24%
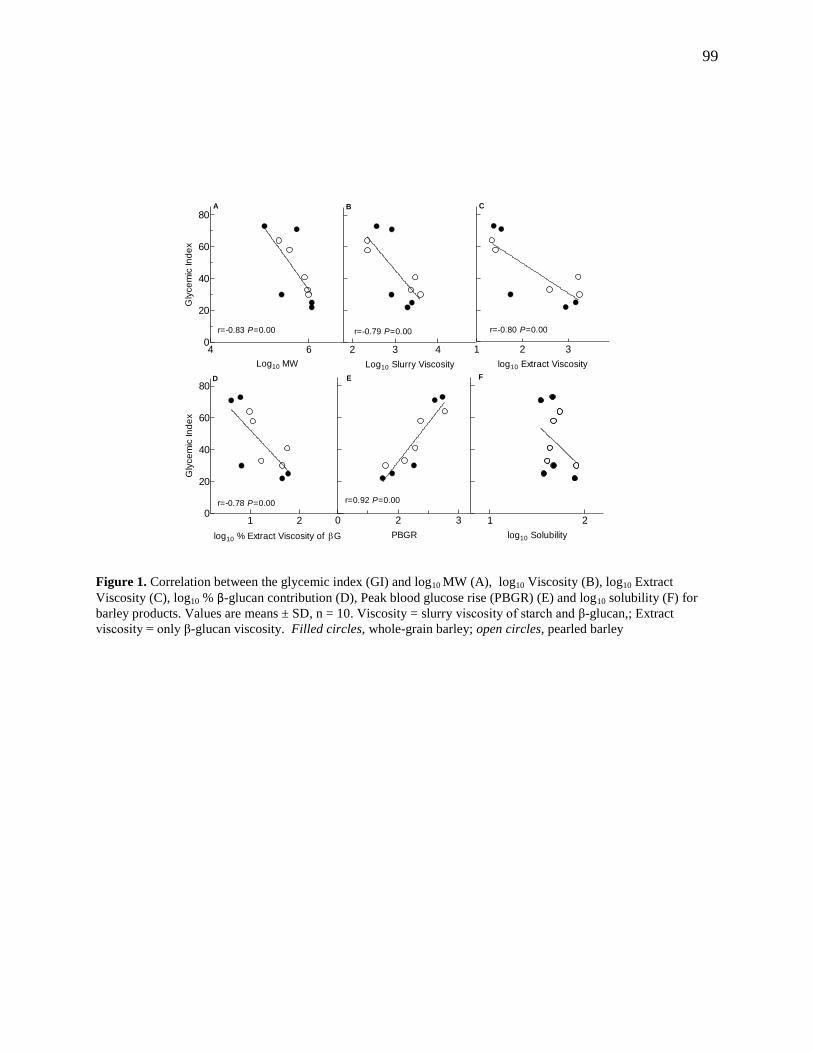
99
Log10 MW
Gly
ce
mic
In
de
x
4 60
20
40
60
80
r=-0.83 P=0.00
Log10 Slurry Viscosity
2 3 4
r=-0.79 P=0.00
log10 Extract Viscosity
1 2 3
r=-0.80 P=0.00
A B C
log10 % Extract Viscosity of G
Gly
ce
mic
In
de
x
1 20
20
40
60
80
r=-0.78 P=0.00
PBGR
0 2 3
r=0.92 P=0.00
log10 Solubility
1 2
E FD
Figure 1. Correlation between the glycemic index (GI) and log10 MW (A), log10 Viscosity (B), log10 Extract
Viscosity (C), log10 % β-glucan contribution (D), Peak blood glucose rise (PBGR) (E) and log10 solubility (F) for
barley products. Values are means ± SD, n = 10. Viscosity = slurry viscosity of starch and β-glucan,; Extract
viscosity = only β-glucan viscosity. Filled circles, whole-grain barley; open circles, pearled barley

100
Log10 MW
PB
GR
(m
mo
l/L
)
5 60
1
2
3
r=-0.72 P=0.02
Log10 Slurry Viscosity
2 4
r=-0.76 P=0.01
log10 % Extract Viscosity of G
1 2
r=-0.74 P=0.01
log10 Extract Viscosity
PB
GR
(m
mo
l/L
)
1 2 3 40
1
2
3
r=-0.80 P=0.00
A B
C D
Figure 2. Correlation between the Peak blood glucose rise (PBGR) and log10 MW (A), log10 Viscosity (B), log10
Extract Viscosity (C) and log10 % β-glucan contribution (D), for barley products. Values are means ± SD, n = 10.
Viscosity = slurry viscosity of starch and β-glucan; Extract viscosity = only β-glucan viscosity. Filled circles,
whole-grain barley; open circles, pearled barley

101
7. Overall Discussion
102
7.1. Discussion
The results of these experiments suggest that differences in chemical composition
between cultivars have a significant effect on glycemia and the GI but not on subjective satiety.
The significance of variations in chemical composition indicates that when barley is consumed a
synergistic effect of the nature of starch and soluble fibre, mainly β-glucan, occur. This is of
interest because it challenges the previous notion that only the nature of starch is the determining
factor in starch digestibility and its physiological effects. Amylose (unbranched -(1-4) linked
molecules) and amylopectin (branched 1-4) and 1-6) linkages) are the two main
components of starch. The branched structure of amylopectin is more susceptible to hydrolysis
than the nearly linear structure of amylose which increases the rate of digestion (17). Therefore,
it is assumed that amylose-to-amylopectin ratio influences the rate of starch digestion and in turn
dictates the concentration of RDS and SDS (18). Accordingly, it would be predicted that a barley
cultivar with a lower percentage of amylose would have a higher GI but this was not the case
with CDC Fibar which had the lowest content of amylose and the lowest GI of all the tested
cultivars. One reason why CDC Fibar had a low GI, despite low amylose content, may be
because of its high content of β-glucan. However, evidence from the first study ( Chapter 4)
does not support a strong role of β-glucan in determining the GI of cooked whole and pearled
barley kernels because GI was more strongly related to total fiber content of barley rather than
just β-glucan content (Chapter 4, Figure 1). It’s more likely that the GI of barley is influenced by
several competing factors including starch and the physico-chemical properties of soluble fiber
and most importantly their interactions.
Indeed, this is further supported by results from the in vitro starch digestibility analysis.
RDS content varied between cultivars with CDC Fibar and CDC Rattan containing significantly
103
higher amounts of RDS (26.9-33.4%) compared to other barleys (14.9-26.2%). Similarly, both
cultivars had significantly higher starch digestion index compared to other cultivars (82)
, yet they
had the lowest GI values. Furthermore, an examination of the physico-chemical properties of
selected cultivars and their fractions (CDC-Fibar, Celebrity and AC-Parkhill) provided further
insight to the synergistic effect of the nature of starch and the physico-chemical properties of β-
glucan. For example, CDC-Fibar contained high amount of RDS and high starch digestion index
but it also contained the highest content of: β-glucan, solubility, viscosity and β-glucan
contribution to viscosity regardless of level of pearling compared to Celebrity and AC-Parkhill
(Chapter 4, Table 2). This suggests that CDC-Fibar had the most effective type of β-glucan.
Whether this is related to only the amount of β-glucan is not known, but our results do not
suggest such an observation. Taken together these results indicate the superiority of the physico-
chemical properties of β-glucan over the nature of starch as determinants of glycemic response,
but together they have a synergetic effect that enhances the physiological effects of consuming
barley.
Correlation results from both chapter 4 and 6 indicate that β-glucan content was not
associated with the AUC nor the GI and only total fiber was negatively correlated with the GI of
the barley cultivars (Chapter 4, Figure 1, r
= -0.81, n = 9, P = 0.008). In this context it is of
interest that pearling reduced the total fiber content of barley to a greater extent than that of the
β-glucan (82)
. This suggests that the starch in the outer layers of barley kernels which are
removed by pearling is protected by fiber other than β-glucan to a greater extent and has a lower
GI than the starch in the center of the barley kernels. This might explain why the WP fraction,
which removes 25-30% of the starch from barley, increases the GI of intact barley (Chapter 4,
Table 2).
104
Our results suggest that the matrix structure of barley is a more important determinant of
its GI than its content of RDS, SDS, RS or β-glucan. The disruption of the matrix structure of
barley by grinding and extruding barley to create fresh 100% barley pasta increased the GI
significantly compared to their native intact kernels. The barley pastas had unexpectedly
relatively high GI values since pasta is considered to have a low GI. However, we believe our
pasta had a high GI because we produced wet or fresh pastas, whereas pasta is usually available
as dry pasta. The drying process could harden the matrix structure and make it less accessible to
enzymes, and also inactivate indigenous β-glucan degrading enzymes, while wet pasta is more
readily available or accessible to indigenous and external enzymes. This was supported by the
high GI of the control wet pasta made from semolina flour compared with dry semolina pasta (GI
≈ 41) (90)
. It is of interest that pasta made from pearled barley had a lower GI than wholegrain
barley pasta, whereas pearling increased the GI of intact barley kernels.
The disruption of the matrix structure of barley grains resulted in a significant reduction
in the physico-chemical properties of β-glucan (Chapter 4, Table 3). Consequently, this
disruption resulted in a severe loss of barley’s β-glucan bioactivity and physiological
effectiveness which is its ability to develop viscosity in the digestive tract. Increasing viscosity
of the meal bolus in the stomach is now recognized as a mechanism responsible for the positive
health effects of consuming β-glucan rich foods. Intestinal viscosity is thought to be responsible
for reducing the interactions of food with digestive enzymes and delaying gastric emptying.
Increasing the viscosity has also been shown to retard the absorption of glucose and slow the rate
of starch digestion in in vitro digestion model studies.
In previous studies it has been suggested that MW of β-glucan is the determining factor
in the health benefits associated with consuming β-glucan rich products (177)
. Our results show
105
that all three cultivars had relatively similar MW (Chapter 4, Table 2 and 3) but they differed
significantly in their viscosity and the ability of β-glucan to develop viscosity (Chapter 4, Table
2 and 3). This suggests that for MW at a maximum value it is the content of β-glucan that
determines the development of viscosity.
This thesis has a number of limitations, including lack of other postprandial
measurements such as insulin and gut hormones. Previous studies have shown that barley food
products with a low GI also elicit low insulin responses and may have an effect on a number of
gut hormones (102, 142, 181)
. Although we only studied normal subjects, the values can be
generalized to other populations because previous studies suggest that the GI values of starchy
foods are similar in normal, hyperinsulinemic and diabetic subjects (163)
. In measuring subjective
satiety we did not use the gold standard measure, Visual Analogue Scales or energy intake, due
to feasibility and time constraints. Moreover, we did not have statistical power to measure satiety
with great precision. Yet, satiety rating scales and the satiety index are two methods that have
been previously used by other authors and have yielded reliable and reproducible results (182-185)
.
Future directions include investigating the relationship between barley and inflammatory
responses. It has been hypothesized that low-GI foods can reduce inflammatory responses
acutely. Whether this is related to their chemical composition (i.e. nature of starch, fibre content)
and GI is not completely explored. Barley is also a rich source of antioxidants and whether they
have an acute effect on inflammation is not known and if the effect on inflammation is separate
from their GI or is a synergistic one is also not known. The impact of processing on the
antioxidants capacity of barley in reducing inflammation has not been completely explored.
106
Barley fractions with different levels of antioxidants, starch and fiber can be used to compare the
contribution of each component separately and assess if an interaction between them exists.
Furthermore, the relationship between viscosity and satiety can be further explored. In this study
we did not assess the physico-chemical properties of all the cultivars studied which limited our
ability to assess the relationship between viscosity, MW and satiety.

107
8. Conclusion

108
This thesis has set out to answer the following research questions:
This thesis will attempt to answer the following questions:
1. What is the significance of differences in chemical composition, total fibre and β-glucan
content on glycemic response, GI and subjective satiety?
2. What is the effect of food form on glycemic response, GI and subjective satiety?
3. What is the magnitude and impact of processing and food form on the physico-chemical
properties of barley ( MW, solubility and viscosity) ?
4. What is the contribution of the physico-chemical properties with respect to glycemia and
the GI?
Our results indicate that the chemical composition has significant importance with regard to
postprandial responses, in particular, the interaction between the starch and β-glucan and their
combined effect on the AUC and the GI. However, this relationship does not appear to have an
effect on subjective satiety. Food form is a significant factor in affecting the glycemic response
and the GI of cooked barley and barley products. Altering the natural intact structure of barley
kernel and consequently the fibre matrix results in structural changes that reduces the bioactivity
of β-glucan and its ability to induce viscosity the digesta. In turn, this affects the GI of the food,
an inherent characteristic of carbohydrates rich foods, by allowing degrading enzyme easier
accessibility. Nonetheless, food form may have a differential effect on satiety than that on
glycemia and the GI. Our results indicate that the postprandial effects associated with
consuming the intact whole grain can be relatively maintained with different levels of pearling
109
but not with severe food form alteration. Pearling is a mild process that does not affect the
physico-chemical properties significantly. In contrast milling and extruding the grain where it
changes the food form significantly had a deleterious impact on the bioactivity of the β-glucan.
In particular, milling and extruding barley kernels to create a wet pasta reduced the MW,
solubility and viscosity significantly.
In conclusion, this thesis was able to answer a number of important questions regarding the
association between whole grains and glycemia. We used barley as a surrogate measure due to its
increasing demand and the development of a number of specialty cultivars that are produced for
human consumption in Canada. The trend of barley end use seems to take the direction of a
functional food rather than being consumed as a whole grain. Our results show that the intact
kernel is superior in producing positive physiological responses on glycemia and maintaining a
low GI, a more significant measure of CHO quality. The results of this thesis are consistent with
those of previous studies which suggest that whole grains, that can be processed into a variety of
different forms, do not necessarily have a low GI. Therefore, there is a need for improved
methods of how whole grains are classified. Selecting a low GI barley cultivar can help not only
blunt high postprandial blood glucose levels but also reduce the overall glycemic load of a meal,
a dietary maneuver that could produce enhanced public health benefits. Our Results also
underscore the significance of the physico-chemical characteristics of foods; β-glucan ability to
contribute to viscosity and MW should be highly considered in future definition of whole grains
and product development.

110
9. References
1. Food and Agriculture Organization of the United Nations (1998) FAO food and Nutrition
Paper 66. Carbohydrates in Human Nutrition. Report of a Joint FAO/WHO Expert Consultation
on Carbohydrates 14-18 April, 1997, Rome, Italy.
2. Englyst HN, Kingman SM, Cummings JH (1992) Classification and measurement of
nutritionally important starch fractions. Eur J Clin Nutr 46(SUPPL. 2), S33-s50.
3. Crapo PA & Olefsky J (1976) Plasma glucose and insulin responses to orally administered
simple and complex carbohydrates. Diabetes 25(9), 741-747.
4. Dandona P, Aljada A, Chaudhuri A et al. (2005) Metabolic syndrome: A comprehensive
perspective based on interactions between obesity, diabetes, and inflammation. Circulation
111(11), 1448-1454.
5. Brand-Miller JC (2003) Glycemic load and chronic disease. Nutrition Reviews 61(5 II), S49-
S55.
6. Franz MJ, Bantle J, Beebe CA et al. (2002) American Diabetes Association Position
Statement: Evidence-based nutrition principles and recommendations for the treatment and
prevention of diabetes and related complications. Journal of the American Dietetic Association
102(1), 109-118.
7. Nutrition recommendations and interventions for diabetes: A position statement of the
American Diabetes Association. (2008) Diabetes Care 31(SUPPL. 1), S61-S78.
8. Ye EQ, Chacko SA, Chou EL et al. (2012) Greater whole-grain intake is associated with lower
risk of type 2 diabetes, cardiovascular disease, and weight gain. J Nutr 142(7), 1304-1313.
9. Singh J, Dartois A, Kaur L (2010) Starch digestibility in food matrix: a review. Trends in
Food Science and Technology 21(4), 168-180.
10. Barclay AW, Petocz P, McMillan-Price J et al. (2008) Glycemic index, glycemic load, and
chronic disease risk - A metaanalysis of observational studies. American Journal of Clinical
Nutrition 87(3), 627-637.
11. Sluijs I, Van Der Schouw YT, Van Der A DL et al. (2010) Carbohydrate quantity and quality
and risk of type 2 diabetes in the European Prospective Investigation into Cancer and Nutrition-
Netherlands (EPIC-NL) study. Am J Clin Nutr 92(4), 905-911.
111
12. Jenkins DJA, Wolever TMS, Taylor RH (1981) Glycemic index of foods: A physiological
basis for carbohydrate exchange. American Journal of Clinical Nutrition 34(3), 362-366.
13. Wolever TMS (2013) Is glycaemic index (GI) a valid measure of carbohydrate quality? Eur J
Clin Nutr advance online publication 13 February 2013.
14. Jenkins DJA, Wolever TMS, Jenkins AL (1983) The glycaemic index of foods tested in
diabetic patients: A new basis for carbohydrate exchange favouring the use of legumes.
Diabetologia 24(4), 257-264.
15. Brand-Miller J, Hayne S, Petocz P et al. (2003) Low-glycemic index diets in the
management of diabetes: A meta-analysis of randomized controlled trials. Diabetes Care 26(8),
2261-2267.
16. Jenkins DJA, Kendall CWC, McKeown-Eyssen G et al. (2008) Effect of a low-glycemic
index or a high-cereal fiber diet on type 2 diabetes: A randomized trial. JAMA - Journal of the
American Medical Association 300(23), 2742-2753.
17. McMillan-Price J, Petocz P, Atkinson F et al. (2006) Comparison of 4 diets of varying
glycemic load on weight loss and cardiovascular risk reduction in overweight and obese young
adults: A randomized controlled trial. Arch Intern Med 166(14), 1466-1475.
18. Gögebakan O, Kohl A, Osterhoff MA et al. (2011) Effects of weight loss and long-term
weight maintenance with diets varying in protein and glycemic index on cardiovascular risk
factors: The diet, obesity, and genes (diogenes) study: A randomized, controlled trial.
Circulation 124(25), 2829-2838.
19. Health Canada (2012). Eating Well with Canada's Food Guide. http://www.hc-sc.gc.ca/fn-
an/food-guide-aliment/index-eng.php. Accessed September 5, 2012
20. US Department of Health and Human Services (2012). 2010 Dietary guidelines for
Americans. http://www.health.gov/dietaryguidelines/. Accessed September 5, 2012
21. Temelli F (2008) All fibres are not equal: The importance of viscosity. Agro Food Industry
Hi-Tech 19(6), 6-8.
22. Fardet A (2010) New hypotheses for the health-protective mechanisms of whole-grain
cereals: What is beyond fibre? Nutrition Research Reviews 23(1), 65-134.
23. De Moura FF, Lewis KD, Falk MC (2009) Applying the FDA definition of whole grains to
the evidence for cardiovascular disease health claims. J Nutr 139(11), 2220S-2226S.
24. Health claim for barley products (2006). Health claims: Soluble fiber from certain foods and
risk of coronary heart disease (CHD). Washington, DC: FDA; 2006.
112
25. Summary of Health Canada's Assessment of a Health Claim about Barley Products and
Blood Cholesterol Lowering. Bureau of Nutritional Sciences Food Directorate, Health Products
and Food Branch Health Canada (2012).
26. Ames NP & Rhymer CR (2008) Issues surrounding health claims for barley. J Nutr 138(6),
1237S-1243S.
27. M.S. Izydorczyk (2004) BARLEY | milling and processing. pp.212-219 [Colin Wrigley,
editor]. Oxford: Elsevier.
28. Wood PJ (2007) Cereal β-glucans in diet and health. J Cereal Sci 46(3), 230-238.
29. Definition and analysis of whole grain (2010) HealthGrain
Forum. http://www.healthgrain.org/webfm_send/44. Accessed September 7, 2012
30. (1999) Definition of Whole Grain. AACC International, Available online
http://www.aaccnet.org/definitions/wholegrain.asp.
31. Jones JM (2010) Regulatory aspects of whole grain and whole grain foods: Definitions and
labeling. Cereal Chem 87(2), 150-154.
32. (2012) Health Canada. Whole Grains - Get The Facts. http://www.hc-sc.gc.ca/fn-
an/nutrition/whole-grain-entiers-eng.php. Accessed September 7, 2012
33. U.S. FDA. Health Claim Notification for Whole Grain Foods (1999). Government Printing
Office, Washington, DC
34. EFSA Panel on Dietetic Products, Nutrition and Allergies (NDA). Scientific Opinion on the
substantiation of health claims related to whole grain. (2010) EFSA Journal 8(10), 1766.
35. Summary of Health Canada's Assessment of a Health Claim about Whole Grains and
Coronary Heart Disease. Health Canada, Bureau of Nutritional Sciences, Food Directorate,
Health Products and Food Branch (2012).
36. Slavin J (2010) Whole grains and digestive health. Cereal Chem 87(4), 292-296.
37. De Munter JSL, Hu FB, Spiegelman D et al. (2007) Whole grain, bran, and germ intake and
risk of type 2 diabetes: A prospective cohort study and systematic review. PLoS Medicine 4(8),
1385-1395.
38. He M, Van Dam RM, Rimm E et al. (2010) Whole-grain, cereal fiber, bran, and germ intake
and the risks of all-cause and cardiovascular disease-specific mortality among women with type
2 diabetes mellitus. Circulation 121(20), 2162-2168.
113
39. Tighe P, Duthie G, Vaughan N et al. (2010) Effect of increased consumption of whole-grain
foods on blood pressure and other cardiovascular risk markers in healthy middle-aged persons: A
randomized controlled trial. Am J Clin Nutr 92(4), 733-740.
40. Esmaillzadeh A, Mirmiran P, Azizi F (2005) Whole-grain intake and the prevalence of
hypertriglyceridemic waist phenotype in Tehranian adults. Am J Clin Nutr 81(1), 55-63.
41. Egeberg R, Olsen A, Loft S et al. (2009) Intake of whole grain products and risk of breast
cancer by hormone receptor status and histology among postmenopausal women. International
Journal of Cancer 124(3), 745-750.
42. Mellen PB, Walsh TF, Herrington DM (2008) Whole grain intake and cardiovascular
disease: A meta-analysis. Nutrition, Metabolism and Cardiovascular Diseases 18(4), 283-290.
43. Alminger M & Eklund-Jonsson C (2008) Whole-grain cereal products based on a high-fibre
barley or oat genotype lower post-prandial glucose and insulin responses in healthy humans.
European Journal of Nutrition 47(6), 294-300.
44. Pins JJ & Kaur H (2006) A review of the effects of barley β-glucan on cardiovascular and
diabetic risk. Cereal Foods World 51(1), 8-11.
45. Pereira MA, Jacobs Jr. DR, Pins JJ et al. (2002) Effect of whole grains on insulin sensitivity
in overweight hyperinsulinemic adults. Am J Clin Nutr 75(5), 848-855.
46. Andersson A, Tengblad S, Karlström B et al. (2007) Whole-grain foods do not affect insulin
sensitivity or markers of lipid peroxidation and inflammation in healthy, moderately overweight
subjects. J Nutr 137(6), 1401-1407.
47. Brownlee IA, Moore C, Chatfield M et al. (2010) Markers of cardiovascular risk are not
changed by increased whole-grain intake: The WHOLEheart study, a randomised, controlled
dietary intervention. Br J Nutr 104(1), 125-134.
48. Cereal Foods World. Future of barley. Cereal Foods World. 2005;50:271–7.
49. Newman CW & Newman RK (2006) A brief history of barley foods. Cereal Foods World
51(1), 4-7.
50. Bhatty RS (1999) The potential of hull-less barley. Cereal Chem 76(5), 589-599.
51. Faraj A, Vasanthan T, Hoover R (2004) The effect of extrusion cooking on resistant starch
formation in waxy and regular barley flours. Food Res Int 37(5), 517-525.
52. Food and Agriculture Organization of the United Nations. (2012) FAO STAT. Food and
Agricultural commodities production. http://faostat.fao.org/site/339/default.aspx. Accessed
March 12, 2013.
114
53. Baik B- & Ullrich SE (2008) Barley for food: Characteristics, improvement, and renewed
interest. Journal of Cereal Science 48(2), 233-242.
54. Sullivan P, Arendt E, Gallagher E (2013) The increasing use of barley and barley by-
products in the production of healthier baked goods. Trends in Food Science and Technology
29(2), 124-134.
55. Fastnaught CE, Berglund PT, Holm ET et al. (1996) Genetic and environmental variation in
β-glucan content and quality parameters of barley for food. Crop Sci 36(4), 941-946.
56. MacGregor AW & Fincher GB (1993) Carbohydrates of the barley grain. Barley: Chemistry
and Technology , 73-130.
57. Izydorczyk MS & Dexter JE (2008) Barley β-glucans and arabinoxylans: Molecular
structure, physicochemical properties, and uses in food products-a Review. Food Res Int 41(9),
850-868.
58. Gamel TH & Abdel-Aal E-M (2012) Phenolic acids and antioxidant properties of barley
wholegrain and pearling fractions. Agricultural and Food Science 21(2), 118-131.
59. Bhatty RS & Rossnagel BG (1998) Comparison of pearled and unpearled Canadian and
Japanese barleys. Cereal Chem 75(1), 15-21.
60. Nilan RA & Ullrich SE (1993) Barley: Taxonomy, origin, distribution, production, genetics,
and breeding. Barley Chemistry and Technology , 1-29.
61. Bertoft E, Källman A, Koch K et al. (2011) The cluster structure of barley amylopectins of
different genetic backgrounds. Int J Biol Macromol 49(4), 441-453.
62. F.L. Stoddard (2004) STARCH | chemistry. In: Encyclopedia of Grain Science, pp.212-219
[Colin Wrigley, editor]. Oxford: Elsevier.
63. Alminger ML, Eklund-Jonsson C, Kidman S et al. (2012) Starch Microstructure and Starch
Hydrolysis in Barley and Oat Tempe during in Vitro Digestion. Food Digestion 3(1-3), 53-62.
64. Englyst KN, Liu S, Englyst HN (2007) Nutritional characterization and measurement of
dietary carbohydrates. Eur J Clin Nutr 61(SUPPL. 1), S19-S39.
65. Zhang G & Hamaker BR (2009) Slowly digestible starch: Concept, mechanism, and
proposed extended glycemic index. Crit Rev Food Sci Nutr 49(10), 852-867.
66. Nugent AP (2005) Health properties of resistant starch. Nutr Bull 30(1), 27-54.
67. Englyst KN & Englyst HN (2005) Carbohydrate bioavailability. Br J Nutr 94(1), 1-11.

115
68. Burkitt DP, Walker ARP, Painter NS (1974) Dietary fiber and disease. J Am Med Assoc
229(8), 1068-1074.
69. (2005) Dietary Reference Intakes for Energy, Carbohydrate, Fiber, Fat, Fatty Acids,
Cholesterol, Protein, and Amino Acids. (2005) Washington, DC: The National Academies of
Science, Institute of Medicine (IOM).
70. Bhatty RS (1999) β-glucan and flour yield of hull-less barley. Cereal Chem 76(2), 314-315.
71. Izydorczyk MS, Storsley J, Labossiere D et al. (2000) Variation in total and soluble β-glucan
content in hulless barley: Effects of thermal, physical, and enzymic treatments. J Agric Food
Chem 48(4), 982-989.
72. Wolever TMS, Tosh SM, Gibbs AL et al. (2010) Physicochemical properties of oat β-glucan
influence its ability to reduce serum LDL cholesterol in humans: A randomized clinical trial. Am
J Clin Nutr 92(4), 723-732.
73. AOAC 995.16. In: (1995) Official Methods of Analysis of AOAC International. Arlington,
Virginia.
74. McCleary BV & Codd R (1991) Measurement of (1 → 3),(1 → 4)‐ β‐ D‐ glucan in Barley
and Oats: A Streamlined Enzymic Procedure. John Wiley & Sons, Ltd. pp. 303-312.
http://resolver.scholarsportal.info/resolve/00225142/v55i0002/303_mo34ibaoasep.
75. Regand A, Chowdhury Z, Tosh SM et al. (2011) The molecular weight, solubility and
viscosity of oat beta-glucan affect human glycemic response by modifying starch digestibility.
Food Chem 129(2), 297-304.
76. Tosh SM, Brummer Y, Miller SS et al. (2010) Processing affects the physicochemical
properties of β-glucan in oat bran cereal. J Agric Food Chem 58(13), 7723-7730.
77. Beer MU, Wood PJ, Weisz J (1997) Molecular Weight Distribution and (1→3)(1→4)-Β-D-
Glucan Content of Consecutive Extracts of various Oat and Barley Cultivars. pp. 476-480.
78. Wood PJ (2010) Oat and rye ß-glucan: Properties and function. Cereal Chem 87(4), 315-330.
79. Robertson JA, Majsak-Newman G, Ring SG et al. (1997) Solubilisation of Mixed Linkage
(1→3), (1→4)Β-D-Glucans from Barley: Effects of Cooking and Digestion. Elsevier Science. pp.
275-283.
80. Dikeman CL & Fahey Jr. GC (2006) Viscosity as related to dietary fiber: A review. Crit Rev
Food Sci Nutr 46(8), 649-663.
81. WOOD P & FULCHER R (1978) Interaction of some Dyes with Cereal Beta-Glucans.
Cereal Chem 55(6), 952-966.

116
82. Gray D, Abdel-Aal E-M, Seetharaman K et al. (2009) Differences in carbohydrate
composition and digestion in vitro of selected barley cultivars as influenced by pearling and
cooking. Cereal Chem 86(6), 669-678.
83. Vasanthan T & Temelli F (2008) Grain fractionation technologies for cereal beta-glucan
concentration. Food Res Int 41(9), 876-881.
84. Bhatty RS (1997) Milling of regular and waxy starch hull-less barleys for the production of
bran and flour. Cereal Chem 74(6), 693-699.
85. Sullivan P, O'Flaherty J, Brunton N et al. (2010) Chemical composition and microstructure
of milled barley fractions. European Food Research and Technology 230(4), 579-595.
86. Abumweis SS, Jew S, Ames NP (2010) Β-glucan from barley and its lipid-lowering capacity:
A meta-analysis of randomized, controlled trials. Eur J Clin Nutr 64(12), 1472-1480.
87. Delahoy PJ, Magliano DJ, Webb K et al. (2009) The relationship between reduction in low-
density lipoprotein cholesterol by statins and reduction in risk of cardiovascular outcomes: An
updated meta-analysis. Clin Ther 31(2), 236-244.
88. Behall KM & Hallfrisch JG (2006) Effects of barley consumption on CVD risk factors.
Cereal Foods World 51(1), 12-15.
89. Keenan JM, Goulson M, Shamliyan T et al. (2007) The effects of concentrated barley β-
glucan on blood lipids in a population of hypercholesterolaemic men and women. Br J Nutr
97(6), 1162-1168.
90. Atkinson FS, Foster-Powell K, Brand-Miller JC (2008) International tables of glycemic
index and glycemic load values: 2008. Diabetes Care 31(12), 2281-2283.
91. Food labeling: health claims; soluble dietary fiber from certain foods and coronary heart
disease. Final rule. (2006) Federal register. 71(98), 29248-29250.
92. Keogh GF, Cooper GJS, Mulvey TB et al. (2003) Randomized controlled crossover study of
the effect of a highly β-glucan-enriched barley on cardiovascular disease risk factors in mildly
hypercholesterolemic men. Am J Clin Nutr 78(4), 711-718.
93. Biörklund M, van Rees A, Mensink RP et al. (2005) Changes in serum lipids and
postprandial glucose and insulin concentrations after consumption of beverages with β-glucans
from oats or barley: A randomised dose-controlled trial. Eur J Clin Nutr 59(11), 1272-1281.
94. Whiting DR, Guariguata L, Weil C et al. (2011) IDF Diabetes Atlas: Global estimates of the
prevalence of diabetes for 2011 and 2030. Diabetes Res Clin Pract 94(3), 311-321.
95. Brownlee M (2005) The pathobiology of diabetic complications: A unifying mechanism.
Diabetes 54(6), 1615-1625.
117
96. Blaak EE, Antoine J-, Benton D et al. (2012) Impact of postprandial glycaemia on health and
prevention of disease. Obesity Reviews 13(10), 923-984.
97. Brownlee M (2003) A radical explanation for glucose-induced β cell dysfunction. J Clin
Invest 112(12), 1788-1790.
98. Brownlee M (2001) Biochemistry and molecular cell biology of diabetic complications.
Nature 414(6865), 813-820.
99. Marciani L, Gowland PA, Spiller RC et al. (2001) Effect of meal viscosity and nutrients on
satiety, intragastric dilution, and emptying assessed by MRI. American Journal of Physiology -
Gastrointestinal and Liver Physiology 280(6 43-6), G1227-G1233.
100. Panahi S, Ezatagha A, Temelli F et al. (2007) β-glucan from two sources of oat concentrates
affect postprandial glycemia in relation to the level of viscosity. J Am Coll Nutr 26(6), 639-644.
101. Liljeberg H, Granfeldt Y, Bjorck I (1992) Metabolic responses to starch in bread containing
intact kernels versus milled flour. Eur J Clin Nutr 46(8), 561-575.
102. Granfeldt Y, Liljeberg H, Drews A et al. (1994) Glucose and insulin responses to barley
products: Influence of food structure and amylose-amylopectin ratio. Am J Clin Nutr 59(5),
1075-1082.
103. Tosh SM (2013) Review of human studies investigating the post-prandial blood-glucose
lowering ability of oat and barley food products. Eur J Clin Nutr .
104. Liljeberg HGM, Granfeldt YE, Björck IME (1996) Products based on a high fiber barley
genotype, but not on common barley or oats, lower postprandial glucose and insulin responses in
healthy humans. J Nutr 126(2), 458-466.
105. Jenkins DJA, Leeds AR, Gassull MA (1977) Decrease in postprandial insulin and glucose
concentration by guar and pectin. Annals of Internal Medicine 86(1), 20-23.
106. Crapo PA, Reaven G, Olefsky J (1977) Postprandial plasma-glucose and -insulin responses
to different complex carbohydrates. Diabetes 26(12), 1178-1183.
107. Jenkins DJA, Goff DV, Leeds AR (1976) Unabsorbable carbohydrates and diabetes:
decreased post prandial hyperglycaemia. Lancet 2(7978), 172-174.
108. Jenkins DJA, Wolever TMS, Taylor RH (1980) Exceptionally low blood glucose response
to dried beans: Comparison with other carbohydrate foods. British Medical Journal 281(6240),
578-580.
109. Vaaler S, Hanssen KF, Aagenaes O (1980) Plasma glucose and insulin responses to orally
administered carbohydrate-rich foodstuffs. Nutrition and Metabolism 24(3), 168-175.

118
110. Wolever TMS, Jenkins DJA, Jenkins AL et al. (1991) The glycemic index: Methodology
and clinical implications. American Journal of Clinical Nutrition 54(5), 846-854.
111. Wolever TMS (2004) Effect of blood sampling schedule and method of calculating the area
under the curve on validity and precision of glycaemic index values. British Journal of Nutrition
91(2), 295-300.
112. Brouns F, Bjorck I, Frayn KN et al. (2005) Glycaemic index methodology. Nutrition
Research Reviews 18(1), 145-171.
113. Australian Standards Organization. Glycemic Index of Foods AS4694-2007.
http://infostore.saiglobal.com/store/Details.aspx?DocN=AS0733779662AT. Accessed October 3,
2008.
114. Wolever TMS, Vorster HH, Bj rck I et al. (2003) Determination of the glycaemic index of
foods: Interlaboratory study. European Journal of Clinical Nutrition 57(3), 475-482.
115. Wolever TMS, Brand-Miller JC, Abernethy J et al. (2008) Measuring the glycemic index of
foods: Interlaboratory study. Am J Clin Nutr 87(1), 247S-257S.
116. Salmer n J, Ascherio A, Rimm EB et al. (1997) Dietary fiber, glycemic load, and risk of
NIDDM in men. Diabetes Care 20(4), 545-550.
117. Salmer n J, Manson JE, Stampfer MJ et al. (1997) Dietary fiber, glycemic load, and risk of
non-insulin-dependent diabetes mellitus in women. Journal of the American Medical Association
277(6), 472-477.
118. Schulze MB, Liu S, Rimm EB et al. (2004) Glycemic index, glycemic load, and dietary
fiber intake and incidence of type 2 diabetes in younger and middle-aged women. American
Journal of Clinical Nutrition 80(2), 348-356.
119. Chiu C-, Liu S, Willett WC et al. (2011) Informing food choices and health outcomes by
use of the dietary glycemic index. Nutr Rev 69(4), 231-242.
120. Larsen TM, Dalskov S-, Van Baak M et al. (2010) Diets with high or low protein content
and glycemic index for weight-loss maintenance. N Engl J Med 363(22), 2102-2113.
121. Oh K, Hu FB, Cho E et al. (2005) Carbohydrate intake, glycemic index, glycemic load, and
dietary fiber in relation to risk of stroke in women. Am J Epidemiol 161(2), 161-169.
122. Silva FM, Steemburgo T, de Mello VD et al. (2011) High dietary glycemic index and low
fiber content are associated with metabolic syndrome in patients with type 2 diabetes. J Am Coll
Nutr 30(2), 141-148.

119
123. Shikany JM, Flood AP, Kitahara CM et al. (2011) Dietary carbohydrate, glycemic index,
glycemic load, and risk of prostate cancer in the Prostate, Lung, Colorectal, and Ovarian Cancer
Screening Trial (PLCO) cohort. Cancer Causes and Control 22(7), 995-1002.
124. Dong J- & Qin L- (2011) Dietary glycemic index, glycemic load, and risk of breast cancer:
Meta-analysis of prospective cohort studies. Breast Cancer Res Treat 126(2), 287-294.
125. Poutanen K, Shepherd R, Shewry PR et al. (2008) Beyond whole grain: The European
HEALTHGRAIN project aims at healthier cereal foods. Cereal Foods World 53(1), 32-35.
126. Slavin J & Green H (2007) Dietary fibre and satiety. Nutr Bull 32(SUPPL.1), 32-42.
127. Brand-Miller JC, Holt SHA, Pawlak DB et al. (2002) Glycemic index and obesity.
American Journal of Clinical Nutrition 76(1), 281S-285S.
128. Ludwig DS, Majzoub JA, Al-Zahrani A et al. (1999) High glycemic index foods,
overeating, and obesity. Pediatrics 103(3).
129. Ludwig DS (2003) Dietary glycemic index and the regulation of body weight. Lipids 38(2),
117-121.
130. Thomas DE, Elliott EJ, Baur L (2007) Low glycaemic index or low glycaemic load diets for
overweight and obesity. Cochrane database of systematic reviews (Online) (3).
131. MAYER J (1953) Glucostatic mechanism of regulation of food intake. N Engl J Med
249(1), 13-16.
132. Wolever TMS, Leung J, Vuksan V et al. (2009) Day-to-day variation in glycemic response
elicited by white bread is not related to variation in satiety in humans. Appetite 52(3), 654-658.
133. Anderson GH & Woodend D (2003) Effect of glycemic carbohydrates on short-term satiety
and food intake. Nutr Rev 61(5 II), S17-S26.
134. Aston LM, Stokes CS, Jebb SA (2008) No effect of a diet with a reduced glycaemic index
on satiety, energy intake and body weight in overweight and obese women. Int J Obes 32(1),
160-165.
135. Liu AG, Most MM, Brashear MM et al. (2012) Reducing the glycemic index or
carbohydrate content of mixed meals reduces postprandial glycemia and insulinemia over the
entire day but does not affect satiety. Diabetes Care 35(8), 1633-1637.
136. Ludwig DS, Pereira MA, Kroenke CH et al. (1999) Dietary fiber, weight gain, and
cardiovascular disease risk factors in young adults. J Am Med Assoc 282(16), 1539-1546.
120
137. Samra RA & Anderson GH (2007) Insoluble cereal fiber reduces appetite and short-term
food intake and glycemic response to food consumed 75 min later by healthy men. Am J Clin
Nutr 86(4), 972-979.
138. Hamedani A, Akhavan T, Samra RA et al. (2009) Reduced energy intake at breakfast is not
compensated for at lunch if a high-insoluble-fiber cereal replaces a low-fiber cereal. Am J Clin
Nutr 89(5), 1343-1349.
139. Freeland KR, Anderson GH, Wolever TMS (2009) Acute effects of dietary fibre and
glycaemic carbohydrate on appetite and food intake in healthy males. Appetite 52(1), 58-64.
140. Mattes RD (2007) Effects of a combination fiber system on appetite and energy intake in
overweight humans. Physiology and Behavior 90(5), 705-711.
141. Liljeberg HGM, Åkerberg AKE, Björck IME (1999) Effect of the glycemic index and
content of indigestible carbohydrates of cereal-based breakfast meals on glucose tolerance at
lunch in healthy subjects. Am J Clin Nutr 69(4), 647-655.
142. Nilsson AC, Östman EM, Holst JJ et al. (2008) Including indigestible carbohydrates in the
evening meal of healthy subjects improves glucose tolerance, lowers inflammatory markers, and
increases satiety after a subsequent standardized breakfast. J Nutr 138(4), 732-739.
143. Kaplan RJ & Greenwood CE (2002) Influence of dietary carbohydrates and glycaemic
response on subjective appetite and food intake in healthy elderly persons. Int J Food Sci Nutr
53(4), 305-316.
144. Cassady BA, Considine RV, Mattes RD (2012) Beverage consumption, appetite, and energy
intake: What did you expect? Am J Clin Nutr 95(3), 587-593.
145. EFSA Panel on Dietetic Products, Nutrition and Allergies (NDA). Scientific Opinion on the
substantiation of health claims related to beta-glucans from oats and barley and maintenance of
normal blood LDL-cholesterol concentrations, increase in satiety leading to a reduction in
energy intake, reduction of post-prandial glycaemic responses, and “digestive function”. (2011)
EFSA Journal 9(6), 2207.
146. (2012) Draft Guidance Document - Satiety Health Claims on Food. Health Canada,
Bureau of Nutritional Sciences, Food Directorate, Health Products and Food Branch.
147. Willett W, Manson J, Liu S (2002) Glycemic index, glycemic load, and risk of type 2
diabetes. American Journal of Clinical Nutrition 76(1), 274S-280S.
148. Wolever TMS (2006) The Glycaemic Index : A Physiological Classification of Dietary
Carbohydrate. Cambridge, MA, USA: CABI Pub.
149. Englyst KN, Vinoy S, Englyst HN et al. (2003) Glycaemic index of cereal products
explained by their content of rapidly and slowly available glucose. Br J Nutr 89(3), 329-339.
121
150. Ho KM, Choo TM, Martin RA et al. (2000) AC Parkhill barley. Can.J.Plant Sci 80, 339-
340.
151. Rossnagel BG, Zatorski T, Arganosa G (2005) Food barley development at the Crop
Development Centre, University of Saskatchewan. Proc. 18th North American Barley
Researchers Workshop. 4th Canadian Barley Symp .
152. AACC International (2000) Approved Methods of the American Association of Cereal
Chemists. 10th ed. American Association of Cereal Chemists. St. Paul, Minn.
153. Wolever TMS & Bolognesi C (1996) Source and amount of carbohydrate affect
postprandial glucose and insulin in normal subjects. J Nutr 126(11), 2798-2806.
154. Snedecor GW & Cochran WG (1967) Statistical Methods. 6th ed. ed. Ames,Iowa State
University Press[1967]: .
155. Foster-Powell K & Miller JB (1995) International tables of glycemic index. American
Journal of Clinical Nutrition 62(4), 871S-893S.
156. Burton PM, Monro JA, Alvarez L et al. (2011) Glycemic impact and health: New horizons
in white bread formulations. Crit Rev Food Sci Nutr 51(10), 965-982.
157. Lan-Pidhainy X, Brummer Y, Tosh SM et al. (2007) Reducing beta-glucan solubility in oat
bran muffins by freeze-thaw treatment attenuates its hypoglycemic effect. Cereal Chem 84(5),
512-517.
158. Tosh SM, Brummer Y, Wolever TMS et al. (2008) Glycemic response to oat bran muffins
treated to vary molecular weight of β-glucan. Cereal Chem 85(2), 211-217.
159. Chillo S, Ranawana DV, Pratt M et al. (2011) Glycemic response and glycemic index of
semolina spaghetti enriched with barley β-glucan. Nutrition 27(6), 653-658.
160. Thondre PS & Henry CJK (2009) High-molecular-weight barley β-glucan in chapatis
(unleavened Indian flatbread) lowers glycemic index. Nutr Res 29(7), 480-486.
161. Brand-Miller J & Holt S (2004) Testing the glycaemic index of foods: In vivo, not in vitro.
Eur J Clin Nutr 58(4), 700-701.
162. Björck I, Liljeberg H, Östman E (2000) Low glycaemic-index foods. Br J Nutr 83(SUPPL.
1), S149-S155.
163. Lan-Pidhainy X & Wolever TMS (2011) Are the glycemic and insulinemic index values of
carbohydrate foods similar in healthy control, hyperinsulinemic and type 2 diabetic patients. Eur
J Clin Nutr 65(6), 727-734.

122
164. Ford H & Frost G (2010) Session 3 (Joint with the British Dietetic Association):
Management of obesity: Glycaemic index, appetite and body weight. Proc Nutr Soc 69(2), 199-
203.
165. Ludwig DS (2007) Clinical update: the low-glycaemic-index diet. Lancet 369(9565), 890-
892.
166. Wanders AJ, Jonathan MC, Van Den Borne JJGC et al. (2013) The effects of bulking,
viscous and gel-forming dietary fibres on satiation. Br J Nutr 109(7), 1330-1337.
167. Hu FB (2010) Are refined carbohydrates worse than saturated fat? Am J Clin Nutr 91(6),
1541-1542.
168. Aldughpassi A, Abdel-Aal EM, Wolever TMS (2012) Barley cultivar, kernel composition,
and processing affect the glycemic index. J Nutr 142(9), 1666-1671.
169. Flood-Obbagy JE & Rolls BJ (2009) The effect of fruit in different forms on energy intake
and satiety at a meal. Appetite 52(2), 416-422.
170. DiMeglio DP & Mattes RD (2000) Liquid versus solid carbohydrate: Effects on food intake
and body weight. Int J Obes 24(6), 794-800.
171. Keogh JB, Lau CWH, Noakes M et al. (2007) Effects of meals with high soluble fibre, high
amylose barley variant on glucose, insulin, satiety and thermic effect of food in healthy lean
women. Eur J Clin Nutr 61(5), 597-604.
172. Peters HPF, Boers HM, Haddeman E et al. (2009) No effect of added β-glucan or of
fructooligosaccharide on appetite or energy intake. Am J Clin Nutr 89(1), 58-63.
173. Geliebter A, Lee MI-, Abdillahi M et al. (2013) Satiety following intake of potatoes and
other carbohydrate test meals. Annals of Nutrition and Metabolism 62(1), 37-43.
174. Behall KM, Scholfield DJ, Hallfrisch JG (2006) Barley β-glucan reduces plasma glucose
and insulin responses compared with resistant starch in men. Nutr Res 26(12), 644-650.
175. Juvonen KR, Purhonen A-, Salmenkallio-Marttila M et al. (2009) Viscosity of oat bran-
enriched beverages influences gastrointestinal hormonal responses in healthy humans. J Nutr
139(3), 461-466.
176. Nutrition and allergies (NDA). Scientific opinion on the substantiation of health claims
related to beta-glucans and maintenance of normal blood cholesterol concentrations. (2009)
EFSA J 7, 1254.
177. Brummer Y, Duss R, Wolever TMS et al. (2012) Glycemic response to extruded oat bran
cereals processed to vary in molecular weight. Cereal Chem 89(5), 255-261.
123
178. Gamel TH, Abdel-Aal E-M, Wood PJ et al. (2012) Application of the rapid Visco Analyzer
(RVA) as an effective rheological tool for measurement of β-glucan viscosity. Cereal Chem
89(1), 52-58.
179. Gray D, Abdel-Aal E-M, Seetharaman K et al. (2010) Differences in viscosity and textural
properties of selected barley cultivars as influenced by pearling and cooking. Food Chem 120(2),
402-409.
180. Dickinson S, Hancock DP, Petocz P et al. (2008) High-glycemic index carbohydrate
increases nuclear factor-κB activation in mononuclear cells of young, lean healthy subjects1-3.
American Journal of Clinical Nutrition 87(5), 1188-1193.
181. Juvonen KR, Purhonen A-, Salmenkallio-Marttila M et al. (2009) Viscosity of oat bran-
enriched beverages influences gastrointestinal hormonal responses in healthy humans. J Nutr
139(3), 461-466.
182. Holt SHA, Brand Miller JC, Petocz P et al. (1995) A satiety index of common foods. Eur J
Clin Nutr 49(9), 675-690.
183. Holt SHA, Brand Miller JC, Petocz P (1996) Interrelationships among postprandial satiety,
glucose and insulin responses and changes in subsequent food intake. Eur J Clin Nutr 50(12),
788-797.
184. Holt SHA & Miller JB (1995) Increased insulin responses to ingested foods are associated
with lessened satiety. Appetite 24(1), 43-54.
185. Holt SHA, Brand-Miller JC, Stitt PA (2001) The effects of equal-energy portions of
different breads on blood glucose levels, feelings of fullness and subsequent food intake. J Am
Diet Assoc 101(7), 767-773.

124
10. Appendices

125
10.1 Consent Form

126

127
128

129
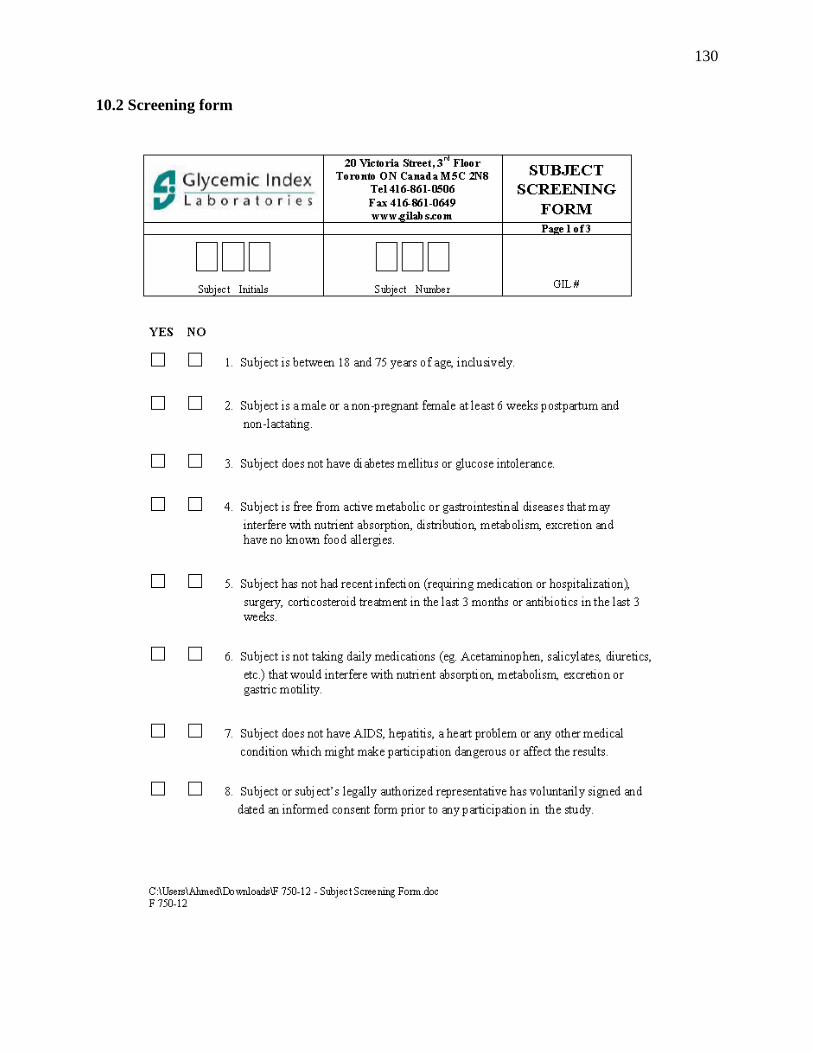
130
10.2 Screening form

131

132

133
10.3 Blood Glucose Record
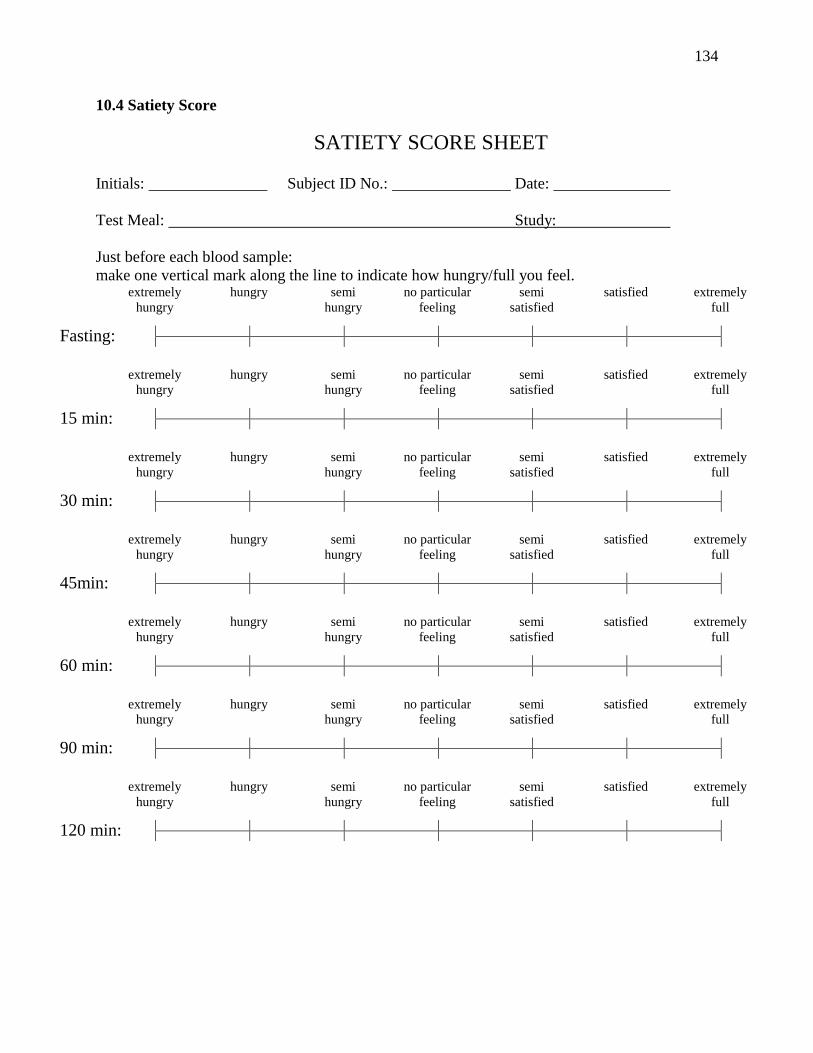
134
10.4 Satiety Score
SATIETY SCORE SHEET
Initials: Subject ID No.: Date:
Test Meal: Study:
Just before each blood sample:
make one vertical mark along the line to indicate how hungry/full you feel.
extremely
hungry
hungry semi
hungry
no particular
feeling
semi
satisfied
satisfied extremely
full
Fasting:
extremely
hungry
hungry semi
hungry
no particular
feeling
semi
satisfied
satisfied extremely
full
15 min:
extremely
hungry
hungry semi
hungry
no particular
feeling
semi
satisfied
satisfied extremely
full
30 min:
extremely
hungry
hungry semi
hungry
no particular
feeling
semi
satisfied
satisfied extremely
full
45min:
extremely
hungry
hungry semi
hungry
no particular
feeling
semi
satisfied
satisfied extremely
full
60 min:
extremely
hungry
hungry semi
hungry
no particular
feeling
semi
satisfied
satisfied extremely
full
90 min:
extremely
hungry
hungry semi
hungry
no particular
feeling
semi
satisfied
satisfied extremely
full
120 min:

135
10.5 Barley and Semolina Pasta Recipes1
1 * Only 100 g of pasta can be made in each batch using the Pstamatic Machine
CELEBRITY WG
Ingredients
100 g F-1 of Celebrity
1g salt
1 g Xanthan
70g water
86 µL Annato
Cooking
2 min dry Mixing
13 min wet mixing
5 min boiling
Serving Size: 224.4g
CELEBRITY WP
Ingredients
100 g F-4 of Celebrity Barley
1g salt
1 g Xanthan
60 g water
81.0µL Annato
Cooking
2 min dry Mixing
13 min wet mixing
5 min boiling
Serving Size: 207.7g
AC-PARKHILL WG
Ingredients
100 g F-1 of AC-PARKHILL
1g salt
1 g Xanthan
65 g water
83.5 µL Annato
Cooking
2 min dry Mixing
13 min wet mixing
5 min boiling
Serving Size: 199.1g
AC-PARKHILL WP
Ingredients
100 g F-4 of AC-PARKHILL
1g salt
1 g Xanthan
60 g water
81 µL Annato
Cooking
2 min dry Mixing
13 min wet mixing
5 min boiling
Serving Size: 182.6
SEMOLINA
Ingredients
100 g semolina
1 g salt
35 g water
Cooking
2 min dry mixing
3 min wet mixing
20min boiling
Serving Size: 205.5g
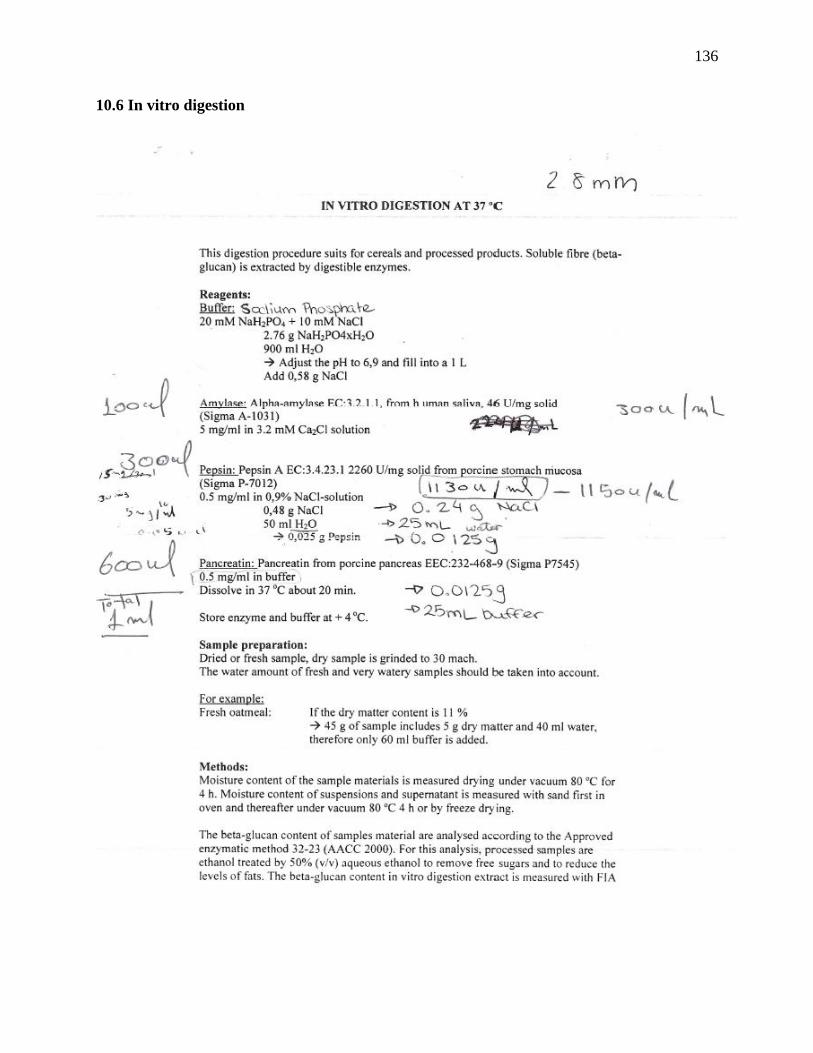
136
10.6 In vitro digestion