Physiological and Biochemical Aspects of Methionine ...€¦ · Physiological and Biochemical...
218
Physiological and Biochemical Aspects of Methionine Isomers and Precursors in Broilers by Shuai Zhang Dissertation submitted to the Graduate Faculty of the Virginia Polytechnic Institute and State University in partial fulfillment of the requirements for the degree of DOCTOR OF PHILOSOPHY in Animal and Poultry Sciences Eric A. Wong, Co-Chair Elizabeth R. Gilbert, Co-Chair Michael E. Persia Benjamin A. Corl June 3, 2016 Blacksburg, VA Key Words: L-Met, DL-Met, DL-HMTBA, Met deficiency, Broiler chicken Copyright 2016, Shuai Zhang
Transcript of Physiological and Biochemical Aspects of Methionine ...€¦ · Physiological and Biochemical...

Physiological and Biochemical Aspects of Methionine Isomers and Precursors
in Broilers
by
Shuai Zhang
Dissertation submitted to the Graduate Faculty of the Virginia Polytechnic Institute and State
University in partial fulfillment of the requirements for the degree of
DOCTOR OF PHILOSOPHY
in
Animal and Poultry Sciences
Eric A. Wong, Co-Chair
Elizabeth R. Gilbert, Co-Chair
Michael E. Persia
Benjamin A. Corl
June 3, 2016
Blacksburg, VA
Key Words: L-Met, DL-Met, DL-HMTBA, Met deficiency, Broiler chicken
Copyright 2016, Shuai Zhang

Physiological and Biochemical Aspects of Methionine Isomers and Precursors in Broilers
Shuai Zhang
ABSTRACT
Methionine (Met) is an essential amino acid for animals and also the first limiting amino acid in
a broiler diet. The dietary supplemental Met sources include the natural isoform L-methionine
(L-Met), the synthetic form DL-methionine (DL-Met) and the synthetic Met precursor DL-2-
hydroxy-4 (methylthio)-butanoic acid (DL-HMTBA). The objective of this dissertation was to
determine the effect of different dietary Met source supplementation and Met deficiency on a
series of physiological and biochemical aspects, including growth performance, global DNA
methylation and methyltransferase activity, blood antioxidant profile (e.g., acute phase protein,
leukocyte count), intestinal nutrient transporter gene expression, Met converting enzyme gene
expression and activity, oxidative stress markers, and a potential pathway related to amino acid
signaling. To achieve this goal, male Cobb-500 broilers were raised from day of hatch (d0) to
d35 post-hatch and fed a diet deficient in methionine and cysteine (Met + Cys) (control) or the
same diet supplemented with 0.22% DL-Met, 0.22% L-Met or 0.31% DL-HMTBA (to provide
0.22% DL-Met equivalent) to meet Met + Cys requirements. Tissues (liver, breast muscle,
duodenum, jejunum and ileum) and blood samples were collected at various ages from d0 to d35
for analysis. Met supplementation significantly improved body weight gain and feed efficiency
compared to the Met deficient group, but no differences were observed among DL-Met, L-Met
and DL-HMTBA for growth performance parameters (P > 0.05). Met supplementation had no
effect on red blood cell packed cell volume, white blood cell differential count, hepatic total

iii
DNA methylation, DNA methyltransferase and Met oxidase activity, and had limited effects on
activation of p70S6K, a key amino acid signaling protein (P > 0.05). Although dietary Met
sources did not change oxidative status of the treated chickens, both L-Met and DL-Met but not
DL-HMTBA supplementation decreased the level of acute phase protein serum amyloid A
compared to the control group (P ≤ 0.05). The effect of Met supplementation on gene expression
of nutrient transporters and Met converting enzymes were complex and dynamic. Most of the
target genes demonstrated tissue- and development-dependent expression patterns, with few
significant treatment effects observed. L-Met and DL-Met but not DL-HMTBA supplementation
enhanced the neutral amino acid transporters ATB0,+ and B0AT gene expression in various small
intestinal segments. All three Met sources increased monocarboxylic acid transporter (MCT1)
gene expression in the jejunum. DL-HMTBA and L-Met fed chickens showed greater hepatic L-
HMTBA oxidase (HAO1) gene expression. DL-Met increased glutamic-oxaloacetic
transaminase 2 (GOT2) gene expression in the duodenum. An in vitro study with tissue explants,
however, did not demonstrate a similar gene expression pattern as that in the in vivo study.
Lastly, RNA sequencing results illustrated that Met deficiency could lead to many differentially
expressed genes but different supplemental Met sources had no influence on hepatic gene
expression profiles. In conclusion, as common dietary supplemental Met sources, L-Met, DL-
Met and DL-HMTBA exhibited similarity in impacting intestinal amino
acid/peptide/monocarboxylic acid transporter gene expression and Met converting enzyme
activity. The regulatory roles of Met as an antioxidant and nutrient signaling in cell metabolism
were not affected by different dietary supplemental Met sources.

iv
ACKNOWLEDGEMENTS
I would like to take this opportunity to express my gratitude to everyone who helped me during
the four years of my graduate study at Virginia Tech.
Dr. Wong: It is really lucky that I can be one of your Ph.D. students. No words can convey the
appreciation that I have for all the guidance and support you have provided for me. You are not
only a very nice supervisor, helping me with manuscript and presentation revising and lab
techniques instruction, but also a life model, showing me what a successful scientist is. I am
deeply impressed by your enthusiasm to scientific research and your thoughtfulness to solve
problems. I can still remember the first sampling day for my chicken trial in 2014, when you and
Dr. Gilbert stayed at the farm from 8AM to 8PM helping with the sampling. Without all of your
help, I cannot make it. Thank you for always having an open door policy and your valuable
suggestions. Thank you for your solid support to let me pursue my interest in statistics. Thank
you for your consideration to make me finish the degree one semester early. You have made a
significant difference in my life! I admire you and hope to be a professor like you in the future.
Dr. Gilbert: I am really grateful for the opportunity you gave me to begin my graduate study in
the United States, and the effort you brought Dr. Wong to be my co-advisor. I am also really
grateful for your kindness, encouragement and support to me in my research, courses and life
during the four years abroad. I have learned so much being your TA in the animal nutrition
course. Your comprehensive knowledge in nutrition and molecular biology (and also food and
movie), efficiency on working, and kindness to students all have greatly impressed me. Thank
you for always supporting me, to have my research and review articles published, to pursue the
statistics degree, and to start my career in China after graduation. You are also a very big

v
motivation for me to improve my cooking skills. I am really happy that you like my Chinese
dishes. I am so proud to be your graduate student and I hope I can make you proud in the future!
Dr. Persia: You provided so many important background knowledge on traditional poultry
nutrition for my research. I really appreciate your challenging questions and novel ideas that
deepened my thoughts. Thanks for showing me how to combine the statistical skills into
practical research. Thanks for teaching me how to connect the molecular results with the animal
physiology to tell a story. Thanks for always having an open door policy and your kind help on
my dissertation.
Dr. Corl: Your nutrition course is the first course I took when I just came here for graduate
study four years ago. I learned so much through your amazing teaching. I am very appreciative
that you can serve on my Ph.D. committee. Thanks for your constructional suggestions on the
statistical analysis of my data, as well as your guidance on the molecular research. Thanks for
your kind help on my dissertation.
Dr. Behnam Saremi: Thanks for your insightful comments on my research proposals,
conference abstracts, and the submitted manuscripts. Your strict requirements make me think
thoughtfully and always keep a high standard in research. Thanks for all the challenges and
encouragement you gave me during my Ph.D. study.
Dr. Rami Dalloul: Thanks for your knowledge support on avain immunology. Thanks for
helping me get the fertilized eggs. Thanks for your open door policy and kind smile.
Dr. Samer EI-Kadi: Thanks for your patient explanation on plasma amino acid analysis and
GC-MS. Thanks for teaching me to use the freeze-dry machine. Thanks for your open door
policy and warm greeting.

vi
Dr. Avigdor Cahaner: Thanks for your patience and so detailed support on statistical analysis
of my data.
Dr. Siegel: I am so impressed about your dedication to academia. Your presence at the chicken
farm and Litton Reaves always inspires me to work harder. Your kindness and humor teach me
what is the right life attitude. Thanks for providing the facilities for my trial.
Amy Tanner: Thanks for the great support on the titanium dioxide measurement. Thanks for the
kind help to deal with my order mistake. It is a great pleasure to know you.
Patricia Williams and Barbara Self: Thanks for providing outstanding technical support. I am
really appreciative of your patience.
Dr. Mark Cline: Thanks for your help on hypothalamus sampling. I am inspired by your
rigorous attitude towards scientific research.
Dr. Sally Johnson: Thanks for your concern for my research and career. Thanks for your open
door policy and warm smile.
Evonik Nutrition & Care GmbH and John Lee Pratt Foundation: Thanks for providing
financial support for my Ph.D. study.
Special acknowledgement is extended to my colleagues in Dr. Wong’s lab, Shengchen Su, Javier
Garcia, Melodie (Ingraham) Weintraut, Haihan Zhang, and Dr. Huifeng Li (Tom), and those in
Dr. Gilbert’s lab, Dr. Wei Zhang (Lacee), Dr. Lindsay Sumners, Laura Nelson, Dr. Shiping Bai,
Brittany Rice, Doug Gantt, Guoqing Wang, Dr. Jiaqing Yi, Xiangping Fu and undergraduates in
both labs for helping me with the chicken trials, as well as for their patient discussion,
suggestions and encouragement. I would not finish this dissertation without your help.

vii
I am also indebted to all the other faculty, staff and graduate students in the Animal and Poultry
Sciences Department for their help with my Ph.D. study. I would also like to thank all my friends
in Blacksburg as well as in China. Your friendship has made my graduate life wonderful.
Lastly, I wish to express my sincere gratitude to my parents, for giving me the gift of life.
Thanks for your understanding and support for me to study abroad, and all of the encouragement
throughout my academic endeavors. I love you and will never forget all of your sacrifices!

viii
TABLE OF CONTENTS
ABSTRACT .................................................................................................................................. iii
ACKNOWLEDGEMENTS ........................................................................................................ iv
TABLE OF CONTENTS .......................................................................................................... viii
LIST OF TABLES ....................................................................................................................... xi
LIST OF FIGURES ................................................................................................................... xiv
ABBREVIATIONS .................................................................................................................... xvi
CHAPTER 1 Introduction .......................................................................................................... 1
CHAPTER 2 Literature Review ................................................................................................. 6
2.1 Introduction ............................................................................................................................. 6
2.2 Amino acid and peptide absorption and transport in the small intestine ......................... 7
2.3 Utilization of different dietary supplemental methionine sources in poultry ................. 11
2.3.1 Absorption and transport of dietary L-Met, DL-Met and DL-HMTBA .............................. 11
2.3.2 Conversion and metabolism of dietary L-Met, DL-Met and DL-HMTBA ......................... 14
2.3.3 The bio-efficacy of L-Met, DL-Met and DL-HMTBA in poultry ....................................... 17
2.4 Utilization of different dietary supplemental methionine sources in other ..................... 21
livestock species ........................................................................................................................... 21
2.4.1. Utilization of dietary L-Met, DL-Met and DL-HMTBA in swine ..................................... 21
2.4.2 Utilization of dietary DL-HMTBA in ruminants ................................................................. 22
2.5 Antioxidant potential of DL-HMTBA ................................................................................. 24
2.6 Summary and perspective .................................................................................................... 27
LITERATURE CITED .............................................................................................................. 28
CHAPTER 3 DNA Methylation, Blood Profile and Intestinal Nutrient Transporter Gene
Expression in Broiler Chickens Fed Methionine Isomers or Precursors .............................. 40
3.1 Abstract .................................................................................................................................. 40
3.2 Introduction ........................................................................................................................... 42
3.3 Materials and Methods ......................................................................................................... 45
3.3.1 Animals ................................................................................................................................ 45
3.3.2 Dry matter digestibility ........................................................................................................ 47

ix
3.3.3 Global DNA methylation and DNA methyltransferase activity .......................................... 48
3.3.4 Blood profiling ..................................................................................................................... 48
3.3.5 Nutrient transporter gene expression ................................................................................... 49
3.3.6 Data analysis ........................................................................................................................ 51
3.4 Results .................................................................................................................................... 52
3.4.1 Growth performance ............................................................................................................ 52
3.4.2 Blood profile ........................................................................................................................ 53
3.4.3 Global DNA methylation and DNA methyltransferase (DNMT) activity........................... 54
3.4.4 Nutrient transporter gene expression ................................................................................... 54
3.5 Discussion............................................................................................................................... 56
LITERATURE CITED .............................................................................................................. 63
CHAPTER 4 Methionine Converting Enzymes, Oxidative Stress Markers and Amino Acid
Signaling in Broiler Chickens Fed Methionine Isomers or Precursors ................................. 83
4.1 Abstract .................................................................................................................................. 83
4.2 Introduction ........................................................................................................................... 85
4.3 Materials and Methods ......................................................................................................... 88
4.3.1 Animals ................................................................................................................................ 88
4.3.2 Met converting enzyme gene expression ............................................................................. 88
4.3.3 Enzymatic activity of Met oxidases ..................................................................................... 89
4.3.4 In situ hybridization of Met oxidases................................................................................... 90
4.3.5 Assays for oxidative stress markers ..................................................................................... 91
4.3.6 Western blot assay for p70S6K expression ......................................................................... 93
4.3.7 Data analysis ........................................................................................................................ 95
4.4 Results .................................................................................................................................... 96
4.4.1 Met converting enzyme gene expression ............................................................................. 96
4.4.2 Enzymatic activity of Met oxidases ..................................................................................... 98
4.4.3 In situ hybridization of Met oxidases................................................................................... 99
4.4.4 Assays for oxidative stress markers ................................................................................... 100
4.4.5 Western blot assay for p70S6K expression ....................................................................... 101
4.5 Discussion............................................................................................................................. 102
LITERATURE CITED ............................................................................................................ 111

x
CHAPTER 5 Expression of Intestinal Nutrient Transporters and Methionine Oxidases in
In Vitro Cultured Chicken Tissues Supplemented with Methionine Isomers or Precursors
..................................................................................................................................................... 149
5.1 Abstract ................................................................................................................................ 149
5.2 Introduction ......................................................................................................................... 151
5.3 Materials and Methods ....................................................................................................... 152
5.3.1 Animals and tissue culture ................................................................................................. 152
5.3.2 Tissue viability estimation and real-time PCR assay ......................................................... 153
5.3.3 Data analysis ...................................................................................................................... 153
5.4 Results .................................................................................................................................. 154
5.5 Discussion............................................................................................................................. 155
LITERATURE CITED ............................................................................................................ 159
CHAPTER 6 Hepatic Gene Expression via RNA Sequencing in Broiler Chickens Fed
Methionine Isomers or Precursors .......................................................................................... 168
6.1 Abstract ................................................................................................................................ 168
6.2 Introduction ......................................................................................................................... 169
6.3 Materials and Methods ....................................................................................................... 169
6.3.1 Animals .............................................................................................................................. 169
6.3.2 Total RNA extraction and sequencing ............................................................................... 169
6.3.3 Mapping and data analysis ................................................................................................. 170
6.4 Results and discussion ........................................................................................................ 171
LITERATURE CITED ............................................................................................................ 175
CHAPTER 7 Epilogue ............................................................................................................. 189
APPENDIX A ............................................................................................................................ 197
APPENDIX B ............................................................................................................................ 199
APPENDIX C ............................................................................................................................ 201
xi
LIST OF TABLES
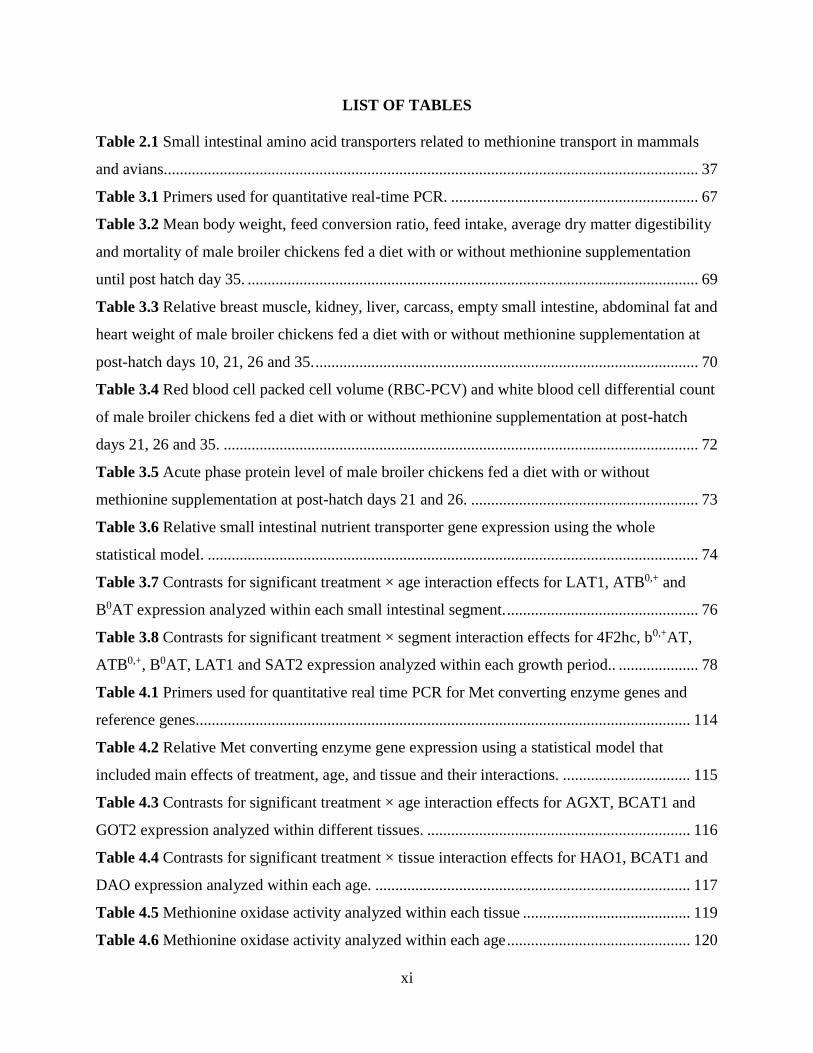
Table 2.1 Small intestinal amino acid transporters related to methionine transport in mammals
and avians...................................................................................................................................... 37
Table 3.1 Primers used for quantitative real-time PCR. .............................................................. 67
Table 3.2 Mean body weight, feed conversion ratio, feed intake, average dry matter digestibility
and mortality of male broiler chickens fed a diet with or without methionine supplementation
until post hatch day 35. ................................................................................................................. 69
Table 3.3 Relative breast muscle, kidney, liver, carcass, empty small intestine, abdominal fat and
heart weight of male broiler chickens fed a diet with or without methionine supplementation at
post-hatch days 10, 21, 26 and 35. ................................................................................................ 70
Table 3.4 Red blood cell packed cell volume (RBC-PCV) and white blood cell differential count
of male broiler chickens fed a diet with or without methionine supplementation at post-hatch
days 21, 26 and 35. ....................................................................................................................... 72
Table 3.5 Acute phase protein level of male broiler chickens fed a diet with or without
methionine supplementation at post-hatch days 21 and 26. ......................................................... 73
Table 3.6 Relative small intestinal nutrient transporter gene expression using the whole
statistical model. ........................................................................................................................... 74
Table 3.7 Contrasts for significant treatment × age interaction effects for LAT1, ATB0,+ and
B0AT expression analyzed within each small intestinal segment. ................................................ 76
Table 3.8 Contrasts for significant treatment × segment interaction effects for 4F2hc, b0,+AT,
ATB0,+, B0AT, LAT1 and SAT2 expression analyzed within each growth period.. .................... 78
Table 4.1 Primers used for quantitative real time PCR for Met converting enzyme genes and
reference genes............................................................................................................................ 114
Table 4.2 Relative Met converting enzyme gene expression using a statistical model that
included main effects of treatment, age, and tissue and their interactions. ................................ 115
Table 4.3 Contrasts for significant treatment × age interaction effects for AGXT, BCAT1 and
GOT2 expression analyzed within different tissues. .................................................................. 116
Table 4.4 Contrasts for significant treatment × tissue interaction effects for HAO1, BCAT1 and
DAO expression analyzed within each age. ............................................................................... 117
Table 4.5 Methionine oxidase activity analyzed within each tissue .......................................... 119
Table 4.6 Methionine oxidase activity analyzed within each age .............................................. 120
xii
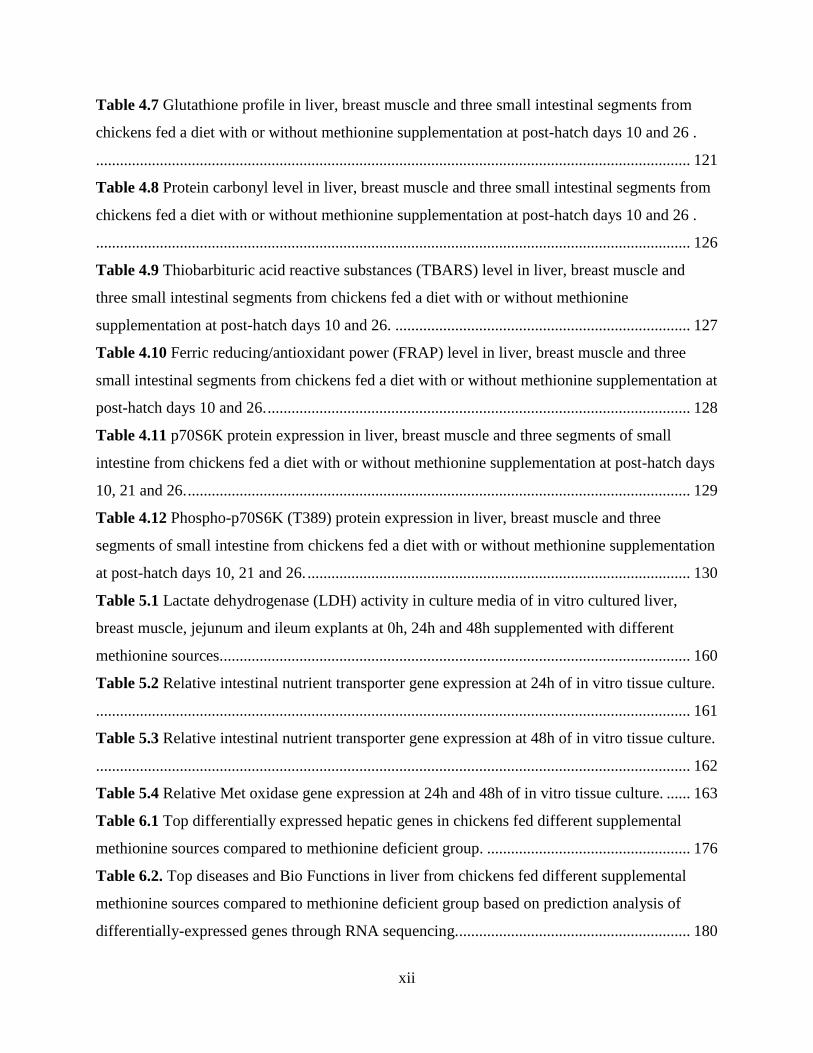
Table 4.7 Glutathione profile in liver, breast muscle and three small intestinal segments from
chickens fed a diet with or without methionine supplementation at post-hatch days 10 and 26 .
..................................................................................................................................................... 121
Table 4.8 Protein carbonyl level in liver, breast muscle and three small intestinal segments from
chickens fed a diet with or without methionine supplementation at post-hatch days 10 and 26 .
..................................................................................................................................................... 126
Table 4.9 Thiobarbituric acid reactive substances (TBARS) level in liver, breast muscle and
three small intestinal segments from chickens fed a diet with or without methionine
supplementation at post-hatch days 10 and 26. .......................................................................... 127
Table 4.10 Ferric reducing/antioxidant power (FRAP) level in liver, breast muscle and three
small intestinal segments from chickens fed a diet with or without methionine supplementation at
post-hatch days 10 and 26. .......................................................................................................... 128
Table 4.11 p70S6K protein expression in liver, breast muscle and three segments of small
intestine from chickens fed a diet with or without methionine supplementation at post-hatch days
10, 21 and 26. .............................................................................................................................. 129
Table 4.12 Phospho-p70S6K (T389) protein expression in liver, breast muscle and three
segments of small intestine from chickens fed a diet with or without methionine supplementation
at post-hatch days 10, 21 and 26. ................................................................................................ 130
Table 5.1 Lactate dehydrogenase (LDH) activity in culture media of in vitro cultured liver,
breast muscle, jejunum and ileum explants at 0h, 24h and 48h supplemented with different
methionine sources...................................................................................................................... 160
Table 5.2 Relative intestinal nutrient transporter gene expression at 24h of in vitro tissue culture.
..................................................................................................................................................... 161
Table 5.3 Relative intestinal nutrient transporter gene expression at 48h of in vitro tissue culture.
..................................................................................................................................................... 162
Table 5.4 Relative Met oxidase gene expression at 24h and 48h of in vitro tissue culture. ...... 163
Table 6.1 Top differentially expressed hepatic genes in chickens fed different supplemental
methionine sources compared to methionine deficient group. ................................................... 176
Table 6.2. Top diseases and Bio Functions in liver from chickens fed different supplemental
methionine sources compared to methionine deficient group based on prediction analysis of
differentially-expressed genes through RNA sequencing........................................................... 180
xiii
Table 6.3 Hepatic genes that met the cutoff criteria in chickens fed different supplemental
methionine sources compared to methionine deficient group. ................................................... 183
Table A. Chemical composition and amino acid profile of the trial diets of the different growth
phases. ......................................................................................................................................... 197
Table B. Experimental design for the animal trial, sampling and data collection. .................... 199
Table C. Relative D-amino acid oxidase (DAO, GenBank ID: NC_006102.2) gene expression
considering the statistical model that included main effects of treatment, age and tissue and their
interactions. ................................................................................................................................. 201

xiv
LIST OF FIGURES
Figure 1.1 Uptake, metabolism and regulation function in cells of different dietary supplemental
methionine sources.......................................................................................................................... 4
Figure 1.2 Methionine metabolism through transmethylation cycle and transsulfuration pathway.
......................................................................................................................................................... 5
Figure 2.1 Chemical structures of 2-hydroxy-4 (methylthio) butanoic acid, 2-keto-4 (methylthio)
butanoic acid and methionine. ...................................................................................................... 38
Figure 2.2 Absorption, transport and metabolism of L-Met, D-Met and DL-HMTBA in non-
ruminants....................................................................................................................................... 39
Figure 3.1 Temporal changes in DNA methyltransferase activity and total DNA methylation in
liver of chickens. ........................................................................................................................... 80
Figure 3.2 Relative gene expression of intestinal nutrient transporters from chickens fed
different methionine sources analyzed by segment. ..................................................................... 81
Figure 3.3 Relative gene expression of intestinal nutrient transporters from chickens fed
different methionine sources analyzed by age. ............................................................................. 82
Figure 4.1 Tissue distribution of mRNA expression for methionine oxidases and
transaminases. ............................................................................................................................. 131
Figure 4.2 Relative gene expression of methionine converting enzymes from chickens fed
different methionine sources analyzed by tissue. ....................................................................... 132
Figure 4.3 Relative gene expression of methionine converting enzymes from chickens fed
different methionine sources analyzed by age. ........................................................................... 133
Figure 4.4 Hepatic methionine oxidase activity under different incubation times. ................... 134
Figure 4.5 Tissue distribution of methionine oxidase activity normalized to per milligram of
protein ......................................................................................................................................... 135
Figure 4.6 In situ hybridization of HAO1 and LDHD mRNA in different tissues from chickens
fed different methionine sources. ................................................................................................ 139
Figure 4.7 Tissue distribution of oxidative stress markers from chickens fed different methionine
sources at post-hatch days 10 and 26. ......................................................................................... 141
Figure 4.8 Glutathione profile from chickens fed different methionine sources at post-hatch days
10 and 26 analyzed by tissue. ..................................................................................................... 143
xv
Figure 4.9 Protein carbonyl levels from chickens fed different methionine sources at post-hatch
days 10 and 26 analyzed by tissue. ............................................................................................. 144
Figure 4.10 Relative SAT2 mRNA expression in different tissues from chickens fed different
methionine sources at post-hatch days 10, 21 and 26. ................................................................ 145
Figure 4.11 Phospho-p70S6K (T389) and p70S6K protein expression in different tissues from
chickens fed different methionine sources at post-hatch days 10, 21 and 26. ............................ 148
Figure 5.1 Relative intestinal nutrient transporter gene expression at 24h and 48h of in vitro
tissue culture. .............................................................................................................................. 165
Figure 5.2 Relative methionine oxidases gene expression at 24h and 48h of in vitro cultured
liver, muscle and small intestine. ................................................................................................ 166
Figure 5.3 Relative D-amino acid oxidases (DAO) mRNA abundance at 48h of in vitro tissue
culture supplemented with different methionine sources. .......................................................... 167
Figure 6.1 Venn diagrams for differentially expressed hepatic genes in chickens fed different
supplemental methionine sources compared to methionine deficient group and their overlapping
genes. .......................................................................................................................................... 184
Figure 6.2. Top canonical pathways in liver from chickens fed different supplemental
methionine sources compared to methionine deficient group. ................................................... 186
Figure 6.3 Superpathway of methionine degradation and methionine salvage pathway with genes
highlighted that met the cutoff criteria........................................................................................ 188
Figure 7.1 Effect of common dietary supplemental methionine (Met) sources on nutrient uptake,
methionine metabolism and regulation function in cells. ........................................................... 195
Figure 7.2 Pathways for amino acids as nutrient signals to affect protein turnover. ................. 196
xvi
ABBREVIATIONS
α-1-AGP alpha-1-acid glycoprotein
BBMV brush border membrane vesicle
Cys cysteine
D-AAOX D-amino acid oxidase
DEG differentially expressed gene
D-HADH D-2-hydroxy acid dehydrogenase
FRAP ferric reducing/antioxidant power
GIT gastrointestinal tract
GSH glutathione
GSSG glutathione disulfide, oxidized form of glutathione
HMTBA 2-hydroxy-4-(methylthio) butanoic acid
HRP horseradish peroxidase
KMB 2-keto-4 (methylthio) butanoic acid
LDH lactate dehydrogenase
L-HAOX L-2-hydroxy acid oxidase
Met methionine
MTA 5’-deoxy-5’-methylthioadenosine
mTOR mammalian target of rapamycin
NLCPAR nonlinear common plateau asymptotic regression model
RBC-PCV red blood cell packed cell volume
RBE relative biological efficacy

xvii
rGSH reduced glutathione
ROS reactive oxygen species
SAA serum amyloid A
SAM S-adenosylmethionine
TBARS thiobarbituric acid reactive substances
TGSH total glutathione
TSAA total dietary sulfur-containing amino acids
WBC white blood cell

1
CHAPTER 1 Introduction
Methionine (Met) is a dietary indispensable amino acid because it cannot be
synthesized in sufficient amounts to sustain normal growth in mammals and avians. As a
result, supplemental Met sources are produced for cost efficiency in the animal nutrition
industry, especially for a poultry diet, in which Met is usually the first limiting amino
acid. L-methionine (L-Met) is the natural form of Met that can be directly used by
animals, while the isoform mixture DL-methionine (DL-Met) and the methionine
precursor DL-2-hydroxy-4 (methylthio)-butanoic acid (DL-HMTBA) are two commonly
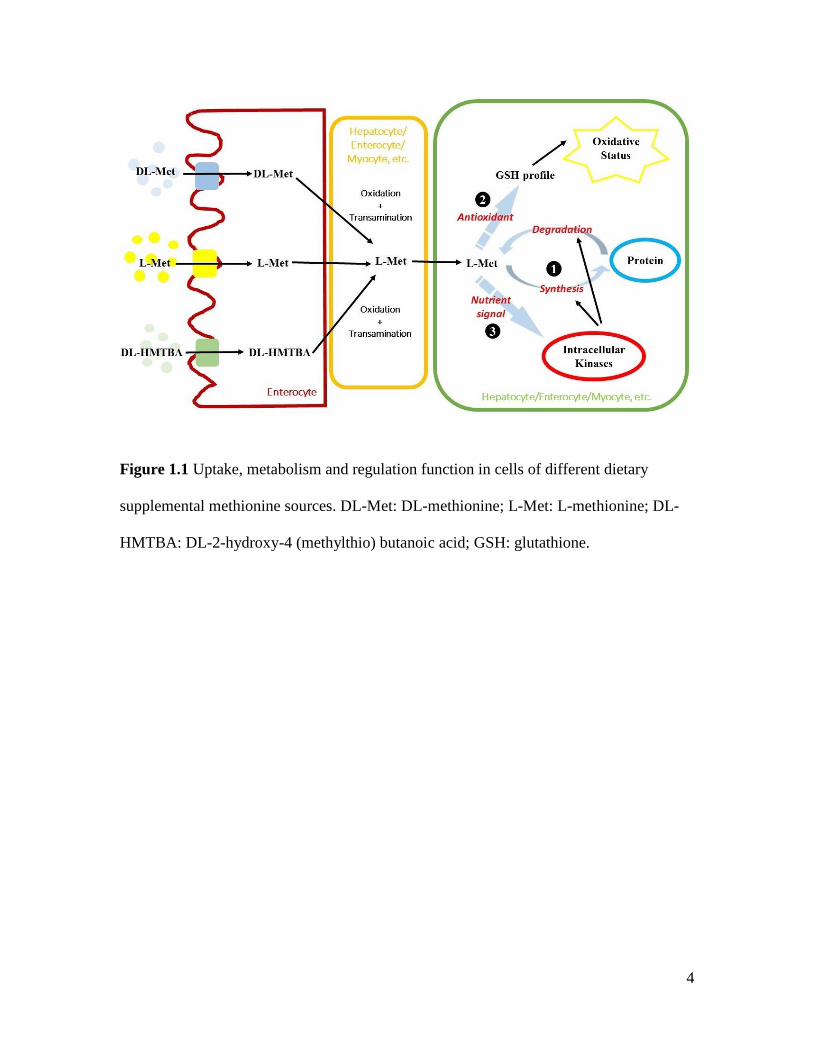
used supplemental Met sources in the poultry industry. DL-Met and DL-HMTBA are
mainly absorbed in the small intestine through different mechanisms, and conversion to
L-Met is the first step before both of them can be utilized by animals (Figure 1.1).
The literature review in this dissertation will focus on the comparison between
these three dietary supplemental Met sources (L-Met, DL-Met and DL-HMTBA) in
different species (poultry, swine and ruminants). The different uptake mechanisms of
these Met sources, the conversion of D-Met and DL-HMTBA to L-Met, and the relative
efficacy especially for DL-Met and DL-HMTBA are introduced in detail, particularly
emphasizing on chickens. The knowledge of intestinal amino acid transporters and
antioxidant potential of HMTBA will also be covered in this chapter. All of these will
provide background support for the remainder of the dissertation.
The major roles that amino acids including Met play in metabolism and cell
function regulation are: 1) precursors for protein synthesis, 2) antioxidant function, and 3)
nutrient signaling to affect intracellular kinases (Figure 1.1). All of these functions can be
influenced by nutritional factors such as dietary supplemental Met sources.

2
Transmethylation and transsulfuration are two major pathways for Met metabolism
(Figure 1.2). The major methyl donor S-adenosylmethionine (SAM) is an intermediate in
the transmethylation cycle. Thus Met is associated with DNA methylation and epigenetic
regulation of gene expression (Figure 1.2). In addition, the reactive oxygen species
(ROS) scavengers cysteine and glutathione are products in the transsulfuration pathway,
so Met is also related to oxidative status in animals (Figure 1.2). Therefore, this
dissertation will assess the effect of different dietary supplemental Met sources on a
series of physiological and biochemical aspects, which include basic growth performance
parameters, hepatic DNA methylation and methyltransferase activity, intestinal nutrient
transporter gene expression, Met converting enzyme activities, oxidative stress markers
and blood antioxidant profiles (e.g., acute phase protein, white blood cell distribution
pattern), and potential pathways related to amino acid signaling. In addition to the in vivo
work, an in vitro study on nutrient transporters and Met converting enzymes as well as an
RNA sequencing assay will be covered in this dissertation.
In recent years, a plethora of research of studies has focused on metabolic
mechanisms of sulfur amino acids using mammals as a model, with the aim to improve
our understanding of human nutrition and health. In poultry, the relative efficacy between
different supplemental Met sources has been a major topic of Met research for the past 50
years. Now more research has focused on the molecular aspects of sulfur amino acid
research in livestock species and poultry. Our lab has much experience working on
molecular nutrition especially nutrient transporters in poultry. Understanding the effects
and corresponding mechanisms of different dietary supplemental Met sources in poultry

3
will greatly benefit the animal nutrition industry, and also may promote the development
of biomedical research on humans.
4
Figure 1.1 Uptake, metabolism and regulation function in cells of different dietary
supplemental methionine sources. DL-Met: DL-methionine; L-Met: L-methionine; DL-
HMTBA: DL-2-hydroxy-4 (methylthio) butanoic acid; GSH: glutathione.

5
Figure 1.2 Methionine metabolism through transmethylation cycle and transsulfuration
pathway.

6
CHAPTER 2 Literature Review
2.1 Introduction
In animal diets especially poultry diets, methionine (Met) is considered to be the
first limiting amino acid. The dietary supplemental Met sources include L-methionine (L-
Met), and its synthetic forms DL-methionine (DL-Met) and DL-2-hydroxy-4 (methylthio)
butanoic acid (DL-HMTBA) (Figure 2.1).
As the metabolically active isomer of Met, L-Met can be used as a precursor for
protein synthesis, incorporated into the transmethylation pathway of the Met cycle to
produce homocysteine, or metabolized through the transsulfuration pathway to produce
cysteine and glutathione (Figure 1.2) (Fang et al., 2010b). The gastrointestinal tract (GIT)
is the major site for the transmethylation and transsulfuration of dietary Met. The net
homocysteine released can induce the formation of reactive oxygen species (ROS) in the
mitochondria, contribute to the oxidative stress of the intestinal mucosa, cause an
inflammatory response and disrupt the epithelial barrier function in the GIT (Burrin and
Stoll, 2007). Thus dietary Met is highly associated with the function and health of the
GIT for livestock and humans. Studies also showed that L-Met is an intermediate in the
biosynthesis of other important molecules such as carnitine and taurine, and can be
converted to S-adenosylmethionine (SAM), which is the major methyl donor in cells, and
thus indirectly participates in the epigenetic regulation of gene expression (Obeid, 2013).
After absorption in the GIT, biological utilization of both D-Met and DL-HMTBA relies
on their conversion to L-Met.
7
Today L-Met is produced on an industrial-scale by enzymatic reactions using
commercial DL-Met as substrates, since a fermentation method is not yet available. DL-
Met is exclusively manufactured by chemical synthesis with alkaline hydrolysis as the
key step, and sold as powder. In the manufacturing process, a racemic mixture of D- and
L-Met is synthesized (Karau and Grayson, 2014). The Met analogue, DL-HMTBA, is
available as an 88% liquid concentrate in water as a free acid or as an 84% preparation of
the calcium salt (Saunderson, 1985). DL-HMTBA lacks an amino group and thus is not a
true amino acid but an amino acid precursor.
There are different absorption, transport and metabolism mechanisms for
utilization of different Met sources. There has been a continuing controversy centered on
the absorption and bio-efficacy of DL-Met and DL-HMTBA in the past few decades.
This review summarizes studies about different absorption, transport and metabolism
characteristics of L-Met, DL-Met and DL-HMTBA in several animal models (poultry,
swine, and ruminants), and their bio-efficacy in growth and development with a focus on
poultry and pigs. The physiology of amino acid and peptide transport and the antioxidant
potential of DL-HMTBA will also be reviewed. Understanding the characteristics of
different Met sources will greatly benefit the animal nutrition industry as well as
bioscience research.
2.2 Amino acid and peptide absorption and transport in the small intestine
Small intestine (duodenum, jejunum and ileum) is the major site for nutrient
absorption. Dietary protein is digested in the GIT, and the resulting small peptides and
amino acids are effectively absorbed into enterocytes via different brushborder membrane
transporters, depending on the size and the electrical property of the amino acids (Smith

8
and Morton, 2010). Most amino acids that enter the enterocyte are then transported out of
the cell into the blood stream via various basolateral membrane transporters, except those
retained for utilization by the enterocyte (Smith and Morton, 2010). Met is a neutral
amino acid, thus the neutral amino acid transporters that have been reported to be
associated with Met transport in mammals and avians are summarized in this part (Table
2.1).
Solute carriers (SLCs) comprise the largest family of membrane transport proteins
in mammals and avians. Phylogenetic studies have identified at least 384 unique protein
sequences forming 52 distinct SLC families (Rask-Andersen et al., 2013). SLCs regulate
the transport of several substrates such as inorganic ions, nucleotides, amino acids,
neurotransmitters, sugars and fatty acids across biological membranes (Rask-Andersen et
al., 2013). SLCs are encoded by a large number of genes.
The neutral amino acid transporters SAT1, SAT2 and SAT3. SAT1
(SLC38A1), SAT2 (SLC38A2) and SAT3 (SLC38A3) are co-transporters for Na+ with
neutral amino acid uptake driven by the inward directed Na+ gradient across the
basolateral membrane of the enterocytes. They have a broad substrate specificity in
general, with preference for L-methionine, L-proline, L-serine, but also high affinity for
L-asparagine, L-glycine, L-histidine and L-glutamine (Schioth et al., 2013). SAT1 and
SAT3 are expressed greater in the nervous system, while SAT2 is ubiquitously expressed
in most cell types. Pinilla et al. (2011) suggested that SAT2 plays a role in cell growth
and differentiation by signaling through the mTOR (mammalian target of rapamycin)
pathway, with a potential function as a transceptor. SAT1 and SAT2 were observed to be
highly up-regulated when cells were grown in the absence of essential amino acids,

9
which is a possible regulatory mechanism utilized by tumor cells under nutritional stress
(Jones et al., 2006).
The neutral amino acid transporter B0AT. B0AT (SLC6A19) is the major
apical neutral amino acid transporter in kidney and intestine in mouse (Broer, 2008). It is
a Na+-dependent transporter, with mRNA localizing to enterocytes with a clear gradient
along the villi, being low in the crypts and stronger toward the tips in the small intestine
of the mouse (Romeo et al., 2006). B0AT transports all neutral amino acids, but has more
affinity for methionine, leucine, isoleucine and valine (Broer, 2008).
The neutral and cationic amino acid transporter ATB0,+. ATB0,+ (SLC6A14)
is a Na+ and Cl--dependent neutral and cationic amino acid transporter with greatest
affinity for large hydrophobic amino acids. It can transport all essential amino acids but
not proline, glutamate and aspartate, and is not expressed in kidney (Broer, 2008). A
defective ATB0,+ transporter could result in embryo undernutrition causing obesity later
in human life (Van Winkle et al., 2006). The ATB0,+ protein is also a novel and effective
drug target for the treatment of estrogen receptor-positive breast cancer (Karunakaran et
al., 2011).
The b0,+AT and rBAT transporter complex. The heteromeric transporters
b0,+AT (SLC7A9) and rBAT (SLC3A1) are the major transporters for cationic amino
acids and cysteine in the apical membrane of kidney and intestine in mouse (Broer,
2008). Because of their molecular mass, rBAT is called the heavy chain and b0,+AT the
light chain, linked by a disulfide bridge. The rBAT protein alone appears to be relatively
unstable and is rapidly degraded; while co-expression of b0,+AT stabilizes rBAT.
Physiologically, rBAT/b0,+AT transport neutral amino acids out of the cell into the lumen

10
in exchange for cationic amino acids and cysteine uptake (Broer, 2008). According to
Dave et al. (2004), this complex localized the strongest in ileum, was very weak in
duodenum and showed a similar gradient of expression along the villi in the mouse.
The 4F2hc and system L and y+L transporters. 4F2hc (SLC3A2) is the heavy
chain for system L transporters LAT1 (SLC7A5), LAT2 (SLC7A8) and system y+L
transporters y+LAT1 (SLC7A7), y+LAT2 (SLC7A6). The heteromeric transporters
4F2hc/LAT1 and 4F2hc/LAT2 mediate the Na+-independent obligatory exchange of
neutral amino acids. 4F2hc/LAT1 has high affinity for large branched chain amino acids
and aromatic amino acids, with the affinity being up to 100-fold higher for extracellular
amino acids than for intracellular amino acids, especially for L-methionine, L-leucine and
L-isoleucine. In contrast, 4F2hc/LAT2 has broad substrate selectivity for all neutral
amino acids, including the small ones (Fotiadis et al., 2013). LAT2 also displays lower
intracellular affinities. LAT1 and LAT2 can provide neutral branched chain amino acids
to activate the mTOR pathway (Fotiadis et al., 2013). Both 4F2hc/y+LAT1 and
4F2hc/y+LAT2 are obligatory exchangers of cationic amino acids (Na+-independent) and
neutral amino acids (Na+-dependent), rendering the transporter electroneutral, but
4F2hc/y+LAT2 preferentially mediates the efflux of L-arginine in exchange for L-
glutamine (Fotiadis et al., 2013). Under physiological conditions, system y+L transporters
would maintain a lower cationic amino acid gradient and a higher neutral amino acid
gradient in the cytosol (Broer, 2008). LAT1 is expressed essentially in brain, with very
little expression in the intestine. Dave et al. (2004) reported that 4F2hc and LAT2
colocalized completely in all segments of the small intestine and along the length of the
11
villi, with stronger signals towards the tip of the villi, and y+LAT1 followed a similar
distribution pattern as LAT2.
The di- and tripeptide transporter PepT1. The peptide transporter PepT1
(SLC15A1) is a proton-dependent, low-affinity, high-capacity transporter. It is primarily
expressed in the apical membrane of intestinal and renal epithelial cells. In enterocytes, it
is restricted between the crypt-villus junction and villus tip, increasing towards the tip
(Gilbert et al., 2008).
2.3 Utilization of different dietary supplemental methionine sources in poultry
2.3.1 Absorption and transport of dietary L-Met, DL-Met and DL-HMTBA
Since HMTBA does not enter the lumen of the GIT in the form of an amino acid,
it is likely absorbed differently from D-Met and L-Met. Knight and Dibner (1984) used
both the in vitro intestinal slices model and the in vivo ligated intestinal segments plus
crop intubation model to explore the absorption of radioactive HMTBA and L-Met in 8 to
16 day-old chickens. Intestinal uptake of L-Met was inhibited by the electron transport
uncoupler 2, 4-dinitrophenol and its uptake conformed to Michaelis-Menten kinetics;
whereas, the in vitro uptake of HMTBA was linear relative to concentration. These
results led to the conclusion that L-Met absorption was a concentration and energy
dependent process while DL-HMTBA absorption was only concentration dependent. The
in vivo experiment also illustrated that the absorption rate of the two Met sources varied
in different small intestinal locations. L-Met was absorbed more quickly in the ileum,
while DL-HMTBA was absorbed more rapidly in the proximal loop of the duodenum and
mid-jejunum. Although there is different absorption mechanisms, the two compounds
12
were absorbed at similar rates, especially at low supplemental concentrations (Dibner and
Knight, 1984).
Using the in vitro intestinal slices model, Brachet and Puigserver (1989) reported
that HMTBA is absorbed by a combination of diffusion and carrier-mediated uptake. The
diffusion plays a major role in HMTBA uptake, particularly at high substrate
concentration, which is consistent with the chemical structure of HMTBA as an organic
acid (Brachet and Puigserver, 1987; Dibner and Buttin, 2002). At a lower concentration,
carrier-mediated transport is more important (Brachet and Puigserver, 1987).
Richards et al. (2005) demonstrated that HMTBA was absorbed along the entire
GIT (from crop to cloaca) in chickens, primarily in the proximal GIT prior to the small
intestine. They also showed that the uptake rate of DL-HMTBA was equal to or greater
than DL-Met using the in vitro intestinal slices model (Richards et al., 2005). However,
compared to L-Met, more DL-HMTBA was broken down to non-methionine products
and remained unabsorbed during passage down the small intestine in chickens (Maenz
and Engele-Schaan, 1996a).
Another popular in vitro model to study nutrient transport is the brush border
membrane vesicle (BBMV) model. This model is inappropriate to estimate the HMTBA
transport rate since it minimizes uptake by diffusion, which accounts for a large
proportion of HMTBA uptake in vivo (Richards et al., 2005). In contrast, the intestinal
slices model is more efficient at measuring the uptake rate of HMTBA. However, the
BBMV model has proven to be useful to study the carrier-mediated uptake by specific
transporters on the intestinal brush border membrane.

13
Using the BBMV model, Brachet and Puigserver (1989) reported that the
transport of both L-HMTBA and D-HMTBA were Na+ independent and electroneutral.
L-lactate, a structural analogue, could act as a competitor to L-HMTBA transport,
indicating that DL-HMTBA can be taken up by the lactate carrier, which belongs to the
proton-linked monocarboxylate transporter family (Brachet and Puigserver, 1989).
Maenz and Engele-Schaan (1996b) confirmed this conclusion by showing that DL-
HMTBA was absorbed by a H+-dependent, non-stereospecific, monocarboxylic acid
transport system.
Similar to the other amino acids, DL-Met is transported primarily by active
transport and also by carrier-mediated transport (Brandsch and Brandsch, 2003). Both
mechanisms require transporters; while active transport needs ATP hydrolysis to provide
energy. Since both D-Met and L-Met can compete for many of the same transporters, and
these transporters have a much higher affinity for L-Met than D-Met, the uptake rate of
DL-Met is usually slower than L-Met (Richards et al., 2005). Several transport systems
were reported to transport DL-Met in chicken jejunum: the Na+-independent bo,+ and
system L, and the Na+-dependent system y+, system B and system A (Soriano-Garcia et
al., 1998). Some of the specific transporters reported to transport Met include b0,+AT,
LAT1/LAT2, y+LAT1/y+LAT2, ATB0,+ and SAT1/SAT2 (Hyde et al., 2003; Broer,
2008) (Table 2.1). The transport system for DL-HMTBA is the monocarboxylate
transporter 1 (MCT1) (Martin-Venegas et al., 2007; 2008). MCT1 (SLC16A1) belongs to
the SLC16 family and takes lactate, pyruvate and ketone bodies as predominant
substrates, with ubiquitous distribution (Halestrap, 2013). Because the transporter MCT1
is H+-dependent, it is coupled with the Na+/H+ exchanger (NHE3) to maintain the proton

14
gradient at the brush border membrane of the enterocyte in mammals, according to the
study using human Caco-2 cells (Martin-Venegas et al., 2007). No related results have
been reported for an in vitro chicken model.
2.3.2 Conversion and metabolism of dietary L-Met, DL-Met and DL-HMTBA
For DL-Met, D-Met must be converted to L-Met following transport into the
enterocyte. Firstly, D-Met is oxidatively deaminated to the α-keto analogue of L-Met, 2-
keto-4 (methylthio) butanoic acid (KMB), by the enzyme D-amino acid oxidase (D-
AAOX; EC 1.4.3.3), a peroxisomal oxidase containing flavin adenine dinucleotide (FAD)
as a cofactor (Brachet and Puigserver, 1992). Then KMB is converted to L-Met by the
transfer of nitrogen from donor amino acids catalyzed by the ubiquitous transaminases.
Even though not yet definitively demonstrated, transaminase is not thought to be a
limiting step in the conversion process.
L-Met can be directly used to synthesize SAM or can be degraded through
pathways such as transamination, or utilized by the bacteria in the lumen of the small
intestine (Muramatsu et al., 1987). SAM can undergo the transmethylation pathway to
synthesize homocysteine or the transsulfuration pathway, with the products cysteine,
glutathione, taurine, etc (Figure 2.2). In skeletal muscle, Met can regulate the ribosomal
protein S6 kinase (S6K1) pathway and its translational targets, i.e., ribosomal protein S6
(S6) and eukaryotic elongation factor 2 (eEF2), and regulate protein accretion and
synthesis (Barnes et al., 1995). In quail muscle QM7 myoblasts, S6K1 signaling was shut
down when incubated in Met-free medium, which was due to uncharged tRNA as well as
Met itself. Re-activation of S6K1 can be induced by both L-Met and KMB but not DL-
HMTBA or D-Met (Metayer-Coustard et al., 2010).

15
DL-HMTBA also needs to be transformed to L-Met for utilization. The
stereospecific pathway of DL-HMTBA conversion to L-Met was demonstrated by Dibner
and Knight using chicken liver homogenates (Dibner and Knight, 1984). The first step is
oxidation of the α-hydroxyl group yielding the keto intermediate KMB, catalyzed by two
enzyme systems according to the substrate isomers (Figure 2.1). L-HMTBA is the
substrate of L-2-hydroxy acid oxidase (L-HAOX; EC 1.1.3.15), a hydrogen peroxide
(H2O2)-producing flavoenzyme found in peroxisomes of liver and kidney in chickens.
There are two isoforms of L-HAOX, HAO1 and HAO2. HAO1 is rich in liver and
preferentially oxidizes short-chain aliphatic 2-hydroxyacids; while HAO2 is abundant in
kidney and catalyzes the oxidation of long-chain aliphatic or aromatic 2-hydroxyacids
(Ferjancic-Biagini et al., 1998). Thus HAO1 is assumed to be involved mainly in L-
HMTBA oxidation. D-HMTBA is oxidized through an entirely different mechanism,
catalyzed by the mitochondrial D-2-hydroxy acid dehydrogenase (D-HADH; EC
1.1.99.6), producing H2O2 as a byproduct. Because D-HADH is located in mitochondria,
D-HMTBA could be used by any organ for protein synthesis, including small intestine
and skeletal muscle (Dupuis et al., 1990). FAD and flavin mononucleotide (FMN) are
common cofactors for both L-HAOX and D-HADH. L-HAOX also has oxidative
decarboxylation activity in vitro, using nicotinamide adenine dinucleotide (NADH) as a
cofactor (Ferjancic-Biagini et al., 1995).
In both cases the resulting keto intermediate KMB is transaminated to L-Met by
transaminase, the second step in DL-HMTBA metabolism (Figure 2.1). In rat liver, KMB
is transaminated by the transaminase using glutamine or asparagine as substrates to
produce L-Met (Backlund et al., 1982). In rat skeletal muscle, the branched-chain amino

16
acids play an important role in transamination (Wu and Thompson, 1989). However, in
chicken the physiology is more complicated. Kidney is the most active tissue for
conversion of KMB to L-Met, the liver and small intestinal mucosa are intermediate, and
skeletal muscle has the lowest activity. All amino acids can serve as substrates for
transamination of KMB in chicken. Branched-chain amino acids, glutamic acid and
asparagine are more effective substrates in tissues other than the small intestinal mucosa.
In mitochondria, the preferred substrates are glutamate in liver mitochondria, isoleucine
and alanine in kidney mitochondria and branched-chain amino acids and glutamic acid in
skeletal muscle mitochondria (Rangel-Lugo and Austic, 1998). In human Caco-2 cells,
the branched-chain amino acid leucine is the preferred amino acid group donor (Martin-
Venegas et al., 2011).
Conversion of DL-HMTBA to L-Met occurs principally in liver, because both L-
HAOX and D-HADH are highly expressed in liver. Both isomers of DL-HMTBA can be
used as Met sources at similar rates for hepatocyte protein synthesis and are
biochemically equivalent to DL-Met in chickens (Dibner, 1983). Wang et al. (2001) did
not observe any sign of toxicity from infusion of pharmacological levels of DL-HMTBA
directly into the broiler hepatic portal vein while feeding a diet containing normal
supplemental levels of DL-HMTBA, indicating that liver is a major site for DL-HMTBA
removal from circulation and metabolism in chickens. At super physiological
concentrations, DL-HMTBA is oxidized principally in skeletal muscle (Dupuis et al.,
1989). However, because growing broilers have more than enough biochemical capacity
for DL-Met and DL-HMTBA conversion, no accumulation of dietary Met sources might
occur (Dibner and Ivey, 1992). DL-HMTBA transformation also takes place in the small

17
intestine, following the steps of oxidation and transamination (Martin-Venegas et al.,
2006; 2011) . The dietary DL-HMTBA supplementation can up-regulate the intestinal
oxidation, but the transamination step is not affected by DL-HMTBA availability
(Martin-Venegas et al., 2011). Under fasting or Met deficient conditions, brain and liver
showed enhanced rates of DL-HMTBA and DL-Met conversion (Saunderson, 1987). In
non-ruminants, oxidation is the major pathway for DL-HMTBA catabolism. In
ruminants, DL-HMTBA can also be degraded directly by microorganisms.
In addition to access from diet, HMTBA is also a naturally occurring compound
in chickens through a salvage pathway to regenerate L-Met from 5’-deoxy-5’-
methylthioadenosine (MTA), without KMB production (Backlund et al., 1982; Dibner et
al., 1990; Dibner and Ivey, 1990). Even though the naturally occurring HMTBA may not
be an obligatory intermediate in the cytosolic MTA salvage pathway, it can still be used
as an L-Met precursor in chicken liver (Dibner et al., 1990).
2.3.3 The bio-efficacy of L-Met, DL-Met and DL-HMTBA in poultry
The DL-HMTBA and DL-Met have been commercially available and used in
animal production systems for over 50 years. Both liquid form of DL-HMTBA (Alimet)
and dry/calcium salt form of DL-HMTBA (MHA) were proved nutritionally effective in
broiler chickens (Bishop and Halloran, 1977; Waldroup et al., 1981). Many studies have
already shown that there are no significant differences between those two commercial
Met sources for body weight gain and feed conversion ratio in broiler chickens fed
traditional corn-soybean meal (Elkin and Hester, 1983; Garlich, 1985; Liu et al., 2007;
Zou et al., 2015). However, the relative biological efficacy (RBE) of DL-HMTBA and
DL-Met remains a controversy. Although initial studies showed that these two

18
commercial Met sources provided similar quantities of Met activity (Bird, 1952), it was
shown later that DL-HMTBA is a little less effective than L-Met or DL-Met in purified
diets at total dietary sulfur-containing amino acid (TSAA) deficient levels (Smith, 1966;
Katz and Baker, 1975), due to rate limiting DL-HMTBA metabolism (Saunderson, 1985).
To estimate the RBE, a dose-response trial is commonly used and DL-HMTBA
must function at a dilution of DL-Met (e.g., 65% DL-Met) with the same form of dose-
response and same plateau. The conflicting conclusions drawn from different studies
could be related to the statistical models used (Agostini et al., 2016). The slope-ratio and
parallel line assays (linear response) were used in earlier studies. Littell et al. (1997)
proposed the nonlinear common plateau asymptotic regression model (NLCPAR) and
fitted to the treatment means of body weight gain and feed conversion ratio. Rate
parameter estimates were obtained from the NLCPAR models for each product and the
ratio of these parameter estimates was then interpreted as the RBE of the test product
relative to the standard for the entire dose range. Following this model, Lemme et al.
(2002) reported 72% weight gain, 51% feed conversion, 48% carcass yield and 60%
breast muscle yield (an average of 62%) of liquid DL-HMTBA compared to DL-Met
using an exponential model.
However, Kratzer and Littell (2006) questioned this approach with a common
plateau since the two products do not fit the same dose response profile due to their
different absorption and metabolic pathways. Vazquez-Anon et al. (2006) imposed linear,
quadratic and exponential equations to body weight gain and selected the best model
(with best goodness of fit) to estimate the gain responses after feeding different doses of
DL-HMTBA vs. DL-Met to male chickens for 6-7 weeks. They concluded that DL-
19
HMTBA outperformed those for DL-Met at TSAA levels near the maximum gain
response (commercial levels), while DL-Met outperformed DL-HMTBA at TSAA
deficient levels (Vazquez-Anon et al., 2006). Agostini et al. (2016) further showed the
above conclusions over a practical range of doses using 0 to 28 day-old broiler chickens,
taking TSAA into account. They showed that DL-HMTBA outperformed DL-Met above
requirement levels, whereas the opposite was observed below the TSAA requirement, but
the latter was only manifest in females. Similar results were observed in turkeys, with
feeding supplemental DL-HMTBA to young male turkeys for 21 days leading to lower
growth compared with DL-Met at TSAA deficient levels (Gonzales-Esquerra et al.,
2007). This understanding leads to a statistical approach in which predictions are
developed for each Met source independently, and predicted differences are determined
along the dose response. Roughly speaking, if a sufficiently wide range of concentrations
are fed, a quadratic equation can fit the data. If supplemental concentrations are low
relative to peak response, a linear equation may fit the data better. Alternatively, if
supplemental concentrations are approaching peak response but are insufficient to create
a decline in performance, exponential equations may provide a better goodness of fit
(Kratzer and Littell, 2006; Gonzales-Esquerra et al., 2007).
Even though, Hoehler (2006) argued that Kratzer and Littell (2006) who defined
RBE as the ratio of induced responses at a given supplementation level misunderstood
the original concepts of RBE. Littell et al. (1997) proposed RBE based on the ratio of
supplementation levels at a given response level. Hoehler (2006) insisted that there was
no problem to use the NLCPAR model. Guided by this thought, Elwert et al. (2008)
assessed the RBE of calcium salt of DL-HMTBA in comparison to DL-Met using the

20
NLCPAR model in both male Ross 308 and Cobb 500 chickens fed a TSAA deficient
diet for 38 days. Their results suggested an average of 63% RBE (66% body weight gain,
64% feed efficiency and 54% breast muscle meat yield) of calcium salt of DL-HMTBA
in relation to DL-Met (Elwert et al., 2008). Sauer et al. (2008) used meta-analysis
including data out of 40 experiments from peer reviewed publications with the NLCPAR
model to illustrate 79% and 87% RBE of DL-HMTBA over DL-Met for the average daily
gain and gain to feed ratio, respectively. Vedenov and Pesti (2010) applied an economic
analysis to these meta-analyses and reported relative economic values (cost ratio, DL-
HMTBA: DL-Met) between 81%-86%, depending on the value of a broiler and the cost
of feed and DL-Met. However, the authors concluded that these results were questionable
because the profit-maximizing levels of DL-Met and DL-HMTBA in this trial were so far
above the levels studied in most of the trials (Vedenov and Pesti, 2010).
In addition to the effects on regular growth performance parameters, e.g., body
weight gain, feed conversion ratio and breast muscle yield, DL-HMTBA and DL-Met
may also differ in effects on fat deposition. Esteve-Garcia and Llaurado (1997) showed
that DL-HMTBA supplementation resulted in greater abdominal fat deposition at 41 days
for male broilers deficient in TSAA, even if live body weight was the same.
The RBE of DL-Met and L-Met was not different in both purified and practical-
type low-protein diets of varying TSAA contents fed to chickens from 8 to 20 days
(Dilger and Baker, 2007). Furthermore, the addition of 0.2% L-cysteine in a TSAA
deficient diet improved body weight gain efficiency but was associated with anorexic
behavior in the chickens, which was thought to be due to a unique nutritional imbalance.
The improvement in gain to feed ratio mediated through reduced feed intake is a rare

21
event in nutritional studies (Dilger and Baker, 2007). More research is needed to provide
a physiological basis for this phenomenon.
2.4 Utilization of different dietary supplemental methionine sources in other
livestock species
2.4.1. Utilization of dietary L-Met, DL-Met and DL-HMTBA in swine
Methionine is considered to be one of the most limiting amino acids for swine
especially for piglets. Studies on dietary Met metabolism and systemic homocysteine
regulation using swine as models may benefit the clinical treatment of cardiovascular
disease and stroke (Bauchart-Thevret et al., 2009a).
Some early studies showed that DL-HMTBA and DL-Met provided equimolar
levels of Met activity in early-weaned pigs (Knight et al., 1998). Recently, Jendza et al.
(2011) indicated that when cost per mole of Met activity is not different, DL-HMTBA is
a better choice in low-fiber pig diets due to increased apparent ileal digestibility of acid
and neutral detergent fiber and several other amino acids. DL-Met, however, is preferred
in high-fiber pig diets considering the negative interaction between DL-HMTBA and
wheat middlings on digestibility of other amino acids.
The conversion of DL-HMTBA and D-Met to L-Met in swine follows the same
pathways as those in chickens, and is also tissue-specific. Liver and kidney are the major
sites for DL-HMTBA conversion, with the highest L-HAOX and D-HADH activity and
mRNA abundance. The stomach can also convert DL-HMTBA to L-Met, while the small
intestine, with higher D-AAOX expression, contains a relatively higher capacity to
convert D-Met than to convert DL-HMTBA (Fang et al., 2010a). However, liver and GIT
are still the major organs involved in dietary Met utilization in piglets. Both dietary Met

22
status and sources can affect the utilization process. With sufficient Met supply, the GIT
metabolizes 20% of dietary Met intake by transmethylating it to homocysteine and then
transsulfurating to cysteine in neonatal pigs. In contrast, TSAA deficiency coordinates
Met metabolism, such that protein synthesis is preserved over Met transmethylation and
the Met pool is preserved by up-regulation of homocysteine re-methylation and
suppression of transsulfuration (Bauchart-Thevret et al., 2009b). Supplementation of
dietary DL-HMTBA, which is all absorbed by the end of the duodenum in pigs (Jendza et
al., 2011), increased circulating plasma taurine concentrations compared to DL-Met
supplementation, indicating the greater potential of DL-HMTBA over DL-Met to
promote the transsulfuration of dietary Met (Fang et al., 2010a). Besides, dietary DL-
HMTBA supplementation may also up-regulate portal blood flow and net portal
absorption of amino acids in piglets (Fang et al., 2009). All of these may imply a
beneficial nutritional effect of DL-HMTBA on swine growth.
2.4.2 Utilization of dietary DL-HMTBA in ruminants
The absorption and metabolism of DL-HMTBA in ruminants are different from
that in non-ruminants. There are several destinations in the GIT for the dietary DL-
HMTBA after oral administration. First, DL-HMTBA can be directly absorbed, mainly
through the ruminal, omasal or abomasal epithelia. McCollum et al. (2000) clearly
indicated that the former two sites account for at least a portion of the absorption of DL-
HMTBA in sheep. The absorption amount is determined by several factors such as the
retention time (the inverse of liquid outflow rate) within the rumen (Lobley et al., 2006b).
Second, the forestomach tissues may convert DL-HMTBA to L-Met during the
absorption process (Lobley et al., 2006a). This would increase the net availability of Met

23
for absorption or support tissue protein synthesis (Lobley et al., 2006b). But it is still
unknown whether this conversion within the digestive tract is dose dependent or
represents a fixed value linked to the enzyme capacity within the tissues. Third, microbes
in the rumen may degrade DL-HMTBA and the products would continue to form during
passage of fluid between the rumen and abomasum.
Lobley et al. (2006b) pointed out that the majority of dietary DL-HMTBA has
been either oxidized or converted to other products, only less than 30% of the oral dose
being absorbed as DL-HMTBA. The DL-HMTBA converting enzymes were found in
ruminal and omasal epithelia, liver and kidney in sheep, demonstrating the possible
metabolic sites of DL-HMTBA in ruminants (McCollum et al., 2000). Actually, the non-
hepatic tissues act as major sites for L-Met synthesis from DL-HMTBA (Lobley et al.,
2006b; Lapierre et al., 2011). Approximately 65%-75% of absorbed DL-HMTBA passed
beyond the liver for subsequent metabolism by peripheral tissues in lambs (Wester et al.,
2006). Most of the synthesized L-Met is preferably retained to support tissue protein
synthesis with little returned to the plasma. As a consequence, only a small increase in
plasma Met was observed even when enough dietary DL-HMTBA was supplemented.
This would yield an energy savings through using passive diffusion of DL-HMTBA
rather than active transport of Met (McCollum et al., 2000). This also indicates that the
plasma Met concentrations cannot accurately predict Met availability in ruminants
(Lobley et al., 2006a).
In ruminants, the hepatic DL-HMTBA can undergo similar fates as in non-
ruminants, such as catabolism (oxidation), conversion to L-Met and export or use by
cells, or conversion to other metabolic products such as cysteine and glutathione through
24
the transsulfuration pathway (Wester et al., 2006). To ensure maintenance of
aminoacidemia and prevent Met toxicity, the liver plays a key role in removal of extra
Met (Lapierre et al., 2011). There also appears to be preferential use of D-HMTBA by
ruminant tissue, with D-HADH more active (by 45% to 75%) than L-HAOX in ovine
omasum, rumen and kidney but not in liver (Lobley et al., 2006a).
In lactating dairy cows, dietary DL-HMTBA supplementation has been proposed
as a means to increase milk protein yield, considering that it is more resistant to rumen
microbial degradation than DL-Met (Noftsger et al., 2005). Approximately 15% of Met
incorporated into milk protein originated from direct conversion of DL-HMTBA to L-
Met, and the remaining 85% was provided indirectly, where L-Met synthesized from DL-
HMTBA within peripheral tissues was used to support intracellular protein synthesis,
allowing L-Met released from protein breakdown to be exported for use by the mammary
gland (Lapierre et al., 2011).
2.5 Antioxidant potential of DL-HMTBA
It is now well established that DL-HMTBA is a safe and efficacious precursor of
Met widely used in animal diets (Dilger et al., 2007). Furthermore, DL-HMTBA has
potential antioxidant effects. Martin-Venegas et al. (2013) observed higher taurine and
cysteine levels in chicken enterocytes using DL-HMTBA as a dietary supplemental Met
source compared to DL-Met, indicating that DL-HMTBA is preferentially metabolized
through the transsulfuration pathway. Thus DL-HMTBA can theoretically reduce the net
homocysteine level produced by Met metabolism via the transmethylation pathway and
protect the intestinal epithelial barrier function.

25
To illustrate the potential antioxidant effect of DL-HMTBA, Willemsen et al.
(2011) compared the effects of dietary DL-HMTBA or DL-Met supplementation on
broiler chickens exposed to heat stress (32°C-33°C). High temperature exposure can
impair growth performance and induce oxidative stress in poultry. However, the negative
effects on reduced body weight gain and feed intake were less pronounced with DL-
HMTBA supplementation. Also, at 6 week of age, both the plasma thiobarbituric acid
reactive substances (TBARS) level resulting from lipid peroxidation and the hepatic ratio
of oxidized glutathione (GSSG) to reduced GSH (rGSH) were significantly lower in DL-
HMTBA supplemented chickens compared to DL-Met group. Thus, DL-HMTBA fed
chickens may have developed a better nonenzymatic antioxidant defense mechanism
against heat stress.
DL-HMTBA supplementation mitigated the decreased feed utilization and
decreased humoral and nonspecific immunocompetence of broiler chickens due to Met
deficiency (Zhang and Guo, 2008), and also mitigated the impaired body weight gain due
to low protein diet (Swennen et al., 2011). Furthermore, Xie et al. (2007) showed that
excess Met sources led to toxicity in ducks. But the plasma homocysteine level of ducks
fed DL-HMTBA supplemented diets was significantly lower than ducks fed equimolar
DL-Met supplemented diets, suggesting reduced toxicity of DL-HMTBA relative to DL-
Met. A more recent study on turbot fish also demonstrated a higher serum ascorbic acid
concentration associated with dietary DL-HMTBA supplementation, suggesting an
antioxidant activity and immune function of DL-HMTBA in fish (Ma et al., 2013).
In mammals, Tang et al. (2011) showed that supplementation of 0.2% DL-
HMTBA brought about a significant improvement in antioxidant defenses in high fat

26
diet-fed male C57BL/6 mice. Excessive fat intake can induce the hyper-secretion of
insulin, which then increases feed intake and subsequently increases electron flow along
the mitochondrial respiratory chain, resulting in oxidative stress. The supplementation of
0.2% DL-HMTBA can restore these changes, indicating the potential of DL-HMTBA as
a dietary supplement to considerably improve certain metabolic disorders and address the
redox imbalance.
Some more recent studies showed that dietary DL-HMTBA supplementation had
a positive effect on microbial protein synthesis in the rumen of dairy cows (Lee et al.,
2015), and can improve the digestibility of phosphorus in a corn-soybean diet if supplied
together with micro-minerals such as zinc, copper and manganese in piglets (Liu et al.,
2014).
In human Caco-2 cells, pre-incubation with DL-HMTBA partially prevented the
inflammation induced by H2O2 or inflammatory cytokine tumor necrosis factor α, while
pre-incubation with DL-Met did not significantly improve the antioxidant capacity of the
Caco-2 cells (Martin-Venegas et al., 2013). The protective role of DL-HMTBA on
intestinal epithelial barrier function was reflected by higher level of taurine and reduced
GSH in this experiment. Also taurine was reported to have the capacity to protect
epithelial barrier function from disruption by oxidative stress generated by
docosahexaenoic acid enrichment (Martin-Venegas et al., 2013). This may partially
explain the antioxidant effect of DL-HMTBA.
Although it still remains unknown whether the human GIT is able to take
advantage of DL-HMTBA, DL-HMTBA is currently being marketed as an enteral
product, in conjunction with a low-protein diet, for patients suffering with chronic renal

27
insufficiency (Feiten et al., 2005). Moreover, the protection of barrier function by dietary
DL-HMTBA reduced the passage of macromolecules such as antigens and pathogens
through the para-cellular pathway, thus contributing to the quality of animal products for
human consumption (Martin-Venegas et al., 2013).
2.6 Summary and perspective
In this review, I summarized the absorption, transport, metabolism and bio-
efficiency of three dietary Met sources, L-Met, DL-Met and DL-HMTBA in different
species including poultry, swine and ruminants. DL-HMTBA is an efficacious Met
precursor in the promotion of growth in chickens and pigs. It is absorbed mainly by
diffusion, while uptake of D-Met and L-Met takes place via multiple carrier-mediated
systems. DL-HMTBA is absorbed along the entire GIT, especially the upper GIT.
Intestine, liver and kidney all can remove D-Met and DL-HMTBA from circulation and
metabolize them to L-Met through oxidation and transamination.
Dietary Met is indispensable in the animal nutrition industry, and can be utilized
to promote animal growth and development and improve the quality of animal products
for human consumption. Compared to DL-Met, dietary DL-HMTBA supplementation
also has potential benefits in anti-oxidation. DL-HMTBA is promising as a feed additive
to alleviate some metabolic diseases to improve both animal performance and human
health.

28
LITERATURE CITED
Agostini, P. S., P. Dalibard, Y. Mercier, P. Van der Aar, and J. D. Van der Klis. 2016.
Comparison of methionine sources around requirement levels using a methionine
efficacy method in 0 to 28 day old broilers. Poult Sci 95: 560-569.
Backlund, P. S., Jr., C. P. Chang, and R. A. Smith. 1982. Identification of 2-keto-4-
methylthiobutyrate as an intermediate compound in methionine synthesis from 5'-
methylthioadenosine. J Biol Chem 257: 4196-4202.
Barnes, D. M., C. C. Calvert, and K. C. Klasing. 1995. Methionine deficiency decreases
protein accretion and synthesis but not tRNA acylation in muscles of chicks. J Nutr
125: 2623-2630.
Bauchart-Thevret, C., B. Stoll, and D. G. Burrin. 2009a. Intestinal metabolism of sulfur
amino acids. Nutr Res Rev 22: 175-187.
Bauchart-Thevret, C., B. Stoll, S. Chacko, and D. G. Burrin. 2009b. Sulfur amino acid
deficiency upregulates intestinal methionine cycle activity and suppresses epithelial
growth in neonatal pigs. Am J Physiol Endocrinol Metab 296: E1239-1250.
Bird, F. H. 1952. A Comparison of Methionine and 2 of Its Analogues in the Nutrition of
the Chick. Poultry Science 31: 1095-1096.
Bishop, R. B., and H. R. Halloran. 1977. The effect of methionine or methionine hydroxy
analogue supplementation on chick response to total sulfur amino acid intake. Poult
Sci 56: 383-385.
Brachet, P., and A. Puigserver. 1987. Transport of methionine hydroxy analog across the
brush border membrane of rat jejunum. J Nutr 117: 1241-1246.
Brachet, P., and A. Puigserver. 1989. Na+-independent and nonstereospecific transport of
2-hydroxy 4-methylthiobutanoic acid by brush border membrane vesicles from chick
small intestine. Comp Biochem Physiol B 94: 157-163.
Brachet, P., and A. Puigserver. 1992. Regional differences for the D-amino acid oxidase-
catalysed oxidation of D-methionine in chicken small intestine. Comp Biochem
Physiol B 101: 509-511.
Brandsch, M., and C. Brandsch. 2003. Intestinal transport of amino acids, peptides and
proteins. Progress in Research on Energy and Protein Metabolism: 667-680.

29
Broer, S. 2008. Amino acid transport across mammalian intestinal and renal epithelia.
Physiol Rev 88: 249-286.
Burrin, D. G., and B. Stoll. 2007. Emerging aspects of gut sulfur amino acid metabolism.
Curr Opin Clin Nutr Metab Care 10: 63-68.
Dave, M. H., N. Schulz, M. Zecevic, C. A. Wagner, and F. Verrey. 2004. Expression of
heteromeric amino acid transporters along the murine intestine. J Physiol 558: 597-
610.
Dibner, J. J. 1983. Utilization of supplemental methionine sources by primary cultures of
chick hepatocytes. J Nutr 113: 2116-2123.
Dibner, J. J., and P. Buttin. 2002. Use of organic acids as a model to study the impact of
gut microflora on nutrition and metabolism. Journal of Applied Poultry Research 11:
453-463.
Dibner, J. J., R. C. Durley, J. G. Kostelc, and F. J. Ivey. 1990. 2-Hydroxy-4-(methylthio)
butanoic acid is a naturally occurring methionine precursor in the chick. J Nutr 120:
553-560.
Dibner, J. J., and F. J. Ivey. 1990. Hepatic protein and amino-acid metabolism in poultry.
Poult Sci 69: 1188-1194.
Dibner, J. J., and F. J. Ivey. 1992. Capacity in the liver of the broiler chick for conversion
of supplemental methionine activity to L-methionine. Poult Sci 71: 700-708.
Dibner, J. J., and C. D. Knight. 1984. Conversion of 2-hydroxy-4-(methylthio)butanoic
acid to L-methionine in the chick: a stereospecific pathway. J Nutr 114: 1716-1723.
Dilger, R. N., and D. H. Baker. 2007. DL-Methionine is as efficacious as L-methionine,
but modest L-cystine excesses are anorexigenic in sulfur amino acid-deficient
purified and practical-type diets fed to chicks. Poult Sci 86: 2367-2374.
Dilger, R. N., C. Kobler, C. Weckbecker, D. Hoehler, and D. H. Baker. 2007. 2-keto-4-
(methylthio)butyric acid (keto analog of methionine) is a safe and efficacious
precursor of L-methionine in chicks. J Nutr 137: 1868-1873.
Dupuis, L., P. Brachet, and A. Puigserver. 1990. Oxidation of the supplemental
methionine source L-2-hydroxy-4-methylthiobutanoic acid by pure L-2-hydroxy acid
oxidase from chicken liver. J Nutr 120: 1171-1178.

30
Dupuis, L., C. L. Saunderson, A. Puigserver, and P. Brachet. 1989. Oxidation of
methionine and 2-hydroxy 4-methylthiobutanoic acid stereoisomers in chicken
tissues. Br J Nutr 62: 63-75.
Elkin, R. G., and P. Y. Hester. 1983. A comparison of methionine sources for broiler
chickens fed corn-soybean meal diets under simulated commercial grow-out
conditions. Poult Sci 62: 2030-2043.
Elwert, C., E. D. Fernandes, and A. Lemme. 2008. Biological effectiveness of methionine
hydroxy-analogue calcium salt in relation to DL-methionine in broiler chickens.
Asian-Australasian Journal of Animal Sciences 21: 1506-1515.
Esteve-Garcia, E., and L. L. Llaurado. 1997. Performance, breast meat yield and
abdominal fat deposition of male broiler chickens fed diets supplemented with DL-
methionine or DL-methionine hydroxy analogue free acid. Br Poult Sci 38: 397-404.
Fang, Z. et al. 2010a. Methionine metabolism in piglets fed DL-methionine or its
hydroxy analogue was affected by distribution of enzymes oxidizing these sources to
keto-methionine. J Agric Food Chem 58: 2008-2014.
Fang, Z. et al. 2010b. Nutrition and health relevant regulation of intestinal sulfur amino
acid metabolism. Amino Acids 39: 633-640.
Fang, Z. F. et al. 2009. Effects of 2-hydroxy-4-methylthiobutyrate on portal plasma flow
and net portal appearance of amino acids in piglets. Amino Acids 36: 501-509.
Feiten, S. F. et al. 2005. Short-term effects of a very-low-protein diet supplemented with
ketoacids in nondialyzed chronic kidney disease patients. Eur J Clin Nutr 59: 129-
136.
Ferjancic-Biagini, A., L. Dupuis, J. De Caro, and A. Puigserver. 1995. In vitro oxidative
decarboxylation of L-2-hydroxy-4-methylthiobutanoic acid by L-2-hydroxy acid
oxidase A from chicken liver. Biochimie 77: 249-255.
Ferjancic-Biagini, A., L. Dupuis, J. De Caro, and A. Puigserver. 1998. Inhibitory effects
of anions and active site amino acid sequence of chicken liver L-2-hydroxyacid
oxidase A, a member of the FMN-dependent alpha-hydroxyacid oxidizing enzyme
family. Biochimie 80: 1047-1054.
Fotiadis, D., Y. Kanai, and M. Palacin. 2013. The SLC3 and SLC7 families of amino acid
transporters. Mol Aspects Med 34: 139-158.
31
Garlich, J. D. 1985. Response of broilers to DL-methionine hydroxy analog free acid,
DL-methionine, and L-methionine. Poult Sci 64: 1541-1548.
Gilbert, E. R., E. A. Wong, and K. E. Webb, Jr. 2008. Board-invited review: Peptide
absorption and utilization: Implications for animal nutrition and health. J Anim Sci
86: 2135-2155.
Gonzales-Esquerra, R. et al. 2007. Evidence of a different dose response in turkeys when
fed 2-hydroxy-4(methylthio) butanoic acid versus DL-methionine. Poult Sci 86: 517-
524.
Halestrap, A. P. 2013. The SLC16 gene family - structure, role and regulation in health
and disease. Mol Aspects Med 34: 337-349.
Hoehler, D. 2006. No evidence for different dose responses of commercial methionine
sources in broilers. Poult Sci 85: 2047.
Hyde, R., P. M. Taylor, and H. S. Hundal. 2003. Amino acid transporters: roles in amino
acid sensing and signalling in animal cells. Biochem J 373: 1-18.
Jendza, J. A., P. A. Geraert, D. Ragland, and O. Adeola. 2011. The site of intestinal
disappearance of DL-methionine and methionine hydroxy analog differs in pigs. J
Anim Sci 89: 1385-1391.
Jones, H. N., C. J. Ashworth, K. R. Page, and H. J. McArdle. 2006. Expression and
adaptive regulation of amino acid transport system A in a placental cell line under
amino acid restriction. Reproduction 131: 951-960.
Karau, A., and I. Grayson. 2014. Amino acids in human and animal nutrition. Adv
Biochem Eng Biotechnol 143: 189-228.
Karunakaran, S. et al. 2011. SLC6A14 (ATB0,+) protein, a highly concentrative and
broad specific amino acid transporter, is a novel and effective drug target for
treatment of estrogen receptor-positive breast cancer. J Biol Chem 286: 31830-
31838.
Katz, R. S., and D. H. Baker. 1975. Factors associated with utilization of the calcium salt
of methionine hydroxy analogue by the young chick. Poult Sci 54: 584-591.
Knight, C. D., C. A. Atwell, C. W. Wuelling, F. J. Ivey, and J. J. Dibner. 1998. The
relative effectiveness of 2-hydroxy-4-(methylthio) butanoic acid and DL-methionine
in young swine. J Anim Sci 76: 781-787.

32
Knight, C. D., and J. J. Dibner. 1984. Comparative absorption of 2-hydroxy-4-
(methylthio)-butanoic acid and L-methionine in the broiler chick. J Nutr 114: 2179-
2186.
Kratzer, D. D., and R. C. Littell. 2006. Appropriate statistical methods to compare dose
responses of methionine sources. Poult Sci 85: 947-954.
Lapierre, H. et al. 2011. Metabolism of 2-hydroxy-4-(methylthio)butanoate (HMTBA) in
lactating dairy cows. J Dairy Sci 94: 1526-1535.
Lee, C. et al. 2015. Effect of 2-hydroxy-4-methylthio-butanoic acid on ruminal
fermentation, bacterial distribution, digestibility, and performance of lactating dairy
cows. J Dairy Sci 98: 1234-1247.
Lemme, A., D. Hoehler, J. J. Brennan, and P. F. Mannion. 2002. Relative effectiveness of
methionine hydroxy analog compared to DL-methionine in broiler chickens. Poult
Sci 81: 838-845.
Littell, R. C., P. R. Henry, A. J. Lewis, and C. B. Ammerman. 1997. Estimation of
relative bioavailability of nutrients using SAS procedures. J Anim Sci 75: 2672-
2683.
Liu, Y., Y. L. Ma, J. M. Zhao, M. Vazquez-Anon, and H. H. Stein. 2014. Digestibility
and retention of zinc, copper, manganese, iron, calcium, and phosphorus in pigs fed
diets containing inorganic or organic minerals. J Anim Sci 92: 3407-3415.
Liu, Y. L. et al. 2007. Impact of feeding 2-hydroxy-4-(methylthio)butanoic acid and DL-
methionine supplemented maize-soybean-rapeseed meal diets on growth
performance and carcass quality of broilers. Br Poult Sci 48: 190-197.
Lobley, G. E. et al. 2006a. Absorption of 2-hydroxy-4-methylthiobutyrate and conversion
to methionine in lambs. J Dairy Sci 89: 1072-1080.
Lobley, G. E. et al. 2006b. Absorption and digestive tract metabolism of 2-hydroxy-4-
methylthiobutanoic acid in lambs. J Dairy Sci 89: 3508-3521.
Ma, R. et al. 2013. Comparative study on the effects of L-methionine or 2-hydroxy-4-
(methylthio) butanoic acid as dietary methionine source on growth performance and
anti-oxidative responses of turbot (Psetta maxima). Aquaculture 412: 136-143.
Maenz, D. D., and C. M. Engele-Schaan. 1996a. Methionine and 2-hydroxy-4-
methylthiobutanoic acid are partially converted to nonabsorbed compounds during

33
passage through the small intestine and heat exposure does not affect small intestinal
absorption of methionine sources in broiler chicks. J Nutr 126: 1438-1444.
Maenz, D. D., and C. M. Engele-Schaan. 1996b. Methionine and 2-hydroxy-4-
methylthiobutanoic acid are transported by distinct Na(+)-dependent and H(+)-
dependent systems in the brush border membrane of the chick intestinal epithelium. J
Nutr 126: 529-536.
Martin-Venegas, R. et al. 2013. The methionine precursor DL-2-hydroxy-(4-
methylthio)butanoic acid protects intestinal epithelial barrier function. Food Chem
141: 1702-1709.
Martin-Venegas, R., M. T. Brufau, Y. Mercier, P. A. Geraert, and R. Ferrer. 2011.
Intestinal cell conversion of DL-2-hydroxy-(4-methylthio)butanoic acid in vitro:
dietary up-regulation by this methionine precursor. Br J Nutr 106: 350-356.
Martin-Venegas, R., P. A. Geraert, and R. Ferrer. 2006. Conversion of the methionine
hydroxy analogue DL-2-hydroxy-(4-methylthio) butanoic acid to sulfur-containing
amino acids in the chicken small intestine. Poult Sci 85: 1932-1938.
Martin-Venegas, R., P. A. Geraert, and R. Ferrer. 2008. Partial Na+ dependence of DL-2-
hydroxy-4-(methylthio)butanoic acid uptake in the chicken small intestine. Poult Sci
87: 1392-1394.
Martin-Venegas, R., M. J. Rodriguez-Lagunas, P. A. Geraert, and R. Ferrer. 2007.
Monocarboxylate transporter 1 mediates DL-2-Hydroxy-(4-methylthio)butanoic acid
transport across the apical membrane of Caco-2 cell monolayers. J Nutr 137: 49-54.
McCollum, M. Q., M. Vazquez-Anon, J. J. Dibner, and K. E. Webb, Jr. 2000. Absorption
of 2-hydroxy-4-(methylthio)butanoic acid by isolated sheep ruminal and omasal
epithelia. J Anim Sci 78: 1078-1083.
Metayer-Coustard, S. et al. 2010. Methionine deprivation regulates the S6K1 pathway
and protein synthesis in avian QM7 myoblasts without activating the GCN2/eIF2
alpha cascade. J Nutr 140: 1539-1545.
Muramatsu, T., O. Takasu, M. Furuse, I. Tasaki, and J. Okumura. 1987. Influence of the
gut microflora on protein synthesis in tissues and in the whole body of chicks.
Biochem J 246: 475-479.

34
Noftsger, S., N. R. St-Pierre, and J. T. Sylvester. 2005. Determination of rumen
degradability and ruminal effects of three sources of methionine in lactating cows. J
Dairy Sci 88: 223-237.
Obeid, R. 2013. The metabolic burden of methyl donor deficiency with focus on the
betaine homocysteine methyltransferase pathway. Nutrients 5: 3481-3495.
Pinilla, J. et al. 2011. SNAT2 transceptor signalling via mTOR: a role in cell growth and
proliferation? Front Biosci (Elite Ed) 3: 1289-1299.
Rangel-Lugo, M., and R. E. Austic. 1998. Transamination of 2-oxo-4-
[methylthio]butanoic acid in chicken tissues. Poult Sci 77: 98-104.
Rask-Andersen, M., S. Masuram, R. Fredriksson, and H. B. Schioth. 2013. Solute carriers
as drug targets: current use, clinical trials and prospective. Mol Aspects Med 34:
702-710.
Richards, J. D., C. A. Atwell, M. Vazquez-Anon, and J. J. Dibner. 2005. Comparative in
vitro and in vivo absorption of 2-hydroxy-4(methylthio) butanoic acid and
methionine in the broiler chicken. Poult Sci 84: 1397-1405.
Romeo, E. et al. 2006. Luminal kidney and intestine SLC6 amino acid transporters of
B0AT-cluster and their tissue distribution in Mus musculus. Am J Physiol Renal
Physiol 290: F376-383.
Sauer, N. et al. 2008. Meta-analysis of the relative efficiency of methionine-hydroxy-
analogue-free-acid compared with DL-methionine in broilers using nonlinear mixed
models. Poult Sci 87: 2023-2031.
Saunderson, C. L. 1985. Comparative metabolism of L-methionine, DL-methionine and
DL-2-hydroxy 4-methylthiobutanoic acid by broiler chicks. Br J Nutr 54: 621-633.
Saunderson, C. L. 1987. Effect of fasting and of methionine deficiency on L-methionine,
DL-methionine and DL-2-hydroxy-4-methylthiobutanoic acid metabolism in broiler
chicks. Br J Nutr 57: 429-437.
Schioth, H. B., S. Roshanbin, M. G. Hagglund, and R. Fredriksson. 2013. Evolutionary
origin of amino acid transporter families SLC32, SLC36 and SLC38 and
physiological, pathological and therapeutic aspects. Mol Aspects Med 34: 571-585.
Smith, M. E., and D. G. Morton. 2010. The digestive system : basic science and clinical.
2nd ed. Churchill Livingstone, Edinburgh ; New York.

35
Smith, R. E. 1966. Utilization of L-Methionine DL-Methionine and methionine hydroxy
analogue by growing chick. Poultry Science 45: 571-577.
Soriano-Garcia, J. F., M. Torras-Llort, R. Ferrer, and M. Moreto. 1998. Multiple
pathways for L-methionine transport in brush-border membrane vesicles from
chicken jejunum. J Physiol 509 ( Pt 2): 527-539.
Swennen, Q. et al. 2011. Effects of dietary protein content and 2-hydroxy-4-
methylthiobutanoic acid or DL-methionine supplementation on performance and
oxidative status of broiler chickens. Br J Nutr 106: 1845-1854.
Tang, X., Y. Yang, Y. Shi, and G. Le. 2011. Comparative in vivo antioxidant capacity of
DL-2-hydroxy-4-methylthiobutanoic acid (HMTBA) and DL-methionine in male
mice fed a high-fat diet. J Sci Food Agric 91: 2166-2172.
Van Winkle, L. J., J. K. Tesch, A. Shah, and A. L. Campione. 2006. System B0,+ amino
acid transport regulates the penetration stage of blastocyst implantation with possible
long-term developmental consequences through adulthood. Hum Reprod Update 12:
145-157.
Vazquez-Anon, M. et al. 2006. Evidence for 2-hydroxy-4(methylthio) butanoic acid and
DL-methionine having different dose responses in growing broilers. Poult Sci 85:
1409-1420.
Vedenov, D., and G. M. Pesti. 2010. An economic analysis of a methionine source
comparison response model. Poult Sci 89: 2514-2520.
Waldroup, P. W. et al. 1981. Effectiveness of the free acid of methionine hydroxy
analogue as a methionine supplement in broiler diets. Poult Sci 60: 438-443.
Wang, S. et al. 2001. Uptake of DL-2-hydroxy-4-methylthio-butanoic acid (DL-HMB) in
the broiler liver in vivo. Poult Sci 80: 1619-1624.
Wester, T. J. et al. 2006. Hepatic metabolism of 2-hydroxy-4-methylthiobutyrate in
growing lambs. J Dairy Sci 89: 1062-1071.
Willemsen, H. et al. 2011. Effects of dietary supplementation of methionine and its
hydroxy analog DL-2-hydroxy-4-methylthiobutanoic acid on growth performance,
plasma hormone levels, and the redox status of broiler chickens exposed to high
temperatures. Poult Sci 90: 2311-2320.

36
Wu, G. Y., and J. R. Thompson. 1989. Is methionine transaminated in skeletal muscle?
Biochem J 257: 281-284.
Xie, M., S. S. Hou, W. Huang, and H. P. Fan. 2007. Effect of excess methionine and
methionine hydroxy analogue on growth performance and plasma homocysteine of
growing Pekin ducks. Poult Sci 86: 1995-1999.
Zhang, L. B., and Y. M. Guo. 2008. Effects of liquid DL-2-hydroxy-4-methylthio
butanoic acid on growth performance and immune responses in broiler chickens.
Poult Sci 87: 1370-1376.
Zou, L. et al. 2015. Effects of DL-2-hydroxy-4-(methylthio) butanoic acid on broilers at
different dietary inclusion rates. British Poultry Science 56: 337-344.

37
Table 2.1 Small intestinal amino acid transporters related to methionine transport in
mammals and avians.
System Transporter SLC name1 Location2 Description/gene function
A
SAT1 SLC38A1 BL Na+-dependent short-chained neutral amino acid
transporter.
SAT2 SLC38A2 BL Na+-dependent neutral amino acid transporter.
Sensitive to low pH. Ubiquitous expression.
SAT3 SLC38A3 BL Na+-dependent neutral amino
acid transporter.
B B0AT SLC6A19 BBM Na+-dependent neutral amino acid
transporter.
B0,+ ATB0,+ SLC6A14 BBM Na+-dependent neutral and cationic amino acid
transporter.
b0,+
b0,+AT SLC7A9 BBM Na+-independent cationic and neutral amino acid
exchanger.
rBAT SLC3A1 / Heavy chain corresponding to the
b0,+ transport system, dimerizes with b0,+AT
L LAT1 SLC7A5 BL
Na+-independent neutral amino acid transporter,
exchanger for large hydrophobic amino acids.
Ubiquitous expression.
LAT2 SLC7A8 BL Same as LAT1. Not present in the chicken genome.
y+L
y+LAT1 SLC7A7 BL Na+-independent cationic/ Na+-dependent neutral
amino acid exchanger.
y+LAT2 SLC7A6 BL Na+-independent cationic/ Na+-dependent neutral
amino acid exchanger.
/ 4F2hc SLC3A2 / 4F2 cell-surface antigen heavy chain, dimerizes
with LAT1, y+LAT1 and y+LAT2.
1 SLC: solute carrier family.
2 BBM: brushborder membrane; BL: basolateral membrane.

38
Figure 2.1 Chemical structures of 2-hydroxy-4 (methylthio) butanoic acid, 2-keto-4
(methylthio) butanoic acid and methionine. The α-hydroxyl group in
DL-HMTBA can be oxidized to the α-keto group in KMB by L-HAOX or D-HADH, and
can then be converted to α-amino group by transaminases. The major
transaminases reported in animals include BCAT in skeletal muscle, with amino group
donors of branched-chain amino acids, and GPT and GOT in liver,
with amino group donors of glutamate. BCAT: branched-chain amino acid transaminase;
D-HADH: D-2-hydroxy acid dehydrogenase; GPT: glutamate pyruvate transaminase;
GOT: glutamic oxaloacetic acid transaminase; L-HAOX: L-2-hydroxy acid oxidase.

39
Figure 2.2 Absorption, transport and metabolism of L-Met, D-Met and DL-HMTBA in
non-ruminants. L-Met, D-Met and DL-HMTBA can be absorbed through diffusion
or multiple carrier-mediated transport systems in the small intestine. D-Met and DL-
HMTBA must be metabolized to L-Met for utilization. The product
L-Met can be used for protein synthesis, or undergo transmethylation or transsulfuration.
D-AAOX: D-amino acid oxidase; D-HADH: D-2-hydroxy acid
dehydrogenase; D-Met: D-methionine; HMTBA: 2-hydroxy-4 (methylthio) butanoic
acid; KMB: 2-keto-4 (methylthio) butanoic acid; L-HAOX: L-2-hydroxy
acid oxidase; L-Met: L-methionine; MCT1: monocarboxylate transporter 1; MTA: 5’-
deoxy-5’-methylthioadenosine; NHE3: Na+/H+ exchanger; SAM:
S-adenosylmethionine.
40
CHAPTER 3 DNA Methylation, Blood Profile and Intestinal Nutrient Transporter
Gene Expression in Broiler Chickens Fed Methionine Isomers or Precursors
3.1 Abstract
Methionine (Met) is generally the first limiting amino acid in corn-soybean based
diets for poultry. The objective of this study was to determine the effect of
supplementation of L-methionine (L-Met), DL-methionine (DL-Met) and the methionine
analogue, DL-2-hydroxy-4-(methylthio) butanoic acid (DL-HMTBA), and Met
deficiency on DNA methylation, blood profile and intestinal nutrient transporter gene
expression of broiler chickens. Male Cobb-500 broilers were fed from day of hatch (d0)
to d35 post-hatch using a diet deficient in methionine plus cysteine (Met + Cys) (control),
or the same diet supplemented with 0.22% DL-Met, 0.22% L-Met or 0.31% DL-HMTBA
to meet the Met + Cys requirements. Tissue (liver, duodenum, jejunum and ileum) and
blood samples were collected at various ages, from d0 to d35. Performance of the birds,
blood parameters (e.g., acute phase proteins, white blood cell counts), mRNA expression
of intestinal nutrient transporters and DNA methylation properties of liver tissues were
examined. Both body weight and feed efficiency were improved in Met supplemented
groups compared to the control group. No significant differences were observed among
DL-Met, L-Met and DL-HMTBA for growth performance parameters. L-Met and DL-
Met supplementation decreased the acute phase protein, serum amyloid A, while DL-
HMTBA had no effect. Met supplementation had no effect on red blood cell packed cell
volume, white blood cell differentiation count, hepatic total DNA methylation or DNA
methyltransferase (DNMT) activity. L-Met and DL-Met, but not DL-HMTBA,

41
supplementation resulted in enhanced expression of the ATB0,+ and B0AT transporters in
various small intestinal segments. All Met sources increased expression of MCT1 in the
jejunum. In conclusion, Met supplementation improved growth performance of male
broilers. Met supplementation was also associated with changes in intestinal nutrient
transporter gene expression in certain segments and ages, suggesting that intestinal amino
acid absorptive function can be regulated by the source of amino acid and effects are
complex and dynamic.

42
3.2 Introduction
Methionine (Met) is an essential amino acid in mammals and is the first limiting
amino acid in a broiler diet and thus its uptake from the diet is required for growth and
development. Met is supplemented in feed as L-methionine (L-Met), DL-methionine
(DL-Met, a mixture of the L- and D- enantiomers) and the methionine analogue, DL-2-
hydroxy-4-(methylthio) butanoic acid (DL-HMTBA). DL-HMTBA lacks an amino group
and thus is not an amino acid but an amino acid precursor that needs to be converted to L-
Met (Dibner and Knight, 1984). Many studies have addressed the relative efficiency of
these Met sources (Lemme et al., 2002; Hoehler et al., 2005; Elwert et al., 2008; Sauer et
al., 2008). Met is a precursor for the synthesis of proteins and serves as the predominant
amino acid for translation initiation. In addition, Met is an intermediate in the
biosynthesis of other important molecules such as cysteine, carnitine and taurine and can
be converted to S-adenosylmethionine (SAM), which serves as a methyl donor.
The assimilation of dietary nutrients occurs mainly in the small intestine. Dietary
proteins are first digested through enzymatic hydrolysis to generate absorbable end
products, including free amino acids and peptides. These nutrients are taken up by
epithelial cells that line the small intestine by a variety of transporters. Once inside the
epithelial cells, these nutrients are either used for cell metabolism or transported out of
the cell and into the blood for delivery to other cells and tissues (Broer, 2008; Gilbert et
al., 2008).
The amino acid and peptide transporters are members of the Solute Carrier (SLC)
gene series, which includes 52 families and 395 transporter genes in the human genome
(Hediger et al., 2013). These transporters are located in the brush border membrane for

43
transport of amino acids from the intestinal lumen to the inside of the intestinal epithelial
cells and on the basolateral membrane for transport of amino acids from the inside of the
epithelial cell to the blood or vice versa. In mammals, the amino acid transporters act in a
Na+-dependent or Na+-independent manner. At the brush border membrane, free Met is
transported by Na+-dependent neutral amino acid transporters B0AT, Na+-dependent
neutral and cationic amino acid transporter ATB0,+, and Na+-independent cationic and
neutral amino acid transporter b0,+AT (Hyde et al., 2003; Pramod et al., 2013).
Furthermore, at the brush border membrane, the H+-dependent peptide transporter PepT1
transports a wide variety of di- and tripeptides into the intestinal epithelial cells (Gilbert
et al., 2008; Smith et al., 2013). At the basolateral membrane, Met is transported by Na+-
dependent neutral amino acid transporters SAT1, SAT2, and SAT3, Na+-independent
neutral amino acid transporters LAT1 and LAT2, and Na+-dependent neutral amino acid
transporters y+LAT1 and y+LAT2. The amino acid transporters b0,+AT, LAT1, LAT2,
y+LAT1 and y+LAT2 are heterodimeric transporters: b0,+AT complexes with rBAT and
LAT1, LAT2, y+LAT1 and y+LAT2 complex with 4F2hc (Broer, 2008; Fotiadis et al.,
2013; Broer, 2014). A search of the chicken genome (Ensembl, release 83 – December
2015) did not reveal a chicken ortholog to LAT2. In chickens, Met is transported by the
Na+-independent systems b0,+ and L, and the Na+-dependent systems y+, B and A
(Soriano-Garcia et al., 1998). In contrast, DL-HMTBA transport was reported to be
associated with the proton dependent monocarboxylate transporter 1 (MCT1) and the
Na+-H+ exchanger (NHE3) (Martin-Venegas et al., 2007; 2008) .
Methylation is a covalent modification that is critical for regulating gene
transcriptional activity. DNA methylation involves the addition of a methyl group by
44
DNA methyltransferases (DNMTs) to the pyrimidine ring of cytosine at the 5-carbon,
which results in 5-methylcytosine at CpG dinucleotides (reviewed by Breiling and Lyko,
2015) . Hypermethylation of DNA, particularly at dense regions of CpGs called CpG
islands, serves as a major transcriptional silencing mechanism (Gilbert and Liu, 2012).
From a nutritional perspective, one-carbon metabolism is controlled by availability of
essential nutrients. Dietary deficiencies or excesses in methyl donors and enzymatic
cofactors may lead to global changes in DNA methylation patterns. Met is a precursor for
the biosynthesis of SAM, which is a vital methyl donor in more than 80 different
biological reactions including methylation of DNA, RNA and proteins.
Acute phase proteins are blood proteins, which serve as biomarkers of infection,
inflammation and stress (Murata, 2007; Eckersall and Bell, 2010). The acute phase
protein levels after a single stimulus remain unchanged for 48 h or longer, and thus can
be used for assessment of general health in animals (Gruys et al., 2005). Serum amyloid
A (SAA) and alpha -1-acid glycoprotein (α-1-AGP) are two acute phase proteins
commonly studied in chickens. Furthermore, the number of lymphocytes would decrease
and the number of heterophils would increase in response to stress in chicken blood
samples (Gross and Siegel, 1983). Thus, evaluation of the heterophil/lymphocyte ratio
also acts as a measure of the stress response in chickens. Red blood cell packed cell
volume (RBC-PCV) is the volume percentage of red blood cells in whole blood. A low
RBC-PCV value is an indicator of anemia.
The objective of this study was to determine the effects of different dietary Met
source supplementation and Met deficiency on intestinal amino
acid/peptide/monocarboxylic acid transporter gene expression, global DNA methylation,
45
white blood cell differentiation count and expression of acute phase proteins in male
broiler chickens. We hypothesized that dietary Met supplementation would increase
hepatic DNA methylation, decrease expression of acute phase proteins and alter the
expression profiles of intestinal nutrient transporter genes.
3.3 Materials and Methods
3.3.1 Animals
The animal protocol was approved by the Institutional Animal Care and Use
Committee at Virginia Tech. Mixed sex, day of hatch Cobb 500 broiler chicks were
sourced locally (Tyson Food Inc., Crewe, VA). Eight day-old chicks were identified as
males by visual sexing of gonadal tissue and used for collection of liver and intestinal
tissue. A blood sample was drawn from approximately 700 chicks, which were then
randomly distributed into heated floor pens with new wood shavings based on body
weight and given one of the four experimental diets: Control (C): deficient in dietary Met
+ Cys, without any supplementation of Met sources; Treatment 1 (DL-Met): control diet
+ 0.22% DL-Met; Treatment 2 (L-Met): control diet + 0.22% L-Met and Treatment 3
(DL-HMTBA): control diet + 0.31% DL-HMTBA (to provide 0.22% DL-Met
equivalent). The supplementation calculated for L-Met was recalculated for DL-Met and
DL-HMTBA on an equimolar basis, which resulted in levels of 0.22% for DL-Met or L-
Met and 0.31% for DL-HMTBA.
The sex of the chicks was determined using a PCR-based method. Briefly, 2-5 L
of blood was processed using the Phusion Blood Direct PCR Kit (Thermo Scientific,
Waltham, MA) and PCR was performed using primers for the W chromosome and the
tyrosinase gene (Gilbert et al., 2007). On d3, female chicks and chicks with an ambiguous

46
PCR test were removed from the pens. The remaining 242 male chicks were redistributed
within their treatment group into 6 replicate pens per treatment based on body weight
(~10 chickens/pen, see Appendix B, Table B for details) and fed the experimental diets
until d26. Due to limitations in availability of the research facility, chickens were moved
from floor pens to cages (2 chickens/cage, 15 cages/treatment) and fed the 4 experimental
diets. Because there were only 2 chickens per cage, this was considered insufficient for
calculating feed conversion efficiency and thus feed intake and feed conversion
efficiency are only reported to d26, while the chickens were being raised in floor pens.
All pens had 24h lighting and the temperature was set at 80F. Chickens were
given ad libitum access to feed and water. A starter diet was fed from 0 to 10 d, a grower
diet from 11 to 21 d, and a finisher diet from 22 to 35 d. Feed was produced by Research
Diet Services BV (Utrecht, Netherlands). Basal diets were formulated to meet the
broilers’ requirements (Aminochick® 2.0, Evonik Nutrition & Care GmbH, Germany)
except for Met + Cys. Three Met sources (DL-Met (Evonik), L-Met (Evonik-Rexim),
HMTBA (MHA-FA, Novus)) were supplemented to the basal diets in order to meet or
slightly exceed the broilers Met + Cys requirements (see Appendix A, Table A).
Individual body weights of all chicks in a pen were recorded on d10, d15, d21,
d26 and d35. Feed intake and feed conversion efficiency (feed intake/body weight gain)
of each pen were calculated at the end of the different diet phases while in floor pens
(d10, 21, 26), but were only reported from d10 to d26 because both males and females
were present in the pens from d0 to d3 and thus feed intake for just males could not be
determined for d0 to d10. Abdominal fat weight, breast muscle weight, organ (kidney,
47
liver, heart and small intestine) weight and carcass weight (body weight minus the head
and internal organs) were collected at d10, 21, 26 and 35.
At d0, 3, 5, 10, 21, 26, 35, 6 birds per treatment were euthanized by cervical
dislocation and intestine and liver were collected. The intestine was separated into
duodenum, jejunum, and ileum. The proximal enlarged loop of the small intestine was
taken as the duodenum. The rest of the small intestine was divided by Meckel’s
diverticulum into proximal and distal portions, corresponding to the jejunum and ileum,
respectively. Digesta were gently squeezed out of the intestine and segments were rinsed
three times in PBS (NaH2PO4 1.47 mmol/L, Na2HPO4 8.09 mmol/L, NaCl 145 mmol/L).
Whole segments were stored in RNAlater (Life Technologies, Carlsbad, CA) at -80C.
Liver samples were snap-frozen in liquid nitrogen and then stored at -80C. At d21 and
26, whole blood was collected from the jugular vein using syringes and then kept on ice
in blood vials with EDTA as anticoagulant. Plasma was obtained using 2 mL whole
blood by centrifugation and then stored at -80C.
3.3.2 Dry matter digestibility
Titanium dioxide (TiO2) was added to feed as an indigestible marker. A total of
16 digesta samples (n=4) from 4 different finisher feed samples (C, DL-Met, L-Met and
DL-HMTBA) were collected from ileum at d26 and then freeze-dried. The TiO2
concentration were determined following the protocol of Boguhn et al. (2009). Briefly,
dry samples were digested with sulfuric acid and nitric acid, and then Ti was measured
via inductively coupled plasma atomic emission spectroscopy (ICP-AES) by VT Soils
Lab. Dry matter digestibility was calculated as the ratio of TiO2 in diet to TiO2 in dry
digesta (Boguhn et al., 2009).
48
3.3.3 Global DNA methylation and DNA methyltransferase activity
Genomic DNA was isolated from six liver samples per treatment on d0, 3, 5, 10,
21, 26 and 35 (n=6) using the DNeasy Blood and Tissue Kit (Qiagen, Valencia, CA)
according to the manufacturer’s protocol. Global DNA methylation was quantified using
the MethylFlashTM Methylated DNA Colorimetric Quantification kit (Epigentek,
Farmingdale, NY), following the manufacturer’s instructions. A total of 100 ng DNA was
added to strip wells and the methylated fraction of DNA was quantified colorimetrically
with a multi-mode plate reader (Infinite M200 Pro, Tecan, Morrisville, NC). The amount
of methylated DNA is proportional to the optical density measured at 450 nm.
Nuclear extracts were prepared from 6 liver samples per treatment on d0, 3, 5, 10,
21, 26 and 35 (n=6) using the EpiQuik™ Nuclear Extraction Kit I (Epigentek) according
to the manufacturer’s protocol and stored at -80C. Total DNA methyltransferase
(DNMT) activity was measured using the EpiQuik™ DNMT Activity/Inhibition Assay
Ultra Kit (Colorimetric, Epigentek), according to the manufacturer’s protocol. A total of
4-20 μg nuclear extracts were added to microplate wells and the amount of methylated
DNA, which is proportional to enzyme activity, was measured through an ELISA-like
reaction by reading the absorbance at 450 nm using an Infinite M200 Pro multiplate
reader.
3.3.4 Blood profiling
Red blood cell packed cell volume (RBC-PCV) was measured in fresh blood
samples from d21, 26 and 35 (n=6). StatSpin™ Glass Microhematocrit Tubes (40 mm,
Fisher Scientific, USA) were used to collect fresh blood and then centrifuged in a

49
microhematocrit (StatSpin, USA). RBC-PCV was calculated using a micro-capillary
reader (DAMON/IEC Division, USA).
White blood cell differentiation count was also assayed in fresh blood samples
from d21, 26 and 35 (n=6). Individual blood smears were prepared on glass slides and
Wright-Giemsa differential was used to stain the slides. Three images were captured per
slide with a Nikon Eclipse 80i microscope and DS-Ri1 color camera (Nikon, Japan). The
numbers of eosinophil and heterophil, lymphocyte, basophil and monocyte were counted
per 100 white blood cells per image and the average percentages were calculated.
Analysis of acute phase proteins alpha-1-acid glycoprotein (α-1-AGP) and serum
amyloid A (SAA) in plasma on d21 and 26 (n=6) were assayed using the Chicken α-1-
AGP ELISA Kit (Life Diagnostics, West Chester, PA) and Chicken SAA ELISA Kit
(Life Diagnostics), respectively, following the manufacturer’s protocol. Briefly, the
diluted samples were incubated in the corresponding antibody-coated microtiter wells
together with horseradish peroxidase (HRP) conjugate and protein was measured by
reading the absorbance at 450 nm using an Infinite M200 Pro multiplate reader.
3.3.5 Nutrient transporter gene expression
The small intestinal segments (duodenum, jejunum, and ileum) from five birds
per treatment on d0, 3, 5, 10, 21, 26 and 35 were minced using razor blades and
homogenized in Tri-Reagent (Molecular Research Center, Cincinnati, OH) using 5 mm
stainless steel beads (Qiagen) and a Tissue Lyser II (Qiagen). Total RNA was isolated
following the manufacturer’s instructions (Molecular Research Center). The Direct-zol
RNA MiniPrep Kit (Zymo Research, Irvine, CA) was used for total RNA purification.
The total RNA samples were evaluated for quality by agarose-formaldehyde gel

50
electrophoresis and concentration and purity assessed by spectrophotometry at
260/280/230 nm with a NanoDropTM 1000 (Thermo Scientific, Waltham, MA).
First-strand cDNA was synthesized from 500 ng total RNA with a High Capacity
cDNA Reverse Transcription Kit (Applied Biosystems, Grand Island, NY). Reactions
were performed under the following conditions: 25C for 10 min, 37C for 120 min, and
85C for 5 min. Expression of 14 transporter genes ATB0,+, b0,+AT, B0AT, 4F2hc, LAT1,
MCT1, NHE3, PepT1, rBAT, SAT1, SAT2, SAT3, y+LAT1 and y+LAT2, and 6
reference genes β-actin, hexose-6-phosphate dehydrogenase (H6PD), lactate
dehydrogenase A (LDHA), ribosomal protein L4 (PRL4), ribosomal protein (large, P0)
(PRLP0) and ribosomal protein (large, P1) (PRLP1) were assayed using relative
quantification real time PCR. Primers designed for real time PCR are listed in Table 3.1
and were validated for amplification efficiency before use (90-115% efficiency). Real-
time PCR was performed in duplicate in 10 µL volume reactions that contained 5 µL Fast
SYBR Green Master Mix (Applied Biosystems), 0.5 µL each of 5 µM forward and
reverse primers and 3 µL of 10-fold diluted cDNA using a 7500 Fast Real-Time PCR
System (Applied Biosystems). PCR was performed under the following conditions: 95C
for 20 s and 40 cycles of 90C for 3 s plus 60C for 30 s. A dissociation step consisting of
95C for 15 s, 60C for 1 min, 95C for 15 s and 60C for 15 s was performed at the end
of each PCR reaction to verify that a single amplicon was generated.
Stability of reference genes was tested using geNorm. Three reference genes
(PRL4, PRLP0 and PRLP1) that showed the highest stability were selected from a panel
of 6 reference genes (β-actin, PRL4, PRLP0, PRLP1, H6PD and LDHA) (Vandesompele
et al., 2002). The Cq values of each target gene were analyzed using algorithms provided

51
by Hellemans et al. (2007). Briefly, the average Cq value was calculated for PCR
replicates, then transformed into relative quantities (RQs) using (1+e)-ΔCq, where ΔCq=
Cq (target sample) – Cq (average). The normalization factor (NF) for each sample was
calculated based on the geometric mean of RQs of the three reference genes for that
sample. The normalized relative quantities (NRQs) equals RQ/NF (sample specific),
which was used for statistical analysis.
3.3.6 Data analysis
There were three statistical models for mRNA expression data, which considered:
1) the main effects of treatment, age, small intestinal segment and their interactions; 2)
the main effects of treatment and age and the treatment × age interaction within each
small intestinal segment (duodenum, jejunum, and ileum) and 3) the main effects of
treatment and intestinal segment and the treatment × segment interaction, within each age
(d3, d5, d10, d21, d26, and d35). Data were checked for normality and homogeneity of
variances. Split-plot design was considered when analyzing data from model 1 and 3,
with chicks as the whole plot expressing the error term for testing the effects of treatment,
the segment as the split plot and chicks as the random effect. Data from model 2 were
analyzed by two-way ANOVA. Contrasts were used to separate treatment means.
For the other parameters, the statistical models included the main effects of
treatment, age and their interactions, or the effect of treatment within each age. Data were
checked for normality and homogeneity of variances and analyzed by ANOVA. Means
were separated using Tukey’s Test.

52
JMP Pro version 11.0 (SAS Institute, Cary, NC) was used for statistical analysis.
Data are presented as least square means ± SEM and statistical significance assigned at P
< 0.05.
3.4 Results
3.4.1 Growth performance
Average body weight of the chickens fed the control (C) and treatment diets (DL-
Met, L-Met, and DL-HMTBA) from d10 to d35 are shown in Table 3.2. Analysis of body
weight within each time point (d10, 15, 21, 26, 35) showed an increase for DL-Met, L-
Met, and DL-HMTBA compared to C (P < 0.001). However, there was no difference
among DL-Met, L-Met, and DL-HMTBA-fed chickens.
There was no difference between the four treatment groups for average feed
intake from d10 to d26 (Table 3.2). Feed conversion ratios were measured on a pen basis
and are shown in Table 3.2. The feed conversion ratios of chickens fed DL-Met, L-Met
and DL-HMTBA were less than C for d10 to d26 (P < 0.001), but there was no difference
between DL-Met, L-Met and DL-HMTBA.
The average dry matter digestibility for chickens fed C, DL-Met, L-Met and DL-
HMTBA at d26 are also shown in Table 3.2. There was no significant difference between
these four treatment groups.
Because there were no differences between three Met supplementation groups for
body weight or feed conversion ratio, we examined potential treatment effects on relative
organ weights (organ weight/live weight) and carcass weights (Table 3.3). The relative
small intestinal weights were measured only at d21, d26 and d35. Relative breast muscle
weight (breast muscle weight/live weight) was improved for dietary Met supplemented

53
groups (DL-Met, L-Met and DL-HMTBA) compared to the control group at d10 (P <
0.001), d21 (P < 0.001), d26 (P < 0.001) and d35 (P < 0.001). There was no difference
between DL-Met, L-Met, and DL-HMTBA at any time point. Relative kidney weight
(kidney weight/live weight) was decreased for DL-HMTBA compared to C at d21 (P =
0.027) and decreased for DL-Met compared to C at d35 (P = 0.017). Relative liver weight
(liver weight/live weight) was decreased for L-Met and DL-HMTBA compared to C at
d21 (P = 0.014). Relative carcass weight (carcass weight/live weight) was lower for L-
Met than DL-Met and C at d26 (P = 0.008); but by d35 relative carcass weight for DL-
Met, L-Met, and DL-HMTBA were all lower than C (P = 0.009). At d35, relative
jejunum weight was lower in L-Met than C (P = 0.025) and relative ileum weight was
lower in DL-Met than C (P = 0.016). There was no difference due to treatment effect at
all the time points for relative duodenum weight, relative abdominal fat weight and
relative heart weight.
3.4.2 Blood profile
There was no significant treatment effect for RBC-PCV, eosinophil + heterophil,
lymphocyte, basophil and monocyte percentages and the (eosinophil +
heterophil)/lymphocyte ratio (Table 3.4). There was, however, an effect of age with the
percentage of eosinophil + heterophil and (eosinophil + heterophil)/lymphocyte ratio
greater at d26 compared to d21 and d35 (P = 0.008 and 0.014, respectively).
As another indicator of stress, plasma levels of acute phase proteins were
measured (Table 3.5). There was a significant treatment × age interaction for serum
amyloid A (SAA) level (P = 0.007). To further clarify, analysis was performed within
each time period (d21 and d26). SAA was lower in DL-Met and L-Met than in C at d21
54
(P = 0.014). There was no treatment main effect at d26. The level of alpha-1-acid
glycoprotein was significantly greater at d26 compared to d21 (P = 0.005), but there was
no effect due to treatment.
3.4.3 Global DNA methylation and DNA methyltransferase (DNMT) activity
No significant differences were seen among C, DL-Met, L-Met and DL-HMTBA
groups for both hepatic total DNA methylation and DNMT activity. However, hepatic
DNA methylation and DNMT activity changed with time, where DNMT activity
increased from d5 to d10 (Figure 3.1A, P < 0.001); whereas DNA methylation decreased
from d10 to d26 and d35 (Figure 3.1B, P = 0.001).
3.4.4 Nutrient transporter gene expression
Gene expression was analyzed using three statistical models as described in
Material and Methods. For Model 1, there was significant age × segment interaction
effects for all the genes (Table 3.6). There was a treatment main effect for 4F2hc
expression (P = 0.030). Although the control group had greater 4F2hc expression
tendency compared to DL-Met and L-Met supplemented groups, no statistically
significant differences were detected among the four treatment groups using Tukey’s
HSD test. There was a treatment × segment interaction for SAT2 expression (P = 0.040).
No statistically significant differences were seen among the treatments within each
segment. However, when the data were analyzed within duodenum, SAT2 expression in
DL-Met chickens was greater than DL-HMTBA using student t-test (P = 0.034). There
was a three-way treatment × age × segment interaction for ATB0,+ expression (P =
0.002).
55
For model 2, both DL-Met and L-Met groups had greater ATB0,+ mRNA
abundance compared to C in duodenum (Figure 3.2A, P = 0.039). All three Met
supplemented groups (DL-Met, L-Met and DL-HMTBA) had greater MCT1 expression
compared to the control group in jejunum (Figure 3.2B, P = 0.039). There were
significant treatment × age interactions for LAT1, ATB0,+, and B0AT expression (Table
3.7). In duodenum, L-Met chickens had greater LAT1 expression than C, DL-Met and
DL-HMTBA chickens at d3 and C chickens had greater LAT1 expression than L-Met
and DL-HMTBA chickens at d10. In jejunum, DL-Met, L-Met and DL-HMTBA
chickens had greater ATB0,+ expression than C chickens at d5, and DL-Met chickens had
greater B0AT expression than C, L-Met and DL-HMTBA chickens at d26. In ileum at d5,
DL-Met chickens had greater ATB0,+ expression compared to C and L-Met chickens and
DL-HMTBA chickens had greater ATB0,+ expression compared to C chickens. At d21,
DL-Met chickens had greater expression of ATB0,+ than C, L-Met and DL-HMTBA
chickens.
For Model 3, DL-Met chickens had greater ATB0,+ abundance than C at d5
(Figure 3.3A, P = 0.048). At d21, both DL-Met and L-Met chickens had greater NHE3
mRNA abundance than DL-HMTBA (Figure 3.3B, P = 0.021), while at d35, DL-
HMTBA chickens had greater SAT1 abundance than DL-Met and L-Met groups (Figure
3.3C, P = 0.039). There were significant treatment × segment interactions for 4F2hc,
b0,+AT, ATB0,+, B0AT, LAT1 and SAT2 expression (Table 3.8). At d3, DL-HMTBA
chickens had greater 4F2hc mRNA abundance than C, DL-Met and L-Met chickens and
greater b0,+AT mRNA abundance than DL-Met and L-Met chickens in ileum at d3. In
addition, C chickens had greater b0,+AT expression than L-Met chickens in ileum. At d21,

56
DL-Met chickens had greater ATB0,+ mRNA abundance than C, L-Met and DL-HMTBA
chickens in ileum. At d26, DL-Met chickens had greater B0AT mRNA abundance than C,
L-Met and DL-HMTBA chickens in jejunum and C chickens had greater LAT1 mRNA
abundance than DL-Met, L-Met and DL-HMTBA chickens in ileum. At d35, DL-Met
chickens had greater ATB0,+ mRNA abundance than C chickens in duodenum while L-
Met chickens had greater ATB0,+ mRNA abundance than DL-Met and DL-HMTBA
chickens in ileum. DL-Met chickens had greater SAT2 expression than C and DL-
HMTBA chickens in duodenum at d35.
3.5 Discussion
Methionine is the first limiting amino acid in a broiler corn-soybean meal based
diet. These diets are commonly supplemented with Met sources such as DL-Met or DL-
HMTBA to meet the recommended amounts for the particular growth phase. This study
examined the differential effects of Met supplements DL-Met, L-Met and DL-HMTBA
on global DNA methylation, levels of stress indicators (acute phase proteins, white blood
cell differential) and expression of selective intestinal amino acid transporters.
The growth performance data showed that Met supplementation improved body
weight gain, feed efficiency and relative breast muscle weight. The three diets with Met
source supplementation were designed to meet the requirements of broiler chickens, so
these groups should not be limiting in methionine according to the analytic values in
diets. In our trial, the diets were formulated based on a relative bio-efficacy of 65% for
DL-HMTBA compared to DL-Met, which was reported by Lemme et al. (2002). Our
results showed no difference between the three supplementary Met sources, which are
consistent with those bio-efficacy values.

57
Little is known about DNA methylation in birds. L-Met can be directly converted
into S-adenosylmethionine (SAM), the major methyl donor in cells. Methyl group donor
deficiency has been shown to up-regulate DNA methyltransferase (DNMT) but does not
increase genomic DNA hypomethylation in rat liver (Kim, 2004). Thus, we hypothesized
that Met supplementation would increase total DNA methylation in the liver. Our results
showed that Met supplementation had no significant effects on hepatic DNA
methyltransferase (DNMT) activity or global DNA methylation. DNA methylation
regulation is a complex network, which may not be affected by either dietary Met+Cys
level or Met source. However, we observed that hepatic global DNA methylation
decreased from d10 to d26 and d35, while DNMT activity increased from d5 to d10 and
then remained constant. This was partially in accordance with the observation of
Gryzinska et al. (2013) who reported a decrease in global DNA methylation with age in
the blood of 32-week-old compared to 1-day-old hens.
A Met-deficient diet could cause physiological stress, which could be manifested
as a change in white blood cell numbers or increase in acute phase proteins. For white
blood cell differentiation count, the heterophil/lymphocyte ratio is often used as an
indicator of disease or stress (Gross and Siegel, 1983). In chickens eosinophils represent
only 1% of the white blood cells (Scanes and Sturkie, 2015) and are difficult to discern
from heterophils, therefore only the eosinophil + heterophil percentage and the
(eosinophil + heterophil)/lymphocyte ratio have been reported. However, no significant
differences among the treatment groups were observed, indicating that there were no
difference in stress, as measured by white blood cells, between control and Met
supplemented groups.

58
Determination of acute phase protein levels can help in monitoring the health of
animals (Murata, 2007). Serum amyloid A (SAA) is a positive acute phase reactant
expressed primarily in the liver that circulates in blood. In chickens, SAA gene
expression may increase more than 100-fold following infection (Matulova et al., 2013).
Alpha -1-acid glycoprotein (α-1-AGP) is also an acute phase protein that is elevated in
chicken serum due to injury, infection or disease. The amount of α-1-AGP may increase
5-fold or more in chickens during an acute phase response (Holt and Gast, 2002). In our
trial, SAA was decreased in DL-Met and L-Met fed birds compared to the control at d21.
These results indicate that our control diet, which was Met-deficient, may have induced
stress in the chickens as revealed by high SAA concentrations, which can be alleviated by
L-Met and DL-Met supplementation. SAA concentration in DL-HMTBA fed birds was
intermediate between control and L-Met and DL-Met. Shakeri et al. (2014) reported that
stress induced by high stocking density of broilers led to an increase in the acute phase
protein α-1-AGP, however, we did not see a difference in α-1-AGP concentrations.
Supplementation of the diets with L-Met, DL-Met or DL-HMTBA altered the
expression of some intestinal nutrient transporter genes. Many of these changes were
revealed as treatment × age and treatment × intestinal segment interactions. The two Met
transporters that were most responsive to Met supplementation were ATB0,+ (SLC6A14)
and B0AT (SLC6A19). For example, DL-Met supplementation resulted in increased
expression of B0AT in the jejunum and duodenum and increased ATB0,+ at d5; whereas
L-Met supplementation increased ATB0,+ in the duodenum. Both ATB0,+ and B0AT are
brush border membrane transporters of neutral/cationic and neutral amino acids,
respectively. Upregulation of ATB0,+ and B0AT by DL-Met would lead to enhanced
59
uptake of not only Met but also other neutral and cationic amino acids. The transport
kinetics of D-Met and L-Met are comparable using human Caco-2 cells and a perfused rat
intestinal model (Zheng et al., 1994). Maenz and Engele-Schaan (1996) reported that L-
and D-Met are transported by the broad specificity system B type transporter in chicken
brush border membrane vesicles. Martin-Venegas et al. (2009) further showed that
systems L and B0,+ are responsible for L-Met transport while only system B0,+ is
responsible for D-Met transport in human Caco-2 cells. In addition, ATB0,+ can transport
L-enantiomers of neutral and cationic amino acids as well as D-enantiomers such as D-
Ser, D-Ala, D-Met, D-Leu and D-Trp (Hatanaka et al., 2002). These results are in
accordance with our findings that DL-Met and L-Met supplementation altered expression
of ATB0,+ and B0AT. Ferraris and Diamond (1989) have proposed a biphasic model for
the uptake of essential amino acids such as Met. Below maintenance levels of dietary
nitrogen (0-18%), the uptake of Met decreased or remained constant with increasing
dietary nitrogen; whereas above maintenance levels (>18%), uptake of Met increased
with increasing dietary nitrogen. Although the dietary protein levels decrease in the
starter, grower and finisher diets, the protein requirement levels also decrease. However,
this may partially explain the temporal changes in transporter expression. Thus the
regulation of expression of transporters for a substrate such as Met are expected to be
complex and may depend on the balance and availability of other amino acids in the diet.
In contrast to L-Met and DL-Met, DL-HMTBA as a Met precursor had minor
effects on the regulation on ATB0,+ and B0AT. Only the brush border membrane
transporter b0,+AT (SLC7A9) was expressed greater in the ileum at d3 by HMTBA
supplementation but not by DL-Met and L-Met supplementation. In fact, b0,+AT was

60
downregulated in the ileum of L-Met chickens compared to control chickens. In contrast,
in growing pigs, the addition of Lys, Thr and Met to a wheat diet deficient in these three
amino acids caused an upregulation of b0,+AT in the jejunum (Garcia-Villalobos et al.,
2012).
We hypothesized that changes in the expression of Met transporters may have a
pleiotropic effect on the expression of the peptide transporter PepT1. Shiraga et al. (1999)
showed that various amino acids, such as Arg, Phe, and Lys, increased promoter activity
of rat PepT1, although Met was not one of the amino acids tested in this study. Our
results showed that PepT1 was not changed by the different Met supplementation, even
though expression of Met transporters was changed.
The transport system for DL-HMTBA is the monocarboxylate transporter MCT1
(SLC16A1), which is coupled to the Na+/H+ exchanger NHE3 (SLC9A3) to maintain the
proton gradient at the brush border membrane of the enterocyte (Martin-Venegas et al.,
2007). Martin-Venegas et al. (2014) further showed that MCT1 is upregulated in Caco-2
cells by DL-HMTBA. In our study, MCT1 expression was upregulated in the jejunum of
DL-Met, L-Met and DL-HMTBA chickens compared to control chickens. This was a
surprising result because we expected an increase in MCT1 in the presence of DL-
HMTBA and not DL-Met and L-Met. The mechanism by which L-Met and DL-Met are
regulating MCT1 remains to be elucidated. NHE3 expression did not show a
corresponding main effect of DL-Met, L-Met, and DL-HMTBA compared to the control
like MCT1 gene expression. This is not surprising because the activity of many
transporters are coupled to the proton gradient (Thwaites and Anderson, 2007).

61
The amino acid transporters SAT1, SAT2, and SAT3 are members of the
SLC38A family and are responsible for System A and System B transport of small
neutral amino acids such as Gln, Met and Ala (Schioth et al., 2013). There was increased
expression of SAT1 in DL-HMTBA chickens compared to DL-Met and L-Met chickens,
but not compared to control chickens. SAT2 expression was greater in the duodenum of
DL-Met chickens compared to control and DL-HMTBA chickens at d35. SAT2 is a
basolateral membrane transporter that also plays a role as an amino acid sensor,
mediating its transceptor signaling through the mTOR pathway (Pinilla et al., 2011). An
increase in SAT2 would lead to downstream signaling through mTORC1 resulting in
increased protein synthesis (Taylor, 2014).
In summary, supplementation of feed with L-Met, DL-Met or DL-HMTBA
improved growth rate, feed efficiency, and breast muscle yield equally compared to a
control diet that was deficient in Met. There were no differences in white blood cell
differentiation count, DNA methylation or DNA methyltransferase activity between
control and Met supplemented diets. One acute phase protein (serum amyloid A) was
increased in control compared to DL-Met and L-Met but not by DL-HMTBA at d26. Met
supplementation did not affect expression of basolateral transporters but did result in
enhanced expression of brush border membrane transporters, for example, the ATB0,+
transporter in the duodenum and MCT1 in the jejunum. Moreover, DL-HMTBA does not
affect the expression of transporters in a similar manner as DL-Met and L-Met. These
results suggest that DL-Met, L-Met and DL-HMTBA improve growth performance but
do not have the same influence on biochemical pathways. This study can help to further

62
understand different dietary Met sources in the animal nutrition industry, which then can
be better utilized to promote animal growth and development.

63
LITERATURE CITED
Boguhn, J., T. Baumgartel, A. Dieckmann, and M. Rodehutscord. 2009. Determination of
titanium dioxide supplements in different matrices using two methods involving
photometer and inductively coupled plasma optical emission spectrometer
measurements. Arch Anim Nutr 63: 337-342.
Breiling, A., and F. Lyko. 2015. Epigenetic regulatory functions of DNA modifications:
5-methylcytosine and beyond. Epigenetics Chromatin 8: 24.
Broer, S. 2008. Amino acid transport across mammalian intestinal and renal epithelia.
Physiol Rev 88: 249-286.
Broer, S. 2014. The SLC38 family of sodium-amino acid co-transporters. Pflugers Arch
466: 155-172.
Dibner, J. J., and C. D. Knight. 1984. Conversion of 2-hydroxy-4-(methylthio)butanoic
acid to L-methionine in the chick: a stereospecific pathway. J Nutr 114: 1716-1723.
Eckersall, P. D., and R. Bell. 2010. Acute phase proteins: Biomarkers of infection and
inflammation in veterinary medicine. Vet J 185: 23-27.
Elwert, C., E. D. Fernandes, and A. Lemme. 2008. Biological effectiveness of methionine
hydroxy-analogue calcium salt in relation to DL-methionine in broiler chickens.
Asian-Australasian Journal of Animal Sciences 21: 1506-1515.
Ferraris, R. P., and J. M. Diamond. 1989. Specific regulation of intestinal nutrient
transporters by their dietary substrates. Annu Rev Physiol 51: 125-141.
Fotiadis, D., Y. Kanai, and M. Palacin. 2013. The SLC3 and SLC7 families of amino acid
transporters. Mol Aspects Med 34: 139-158.
Garcia-Villalobos, H., A. Morales-Trejo, B. A. Araiza-Pina, J. K. Htoo, and M.
Cervantes-Ramirez. 2012. Effects of dietary protein and amino acid levels on the
expression of selected cationic amino acid transporters and serum amino acid
concentration in growing pigs. Arch Anim Nutr 66: 257-270.
Gilbert, E. R., H. Li, D. A. Emmerson, K. E. Webb, Jr., and E. A. Wong. 2007.
Developmental regulation of nutrient transporter and enzyme mRNA abundance in
the small intestine of broilers. Poult Sci 86: 1739-1753.
Gilbert, E. R., and D. Liu. 2012. Epigenetics: the missing link to understanding beta-cell
dysfunction in the pathogenesis of type 2 diabetes. Epigenetics 7: 841-852.

64
Gilbert, E. R., E. A. Wong, and K. E. Webb, Jr. 2008. Board-invited review: Peptide
absorption and utilization: Implications for animal nutrition and health. J Anim Sci
86: 2135-2155.
Gross, W. B., and H. S. Siegel. 1983. Evaluation of the heterophil/lymphocyte ratio as a
measure of stress in chickens. Avian Dis 27: 972-979.
Gruys, E., M. J. Toussaint, T. A. Niewold, and S. J. Koopmans. 2005. Acute phase
reaction and acute phase proteins. J Zhejiang Univ Sci B 6: 1045-1056.
Gryzinska, M., E. Blaszczak, A. Strachecka, and G. Jezewska-Witkowska. 2013.
Analysis of age-related global DNA methylation in chicken. Biochem Genet 51:
554-563.
Hatanaka, T. et al. 2002. Transport of D-serine via the amino acid transporter ATB(0,+)
expressed in the colon. Biochem Biophys Res Commun 291: 291-295.
Hediger, M. A., B. Clemencon, R. E. Burrier, and E. A. Bruford. 2013. The ABCs of
membrane transporters in health and disease (SLC series): introduction. Mol Aspects
Med 34: 95-107.
Hellemans, J., G. Mortier, A. De Paepe, F. Speleman, and J. Vandesompele. 2007. qBase
relative quantification framework and software for management and automated
analysis of real-time quantitative PCR data. Genome Biol 8: R19.
Hoehler, D., A. Lemme, S. K. Jensen, and S. L. Vieira. 2005. Relative effectiveness of
methionine sources in diets for broiler chickens. Journal of Applied Poultry Research
14: 679-693.
Holt, P. S., and R. K. Gast. 2002. Comparison of the effects of infection with Salmonella
enteritidis, in combination with an induced molt, on serum levels of the acute phase
protein, alpha1 acid glycoprotein, in hens. Poult Sci 81: 1295-1300.
Hyde, R., P. M. Taylor, and H. S. Hundal. 2003. Amino acid transporters: roles in amino
acid sensing and signalling in animal cells. Biochem J 373: 1-18.
Kim, Y. I. 2004. Folate and DNA methylation: a mechanistic link between folate
deficiency and colorectal cancer? Cancer Epidemiol Biomarkers Prev 13: 511-519.
Lemme, A., D. Hoehler, J. J. Brennan, and P. F. Mannion. 2002. Relative effectiveness of
methionine hydroxy analog compared to DL-methionine in broiler chickens. Poult
Sci 81: 838-845.

65
Maenz, D. D., and C. M. Engele-Schaan. 1996. Methionine and 2-hydroxy-4-
methylthiobutanoic acid are transported by distinct Na(+)-dependent and H(+)-
dependent systems in the brush border membrane of the chick intestinal epithelium. J
Nutr 126: 529-536.
Martin-Venegas, R. et al. 2014. Monocarboxylate transporter 1 is up-regulated in Caco-2
cells by the methionine precursor DL-2-hydroxy-(4-methylthio)butanoic acid. Vet J
202: 555-560.
Martin-Venegas, R., P. A. Geraert, and R. Ferrer. 2008. Partial Na+ dependence of DL-2-
hydroxy-4-(methylthio)butanoic acid uptake in the chicken small intestine. Poult Sci
87: 1392-1394.
Martin-Venegas, R., M. J. Rodriguez-Lagunas, P. A. Geraert, and R. Ferrer. 2007.
Monocarboxylate transporter 1 mediates DL-2-Hydroxy-(4-methylthio)butanoic acid
transport across the apical membrane of Caco-2 cell monolayers. J Nutr 137: 49-54.
Martin-Venegas, R., M. J. Rodriguez-Lagunas, Y. Mercier, P. A. Geraert, and R. Ferrer.
2009. Effect of pH on L- and D-methionine uptake across the apical membrane of
Caco-2 cells. Am J Physiol Cell Physiol 296: C632-638.
Matulova, M. et al. 2013. Chicken innate immune response to oral infection with
Salmonella enterica serovar Enteritidis. Vet Res 44: 37.
Murata, H. 2007. Stress and acute phase protein response: an inconspicuous but essential
linkage. Vet J 173: 473-474.
Pinilla, J. et al. 2011. SNAT2 transceptor signalling via mTOR: a role in cell growth and
proliferation? Front Biosci (Elite Ed) 3: 1289-1299.
Pramod, A. B., J. Foster, L. Carvelli, and L. K. Henry. 2013. SLC6 transporters:
structure, function, regulation, disease association and therapeutics. Mol Aspects
Med 34: 197-219.
Sauer, N. et al. 2008. Meta-analysis of the relative efficiency of methionine-hydroxy-
analogue-free-acid compared with DL-methionine in broilers using nonlinear mixed
models. Poult Sci 87: 2023-2031.
Scanes, C. G., and P. D. Sturkie. 2015. Sturkie's avian physiology. Sixth Edition. ed.
Elsevier/Academic Press, London.
66
Schioth, H. B., S. Roshanbin, M. G. Hagglund, and R. Fredriksson. 2013. Evolutionary
origin of amino acid transporter families SLC32, SLC36 and SLC38 and
physiological, pathological and therapeutic aspects. Mol Aspects Med 34: 571-585.
Shakeri, M. et al. 2014. Response to dietary supplementation of L-glutamine and L-
glutamate in broiler chickens reared at different stocking densities under hot, humid
tropical conditions. Poult Sci 93: 2700-2708.
Shiraga, T. et al. 1999. Cellular and molecular mechanisms of dietary regulation on rat
intestinal H+/Peptide transporter PepT1. Gastroenterology 116: 354-362.
Smith, D. E., B. Clemencon, and M. A. Hediger. 2013. Proton-coupled oligopeptide
transporter family SLC15: physiological, pharmacological and pathological
implications. Mol Aspects Med 34: 323-336.
Soriano-Garcia, J. F., M. Torras-Llort, R. Ferrer, and M. Moreto. 1998. Multiple
pathways for L-methionine transport in brush-border membrane vesicles from
chicken jejunum. J Physiol 509 ( Pt 2): 527-539.
Taylor, P. M. 2014. Role of amino acid transporters in amino acid sensing. Am J Clin
Nutr 99: 223S-230S.
Thwaites, D. T., and C. M. Anderson. 2007. H+-coupled nutrient, micronutrient and drug
transporters in the mammalian small intestine. Exp Physiol 92: 603-619.
Vandesompele, J. et al. 2002. Accurate normalization of real-time quantitative RT-PCR
data by geometric averaging of multiple internal control genes. Genome Biol 3:
RESEARCH0034.
Zheng, L. et al. 1994. Comparison of the transport characteristics of D- and L-methionine
in a human intestinal epithelial model (Caco-2) and in a perfused rat intestinal
model. Pharm Res 11: 1771-1776.

67
Table 3.1 Primers used for quantitative real-time PCR.
SLC1
name Gene GenBank ID Description/gene function
Primer Sequence (5' → 3'),
sense/antisense4
bp2
Mean Cq
value3
Effici
ency
SLC3A1 rBAT XM_426125.4
Heavy chain corresponding to the
bo,+ transport system, dimerizes
with bo,+AT
CCCGCCGTTCAACAAGAG/
AATTAAATCCATCGACTCCTTTGC 70 22.5 100.6
SLC3A2 4F2hc XM_426125.4
4F2 cell-surface antigen heavy
chain, dimerizes with LAT1,
y+LAT1 and y+LAT2
GGTTTCAGCTCAGTCGCAATC/
CGCAGTCCTGCCAGATGTAGT 63 23.0 103.6
SLC6A14 ATB0,+ XM_004940661.1
Na+- and Cl--dependent neutral
and cationic amino acid
transporter
TGGCAACATCGTGTGGTACCT/
AGGCAGCTCCAACGATCATC 65 27.0 108.7
SLC6A19 B0AT XM_419056.4 Na+-dependent neutral amino acid
transporter
GGGTTTTGTGTTGGCTTAGGAA/
TCCATGGCTCTGGCAGAGAT 60 21.1 93.0
SLC7A5 LAT1 NM_001030579.1
Na+-independent large neutral
amino acid transporter, dimerizes
with 4F2hc
GATTGCAACGGGTGATGTGA/
CCCCACACCCACTTTTGTTT 70 26.4 96.8
SLC7A6 y+LAT2 XM_001231336.3
Na+-independent cationic & Na+-
dependent neutral amino acid
transporter, dimerizes with 4F2hc
GCCCTGTCAGTAAATCAGACAAGA
/
TTCAGTTGCATTGTGTTTTGGTT
82 23.2 98.6
SLC7A7 y+LAT1 XM_418326.4
Na+-independent cationic & Na+-
dependent neutral amino acid
transporter, dimerizes with 4F2hc
CAGAAAACCTCAGAGCTCCCTTT/
TGAGTACAGAGCCAGCGCAAT 71 28.3 111.3
SLC7A9 b0,+AT NM_001199133.1
Na+-independent cationic and
neutral amino acid transporter,
dimerizes with rBAT
CAGTAGTGAATTCTCTGAGTGTGA
AGCT/
GCAATGATTGCCACAACTACCA
88 22.3 103.6
SLC9A3 NHE3 XM_004935075.1 Na+-H+ exchanger AGGCTGGACCGGTTTGC/
TCCCGAATACTTTTCCTCCTTTG 61 22.6 94.5

68
SLC15A1 PepT1 NM_204365.1 H+-dependent transporter of di-
and tripeptides
CCCCTGAGGAGGATCACTGTT/
CAAAAGAGCAGCAGCAACGA 66 20.8 96.0
SLC16A1 MCT1 NM_001006323.1 Monocarboxylic acid transporter AGCAGCATCCTGGTGAACAAG/
AGGCACCCACCCACGAT 59 25.7 95.8
SLC38A1 SAT1 NM_001199603.1 Na+-dependent neutral amino acid
transporter
CACAGTGCCAGTGCTGTTTTTC/
TGTTTTTCTTGCCAGCTCGAA 61 29.3 96.5
SLC38A2 SAT2 NM_001030741.1 Na+-dependent neutral amino acid
transporter
TGCAACGCTGGCACCTT/
GGTTTGCATGCATCACTGATTG 57 23.5 97.6
SLC38A3 SAT3 NM_001199549.1 Na+-dependent neutral amino acid
transporter
TCTTCATCCTTCCCTCTGCATT/
GAGACCTCATGGGCTCCTTCT 60 27.0 93.3
β-actin NM_205518.1 Beta-actin GTCCACCGCAAATGCTTCTAA/
TGCGCATTTATGGGTTTTGTT 78 17.7 113.8
H6PD XM_425746.4
Hexose-6-phosphate
dehydrogenase (glucose 1-
dehydrogenase)
GACAGAGCCCCTTGGTCTCA/
TCAGAAGCCAGCTGGGAAAT 58 24.3 105.9
LDHA NM_205284.1 Lactate dehydrogenase A CACAAAGAGGAGCACGCTCAT/
CTGCACCCACACCAACCA 58 20.6 110.9
PRL4 NM_001007479.1 Ribosomal protein L4 TCAAGGCGCCCATTCG/
TGCGCAGGTTGGTGTGAA 54 23.1 112.0
PRLP0 NM_204987.1 Ribosomal protein, large, P0 GCGATTGCTCCCTGTGATG/
TCTCAGGTCCGAGACCAGTGT 58 20.5 111.9
PRLP1 NM_205322.1 Ribosomal protein, large, P1 TCTCCACGACGACGAAGTCA/
CCGCCGCCTTGATGAG 62 20.9 97.3
1 SLC: solute carrier family. 2 Amplicon size. 3 Cq = quantification cycle. 4 Primers for rBAT, B0AT, LAT1, y+LAT2, y+LAT1, b0,+AT, PepT1 and β-actin were those used in Gilbert et al. (2007). The other primers were designed by
Primer Express 3.0 software (Applied Biosystems, Grand Island, NY).

69
Table 3.2 Mean body weight, feed conversion ratio, feed intake, average dry matter digestibility and mortality of male broiler
chickens fed a diet with or without methionine supplementation until post hatch day 35.
Treatment1
Mean body weight (g) Feed
conversion
ratio2 (d10 to
d26)
Feed intake2
(kg/bird, d10
to d26)
Average dry
matter
digestibility3
(d26)
Mortality
(d0 to d26) d10
(n=50~55)
d15
(n=43~50)
d21
(n=42~50)
d26
(n=36~44)
d35
(n=29~30)
C 266.0±5.3b 514.4±9.9b 928.0±16.6b 1235.0±27.2b 1771.2±53.0b 1.90±0.06a 1.64±0.04 0.27 1.75%
DL-Met 311.2±4.3a 618.4±8.3a 1131.0±16.5a 1544.9±26.1a 2303.8±62.3a 1.44±0.01b 1.70±0.02 0.26 3.08%
L-Met 308.2±3.6a 612.2±10.6a 1112.6±25.3a 1608.3±22.8a 2390.2±54.5a 1.43±0.02b 1.70±0.04 0.27 1.69%
DL-HMTBA 304.6±4.2a 605.1±8.4a 1113.0±14.4a 1547.8±22.8a 2300.1±66.3a 1.43±0.01b 1.66±0.04 0.38 4.92%
1 C: 0.78% Met+Cys for starter diet, 0.70% Met+Cys for grower diet and 0.62% Met+Cys for finisher diet; DL-Met: diet supplemented with 0.22% DL-
methionine; L-Met: diet supplemented with 0.22% L-methionine; DL-HMTBA: diet supplemented with 0.31% DL-2-hydroxy-4-methylthio butanoic acid.
2 Feed conversion ratio = feed intake (g) / body weight gain (g). Feed intake was only reported from d10 to d26 because both males and females were present in
the pens from d0 to d3 and thus feed intake for just males could not be determined for d0 to d10.
3 Dry matter digestibility = TiO2 in diet / TiO2 in dry digesta.
Data are shown as least squares means ± standard errors of the means. Means in a column without a common letter differ, P < 0.05.

70
Table 3.3 Relative breast muscle, kidney, liver, carcass, empty small intestine, abdominal fat and heart weight of male broiler
chickens fed a diet with or without methionine supplementation at post-hatch days 10, 21, 26 and 35.
Treatment Relative breast muscle weight1 (%) Relative kidney weight2 (%) Relative liver weight3 (%)
d10 d21 d26 d35 d10 d21 d26 d35 d10 d21 d26 d35
C 11.1±0.36b 15.4±0.41b 18.2±0.32b 18.1±0.28b 0.87±0.07 0.51±0.05a 0.66±0.04 0.56±0.03a 4.11±0.35 2.77±0.17a 2.39±0.11 2.31±0.14
DL-Met 14.6±0.30a 20.0±0.43a 22.7±0.46a 25.4±1.07a 0.75±0.07 0.43±0.05ab 0.58±0.06 0.45±0.03b 3.76±0.04 2.23±0.11ab 2.25±0.07 2.04±0.12
L-Met 13.1±0.66a 20.3±0.35a 22.5±0.81a 24.3±1.31a 0.71±0.06 0.38±0.04ab 0.55±0.08 0.47±0.02ab 3.65±0.20 2.15±0.16b 2.42±0.14 1.94±0.09
DL-HMTBA 13.5±0.37a 19.6±0.49a 22.8±0.57a 22.8±1.18a 0.69±0.08 0.31±0.03b 0.53±0.07 0.52±0.02ab 3.63±0.16 2.16±0.10b 2.22±0.12 2.26±0.16
Treatment Relative carcass weight4 (%) Relative jejunum weight5 (%) Relative ileum weight6 (%)
d10 d21 d26 d35 d217 d26 d35 d21 d26 d35
C 56.8 ± 2.91 60.1 ± 0.38 60.8 ± 0.98a 61.3 ± 0.34a 1.60 ± 0.16 1.31 ± 0.10 1.38 ± 0.06a 1.25 ± 0.02 1.16 ± 0.05 1.09 ± 0.05a
DL-Met 55.0 ± 0.54 60.0 ± 0.65 59.8 ± 0.88a 56.0 ± 1.51b 1.29 ± 0.06 1.18 ± 0.02 1.16 ± 0.06ab 1.12 ± 0.06 1.02 ± 0.05 0.88 ± 0.05b
L-Met 54.1 ± 0.95 59.6 ± 0.33 56.6 ± 0.72b 57.2 ± 1.16b 1.27 ± 0.06 1.18 ± 0.08 1.13 ± 0.05b 1.08 ± 0.04 1.03 ± 0.04 0.92 ± 0.03ab
DL-HMTBA 54.6 ± 0.40 58.4 ± 2.01 58.6 ± 0.51ab 56.9 ± 0.83b 1.30 ± 0.06 1.17 ± 0.06 1.18 ± 0.05ab 1.12 ± 0.06 1.05 ± 0.04 0.95 ± 0.04ab

71
Treatment Relative abdominal fat weight8 (%) Relative heart weight9 (%) Relative duodenum weight10 (%)
d10 d21 d26 d35 d10 d21 d26 d35 d21 d26 d35
C 0.65 ± 0.13 1.43 ± 0.10 1.45 ± 0.12 1.60 ± 0.18 0.82 ± 0.03 0.77 ± 0.04 0.85 ± 0.09 0.66 ± 0.03 0.72 ± 0.06 0.78 ± 0.07 1.09 ± 0.04
DL-Met 0.91 ± 0.09 1.32 ± 0.12 1.51 ± 0.09 1.29 ± 0.10 0.86 ± 0.04 0.65 ± 0.02 0.66 ± 0.03 0.60 ± 0.05 0.62 ± 0.04 0.68 ± 0.03 0.64 ± 0.05
L-Met 0.97 ± 0.16 1.23 ± 0.08 1.41 ± 0.13 1.29 ± 0.17 0.76 ± 0.04 0.74 ± 0.07 0.85 ± 0.11 0.57 ± 0.03 0.64 ± 0.04 0.72 ± 0.04 0.61 ± 0.02
DL-HMTBA 0.79 ± 0.03 1.19 ± 0.10 1.48 ± 0.18 1.44 ± 0.11 0.89 ± 0.03 0.74 ± 0.05 0.71 ± 0.07 0.56 ± 0.06 0.74 ± 0.02 0.68 ± 0.04 0.62 ± 0.02
1 C: 0.78% Met+Cys for starter diet, 0.70% Met+Cys for grower diet and 0.62% Met+Cys for finisher diet; DL-Met: basal diet supplemented with 0.22% DL-
methionine; L-Met: basal diet supplemented with 0.22% L-methionine; DL-HMTBA: basal diet supplemented with 0.31% DL-2-hydroxy-4-methylthio butanoic
acid.
2 Relative breast muscle weight: breast muscle weight/live weight; 3 Relative kidney weight: kidney weight/live weight; 4 Relative liver weight: liver weight/live
weight; 5 Relative carcass weight: carcass weight/live weight, carcass weight equals to body weight minus the head and internal organs. 5 Relative jejunum
weight: empty jejunum weight/live weight; 6 Relative ileum weight: empty ileum weight/live weight. 7 The relative jejunum/ileum/duodenum weight data are
reported only for d21, d26 and d35; 8 Relative abdominal fat weight: abdominal fat weight/live weight; 9 Relative heart weight: heart weight/live weight; 10
Relative duodenum weight: empty duodenum weight/live weight.
Data are shown as least squares means ± standard errors of the means. Means in a column without a common letter differ, P < 0.05. n=6.

72
Table 3.4 Red blood cell packed cell volume (RBC-PCV) and white blood cell differential count of male broiler chickens fed a diet
with or without methionine supplementation at post-hatch days 21, 26 and 35.
Day Treatment1 RBC-PCV (%) Eosinophil +
Heterophil (%) Lymphocyte (%) Basophil (%) Monocyte (%)
(Eosinophil + Heterophil) /
Lymphocyte
21
C 29.7 40.7 49.8 4.3 5.2 0.83
DL-Met 27.1 42.2 41.8 6.8 9.2 0.91
L-Met 31.0 37.8 48.3 7.3 6.5 0.82
DL-HMTBA 31.1 41.6 49.6 4.8 4.2 0.87
SEM 1.62 2.7 3.0 1.2 1.6 0.08
P-value 0.31 0.67 0.22 0.25 0.19 0.89
26
C 30.6 46.1 44.8 7.3 1.8 1.07
DL-Met 30.4 44.7 44.5 6.7 4.2 1.12
L-Met 28.7 41.7 48.2 5.5 4.7 0.90
DL-HMTBA 29.6 54.7 36.7 5.0 3.7 1.37
SEM 1.20 4.2 3.7 1.1 1.1 0.16
P-value 0.67 0.18 0.20 0.45 0.29 0.28
35
C 31.4 37.6 53.4 3.6 6.0 0.62
DL-Met 29.0 41.4 51.4 2.8 5.5 0.84
L-Met 31.2 41.8 49.7 4.2 4.3 0.86
DL-HMTBA 32.6 39.0 50.7 4.5 5.8 0.80
SEM 1.19 2.8 3.1 0.7 1.4 0.11
P-value 0.21 0.68 0.86 0.41 0.82 0.44
1 C: 0.78% Met+Cys for starter diet, 0.70% Met+Cys for grower diet and 0.62% Met+Cys for finisher diet; DL-Met: basal diet supplemented with 0.22% DL-
methionine; L-Met: basal diet supplemented with 0.22% L-methionine; DL-HMTBA: basal diet supplemented with 0.31% DL-2-hydroxy-4-methylthio butanoic
acid.
Data are shown as least squares means ± standard errors of the means. Means in a column without a common letter differ, P < 0.05. n=6.
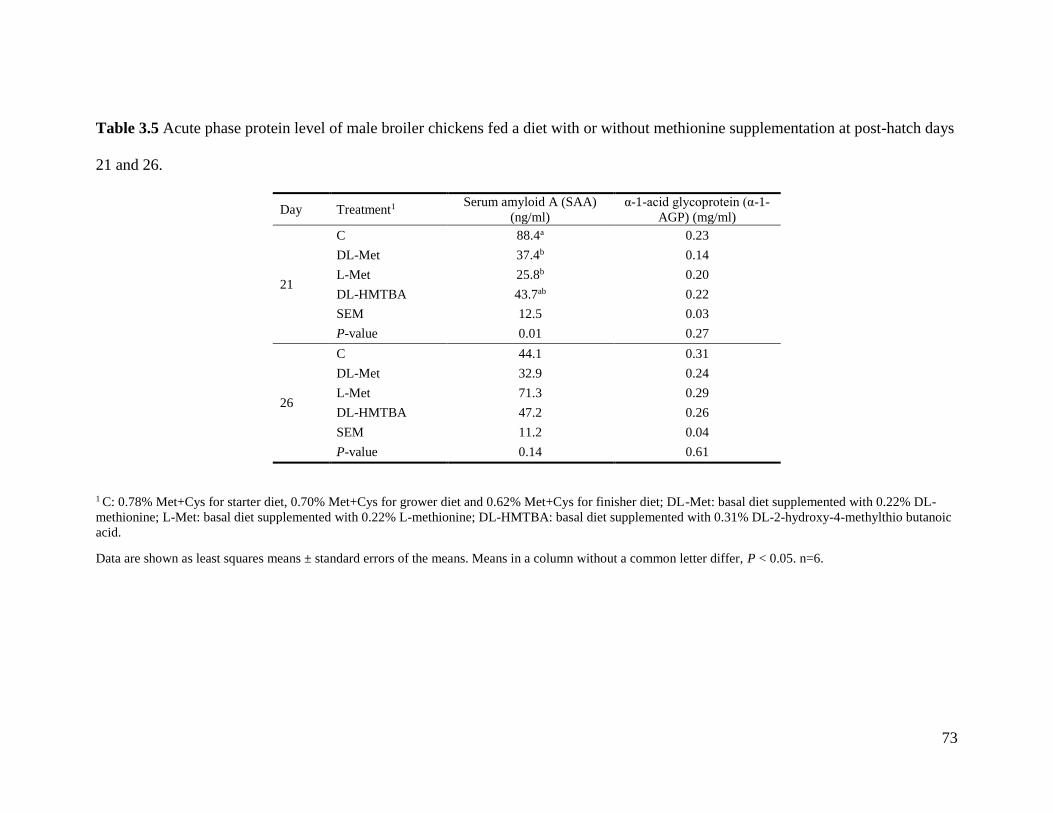
73
Table 3.5 Acute phase protein level of male broiler chickens fed a diet with or without methionine supplementation at post-hatch days
21 and 26.
Day Treatment1 Serum amyloid A (SAA)
(ng/ml)
α-1-acid glycoprotein (α-1-
AGP) (mg/ml)
21
C 88.4a 0.23
DL-Met 37.4b 0.14
L-Met 25.8b 0.20
DL-HMTBA 43.7ab 0.22
SEM 12.5 0.03
P-value 0.01 0.27
26
C 44.1 0.31
DL-Met 32.9 0.24
L-Met 71.3 0.29
DL-HMTBA 47.2 0.26
SEM 11.2 0.04
P-value 0.14 0.61
1 C: 0.78% Met+Cys for starter diet, 0.70% Met+Cys for grower diet and 0.62% Met+Cys for finisher diet; DL-Met: basal diet supplemented with 0.22% DL-
methionine; L-Met: basal diet supplemented with 0.22% L-methionine; DL-HMTBA: basal diet supplemented with 0.31% DL-2-hydroxy-4-methylthio butanoic
acid.
Data are shown as least squares means ± standard errors of the means. Means in a column without a common letter differ, P < 0.05. n=6.

74
Table 3.6 Relative small intestinal nutrient transporter gene expression using the whole statistical model1. Male broiler chickens were
fed a diet with or without methionine supplementation until post-hatch day 35.
Item Relative Gene Expression3
SAT1 SAT2 SAT3 ATB0,+
B0
AT b0,+
AT rBAT PepT1 LAT1 y+
LAT1 y+
LAT2 4F2hc MCT1 NHE3
Treatment
(n=5)
C 1.49 1.17 1.28 1.21 1.36 1.40 1.30 1.43 1.22 1.21 1.12 1.35 1.10 1.16
DL-Met 1.25 1.17 1.24 2.07 1.44 1.26 1.15 1.38 1.14 1.14 1.18 1.11 1.17 1.34
L-Met 1.46 1.23 1.33 1.73 1.25 1.28 1.15 1.23 1.26 1.27 1.11 1.11 1.22 1.21
DL-
HMTBA 1.35 1.17 1.27 1.59 1.29 1.37 1.19 1.29 1.19 1.12 1.13 1.27 1.23 1.33
SEM 0.08 0.07 0.06 0.17 0.10 0.11 0.07 0.11 0.06 0.09 0.07 0.07 0.06 0.09
P-value 0.16 0.93 0.78 0.01 0.58 0.75 0.47 0.54 0.64 0.65 0.86 0.03 0.32 0.40
Segment
(n=5)
Duodenum 0.83 1.29 0.71 1.22 0.94 1.13 0.98 1.80 0.93 0.99 0.94 1.03 1.44 1.40
Jejunum 1.56 1.11 1.28 1.21 0.99 0.98 1.16 1.32 1.33 1.30 1.24 1.05 1.12 1.51
Ileum 1.78 1.15 1.84 2.52 2.08 1.87 1.47 0.87 1.35 1.26 1.22 1.54 0.99 0.88
SEM 0.07 0.05 0.06 0.10 0.08 0.07 0.06 0.07 0.05 0.05 0.04 0.06 0.04 0.07
P-value <0.01 0.03 <0.01 <0.01 <0.01 <0.01 <0.01 <0.01 <0.01 <0.01 <0.01 <0.01 <0.01 <0.01
Age
(n=5)
Day 3 1.49 1.39 1.23 1.18 1.46 1.58 1.41 1.24 1.34 1.40 1.00 0.87 0.94 0.98
Day 5 2.32 1.39 1.61 2.36 1.25 1.26 1.08 1.36 1.21 1.36 1.48 1.88 1.62 1.52
Day 10 1.89 1.61 1.54 1.78 1.80 1.63 1.48 1.46 1.66 1.82 1.42 1.01 1.00 1.38
Day 21 0.69 1.07 1.34 2.65 1.36 1.19 1.20 1.49 1.15 0.90 1.09 1.12 1.14 1.38
Day 26 0.86 0.88 1.14 1.22 1.35 1.18 1.04 1.46 0.91 0.83 0.99 1.24 1.15 1.32
Day 35 1.08 0.76 0.80 0.72 0.82 1.12 0.99 0.97 0.93 0.80 0.82 1.12 1.24 1.01
SEM 0.10 0.08 0.08 0.21 0.13 0.13 0.09 0.13 0.08 0.11 0.08 0.09 0.07 0.11
P-value <0.01 <0.01 <0.01 <0.01 <0.01 0.02 <0.01 0.05 <0.01 <0.01 <0.01 <0.01 <0.01 <0.01
Interaction2
T×S 0.60 0.04 0.79 0.02 0.96 0.77 0.81 0.79 0.82 0.68 0.83 0.80 0.23 0.61
S×A <0.01 <0.01 <0.01 <0.01 <0.01 <0.01 <0.01 <0.1 <0.01 <0.01 <0.01 <0.01 <0.01 <0.01
T×A 0.14 0.30 0.12 <0.01 0.96 0.96 0.96 0.20 0.07 0.83 0.54 0.31 0.83 0.30
T×S×A 0.99 0.58 0.78 <0.01 0.24 0.46 0.71 0.40 0.63 0.48 0.73 0.97 0.95 0.98

75
1 The whole statistical model included main effects of treatment (C, DL-Met, L-Met, DL-HMTBA), age (d3, 5, 10, 21, 26, 35), and small intestine segment
(duodenum, jejunum, ileum) and their interactions.
2 For the interaction, T, S and A represent the effects of treatment, small intestine segment and age, respectively.
3 Data are shown as least squares means ± standard errors of the mean. Means in a column without a common letter differ, P < 0.05. n=5.

76
Table 3.7 Contrasts for significant treatment × age interaction effects for LAT1, ATB0,+ and B0AT expression analyzed within each
small intestinal segment. Male broiler chickens were fed a diet with or without methionine supplementation until post-hatch day 35.
Treatment1 Significant P-values for Contrasts4
C DL-
Met L-Met
DL-
HMTBA SEM2
P-
value3
DL-Met
vs. L-Met
DL-Met
vs. DL-
HMTBA
L-Met vs.
DL-
HMTBA
C vs. DL-
Met
C vs. L-
Met
C vs. DL-
HMTBA
Duodenum,
LAT15 0.10 0.033
Day 3 0.91 0.82 1.74 0.83 0.002 0.002 0.004
Day 5 0.66 0.82 0.70 0.91
Day 10 1.68 1.15 1.03 0.82 0.023 0.003
Day 21 1.07 1.06 1.29 0.99
Day 26 0.42 0.51 0.61 0.75
Day 35 0.79 1.02 0.75 1.00
Jejunum,
ATB0,+ 0.20 0.033
Day 3 0.68 1.14 1.68 0.66
Day 5 0.60 3.44 2.83 3.00 <0.001 <0.001 <0.001
Day 10 1.37 1.26 0.85 1.74
Day 21 0.87 1.75 1.36 1.14
Day 26 0.51 0.49 0.58 1.05
Day 35 0.48 0.68 0.54 0.52
Jejunum,
B0AT 0.16 0.038
Day 3 0.71 0.51 0.83 0.55
Day 5 0.85 0.84 0.50 0.83
Day 10 0.69 0.39 0.52 0.95
Day 21 1.26 1.40 1.53 1.00
Day 26 1.21 2.92 1.20 1.24 <0.001 <0.001 <0.001
Day 35 1.46 0.81 0.82 0.75
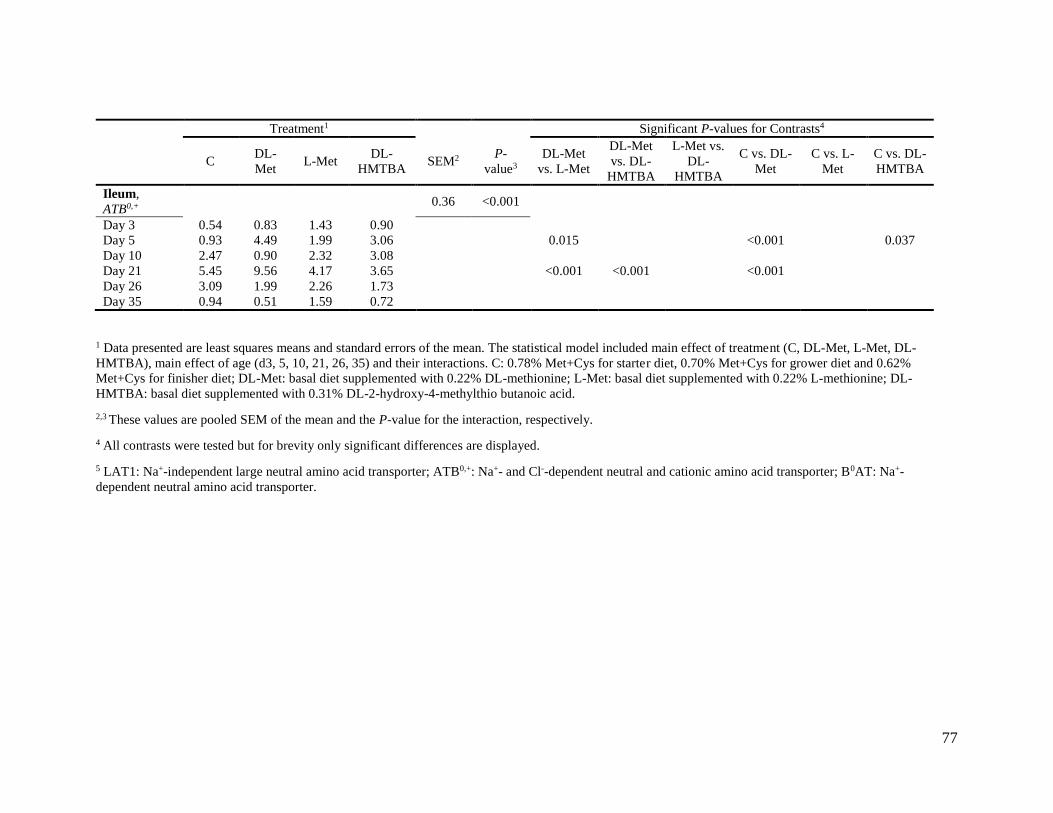
77
Treatment1 Significant P-values for Contrasts4
C DL-
Met L-Met
DL-
HMTBA SEM2
P-
value3
DL-Met
vs. L-Met
DL-Met
vs. DL-
HMTBA
L-Met vs.
DL-
HMTBA
C vs. DL-
Met
C vs. L-
Met
C vs. DL-
HMTBA
Ileum,
ATB0,+ 0.36 <0.001
Day 3 0.54 0.83 1.43 0.90
Day 5 0.93 4.49 1.99 3.06 0.015 <0.001 0.037
Day 10 2.47 0.90 2.32 3.08
Day 21 5.45 9.56 4.17 3.65 <0.001 <0.001 <0.001
Day 26 3.09 1.99 2.26 1.73
Day 35 0.94 0.51 1.59 0.72
1 Data presented are least squares means and standard errors of the mean. The statistical model included main effect of treatment (C, DL-Met, L-Met, DL-
HMTBA), main effect of age (d3, 5, 10, 21, 26, 35) and their interactions. C: 0.78% Met+Cys for starter diet, 0.70% Met+Cys for grower diet and 0.62%
Met+Cys for finisher diet; DL-Met: basal diet supplemented with 0.22% DL-methionine; L-Met: basal diet supplemented with 0.22% L-methionine; DL-
HMTBA: basal diet supplemented with 0.31% DL-2-hydroxy-4-methylthio butanoic acid.
2,3 These values are pooled SEM of the mean and the P-value for the interaction, respectively.
4 All contrasts were tested but for brevity only significant differences are displayed.
5 LAT1: Na+-independent large neutral amino acid transporter; ATB0,+: Na+- and Cl--dependent neutral and cationic amino acid transporter; B0AT: Na+-
dependent neutral amino acid transporter.
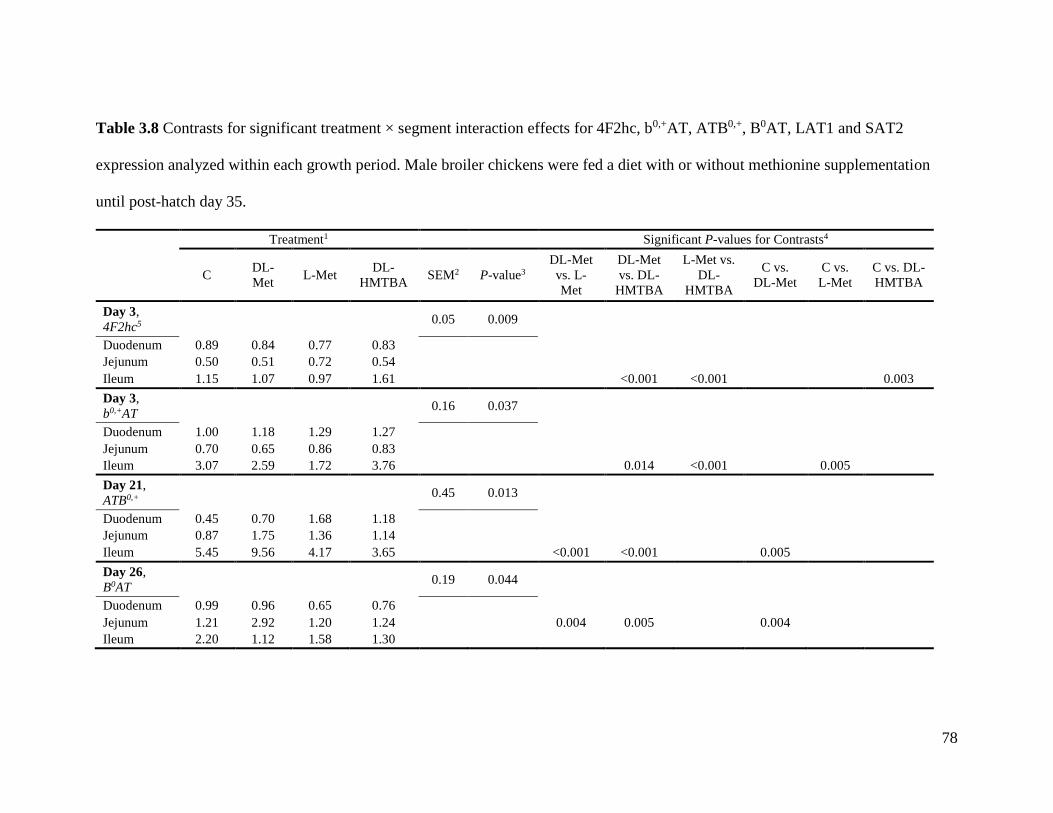
78
Table 3.8 Contrasts for significant treatment × segment interaction effects for 4F2hc, b0,+AT, ATB0,+, B0AT, LAT1 and SAT2
expression analyzed within each growth period. Male broiler chickens were fed a diet with or without methionine supplementation
until post-hatch day 35.
Treatment1 Significant P-values for Contrasts4
C DL-
Met L-Met
DL-
HMTBA SEM2 P-value3
DL-Met
vs. L-
Met
DL-Met
vs. DL-
HMTBA
L-Met vs.
DL-
HMTBA
C vs.
DL-Met
C vs.
L-Met
C vs. DL-
HMTBA
Day 3,
4F2hc5 0.05 0.009
Duodenum 0.89 0.84 0.77 0.83
Jejunum 0.50 0.51 0.72 0.54
Ileum 1.15 1.07 0.97 1.61 <0.001 <0.001 0.003
Day 3,
b0,+AT 0.16 0.037
Duodenum 1.00 1.18 1.29 1.27
Jejunum 0.70 0.65 0.86 0.83
Ileum 3.07 2.59 1.72 3.76 0.014 <0.001 0.005
Day 21,
ATB0,+ 0.45 0.013
Duodenum 0.45 0.70 1.68 1.18
Jejunum 0.87 1.75 1.36 1.14
Ileum 5.45 9.56 4.17 3.65 <0.001 <0.001 0.005
Day 26,
B0AT 0.19 0.044
Duodenum 0.99 0.96 0.65 0.76
Jejunum 1.21 2.92 1.20 1.24 0.004 0.005 0.004
Ileum 2.20 1.12 1.58 1.30

79
Treatment1 Significant P-values for Contrasts4
C DL-
Met L-Met
DL-
HMTBA SEM2 P-value3
DL-Met
vs. L-
Met
DL-Met
vs. DL-
HMTBA
L-Met vs.
DL-
HMTBA
C vs.
DL-Met
C vs.
L-Met
C vs. DL-
HMTBA
Day 26,
LAT1 0.07 0.002
Duodenum 0.42 0.51 0.61 0.75
Jejunum 1.95 1.00 1.14 1.04
Ileum 1.08 0.80 0.81 0.77 <0.001 <0.001 <0.001
Day 35,
ATB0,+ 0.11 0.033
Duodenum 0.28 1.02 0.57 0.83 0.003
Jejunum 0.48 0.68 0.54 0.52
Ileum 0.94 0.51 1.59 0.72 0.002 0.010
Day 35,
SAT2 0.06 0.039
Duodenum 0.72 1.39 1.07 0.80 0.003 <0.001
Jejunum 0.73 0.63 0.80 0.80
Ileum 0.57 0.52 0.54 0.58
1 Data presented are least squares means and standard errors of the mean. The statistical model included main effect of treatment (C, DL-Met, L-Met, DL-
HMTBA), main effect of small intestine segment (duodenum, jejunum, ileum) and their interactions. C: 0.78% Met+Cys for starter diet, 0.70% Met+Cys for
grower diet and 0.62% Met+Cys for finisher diet; DL-Met: basal diet supplemented with 0.22% DL-methionine; L-Met: basal diet supplemented with 0.22% L-
methionine; DL-HMTBA: basal diet supplemented with 0.31% DL-2-hydroxy-4-methylthio butanoic acid.
2,3 These values are pooled SEM of the mean and the P-value for the interaction, respectively.
4 All contrasts were tested but for brevity only significant differences are displayed.
5 4F2hc: 4F2 cell-surface antigen heavy chain; b0,+AT: Na+-independent cationic and neutral amino acid transporter; ATB0,+: Na+- and Cl--dependent neutral and
cationic amino acid transporter; B0AT: Na+-dependent neutral amino acid transporter; LAT1: Na+-independent large neutral amino acid transporter; SAT2: Na+-
dependent neutral amino acid transporter.

80
Figure 3.1 Temporal changes in DNA methyltransferase activity and total DNA
methylation in liver of chickens. (A) Hepatic DNA methyltransferase (DNMT) activity
and (B) total DNA methylation in liver in male broiler chickens at post-hatch days 0, 3, 5,
10, 21, 26 and 35. Because there was no difference between four treatment groups, we
pooled them (n=24; 4 treatments each of 6 replicates). Values represent least squares
means ± SEM. Means were separated using Tukey’s test. Bars with different letters
represent significant difference, P < 0.05.

81
Figure 3.2 Relative gene expression of intestinal nutrient transporters from chickens fed
different methionine sources analyzed by segment. (A) Relative ATB0,+ mRNA
abundance in duodenum and (B) MCT1 mRNA abundance in jejunum in male broiler
chickens fed the diet deficient in Met+Cys (C), or the same diet supplemented with
0.22% DL-methionine (DL-Met), 0.22% L-methionine (L-Met) or 0.31% DL-2-hydroxy-
4-methylthio butanoic acid (DL-HMTBA) (n=5). Figure shows main effect of treatment
within each small intestine segment across all the ages. Values represent least squares
means ± SEM. Means were compared using contrasts. * P < 0.05, **P < 0.01.
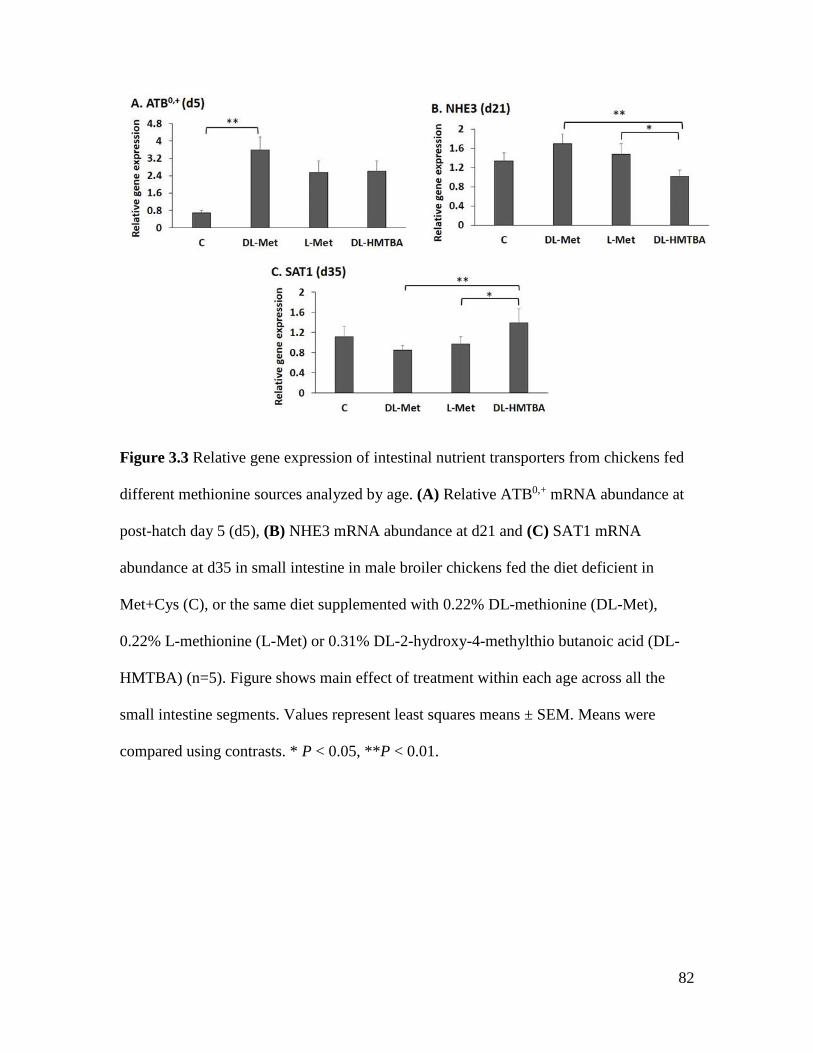
82
Figure 3.3 Relative gene expression of intestinal nutrient transporters from chickens fed
different methionine sources analyzed by age. (A) Relative ATB0,+ mRNA abundance at
post-hatch day 5 (d5), (B) NHE3 mRNA abundance at d21 and (C) SAT1 mRNA
abundance at d35 in small intestine in male broiler chickens fed the diet deficient in
Met+Cys (C), or the same diet supplemented with 0.22% DL-methionine (DL-Met),
0.22% L-methionine (L-Met) or 0.31% DL-2-hydroxy-4-methylthio butanoic acid (DL-
HMTBA) (n=5). Figure shows main effect of treatment within each age across all the
small intestine segments. Values represent least squares means ± SEM. Means were
compared using contrasts. * P < 0.05, **P < 0.01.

83
CHAPTER 4 Methionine Converting Enzymes, Oxidative Stress Markers and
Amino Acid Signaling in Broiler Chickens Fed Methionine Isomers or Precursors
4.1 Abstract
The common dietary supplemental methionine (Met) sources include DL-Met and
the analog DL-2-hydroxy-4-(methylthio) butanoic acid (DL-HMTBA). D-Met and DL-
HMTBA must be converted to L-Met through oxidation and transamination for
utilization. Met also plays an important role in the defense against oxidative stress. The
objective of this study was to determine the effect of different dietary Met source
supplementation and Met deficiency on mRNA expression and localization and enzyme
activity of Met converting enzymes, as well as oxidative status and amino acid signaling
pathway of broiler chickens. Liver, breast muscle, duodenum, jejunum and ileum were
collected at days 10, 21 and 26 from male Cobb 500 chickens fed a diet deficient in sulfur
amino acids (control), or the control diet supplemented with DL-Met, L-Met or DL-
HMTBA to meet requirements (n=5). The mRNA abundance of three oxidases and four
transaminases was measured by real-time PCR, and the oxidase activity was measured
using colorimetric assays. Markers of oxidative stress including glutathione (GSH)
profile, protein carbonyl, thiobarbituric acid reactive substances (TBARS) and ferric
reducing/antioxidant power (FRAP) were assayed using commercial kits. The expression
of the effector gene p70S6K in the SAT2/mTOR pathway was assayed using western
blot. Both mRNA and protein of the Met converting enzymes showed tissue- and
development-specific expression. DL-HMTBA and L-Met enhanced hepatic L-HMTBA
oxidase (L-2-hydroxy acid oxidase, HAO1) gene expression, all three Met sources
84
decreased D-Met oxidase (D-aspartate oxidase, DAO) gene expression, while DL-Met
increased glutamic-oxaloacetic transaminase 2 gene expression in duodenum. However,
there was no significant differences for the three oxidase activities among treatment
groups. There were significant tissue effects for all the oxidative stress markers
independent of treatment. Total GSH (TGSH) and reduced GSH (rGSH) levels varied
among groups in breast muscle and ileum. Nevertheless, the ratio of rGSH/TGSH, which
actually defines the oxidative status, was not affected by Met sources. Protein carbonyl
levels also varied among groups in jejunum and muscle tissue, but these values are in the
normal physiological range. TBARS and FRAP levels were not different between groups
in different tissues. In addition, DL-HMTBA decreased phospho-p70S6K protein
expression in jejunum, which was inconsistent with the increase in SAT2 gene
expression. In conclusion, there was complex regulation of Met converting enzyme and
the SAT2/mTOR/p70S6K pathway by dietary Met sources. Different Met sources and
Met deficiency did not alter oxidative status of the treated chickens, but L-Met and DL-
HMTBA supplementation to a Met-deficient diet can increase the intracellular
antioxidant capacity produced by GSH in breast muscle.
85
4.2 Introduction
Methionine (Met) is the first limiting amino acid in broiler chicken diets. It is also
a precursor for the synthesis of proteins and serves as the predominant amino acid for
translation initiation. In addition, Met participates in methyl group metabolism and thus is
involved in synthesis of the other sulfur amino acids, especially cysteine. Cysteine is an
essential component for glutathione (GSH) and taurine synthesis, which play a vital role
in host defense against oxidative stress (Metayer et al., 2008). Thus, Met deficiency
results in reduced protein accretion and growth rate as well as impaired immune
competence (Zhang and Guo, 2008).
Dietary supplemental Met sources are provided in the feed for cost efficiency.
Two common Met sources are DL-Met and DL-Met hydroxy analog, which is also
known as DL-2-hydroxy-4-(methylthio) butanoic acid (DL-HMTBA). Dietary DL-
HMTBA is added either as a free acid or as a calcium salt. DL-HMTBA lacks an amino
group and thus is not a true amino acid but an amino acid precursor.
DL-Met and DL- HMTBA are transported by different transporter systems in the
small intestine. DL-Met is transported by the Na+-independent systems b0,+ and L, and the
Na+-dependent systems y+, B and A (Soriano-Garcia et al., 1998). In contrast, DL-
HMTBA transport was mediated by the monocarboxylate transporter 1 (MCT1) and
coupled to the Na+-H+ exchanger (NHE3) (Martin-Venegas et al., 2007; 2008) .
Both D-Met and DL-HMTBA must be converted to L-Met for utilization at the
cellular level. D-Met is first oxidized to 2-keto-4 (methylthio) butanoic acid (KMB) by
the enzyme D-amino acid oxidase (D-AAOX; EC 1.4.3.3), which is a peroxisomal
enzyme containing flavin adenine dinucleotide (FAD) as a cofactor. In rat liver, KMB is

86
transaminated by the enzyme transaminase using glutamine or asparagine as amino
donors to produce L-Met (Backlund et al., 1982). In contrast, in chicken liver, leucine,
isoleucine and valine act as amino donors for Met synthesis while glutamine is much less
effective (Gordon and Sizer, 1965). Transaminase is ubiquitous and is not thought to be
a limiting step in the transformation process, although this has not been definitively
demonstrated.
D-HMTBA and L-HMTBA are transformed to KMB using two different
enzymatic systems, which are located in two different cell organelles (Dibner and Knight,
1984). L-2-hydroxy acid oxidase (L-HAOX; EC 1.1.3.15) is mainly located in the hepatic
and renal peroxisomes of chickens and rats, and catalyzes the conversion of L-HMTBA
to KMB. There are two isoforms of L-HAOX, HAO1 and HAO2. HAO1 is believed to be
involved mainly in L-HMTBA oxidation because it preferentially oxidizes short-chain
aliphatic 2-hydroxyacids (Ferjancic-Biagini et al., 1998). D-2-hydroxy acid
dehydrogenase (D-HADH; EC 1.1.99.6) is located in the mitochondria in various tissues,
and catalyzes the conversion of D-HMTBA to KMB. FAD and flavin mononucleotide
(FMN) are common cofactors for both L-HAOX and D-HADH, and hydrogen peroxide
(H2O2) is the common byproduct. In both cases the resulting KMB is transaminated to L-
Met by transaminase. Conversion of DL-HMTBA to Met occurs principally in the liver.
However, this conversion also occurs in the small intestine (Martin-Venegas et al., 2006;
2011) .
Met is directly related to synthesis of GSH and cysteine, which are direct
scavengers of reactive oxygen species (ROS) and thus can alleviate the deleterious effect
of lipid peroxidation and protein oxidation (Swennen et al., 2011). Therefore, it is
87
reasonable to hypothesize that dietary Met supplementation is beneficial in alleviating
oxidative stress. The commonly used oxidative stress markers include the glutathione
(GSH) profile, protein carbonyl, thiobarbituric acid reactive substances (TBARS) and
ferric reducing /antioxidant power (FRAP). GSH is the key antioxidant in animal tissues,
which can easily reduce the disulfide bonds in proteins to cysteine and in the process be
converted to the oxidized form GSSG. In normal tissues, most of the glutathione is
present as the reduced form (rGSH) compared to the oxidized form (GSSG). Thus a
decrease in the rGSH/total GSH (TGSH) ratio is an indicator of oxidative stress. Protein
carbonyl content is the most commonly used marker of protein oxidation, whereas
TBARS is the most widely employed assay used to determine lipid peroxidation. FRAP
is usually used to represent antioxidant capacity.
The availability of amino acids is monitored by cellular amino acid sensors. For
example, the sodium-dependent neutral amino acid transporter-2 (SAT2, SLC38A2),
serves as an amino acid transporter as well as an amino acid sensor and has been termed a
transceptor. SAT2 is a member of the System A amino acid transporters, which mediates
its transceptor signaling through the mTOR pathway (Pinilla et al., 2011). Amino acids
can also act as a nutrient signal to regulate intracellular kinases. A key signaling kinase
downstream of mTOR is p70S6K, which is a serine/threonine kinase that phosphorylates
the 70-kDa ribosomal protein S6. Elevated levels of mTOR activity are associated with
increased phosphorylation of p70S6K, which in turn phosphorylates S6, resulting in
increased protein synthesis and cell proliferation.
The objective of this study was to determine the effect of different dietary Met
source supplementation and Met deficiency on gene expression of Met converting
88
enzymes (oxidases and transaminases), enzymatic activity and mRNA localization of Met
oxidases, markers of oxidative stress including GSH profile, protein carbonyl, TBARS
and FRAP levels, and expression of the effector genes (p70S6K) in the amino acid
signaling (SAT2/mTOR) pathway in male broiler chickens. We hypothesized that dietary
Met supplementation could alter the expression profiles of Met converting enzymes,
oxidative stress markers and the p70S6K protein expression.
4.3 Materials and Methods
4.3.1 Animals
Details about the animals used in this study are the same as described in 3.3.1.
4.3.2 Met converting enzyme gene expression
Liver, breast muscle and three small intestinal segments (duodenum, jejunum, and
ileum) from five birds per treatment on d10, 21 and 26 were used in this assay. Total
RNA was isolated and purified and first-strand cDNA was synthesized, following the
same protocol as described in section 3.3.5. Expression of three oxidase genes: D-amino
acid oxidase (DAO), L-2-hydroxy acid oxidase (HAO1) and D-2-hydroxy acid
dehydrogenase (LDHD) and four transaminase genes: alanine-glyoxylate
aminotransferase (AGXT), branched chain amino acid transaminase (BCAT1), glutamic-
oxaloacetic transaminase (GOT2) and ornithine aminotransferase (OAT), and 3 reference
genes: ribosomal protein L4 (PRL4), ribosomal protein large, P0 (PRLP0) and ribosomal
protein large, P1 (PRLP1) were assayed using relative quantification real time PCR.
Primers designed for real time PCR are listed in Table 4.1 and were validated for
amplification efficiency before use (90-115% efficiency). Real-time PCR was performed
and relative gene expression was calculated as described in section 3.3.5.

89
4.3.3 Enzymatic activity of Met oxidases
Liver, breast muscle and three small intestinal segments (duodenum, jejunum, and
ileum) from five birds per treatment on d10, 21 and 26 were prepared as described by
Dibner and Knight (1984). Approximately 0.1g of tissue sample was homogenized in 1
ml of homogenizing buffer using 5 mm stainless steel beads and Tissue Lyser II. The
homogenizing buffer consisted of 0.25 M sucrose, 1 mM phenyl methylsulfonyl fluoride
and 0.02 M potassium phosphate, pH 7.5. Mitochondrial and peroxisomal fractions were
prepared by differential centrifugation. Tissue homogenates were centrifuged at 350 × g
for 10 min to remove cells and cell debris. The supernatant was centrifuged at 3,000 × g
for 15 min to enrich for mitochondria in the pellet, which was subsequently resuspended
and washed twice in 0.01 M Tris, pH 6.8. The supernatant from the 3,000 × g step was
centrifuged at 22,000 × g for 15 min to yield a peroxisome enriched pellet. The
peroxisome pellet was resuspended and washed twice in 0.01 M Tris, pH 7.5. Protein
concentration in both fractions was measured using the Bradford assay (Sigma-Aldrich,
St. Louis, MO).
L-HAOX activity was measured in the peroxisome fraction. 0.1 ml
(approximately 0.2 mg protein) of peroxisome fraction was added to a reaction buffer
containing 0.75 ml 0.01 M Tris, pH 7.5, 2.5 μmol L-HMTBA, 0.25 μmol flavin adenine
dinucleotide (FAD) and 0.15 μmol cycloserine. D-AAOX activity was measured in the
mitochondrial fraction. 0.1 ml (approximately 0.2 mg protein) of mitochondrial fraction
was added to a reaction buffer containing 0.75 ml 0.01 M Tris, pH 7.5, 2.5 μmol D-Met,
0.25 μmol FAD and 0.15 μmol cycloserine. D-HADH activity was measured in the
mitochondrial fraction. 0.1 ml (approximately 0.2 mg protein) of mitochondrial fraction

90
was added in a reaction buffer containing 0.75 ml 0.01 M Tris, pH 8.24, 2.5 μmol D-
HMTBA and 0.5 μmol phenazine methosulfate as an electron acceptor. All the enzyme
reactions were incubated at 37oC for 90 min on a rotary shaker. Purified L-HMTBA and
D-HMTBA were chemically synthesized and provided by Dr. Kevin J. T. Noonan
(Carnegie Mellon University, Pittsburgh, PA).
Enzyme reactions were stopped by adding 0.75 ml of cold 10% trichloroacetic
acid and incubated on ice for 10 minutes. The produced 2-keto-4 (methylthio) butanoic
acid (KMB) was detected using a spectrophotometric assay. Briefly, the enzyme
reactions were centrifuged at 12,000 × g for 3 min. A 200μl aliquot of supernatant was
transferred to a 96-well plate, and 60 μl of 0.25% dinitrophenylhydrazine in 2 N HCl was
added. After a 10 min incubation at room temperature, 140 μl of 4 N NaOH was added
and the keto acid was quantified colorimetrically with a multi-mode plate reader (Infinite
M200 Pro, Tecan, Morrisville, NC). The amount of KMB is proportional to the optical
density measured at 435 nm. One unit of enzyme activity was defined as the amount
yielding 1 μg of KMB per milligram of protein under standard reaction conditions.
4.3.4 In situ hybridization of Met oxidases
Liver, breast muscle and three small intestinal segments (duodenum, jejunum, and
ileum) from four treatment groups were collected at d10 (n=1). Samples were rinsed in
PBS and submerged and fixed in 10% neutral-buffered formalin at 4oC for overnight
incubation. Samples were then dehydrated in 70% ethanol, paraffin embedded by Histo-
Scientific Research Lab (Mount Jackson, VA) and sectioned at 6 µm using a HM355 S
rotary microtome (Microm International GmbH, Germany). The RNAscope® assay
(Wang et al., 2012) was used for in situ RNA analysis of L-HMTBA oxidase L-2-

91
hydroxy acid oxidase (HAO1) and D-HMTBA oxidase D-2-hydroxy acid dehydrogenase
(LDHD) in the formalin-fixed paraffin-embedded (FFPE) samples. Probes for HAO1 and
LDHD were synthesized by Advanced Cell Diagnostics (Hayward, CA). The RNAscope®
assay was conducted using the corresponding commercial kits provided by Advanced
Cell Diagnostics, following the manufacturer’s protocol. Briefly, the prepared sections
were deparaffinized using xylene, and pretreated with hydrogen peroxide, retrieval
reagent and protease to expose the target RNA. Gene-specific “Z”-shape probe pairs were
used to hybridize to the target mRNA. Probes were then hybridized to a cascade of signal
amplification molecules to culminate in binding of HRP-labeled probes, and 3,3'-
diaminobenzidine (DAB) was added to detect the target. Slides were counterstained with
50% hematoxylin and 0.02% ammonia water, and mounted for visualization. Images
were captured at 400 × magnification with a Nikon Eclipse 80i microscope and DS-Ri1
super high-definition cooled color camera head, and analyzed by NIS-Elements
Advanced Research Software (Nikon). The target mRNA was revealed as brown dots.
PPIB (peptidylprolyl isomerase B) was used as a positive control. Bacterial gene dapB
(dihydrodipicolinate reductase) was used as a negative control.
4.3.5 Assays for oxidative stress markers
Markers of oxidative stress including total glutathione (TGSH), oxidized
glutathione (GSSG), reduced glutathione (rGSH), protein carbonyl, thiobarbituric acid
reactive substances (TBARS) and ferric reducing/antioxidant power (FRAP) were
assayed in liver, breast muscle and three small intestinal segments (duodenum, jejunum,
and ileum) from five birds per treatment on d10 and d26 using commercially available
ELISA kits.

92
TGSH, GSSG and rGSH were measured using an enzymatic recycling method
provided by the Glutathione Assay Kit (Cayman Chemical Company, Ann Arbor, MI),
following the manufacturer’s protocol. Briefly, 0.2 g samples were first deproteinized,
and then the GSH in the sample was allowed to react with DTNB (5,5’-dithio-bis-2-
(nitrobenzoic acid), Ellman’s reagent) to produce the yellow colored 5-thio-2-
nitrobenzoic acid (TNB). The mixed disulfide, GSTNB (between GSH and TNB) was
reduced by glutathione reductase to recycle the GSH and produce more TNB. The
amount of TNB production, quantified colorimetrically with the Infinite M200 Pro at 410
nm, was directly proportional to the concentration of TGSH in the sample. GSH was
easily oxidized to the disulfide dimer GSSG by glutathione peroxidase. Quantification of
GSSG, exclusive of GSH, was accomplished by first derivatizing GSH with 2-
vinylpyridine, then following the above enzymatic method. rGSH levels were calculated
by substracting twice the GSSG concentration from the TGSH concentration. To better
represent the redox status, the rGSH to TGSH ratio and rGSH to GSSG ratio were also
calculated.
Protein carbonyl was measured using the Protein Carbonyl Colorimetric Assay
Kit (Cayman Chemical Company), following the manufacturer’s protocol. Briefly, 0.2 g
samples were used and nucleic acids were first removed using streptomycin sulfate. Then
2,4-dinitrophenylhydrazine (DNPH) was added to react with protein carbonyls, forming a
Schiff base to produce hydrazine, which was quantified colorimetrically with the Infinite
M200 Pro at 367 nm.
TBARS was measured using the TBARS Assay Kit (Cayman Chemical
Company), following the manufacturer’s protocol. Briefly, the MDA-TBA adduct formed
93
by the reaction of malondialdehyde (MDA) and TBA at 100°C and acidic conditions was
quantified colorimetrically with the Infinite M200 Pro at 535 nm.
FRAP was measured using the DetectX® FRAP™ Colorimetric Detection Kit
(Arbor Assays, Ann Arbor, MI), following the manufacturer’s protocol. Briefly, ferric
iron (Fe3+) can be reduced by electron-donating antioxidants present within the sample to
its ferrous form (Fe2+). The iron colorimetric probe complex then can develop a dark blue
color product upon reduction, which was measured with the Infinite M200 Pro at 560 nm.
4.3.6 Western blot assay for p70S6K expression
Liver, breast muscle and three small intestinal segments (duodenum, jejunum, and
ileum) from 4 birds per treatment on d10, 21 and 26 were used for western blot assay.
Approximately 0.1 g tissue was minced using razor blades in liquid nitrogen and
homogenized in RIPA buffer (Sigma-Aldrich) with Halt Protease Inhibitor (Thermo
Scientific) using 5 mm stainless steel beads and a Tissue Lyser II. Protein concentration
was quantified using the Pierce™ BCA Protein Assay Kit (Thermo Scientific).
Nineteen micrograms of protein (9.5 µL at 2 µg/µL) were added to an equal
volume of TruSep SDS Sample Buffer (NuSep, Bogart, GA) with 1 µL 2-
mercaptoethanol, vortexed, and boiled for 5 min at 95oC. Samples were loaded onto a
10% Criterion™ TGX™ Precast Midi Protein Gel (Bio-Rad, Hercules, CA). The
HyperPAGE II Prestained Protein Marker (Bioline USA, Taunton, MA) was loaded in
the first well of each gel. Samples from the same replicate and the same tissue were run
as duplicate gels. One replicate was used for p70S6K protein detection and the other for
phospho-p70S6K protein detection. Gels were run at 200 V for 40 min and then
equilibrated for 10 min in cold CAPS transfer buffer (10×CAPS stock buffer, 10%

94
methanol). Immun-BlotTM PVDF membranes (Bio-Rad) were pre-wetted in methanol and
placed together with 3 MM cellulose chromatography papers (GE Healthcare Life
Sciences, Pittsburgh, PA) in transfer buffer for 10 min prior to transfer. Transfer
sandwiches were set up for a semi-dry transfer using the Trans-Blot® TurboTM Blotting
System (Bio-Rad). Transfers were performed at 25V, 2.5A for 6 min at constant current.
Following transfer, membranes were cut at 55kD based on the molecular weight marker
to separate target protein (p70S6K or phospho-p70S6K, larger than 55kD) and internal
control protein (smaller than 55kD). Cut membranes were blocked simultaneously in 5%
Bovine Serum Albumin (BSA; Sigma-Aldrich) in TBST (30 mM Tris, 200 mM NaCl,
0.1 % Tween-20) for 1 h at room temperature on a rocker. After blocking solution was
poured off, membranes were rinsed 2×5 min in TBST at room temperature on a rocker
and primary antibodies diluted in 5% BSA in TBST were added. The rabbit anti human
p70S6K antibody (C-Terminus, cross-reacts with chicken; LifeSpan BioSciences, Seattle,
WA, catalog # LS-C287402) and the rabbit anti human phospho-p70S6K antibody
(phospho T389, cross-reacts with chicken; Abcam, Cambridge, MA, catalog # ab126818)
were used to detect the target proteins at 1:1000 dilution. The rabbit anti human GAPDH
antibody (cross-reacts with chicken; Abcam, catalog # ab9485) diluted 1:2500 was used
as an internal standard in breast muscle and the rabbit anti human beta-actin antibody
(cross-reacts with chicken; Cell Signaling Technology, Danvers, MA, catalog # 4970)
diluted 1:1000 was used as internal standards in liver and small intestinal tissues.
Membranes were incubated in the primary antibody solutions overnight at 4°C on a
rocker. Antibody solutions were poured off and membranes were washed 2×5 min, 1×15
min and 2×5 min in TBST at room temperature on a rocker. The secondary antibody
95
solution consisted of HRP-linked goat anti-rabbit IgG (Cell Signaling Technology,
catalog # 7074), which was diluted 1:2000 in 3% BSA in TBST. Membranes were
incubated in the secondary antibody solution for 1 h at room temperature on a rocker.
After secondary antibody was poured off, membranes were washed 2×5 min, 1×15 min
and 2×5 min in TBST at room temperature on a rocker.
Following the last wash, membranes were incubated in Amersham ECL Prime
Western Blotting Detection Reagent (GE Healthcare Life Sciences) for 5 min
(0.1mL/cm2 membrane). Chemiluminescence was imaged on membranes using a Chemi-
DocTM XPS+ imaging system (Bio-Rad) with an exposure time of 60 sec. Bands were
quantified by volume tool using Image LabTM software (Bio-Rad). The expression of
p70S6K and phospho-p70S6K were normalized to the internal control from the same gel.
The ratio of phospho-p70S6K expression to p70S6K expression was calculated.
4.3.7 Data analysis
For the Met converting enzyme gene expression assay, there were three statistical
models for the mRNA expression data, which considered: 1) the main effects of
treatment, age and tissue and their two-way and three-way interactions; 2) the main
effects of treatment and age and the treatment × age interaction within each tissue (liver,
breast muscle, duodenum, jejunum, and ileum) and 3) the main effects of treatment and
tissue and the treatment × tissue interaction, within each age (d10, d21 and d26). For the
Met oxidase activity assay, statistical models 2 and 3 were used. Data were checked for
normality and homogeneity of variances. Split-plot design was considered when
analyzing data from model 1 and 3, with chicks as the whole plot, the tissue as the split

96
plot and chicks as the random effect. Data from model 2 were analyzed by two-way
ANOVA. Contrasts were used to separate treatment means.
For parameters in the other assays, data were analyzed within each tissue (liver,
breast muscle, duodenum, jejunum and ileum). The statistical models included the main
effects of treatment, age and their interactions. All the data were checked for normality
and homogeneity of variances and analyzed by ANOVA. Means were separated using
Tukey’s Test.
JMP Pro version 11.0 (SAS Institute, Cary, NC) was used for statistical analysis.
Data are presented as least square means ± SEM and statistical significance assigned at P
< 0.05.
4.4 Results
4.4.1 Met converting enzyme gene expression
Data were analyzed using three statistical models, as described in Materials and
Methods. For model 1, there were significant tissue × age interactions for all the genes. In
addition, there was a significant treatment × tissue interaction for mRNA expression of
HAO1, a significant treatment × age interaction for mRNA expression of DAO, and a
significant treatment × tissue × age three-way interacton for mRNA expression of
BCAT1. Data are shown in Table 4.2.
For the age effects, all of the measured mRNAs except BCAT1 had greater
expression at day 10 than day 26 (Table 4.2). BCAT1 had greater mRNA expression at
d21 than d26. For the tissue effects, both L-HMTBA oxidase (HAO1) mRNA and D-
HMTBA oxidase (LDHD) mRNA were more abundant in liver than other tissues, while
D-Met oxidase (DAO) mRNA was more abundant in muscle, followed by liver, and three

97
segments of small intestine (Figure 4.1). Among the 4 transaminase mRNAs, BCAT1
was expressed greatest in muscle and AGXT was expressed greatest in liver compared to
other tissues. GOT2 and OAT were expressed greater in liver and muscle compared to
the intestinal tissues.
For model 2, chickens fed DL-Met had lower hepatic HAO1 mRNA expression
compared to L-Met and DL-HMTBA fed chickens (P = 0.033, Figure 4.2A), all three
groups with Met supplementation had lower DAO mRNA expression compared to
control group (P = 0.003, Figure 4.2B), while chickens fed DL-Met had greater GOT2
mRNA expression relative to the other treatment groups and control in duodenum (P =
0.043, Figure 4.2C). There were significant treatment × age interaction effects for AGXT,
BCAT1 and GOT2 expression (Table 4.3). At d10, in breast muscle, DL-HMTBA fed
chickens had lower AGXT mRNA expression compared to the other three groups, and
both control and DL-Met groups showed greater AGXT mRNA expression compared to
L-Met group. However, DL-HMTBA group had greater BCAT1 mRNA expression
compared to control and L-Met groups at d10; while L-Met group had greater BCAT1
mRNA expression compared to control and DL-Met groups at d21. In jejunum, DL-Met
fed chickens had greater GOT2 mRNA expression compared to the other three groups at
d10.
For model 3, chickens fed DL-Met had greater GOT2 mRNA expression
compared to the other three treatment groups (P = 0.044, Figure 4.3). There were
significant treatment × tissue interaction effects for HAO1, BCAT1 and DAO mRNA
expression (Table 4.4). At d10, both L-Met and DL-HMTBA groups showed greater
HAO1 mRNA expression compared to control and DL-Met groups in liver. DL-HMTBA

98
fed chickens had greater BCAT1 mRNA expression compared to the other three groups
and DL-Met fed chickens had greater BCAT1 mRNA expression compared to control
and L-Met groups in breast muscle. At d21, L-Met group had greater BCAT1 mRNA
expression compared to the other three groups and DL-HMTBA group had greater
BCAT1 mRNA expression compared to DL-Met group in breast muscle. At d26, control
group had greater DAO mRNA abundance compared to the other three groups in both
liver and breast muscle, and L-Met fed chickens had greater DAO mRNA expression
compared to DL-HMTBA group in breast muscle.
4.4.2 Enzymatic activity of Met oxidases
To measure oxidase activity, the optimal incubation time was determined first by
incubating the hepatic enzymatic reaction buffer at 37oC and detecting the produced
KMB at 0, 30, 60, 90 and 120 min. After 90 min incubation, KMB production reached a
peak for all three oxidases (Figure 4.4) and thus an incubation time of 90 min was
chosen.
When normalized to per milligram of protein, only D-HADH activity decreased
from d10 to d26 (from 14.8 to 10.1 µg KMB/mg protein, P = 0.038, other data not
shown). No age effect was observed for L-HAOX and D-AAOX activity. Ileum had the
lowest L-HAOX activity compared to the other tissues (Figure 4.5). Jejunum had greater
D-HADH activity but lower D-AAOX activity compared to duodenum, liver and breast
muscle (Figure 4.5). Ileum also had greater D-HADH activity and lower D-AAOX
activity compared to liver (Figure 4.5).
Analyzing within each tissue, no significant differences were seen among C, DL-
Met, L-Met and DL-HMTBA groups for all three oxidase activities (Table 4.5).

99
However, there were some age effects, which are shown in Table 4.5. D-AAOX
increased from d10 to d21 in duodenum, decreased from d10 to d26 in jejunum and
decreased from d10 and d21 to d26 in ileum. L-HAOX increased from d10 to d21 and
d26 in duodenum, and decreased from d10 to d21 and d26 in breast muscle. D-HADH
decreased from d10 to d21 and d26 in jejunum.
Analyzing within each age, DL-HMTBA fed chickens had decreased L-HAOX
activity compared to control at d26 (Table 4.6). There were also tissue main effects,
which are shown in Table 4.6. At d10, jejunum had greater D-HADH activity compared
to duodenum, liver and breast muscle, and ileum had greater D-HADH activity compared
to duodenum. At d21, the D-AAOX activity was lower in jejunum than duodenum and
breast muscle. The D-HADH activity was lower in liver than duodenum, jejunum and
ileum. At d26, the D-AAOX activity was greater in liver compared to jejunum and ileum.
The L-HAOX activity was lower in breast muscle compared to duodenum, jejunum and
liver.
4.4.3 In situ hybridization of Met oxidases
HAO1 and LDHD mRNA were localized in liver, breast muscle, duodenum,
jejunum and ileum from 10-day-old chickens fed four treatments (C, DL-Met, L-Met and
DL-HMTBA) (Figure 4.6). Liver showed much more abundant HAO1 mRNA expression
compared to the other tissues (Figure 4.6A). No obvious differences were observed for
HAO1 mRNA abundance between breast muscle and small intestinal segments. LDHD
mRNA expression showed similar distribution pattern as HAO1 (Figure 4.6B). Neither
gene showed obvious differences among the four treatment groups (Figure 4.6A-B). In
small intestine, both HAO1 and LDHD mRNA were primarily expressed in epithelia and

100
in crypts, with decreasing signals towards the tip along the length of the villus (Figure
4.6C). Since it is difficult to quantify the results, only qualitative assessment was made
here.
4.4.4 Assays for oxidative stress markers
The oxidative stress markers were measured in different tissues and there was a
significant tissue effect independent of treatment and age. For the reduced glutathione
(rGSH) to total glutathione (TGSH) ratio, which directly defines oxidative stress,
duodenum showed the lowest rGSH/TGSH ratio, and breast muscle showed the highest
rGSH/TGSH ratio compared to the other tissues (Figure 4.7A, P < 0.001). In addition,
duodenum also had lower TBARS level which defines lipid peroxidation compared to
jejunum, ileum and liver (Figure 4.7C, P < 0.001); and liver had the highest protein
carbonyl level which defines protein oxidation compared to the other tissues (Figure
4.7B, P < 0.001). For the antioxidant capacity marker FRAP, the tissue distribution
pattern is: liver > breast muscle > duodenum > jejunum = ileum (Figure 4.7D, P < 0.001).
The oxidative stress marker levels of the glutathione profile, protein carbonyl,
TBARS and FRAP were analyzed within each tissue. The glutathione profile includes
TGSH level, the oxidized glutathione (GSSG) level, rGSH level, ratio of rGSH to GSSG
and ratio of rGSH to TGSH (Table 4.7). When analyzed within each tissue, there were
significant treatment main effects for TGSH (Table 4.7A) and rGSH (Table 4.7C) levels
in breast muscle. L-Met and DL-HMTBA fed chickens showed greater TGSH and rGSH
levels compared to the control group, and L-Met fed chickens also showed greater TGSH
and rGSH levels than the DL-Met group in breast muscle (Figure 4.8A and 4.8B, P =
<0.001). There was significant treatment × age interaction effects for TGSH in jejunum

101
and ileum (Table 4.7A), GSSG in jejunum (Table 4.7B), and rGSH in ileum (Table
4.7C). At d26, L-Met fed chickens showed greater GSSG level compared to the control
and DL-Met groups in jejunum (Figure 4.8E, P = 0.001). At d26, L-Met group also had
greater TGSH and rGSH levels compared to the DL-Met group in ileum (Figure 4.8C and
4.6D, P = 0.013 and P = 0.024, respectively). However, there was no significant effect
related to treatment for the ratio of rGSH to GSSG (Table 4.7D), and the ratio of rGSH to
TGSH (Table 4.7E).
Protein carbonyl levels varied only in jejunum and breast muscle (Table 4.8). In
jejunum, DL-Met group also had greater protein carbonyl level compared to DL-HMTBA
group (Figure 4.9A, P = 0.050). There was significant treatment × age interaction effect
for protein carbonyl level in breast muscle. At d26, L-Met group showed greater protein
carbonyl level compared to control and DL-HMTBA group, and DL-Met group showed
greater protein carbonyl level compared to DL-HMTBA group in breast muscle (Figure
4.9B, P = 0.012).
However, there was no significant difference for TBARS and FRAP levels
between the four treatment groups in different tissues (Tables 4.9 and 4.10).
4.4.5 Western blot assay for p70S6K expression
SAT2 mRNA expression in different tissues at d10, 21 and 26 was assayed using
the protocol listed in section 3.3.5. Differences in the expression of SAT2 mRNA in liver,
breast muscle and intestine (duodenum, jejunum and ileum) at each age are shown in
Figure 4.10. At d10, liver, duodenum and jejunum had greater SAT2 mRNA abundance
than ileum and breast muscle. At d21, ileum had greater SAT2 mRNA expression than

102
duodenum, jejunum and breast muscle. At d26, breast muscle had the lowest SAT2
mRNA abundance than other tissues.
Representative western blot results for proteins p70S6K and phospho-p70S6K
(T389) expression in liver, breast muscle, duodenum, jejunum and ileum are shown in
Figure 4.11A-E. When analyzed within each tissue, protein expression of p70S6K and
phospho-p70S6K are summarized in Table 4.11 and Table 4.12, respectively. The only
significant treatment effect was that DL-HMTBA fed chickens showed lower phospho-
p70S6K (T389) expression compared to the control group in jejunum (P = 0.020).
4.5 Discussion
DL-Met and DL-HMTBA are two most commonly used dietary supplemental Met
sources. At the cellular level, both D-Met and DL-HMTBA are converted to L-Met for
utilization through oxidation and transamination. However, the biochemical conversion
takes place through different pathways. To determine the effect of different dietary Met
source supplementation and Met deficiency on these pathways, the mRNA expression
and enzymatic activities of key oxidases and transaminases were measured.
For mRNA expression, DL-HMTBA fed chickens showed greater HAO1 mRNA
expression in liver compared to DL-Met and control groups. This was expected since
HAO1 encodes the L-HMTBA oxidase, L-2-hydroxy acid oxidase (L-HAOX).
Interestingly, L-Met fed chickens also had greater HAO1 mRNA expression compared to
DL-Met and control groups. Ferjancic-Biagini et al. (1998) reported that L-HAOX also
has an oxidative decarboxylation activity in vitro, with NADH as a cofactor. Thus L-
HAOX may play a role in catalyzing more substrates than expected. In addition, chickens
deficient in Met showed the greatest DAO mRNA expression compared to the other three

103
groups in liver and breast muscle at d26, indicating the downregulation of the D-Met
oxidase gene when Met requirement is satisfied. No significant differences were seen
among treatments for mRNA abundance of LDHD, the gene encoding D-HMTBA
oxidase D-2-hydroxy acid dehydrogenase (D-HADH).
For the enzymatic activity, no significant effects appeared associated with the
treatment effects, except for the decreased L-HAOX activity in DL-HMTBA group
compared to control at d26. It’s difficult to provide an explanation for the only treatment
effect, since we did not expect decreased L-HMTBA oxidase activity with DL-HMTBA
supplementation. However, the overall trend of non-significant treatment effect may be
due to the excess of the enzyme concentration: the concentration of substrates is the rate
limiting factor in these oxidative reactions. The post-transcriptional regulation by
molecules such as tRNA and post-translational modification such as phosphorylation and
glycosylation to make a mature enzyme are all possible factors that can explain the
difference between mRNA and enzymatic activity. Fang et al. (2010) examined the three
oxidase activities in piglets supplemented with DL-Met and DL-HMTBA. They observed
increased L-HAOX and D-HADH activity in stomach and increased D-AAOX activity in
kidney and duodenum with DL-Met supplementation compared to DL-HMTBA
supplementation. No dietary treatment effects were shown in liver, muscle and other
segments of intestine, which is similar to our results.
In addition to the treatment effects, the oxidase expression also showed significant
tissue and age effects. Liver is the tissue with the greatest HAO1 and LDHD mRNA
expression, while breast muscle had the greatest DAO mRNA expression. Liver also
showed more abundant DAO mRNA expression compared to small intestine. Based on

104
the enzymatic activity results, liver is one of the tissues with the greatest L-HAOX and
D-AAOX activity, and high D-AAOX activity was also observed in breast muscle. These
results suggested a positive correlation between mRNA abundance and enzyme activity.
Duodenum also had high D-AAOX activity. All these tissue distribution patterns were in
accordance with the reports that both D-Met and DL-HMTBA were converted to L-Met
mainly in liver and kidney, whereas the D-amino acid oxidases also catalyzed oxidation
of D-Met in chicken small intestine (Brachet and Puigserver, 1992). However, the mRNA
expression and enzyme activity of D-HMTBA oxidase exhibited a negative correlation:
liver had the greatest LDHD mRNA expression, but the lowest D-HADH activity.
Jejunum and ileum were the tissues with the highest D-HADH activity. More work is
needed to explore the underlying regulation mechanisms. D-AAOX and L-HAOX are
mainly produced in peroxisome and D-HADH is mainly produced in mitochondria. Liver
is the tissue with abundant peroxisome and mitochondria (De Duve and Baudhuin, 1966),
which provides the biological basis for our tissue distribution results. Similar to the other
amino acid, D-Met is mainly absorbed in the small intestine through carrier-mediated
transport. As an organic acid, DL-HMTBA can be taken up along the entire
gastrointestinal tract, primarily in the proximal part in chickens, relying on a combination
of diffusion and monocarboxylic acid transporter-mediated uptake. Thus digestive
physiology can explain the higher levels of Met oxidase activity in duodenum and
jejunum compared to ileum, especially for L-HAOX. Although breast muscle requires a
large amount of L-Met for protein synthesis, the activities for all three oxidases were not
the greatest in breast muscle. It can be assumed that not much DL-HMTBA and D-Met
would reach the breast muscle in broilers fed a standard diet. Breast muscle can directly

105
utilize the L-Met that was produced in small intestine and liver. However, Dupuis et al.
(1989) suggested that at high concentrations, DL-HMTBA would be oxidized principally
in skeletal muscle. Thus skeletal muscle may have great potential for Met precursor
conversion. All the oxidases and the transaminases except for branched chain amino acid
transaminase (BCAT1) showed greater mRNA expression at d10 relative to d26,
indicating that younger chickens had more Met converting capacity, which is reasonable
since more L-Met is needed for protein synthesis and other metabolic activities during the
grower phase.
The in situ hybridization analysis of the HAO1 and LDHD mRNA further
confirmed the gene expression results from the real-time PCR assay. Both HAO1 and
LDHD had greatest expression in liver compared to muscle and small intestine. No
obvious treatment effects were observed for mRNA expression of both oxidases.
Furthermore, there were some new findings related to the localization of these two genes.
In all three segments (duodenum, jejunum and ileum) of the small intestine, the mRNA of
these two oxidases are primarily expressed in epithelia and in crypts, with decreasing
expression towards the villus tip. No one has reported the localization of DL-HMTBA
oxidases. To my knowledge, it appears those two oxidases are mainly produced in
enterocytes aggregating in crypts. Martin-Venegas, et al. (2011) suggested the complete
conversion of DL-HMTBA to L-Met takes place in the intestinal epithelium in human
Caco2 cells, while our in situ results indicated that liver has more capacity to oxidize DL-
HMTBA than small intestine.
Transamination is not assumed to be the limiting step in the Met converting
process. A wide variety of amino acids can serve as substrates for transamination of

106
KMB to form L-Met in chicken, such as branched chain amino acids and glutamic acid in
skeletal muscle, glutamate in liver, isolecucine and alanine in kidney, and all amino acids
expect alanine in intestinal mucosa (Rangel-Lugo and Austic, 1998). Considering the
diversity of transaminases, only four most commonly used transaminases were chosen for
the gene expression assay. The mRNA expression of glutamic-oxaloacetic transaminase 2
(GOT2), alanine-glyoxylate aminotransferase (AGXT) and BCAT1 showed significant
treatment effects. For example, DL-Met fed chickens had greater GOT2 mRNA
expression compared to the other three groups in duodenum and in jejunum at d10. In
breast muscle, L-Met fed chickens had the greatest BCAT1 mRNA expression at d21,
while DL-HMTBA fed chickens had the greatest BCAT1 mRNA expression at d10, and
DL-HMTBA group also had the lowest AGXT mRNA expression at d10. Aspartate and
glutamate are major substrates for GOT2 and branched chain amino acids (leucine,
isoleucine and valine) are major substrates for BCAT1. Thus it is possible that aspartate
and glutamate are better substrates for KMB transamination in DL-Met fed broilers in
duodenum and in jejunum at d10, while in breast muscle, branched chain amino acids are
better substrates in L-Met fed chickens at d21 and in DL-HMTBA fed chickens at d10.
To test these hypotheses, the transaminases activity can be measured through
chromatography in a subsequent study. There were also significant tissue and age effects
for transaminase gene expression. All of these results illustrate the complexity and
dynamics of Met converting enzyme regulation by the dietary source of Met.
After L-Met is formed from DL-HMTBA or D-Met, this nutritionally
indispensable amino acid can be incorporated into several metabolic pathways, e.g.,
protein synthesis, transmethylation to form S-adenosylmethionine (SAM) or
107
transsulfuration to form L-cysteine (L-Cys). L-Cys can be directly incorporated into
glutathione (GSH) or catabolized to taurine, and all of which have a crucial role in
oxidative stress reactions since they all have the capacity to affect the cellular redox
status (Shoveller et al., 2005). Cys and GSH can also function as direct scavengers of
ROS, which is formed at the mitochondrial level to produce deleterious effects such as
lipid and protein oxidation and DNA strand breaks, which affect metabolic processes
(Metayer et al., 2008). Thus dietary Met supplementation is related to regulation of
oxidative stress. In this study, we measured the GSH profile, protein oxidation, lipid
peroxidation and ferric reducing /antioxidant power (FRAP) in liver, breast muscle and
small intestine of chickens fed different dietary supplemental Met sources or a diet
deficient in Met. Overall, duodenum showed the most unbalanced thiol redox status
reflected by the lowest rGSH/TGSH ratio compared to the other tissues. However,
jejunum and ileum demonstrated higher lipid peroxidation and lower FRAP than
duodenum. Liver showed greater protein oxidation and lipid peroxidation, but also had
higher FRAP. Breast muscle was the tissue with the most balanced thiol redox status.
Considering the treatment effects within each tissue, the L-Met and DL-HMTBA
supplemented chickens showed greater TGSH and rGSH levels compared to the control
group in breast muscle. Also at d26, L-Met group had greater GSSG than control and
DL-Met groups in the jejunum, and greater TGSH and rGSH than DL-Met in the ileum.
Nevertheless, the ratios of rGSH/GSSG and rGSH/TGSH, which actually define the
oxidative status, were not affected by Met sources. Although L-Met and DL-HMTBA
supplementation to Met deficient diets did improve the intracellular antioxidant capacity
in breast muscle induced by TGSH. As a protein oxidation marker, the protein carbonyl

108
levels varied among groups only in jejunum and muscle tissue, but these values were still
in normal physiological ranges (refer to Xie et al. (2015) for the normal values of protein
carbonyl). Furthermore, values of TBARS, an indicator of lipid oxidants, and FRAP,
reflecting antioxidant capacity, were not different between groups in different tissues,
indicating that different Met sources did not alter oxidative status of the treated chickens.
However, with application of some more environmental stress factors, DL-HMTBA
supplementation was reported to be beneficial in reducing oxidative stress. For example,
DL-HMTBA is more effective in alleviating oxidative stress in broiler chickens induced
by heat stress (Willemsen et al., 2011) or low protein diet (Swennen et al., 2011), which
is revealed by reduced lipid peroxidation and more favorable rGSH/TGSH ratios
compared to the DL-Met group. Also DL-HMTBA supplementation markedly decreased
the serum protein carbonyl level and increased serum TGSH level at a low ambient
temperature in broilers (Yang et al., 2016).
Amino acids including Met are a potential nutrient signal and regulator for mRNA
translation and proteolysis (Yoshizawa, 2004; Nakashima et al., 2005; Kimball and
Jefferson, 2006). The initiation step of mRNA translation needs the initiator methionyl-
tRNA (Met-tRNAi), and may be inhibited by Met deficiency. With the potential effect on
intracellular kinases, Met was reported to regulate p70S6K phosphorylation and protein
synthesis in an avian myoblast cell line (QM7) of quail origin: only KMB but not D-Met
or DL-HMTBA can activate the p70S6K pathway (Metayer-Coustard et al., 2010). Thus
the effects of Met deficiency and different supplemental Met sources on p70S6K
expression in broilers was of interest. In our study described in chapter 3, we observed
greater SAT2 mRNA expression in the duodenum of DL-Met fed chickens compared to

109
control and DL-HMTBA groups at d35. SAT2 is a basolateral membrane transporter that
also plays a role as an amino acid sensor, mediating its transceptor signaling through the
mTOR pathway. An increase in SAT2 would lead to downstream signaling through
mTORC1 resulting in increased protein synthesis (Taylor, 2014) and p70S6K is the key
downstream protein in the SAT2/mTOR pathway. Based on the SAT2 mRNA expression
results, p70S6K and phospho-p70S6K protein expression was measured in chickens fed
different Met sources and hypothesized that DL-Met fed chickens would show increased
phospho-p70S6K expression compared to control and DL-HMTBA groups in duodenum.
However, increased phospho-p70S6K expression in control compared to DL-HMTBA
fed chickens in jejunum was observed. The results in jejunum were unexpected, which
may be due to the involvement of other transcriptional regulators in the SAT2-mTOR-
p70S6K pathway, or because the SAT2 effect is age-dependent. The more activated
p70S6K state, which means more protein synthesis in Met deficient group compared to
DL-HMTBA group in jejunum, was also a new finding. We have no further explanation
for this result.
In summary, there was regulation of Met converting enzymes by the dietary
supplemental Met sources. Both mRNA expression and enzymatic activity of the three
Met oxidases were tissue- and development-specific. Different Met sources and Met
deficiency did not alter oxidative status of the treated chickens, but an increase in thiol
redox status such as TGSH or rGSH can reveal the effects of sulfur amino acid diets. The
amino acid sensing and protein synthesis pathway (SAT2/mTOR/p70S6K) in jejunum
was also affected by dietary Met sources. Future studies are needed to further understand

110
how different dietary supplemental Met sources work at the molecular level to benefit
animals.
111
LITERATURE CITED
Backlund, P. S., Jr., C. P. Chang, and R. A. Smith. 1982. Identification of 2-keto-4-
methylthiobutyrate as an intermediate compound in methionine synthesis from 5'-
methylthioadenosine. J Biol Chem 257: 4196-4202.
Brachet, P., and A. Puigserver. 1992. Regional differences for the D-amino acid oxidase-
catalysed oxidation of D-methionine in chicken small intestine. Comp Biochem
Physiol B 101: 509-511.
De Duve, C., and P. Baudhuin. 1966. Peroxisomes (microbodies and related particles).
Physiol Rev 46: 323-357.
Dibner, J. J., and C. D. Knight. 1984. Conversion of 2-hydroxy-4-(methylthio)butanoic
acid to L-methionine in the chick: a stereospecific pathway. J Nutr 114: 1716-1723.
Dupuis, L., C. L. Saunderson, A. Puigserver, and P. Brachet. 1989. Oxidation of
methionine and 2-hydroxy 4-methylthiobutanoic acid stereoisomers in chicken
tissues. Br J Nutr 62: 63-75.
Fang, Z. et al. 2010. Methionine metabolism in piglets fed DL-methionine or its hydroxy
analogue was affected by distribution of enzymes oxidizing these sources to keto-
methionine. J Agric Food Chem 58: 2008-2014.
Ferjancic-Biagini, A., L. Dupuis, J. De Caro, and A. Puigserver. 1998. Inhibitory effects
of anions and active site amino acid sequence of chicken liver L-2-hydroxyacid
oxidase A, a member of the FMN-dependent alpha-hydroxyacid oxidizing enzyme
family. Biochimie 80: 1047-1054.
Gordon, R. S., and I. W. Sizer. 1965. Conversion of methionine hydroxy analogue to
Methionine in the Chick. Poult Sci 44: 673-678.
Kimball, S. R., and L. S. Jefferson. 2006. Signaling pathways and molecular mechanisms
through which branched-chain amino acids mediate translational control of protein
synthesis. J Nutr 136: 227S-231S.
Martin-Venegas, R., M. T. Brufau, Y. Mercier, P. A. Geraert, and R. Ferrer. 2011.
Intestinal cell conversion of DL-2-hydroxy-(4-methylthio)butanoic acid in vitro:
dietary up-regulation by this methionine precursor. Br J Nutr 106: 350-356.
112
Martin-Venegas, R., P. A. Geraert, and R. Ferrer. 2006. Conversion of the methionine
hydroxy analogue DL-2-hydroxy-(4-methylthio) butanoic acid to sulfur-containing
amino acids in the chicken small intestine. Poult Sci 85: 1932-1938.
Martin-Venegas, R., P. A. Geraert, and R. Ferrer. 2008. Partial Na+ dependence of DL-2-
hydroxy-4-(methylthio)butanoic acid uptake in the chicken small intestine. Poult Sci
87: 1392-1394.
Martin-Venegas, R., M. J. Rodriguez-Lagunas, P. A. Geraert, and R. Ferrer. 2007.
Monocarboxylate transporter 1 mediates DL-2-Hydroxy-(4-methylthio)butanoic acid
transport across the apical membrane of Caco-2 cell monolayers. J Nutr 137: 49-54.
Metayer-Coustard, S. et al. 2010. Methionine deprivation regulates the S6K1 pathway
and protein synthesis in avian QM7 myoblasts without activating the GCN2/eIF2
alpha cascade. J Nutr 140: 1539-1545.
Metayer, S. et al. 2008. Mechanisms through which sulfur amino acids control protein
metabolism and oxidative status. J Nutr Biochem 19: 207-215.
Nakashima, K., A. Ishida, M. Yamazaki, and H. Abe. 2005. Leucine suppresses
myofibrillar proteolysis by down-regulating ubiquitin-proteasome pathway in chick
skeletal muscles. Biochem Biophys Res Commun 336: 660-666.
Pinilla, J. et al. 2011. SNAT2 transceptor signalling via mTOR: a role in cell growth and
proliferation? Front Biosci (Elite Ed) 3: 1289-1299.
Rangel-Lugo, M., and R. E. Austic. 1998. Transamination of 2-oxo-4-
[methylthio]butanoic acid in chicken tissues. Poult Sci 77: 98-104.
Shoveller, A. K., B. Stoll, R. O. Ball, and D. G. Burrin. 2005. Nutritional and functional
importance of intestinal sulfur amino acid metabolism. J Nutr 135: 1609-1612.
Soriano-Garcia, J. F., M. Torras-Llort, R. Ferrer, and M. Moreto. 1998. Multiple
pathways for L-methionine transport in brush-border membrane vesicles from
chicken jejunum. J Physiol 509 ( Pt 2): 527-539.
Swennen, Q. et al. 2011. Effects of dietary protein content and 2-hydroxy-4-
methylthiobutanoic acid or DL-methionine supplementation on performance and
oxidative status of broiler chickens. Br J Nutr 106: 1845-1854.
Taylor, P. M. 2014. Role of amino acid transporters in amino acid sensing. Am J Clin
Nutr 99: 223S-230S.

113
Wang, F. et al. 2012. RNAscope: a novel in situ RNA analysis platform for formalin-
fixed, paraffin-embedded tissues. J Mol Diagn 14: 22-29.
Willemsen, H. et al. 2011. Effects of dietary supplementation of methionine and its
hydroxy analog DL-2-hydroxy-4-methylthiobutanoic acid on growth performance,
plasma hormone levels, and the redox status of broiler chickens exposed to high
temperatures. Poult Sci 90: 2311-2320.
Xie, J. et al. 2015. Effects of acute and chronic heat stress on plasma metabolites,
hormones and oxidant status in restrictedly fed broiler breeders. Poult Sci 94: 1635-
1644.
Yang, G. L. et al. 2016. Effects of dietary DL-2-hydroxy-4(methylthio)butanoic acid
supplementation on growth performance, indices of ascites syndrome, and
antioxidant capacity of broilers reared at low ambient temperature. Int J Biometeorol.
Yoshizawa, F. 2004. Regulation of protein synthesis by branched-chain amino acids in
vivo. Biochem Biophys Res Commun 313: 417-422.
Zhang, L. B., and Y. M. Guo. 2008. Effects of liquid DL-2-hydroxy-4-methylthio
butanoic acid on growth performance and immune responses in broiler chickens.
Poult Sci 87: 1370-1376.

114
Table 4.1 Primers used for quantitative real time PCR for Met converting enzyme genes
and reference genes.
Gene GenBank ID Description/gene function Primer Sequence (5' → 3'),
sense/antisense
bp1
Mean
Cq
value2
Effici
ency
DAO3 XM_015284572.1 D-aspartate oxidase
(D-AAOX)
CCAACACGACAAGCGATGTG/
GGTGTGCCTGGGTAGGTATG 61 29.7 93.5
HAO1 NM_001199442.2
L-2-hydroxy acid oxidase
(L-HAOX) (hydroxyacid
oxidase 1 or glycolate
oxidase 1)
GTGACTGTGGACACGCCATT/
GGAACTTGTTGCGCACATCA 58 28.9 112.7
LDHD XM_015279229.1
D-2-hydroxy acid
dehydrogenase (D-HADH)
(lactate dehydrogenase D)
CACGTGGGCGATGGTAACT/
GTCGTCAGCGCGGAAGA 51 28.1 108.3
AGXT XM_003641735.2 Alanine-glyoxylate
aminotransferase
GATGCTGAGGAGGAAGACGAA/
TTGCCAGACAGCCCATGTC 59 30.3 112.4
BCAT1 XM_004937974.1 Branched chain amino acid
transaminase
GGGCAAGCATTTGCACATT/
TCAGGATTTGGGTGGTTAACTGA 62 26.4 114.5
GOT2 NM_205523.1 Glutamic-oxaloacetic
transaminase 2
GGGAGCATACCGGGATGAC/
GCCTTGCGAACGCAGTTC 57 28.5 91.0
OAT NM_001006567.1 Ornithine aminotransferase TGCGTGATAATGGGCTCCTT/
GGGCCAGCCGGATGA 57 24.4 115.0
PRL4 NM_001007479.1 Ribosomal protein L4 TCAAGGCGCCCATTCG/
TGCGCAGGTTGGTGTGAA 54 23.0 112.0
PRLP0 NM_204987.1 Ribosomal protein, large,
P0
GCGATTGCTCCCTGTGATG/
TCTCAGGTCCGAGACCAGTGT 58 20.6 111.9
PRLP1 NM_205322.1 Ribosomal protein, large,
P1
TCTCCACGACGACGAAGTCA/
CCGCCGCCTTGATGAG 62 20.6 97.3
1 Amplicon size. 2 Cq = quantification cycle. 3 The D-aspartate oxidase has a symbol DDO in GenBank.
For the D-amino acid oxidase (DAO) in chicken (Gallus gallus) (GenBank ID: NC_006102.2), the record
was removed from NCBI for unknown reasons, and D-aspartate oxidase is recorded to encode D-Met
oxidase in chicken instead. Thus we kept the symbol DAO here to represent D-aspartate oxidase gene. See
Appendix C for the relative gene expression of the original DAO gene.
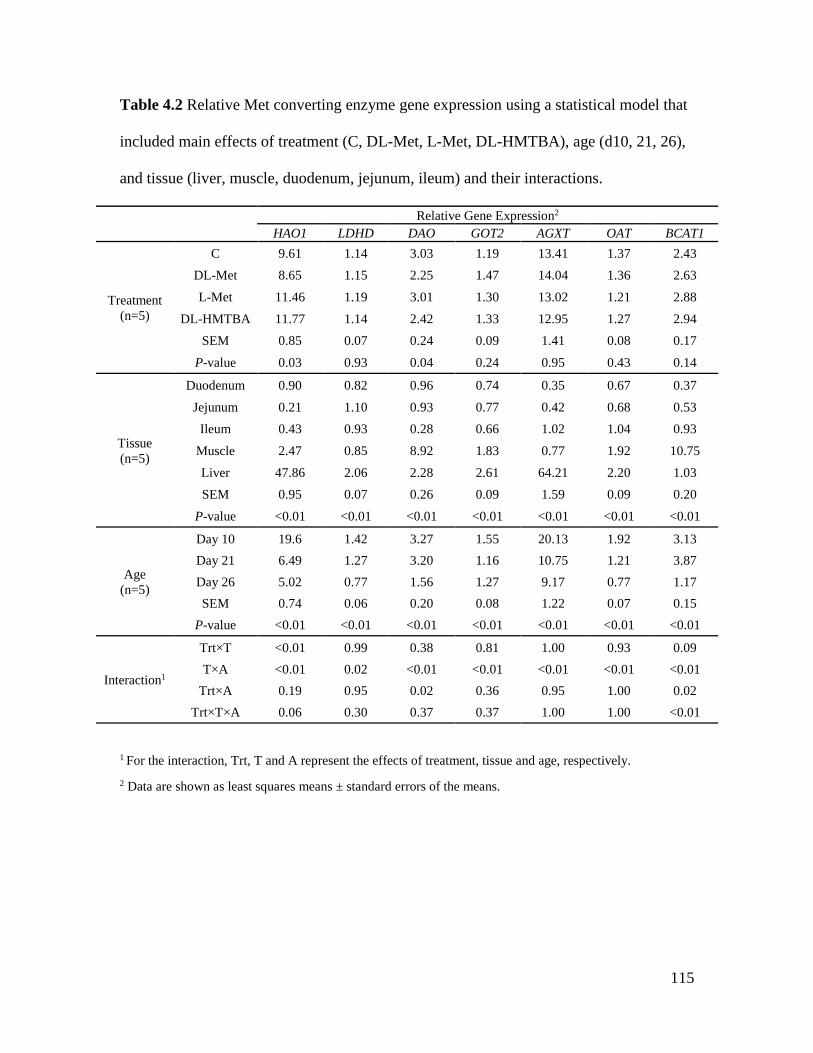
115
Table 4.2 Relative Met converting enzyme gene expression using a statistical model that
included main effects of treatment (C, DL-Met, L-Met, DL-HMTBA), age (d10, 21, 26),
and tissue (liver, muscle, duodenum, jejunum, ileum) and their interactions.
Relative Gene Expression2
HAO1 LDHD DAO GOT2 AGXT OAT BCAT1
Treatment
(n=5)
C 9.61 1.14 3.03 1.19 13.41 1.37 2.43
DL-Met 8.65 1.15 2.25 1.47 14.04 1.36 2.63
L-Met 11.46 1.19 3.01 1.30 13.02 1.21 2.88
DL-HMTBA 11.77 1.14 2.42 1.33 12.95 1.27 2.94
SEM 0.85 0.07 0.24 0.09 1.41 0.08 0.17
P-value 0.03 0.93 0.04 0.24 0.95 0.43 0.14
Tissue
(n=5)
Duodenum 0.90 0.82 0.96 0.74 0.35 0.67 0.37
Jejunum 0.21 1.10 0.93 0.77 0.42 0.68 0.53
Ileum 0.43 0.93 0.28 0.66 1.02 1.04 0.93
Muscle 2.47 0.85 8.92 1.83 0.77 1.92 10.75
Liver 47.86 2.06 2.28 2.61 64.21 2.20 1.03
SEM 0.95 0.07 0.26 0.09 1.59 0.09 0.20
P-value <0.01 <0.01 <0.01 <0.01 <0.01 <0.01 <0.01
Age
(n=5)
Day 10 19.6 1.42 3.27 1.55 20.13 1.92 3.13
Day 21 6.49 1.27 3.20 1.16 10.75 1.21 3.87
Day 26 5.02 0.77 1.56 1.27 9.17 0.77 1.17
SEM 0.74 0.06 0.20 0.08 1.22 0.07 0.15
P-value <0.01 <0.01 <0.01 <0.01 <0.01 <0.01 <0.01
Interaction1
Trt×T <0.01 0.99 0.38 0.81 1.00 0.93 0.09
T×A <0.01 0.02 <0.01 <0.01 <0.01 <0.01 <0.01
Trt×A 0.19 0.95 0.02 0.36 0.95 1.00 0.02
Trt×T×A 0.06 0.30 0.37 0.37 1.00 1.00 <0.01
1 For the interaction, Trt, T and A represent the effects of treatment, tissue and age, respectively.
2 Data are shown as least squares means ± standard errors of the means.

116
Table 4.3 Contrasts for significant treatment × age interaction effects for AGXT, BCAT1 and GOT2 expression analyzed within
different tissues. Male broiler chickens were fed different methionine sources until post-hatch day 35.
Treatment1 Significant P-values for Contrasts4
C DL-Met L-Met DL-
HMTBA SEM2 P-value3
DL-Met
vs. L-Met
DL-Met vs.
DL-HMTBA
L-Met vs.
DL-HMTBA
C vs.
DL-Met
C vs. L-
Met
C vs. DL-
HMTBA
Muscle, AGXT5 0.15 0.001
Day 10 2.15 2.45 1.41 0.36 0.006 <0.001 0.006 0.047 <0.001
Day 21 0.74 0.42 0.16 0.41
Day 26 0.38 0.14 0.29 0.32
Muscle, BCAT1 0.87 0.044
Day 10 9.15 12.67 10.08 15.32 0.017 0.006
Day 21 15.08 14.36 20.37 17.01 0.010 0.023
Day 26 3.74 4.08 4.07 3.10
Jejunum, GOT2 0.08 0.031
Day 10 0.89 1.37 0.81 0.67 0.011 0.002 0.029
Day 21 0.72 0.63 0.87 0.84
Day 26 0.55 0.46 0.67 0.73
1 Data presented are least squares means and standard errors of the mean. The statistical model included main effect of treatment (C, DL-Met, L-Met, DL-
HMTBA), main effect of age (d10, 21, 26) and their interactions. C: 0.78% Met+Cys for starter diet, 0.70% Met+Cys for grower diet and 0.62% Met+Cys for
finisher diet; DL-Met: basal diet supplemented with 0.22% DL-methionine; L-Met: basal diet supplemented with 0.22% L-methionine; DL-HMTBA: basal diet
supplemented with 0.31% DL-2-hydroxy-4-methylthio butanoic acid. 2,3 These values are pooled SEM of the mean and the P-value for the interaction,
respectively. 4 All contrasts were tested but for brevity only significant differences are displayed. 5 AGXT: alanine-glyoxylate aminotransferase; BCAT1:
branched chain amino acid transaminase; GOT2: glutamic-oxaloacetic transaminase 2.

117
Table 4.4 Contrasts for significant treatment × tissue interaction effects for HAO1, BCAT1 and DAO expression analyzed within each
age (d10, 21 and 26). Male broiler chickens were fed a diet with or without methionine supplementation until post-hatch day 35.
Treatment1 Significant P-values for Contrasts4
C DL-Met L-Met DL-
HMTBA SEM2 P-value3
DL-Met vs.
L-Met
DL-Met vs.
DL-HMTBA
L-Met vs.
DL-HMTBA
C vs. DL-
Met
C vs. L-
Met
C vs. DL-
HMTBA
Day 10, HAO15 1.85 0.001
Liver 80.43 75.15 106.13 109.12 <0.001 <0.001 <0.001 <0.001
Breast muscle 3.11 2.97 2.30 1.28
Duodenum 2.02 2.27 2.31 2.77
Jejunum 0.18 0.29 0.15 0.25
Ileum 0.42 0.37 0.25 0.51
Day 10, BCAT1 1.36 0.045
Liver 2.01 1.76 1.80 2.16
Breast muscle 9.15 12.67 10.08 15.32 0.037 0.033 <0.001 0.005 <0.001
Duodenum 0.42 0.38 0.45 0.33
Jejunum 0.63 0.71 0.63 0.81
Ileum 0.72 0.83 0.86 0.95
Day 21, BCAT1 0.33 0.020
Liver 0.50 0.63 0.61 0.62
Breast muscle 15.08 14.36 20.37 17.00 <0.001 0.016 0.004 <0.001
Duodenum 0.57 0.37 0.38 0.42
Jejunum 0.49 0.50 0.62 0.44
Ileum 1.06 1.29 1.01 1.03
Day 26, DAO 0.51 0.002
Liver 3.82 1.01 2.33 1.14 <0.001 0.043 <0.001
Breast muscle 7.10 3.39 3.90 2.24 0.024 <0.001 <0.001 <0.001
Duodenum 0.86 0.61 0.70 0.50
Jejunum 1.37 0.62 0.74 0.47
Ileum 0.13 0.11 0.08 0.07

118
1 Data presented are least squares means and standard errors of the mean. The statistical model included main effect of treatment (C, DL-Met, L-Met, DL-
HMTBA), main effect of age (d10, 21, 26) and their interactions. C: 0.78% Met+Cys for starter diet, 0.70% Met+Cys for grower diet and 0.62% Met+Cys for
finisher diet; DL-Met: basal diet supplemented with 0.22% DL-methionine; L-Met: basal diet supplemented with 0.22% L-methionine; DL-HMTBA: basal diet
supplemented with 0.31% DL-2-hydroxy-4-methylthio butanoic acid. 2,3 These values are pooled SEM of the mean and the P-value for the interaction,
respectively. 4 All contrasts were tested but for brevity only significant differences are displayed. 5 HAO1: L-2-hydroxy acid oxidase; BCAT1: branched chain
amino acid transaminase. DAO: D-aspartate oxidase.

119
Table 4.5 Methionine oxidase activity analyzed within each tissue (duodenum, jejunum, ileum, liver and breast muscle). Male broiler
chickens were fed a diet with or without methionine supplementation until post-hatch day 26.
Items
Enzyme activity 1, 2, 3
D-amino acid oxidase (D-AAOX) L-2-hydroxy acid oxidase (L-HAOX) D-2-hydroxy acid dehydrogenase (D-HADH)
Duodenum Jejunum Ileum Liver Muscle Duodenum Jejunum Ileum Liver Muscle Duodenum Jejunum Ileum Liver Muscle
Treatment
(n=5)
C 33.8 13.5 16.0 49.5 30.1 45.3 ND 28.8 49.1 43.7 6.5 19.1 18.1 10.6 14.7
DL-Met 34.0 14.5 20.2 22.1 33.6 45.3 43.8 20.6 35.1 42.9 14.0 19.5 16.4 6.6 6.7
L-Met 29.2 8.7 20.7 42.5 32.8 29.6 33.4 28.4 56.2 29.9 7.4 18.2 13.3 6.8 11.4
DL-HMTBA 27.3 12.7 20.8 22.8 32.4 37.2 31.2 12.6 52.6 33.8 12.6 16.6 16.3 4.8 8.6
SEM 5.1 2.9 5.1 9.2 5.5 4.9 - 5.5 12.9 5.2 3.5 2.9 3.2 2.8 2.8
P-value 0.74 0.55 0.88 0.09 0.97 0.09 - 0.12 0.68 0.20 0.32 0.89 0.77 0.47 0.22
Age
(n=5)
day 10 21.3b 14.6a 23.3a 25.4 30.5 21.0b ND 18.2 49.5 64.7a 5.5 29.1a 18.8 11.5 11.1
day 21 39.1a 14.5ab 26.4a 31.2 35.1 47.6a 34.7 19.6 43.0 24.6b 14.1 16.8b 14.9 3.6 11.4
day 26 32.9ab 7.9b 8.6b 46.1 31.0 49.4a 45.6 30.0 52.3 23.4b 10.8 9.2b 14.3 7.1 8.5
SEM 4.4 2.4 4.3 8.0 4.8 4.2 - 4.7 11.2 4.5 3.0 2.5 2.8 2.4 2.3
P-value 0.03 0.04 0.02 0.18 0.76 <0.001 - 0.23 0.84 <0.001 0.13 <0.001 0.50 0.09 0.66
Interaction
(n=5)
Treatment
×Age 0.85 0.44 0.94 0.33 0.35 0.89 - 0.38 0.42 0.96 0.16 0.86 0.30 0.59 0.92
1 Values represent enzyme activity normalized to per milligram of protein (µg/mg protein). 2 Data presented are least squares means and standard errors of the
mean. The statistical model included main effect of treatment (C, DL-Met, L-Met, DL-HMTBA), main effect of age (d10, 21, 26) and their interactions. C:
0.78% Met+Cys for starter diet, 0.70% Met+Cys for grower diet and 0.62% Met+Cys for finisher diet; DL-Met: basal diet supplemented with 0.22% DL-
methionine; L-Met: basal diet supplemented with 0.22% L-methionine; DL-HMTBA: basal diet supplemented with 0.31% DL-2-hydroxy-4-methylthio butanoic
acid. Means in a column without a common letter differ, P < 0.05. 3 ND: not detectable.

120
Table 4.6 Methionine oxidase activity analyzed within each age (day 10, 21 and 26). Male broiler chickens were fed a diet with or
without methionine supplementation until post-hatch day 26.
Enzyme activity 1, 2, 3
D-amino acid oxidase (D-AAOX) L-2-hydroxy acid oxidase (L-HAOX) D-2-hydroxy acid dehydrogenase (D-HADH)
day 10 day 21 day 26 day 10 day 21 day 26 day 10 day 21 day 26
Treatment
(n=5)
C 23.2 30.8 31.8 ND 37.1 47.6a 17.5 15.7 8.4
DL-Met 29.4 25.1 20.2 39.8 31.5 41.3ab 15.0 11.3 11.7
L-Met 19.1 30.8 30.4 34.5 29.4 42.6ab 13.0 10.2 11.0
DL-HMTBA 20.4 30.3 18.9 33.7 37.6 29.1b 15.0 11.4 8.9
SEM 4.7 4.5 5.9 - 7.0 4.7 2.6 2.2 2.3
P-value 0.39 0.77 0.29 - 0.80 0.04 0.69 0.31 0.67
Tissue
(n=5)
Duodenum 21.3 39.1a 32.9ab 21.0 47.6 49.4a 5.51c 14.1a 10.8
Jejunum 14.6 14.5b 7.9b ND 34.7 45.6a 29.1a 16.8a 9.2
Ileum 23.3 26.4ab 8.6bc 18.2 19.5 30.0ab 18.8ab 14.9a 14.3
Liver 25.4 31.2ab 46.1a 49.5 43.0 52.3a 11.0bc 3.6b 7.1
Muscle 30.5 35.1a 31.0abc 64.7 24.6 23.4b 11.1bc 11.4ab 8.5
SEM 5.1 5.0 6.6 - 7.7 5.1 2.9 2.4 2.5
P-value 0.37 <0.01 <0.01 - 0.07 <0.01 <0.01 <0.01 0.31
Interaction
(n=5)
Treatment
×Tissue 0.88 0.97 0.14 - 0.30 0.49 0.87 0.45 0.67
1 Values represent enzyme activity normalized to per milligram of protein (µg/mg protein). 2 Data presented are least squares means and standard errors of the
mean. The statistical model included main effect of treatment (C, DL-Met, L-Met, DL-HMTBA), main effect of tissue (duodenum, jejunum, ileum, liver, breast
muscle) and their interactions. C: 0.78% Met+Cys for starter diet, 0.70% Met+Cys for grower diet and 0.62% Met+Cys for finisher diet; DL-Met: basal diet
supplemented with 0.22% DL-methionine; L-Met: basal diet supplemented with 0.22% L-methionine; DL-HMTBA: basal diet supplemented with 0.31% DL-2-
hydroxy-4-methylthio butanoic acid. Means in a column without a common letter differ, P < 0.05. 3 ND: not detectable.

121
Table 4.7 Glutathione profile in liver, breast muscle and three small intestinal segments
from chickens fed a diet with or without methionine supplementation at post-hatch days
10 and 26. (A) The glutathione profile includes total glutathione (TGSH), (B) oxidized
glutathione (GSSG), (C) reduced glutathione (rGSH), (D) ratio of rGSH to GSSG and
(E) ratio of rGSH to TGSH.
(A)
Items Total glutathione (TGSH) (nmol/g tissue)1
Duodenum Jejunum Ileum Liver Breast muscle
Treatment
(n=5)
C 30.23 77.49 128.47 413.83 155.62c
DL-Met 29.14 91.23 132.83 530.29 186.43bc
L-Met 30.63 89.42 153.79 503.02 276.79a
DL-HMTBA 28.95 82.74 138.58 445.54 235.36ab
SEM 2.98 8.75 11.16 45.04 18.98
P-value 0.97 0.67 0.40 0.26 <0.01
Age
(n=5)
Day 10 39.59a 92.59 141.54 501.98 203.14
Day 26 19.89b 77.85 135.29 444.36 223.95
SEM 2.10 6.19 7.89 31.86 13.42
P-value <0.01 0.10 0.58 0.21 0.28
Interaction
(n=5) Treatment ×Age 0.20 0.01 0.01 0.07 0.38
1 Data presented are least squares means and standard errors of the mean. The statistical model included
main effect of treatment (C, DL-Met, L-Met, DL-HMTBA), main effect of age (d10, 26) and their
interactions. C: 0.78% Met+Cys for starter diet, 0.70% Met+Cys for grower diet and 0.62% Met+Cys for
finisher diet; DL-Met: basal diet supplemented with 0.22% DL-methionine; L-Met: basal diet
supplemented with 0.22% L-methionine; DL-HMTBA: basal diet supplemented with 0.31% DL-2-
hydroxy-4-methylthio butanoic acid. Means in a column without a common letter differ, P < 0.05.
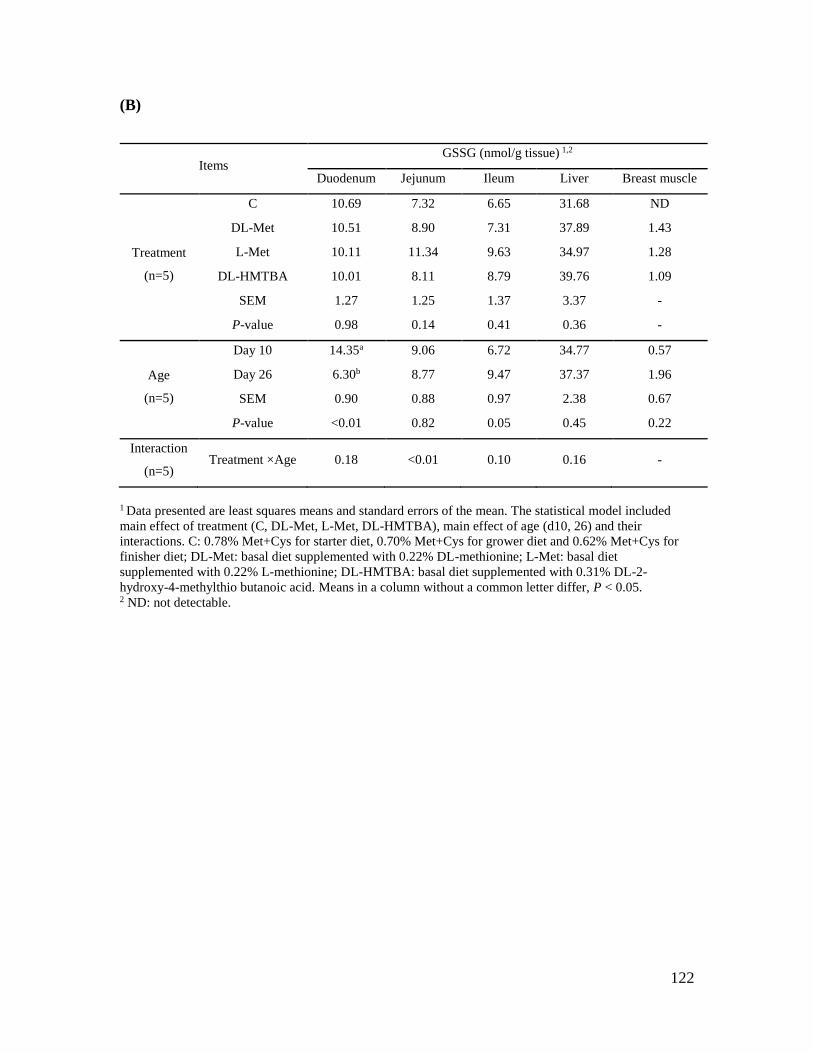
122
(B)
Items GSSG (nmol/g tissue) 1,2
Duodenum Jejunum Ileum Liver Breast muscle
Treatment
(n=5)
C 10.69 7.32 6.65 31.68 ND
DL-Met 10.51 8.90 7.31 37.89 1.43
L-Met 10.11 11.34 9.63 34.97 1.28
DL-HMTBA 10.01 8.11 8.79 39.76 1.09
SEM 1.27 1.25 1.37 3.37 -
P-value 0.98 0.14 0.41 0.36 -
Age
(n=5)
Day 10 14.35a 9.06 6.72 34.77 0.57
Day 26 6.30b 8.77 9.47 37.37 1.96
SEM 0.90 0.88 0.97 2.38 0.67
P-value <0.01 0.82 0.05 0.45 0.22
Interaction
(n=5) Treatment ×Age 0.18 <0.01 0.10 0.16 -
1 Data presented are least squares means and standard errors of the mean. The statistical model included
main effect of treatment (C, DL-Met, L-Met, DL-HMTBA), main effect of age (d10, 26) and their
interactions. C: 0.78% Met+Cys for starter diet, 0.70% Met+Cys for grower diet and 0.62% Met+Cys for
finisher diet; DL-Met: basal diet supplemented with 0.22% DL-methionine; L-Met: basal diet
supplemented with 0.22% L-methionine; DL-HMTBA: basal diet supplemented with 0.31% DL-2-
hydroxy-4-methylthio butanoic acid. Means in a column without a common letter differ, P < 0.05. 2 ND: not detectable.

123
(C)
Items Reduced GSH (rGSH) (nmol/g tissue) 1
Duodenum Jejunum Ileum Liver Breast muscle
Treatment
(n=5)
C 8.86 62.85 115.16 350.47 155.62c
DL-Met 7.59 73.44 118.21 454.51 185.86bc
L-Met 9.01 66.73 134.54 433.09 275.99a
DL-HMTBA 8.93 66.52 121.67 367.02 234.92ab
SEM 2.01 7.62 10.14 44.34 18.96
P-value 0.95 0.80 0.54 0.29 <0.01
Age
(n=5)
Day 10 10.17 74.47 128.10 432.92 202.90
Day 26 7.02 60.30 116.69 269.62 231.87
SEM 1.42 5.39 7.17 31.36 14.34
P-value 0.13 0.072 0.27 0.16 0.16
Interaction
(n=5) Treatment ×Age 0.60 0.07 0.02 0.12 0.31
1 Data presented are least squares means and standard errors of the mean. The statistical model included
main effect of treatment (C, DL-Met, L-Met, DL-HMTBA), main effect of age (d10, 26) and their
interactions. C: 0.78% Met+Cys for starter diet, 0.70% Met+Cys for grower diet and 0.62% Met+Cys for
finisher diet; DL-Met: basal diet supplemented with 0.22% DL-methionine; L-Met: basal diet
supplemented with 0.22% L-methionine; DL-HMTBA: basal diet supplemented with 0.31% DL-2-
hydroxy-4-methylthio butanoic acid. Means in a column without a common letter differ, P < 0.05.
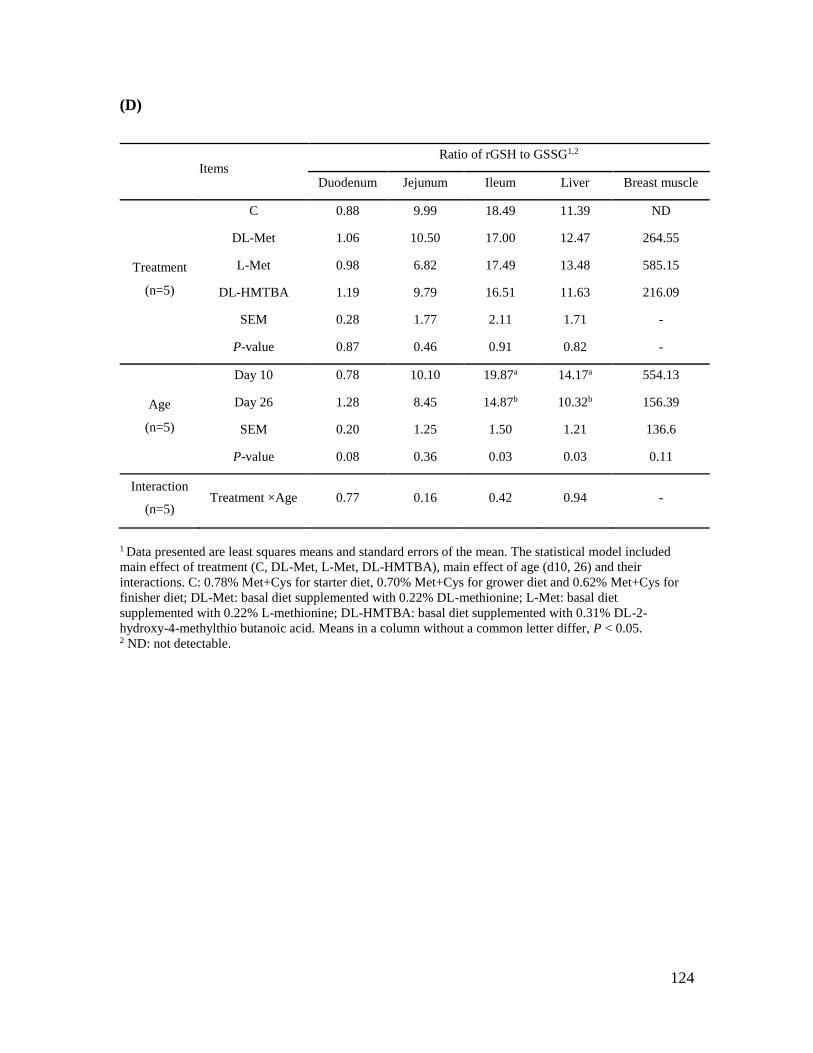
124
(D)
Items Ratio of rGSH to GSSG1,2
Duodenum Jejunum Ileum Liver Breast muscle
Treatment
(n=5)
C 0.88 9.99 18.49 11.39 ND
DL-Met 1.06 10.50 17.00 12.47 264.55
L-Met 0.98 6.82 17.49 13.48 585.15
DL-HMTBA 1.19 9.79 16.51 11.63 216.09
SEM 0.28 1.77 2.11 1.71 -
P-value 0.87 0.46 0.91 0.82 -
Age
(n=5)
Day 10 0.78 10.10 19.87a 14.17a 554.13
Day 26 1.28 8.45 14.87b 10.32b 156.39
SEM 0.20 1.25 1.50 1.21 136.6
P-value 0.08 0.36 0.03 0.03 0.11
Interaction
(n=5) Treatment ×Age 0.77 0.16 0.42 0.94 -
1 Data presented are least squares means and standard errors of the mean. The statistical model included
main effect of treatment (C, DL-Met, L-Met, DL-HMTBA), main effect of age (d10, 26) and their
interactions. C: 0.78% Met+Cys for starter diet, 0.70% Met+Cys for grower diet and 0.62% Met+Cys for
finisher diet; DL-Met: basal diet supplemented with 0.22% DL-methionine; L-Met: basal diet
supplemented with 0.22% L-methionine; DL-HMTBA: basal diet supplemented with 0.31% DL-2-
hydroxy-4-methylthio butanoic acid. Means in a column without a common letter differ, P < 0.05. 2 ND: not detectable.

125
(E)
Items Ratio of rGSH to TGSH1
Duodenum Jejunum Ileum Liver Breast muscle
Treatment
(n=5)
C 0.28 0.79 0.90 0.83 1.000
DL-Met 0.25 0.81 0.90 0.85 0.996
L-Met 0.34 0.75 0.88 0.85 0.996
DL-HMTBA 0.32 0.79 0.88 0.82 0.998
SEM 0.06 0.02 0.02 0.02 0.002
P-value 0.68 0.42 0.85 0.68 0.47
Age
(n=5)
Day 10 0.27 0.80 0.91 0.86 0.999
Day 26 0.32 0.77 0.87 0.82 0.996
SEM 0.04 0.02 0.01 0.02 0.001
P-value 0.41 0.31 0.08 0.10 0.15
Interaction
(n=5) Treatment ×Age 0.84 0.21 0.50 0.93 0.65
1 Data presented are least squares means and standard errors of the mean. The statistical model included
main effect of treatment (C, DL-Met, L-Met, DL-HMTBA), main effect of age (d10, 26) and their
interactions. C: 0.78% Met+Cys for starter diet, 0.70% Met+Cys for grower diet and 0.62% Met+Cys for
finisher diet; DL-Met: basal diet supplemented with 0.22% DL-methionine; L-Met: basal diet
supplemented with 0.22% L-methionine; DL-HMTBA: basal diet supplemented with 0.31% DL-2-
hydroxy-4-methylthio butanoic acid. Means in a column without a common letter differ, P < 0.05.

126
Table 4.8 Protein carbonyl level in liver, breast muscle and three small intestinal
segments from chickens fed a diet with or without methionine supplementation at post-
hatch days 10 and 26.
Items Protein carbonyl (nmol/g tissue) 1
Duodenum Jejunum Ileum Liver Breast muscle
Treatment
(n=5)
C 8.42 6.45ab
6.63 16.70 5.37
DL-Met 7.69 8.04a
6.06 19.54 7.55
L-Met 8.38 6.95ab
5.54 19.53 9.35
DL-HMTBA 8.29 5.79b
7.88 19.59 4.53
SEM 1.37 0.56 0.75 1.78 0.74
P-value 0.98 0.05 0.17 0.62 <0.01
Age
(n=5)
Day 10 8.41 5.40b
5.73b
16.21b
5.14
Day 26 7.98 8.61a
7.32a
21.47a
8.25
SEM 0.97 0.48 0.53 1.27 0.53
P-value 0.75 <0.01 0.04 <0.01 <0.01
Interaction
(n=5) Treatment ×Age 0.89 0.23 0.90 0.98 0.01
1 Data presented are least squares means and standard errors of the mean. The statistical model included
main effect of treatment (C, DL-Met, L-Met, DL-HMTBA), main effect of age (d10, 26) and their
interactions. C: 0.78% Met+Cys for starter diet, 0.70% Met+Cys for grower diet and 0.62% Met+Cys for
finisher diet; DL-Met: basal diet supplemented with 0.22% DL-methionine; L-Met: basal diet
supplemented with 0.22% L-methionine; DL-HMTBA: basal diet supplemented with 0.31% DL-2-
hydroxy-4-methylthio butanoic acid. Means in a column without a common letter differ, P < 0.05.
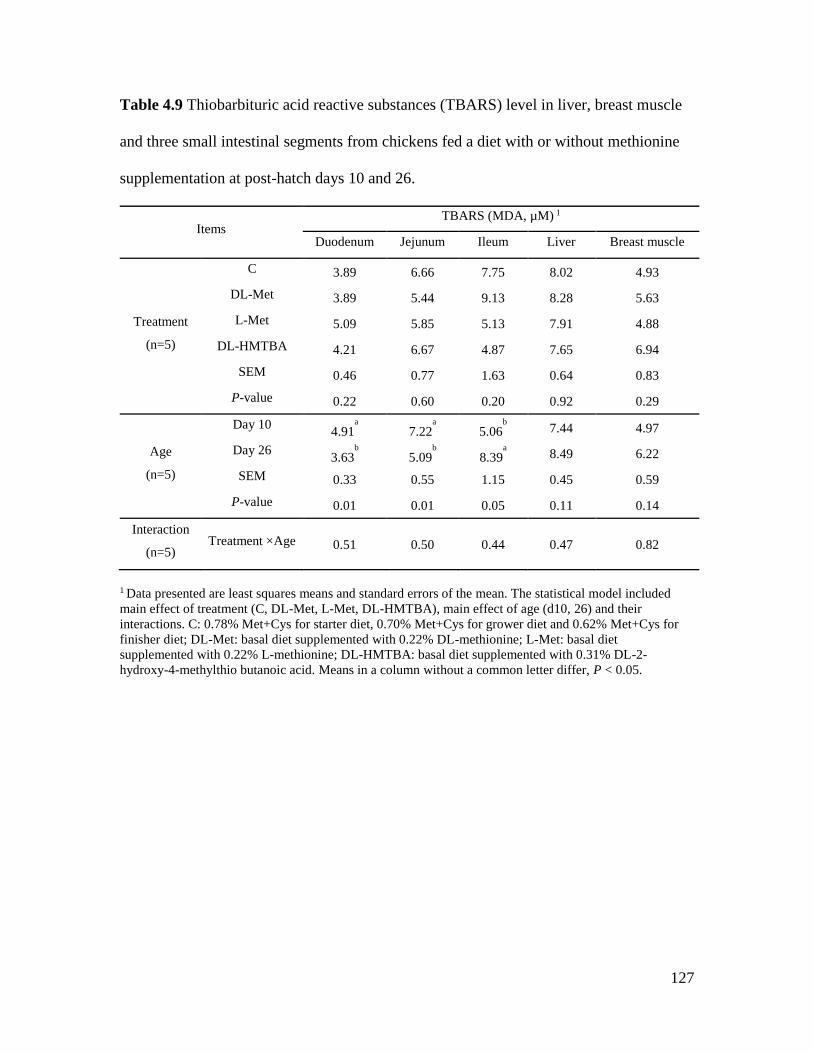
127
Table 4.9 Thiobarbituric acid reactive substances (TBARS) level in liver, breast muscle
and three small intestinal segments from chickens fed a diet with or without methionine
supplementation at post-hatch days 10 and 26.
Items TBARS (MDA, µM) 1
Duodenum Jejunum Ileum Liver Breast muscle
Treatment
(n=5)
C 3.89 6.66 7.75 8.02 4.93
DL-Met 3.89 5.44 9.13 8.28 5.63
L-Met 5.09 5.85 5.13 7.91 4.88
DL-HMTBA 4.21 6.67 4.87 7.65 6.94
SEM 0.46 0.77 1.63 0.64 0.83
P-value 0.22 0.60 0.20 0.92 0.29
Age
(n=5)
Day 10 4.91
a
7.22a
5.06b
7.44 4.97
Day 26 3.63
b
5.09b
8.39a
8.49 6.22
SEM 0.33 0.55 1.15 0.45 0.59
P-value 0.01 0.01 0.05 0.11 0.14
Interaction
(n=5) Treatment ×Age 0.51 0.50 0.44 0.47 0.82
1 Data presented are least squares means and standard errors of the mean. The statistical model included
main effect of treatment (C, DL-Met, L-Met, DL-HMTBA), main effect of age (d10, 26) and their
interactions. C: 0.78% Met+Cys for starter diet, 0.70% Met+Cys for grower diet and 0.62% Met+Cys for
finisher diet; DL-Met: basal diet supplemented with 0.22% DL-methionine; L-Met: basal diet
supplemented with 0.22% L-methionine; DL-HMTBA: basal diet supplemented with 0.31% DL-2-
hydroxy-4-methylthio butanoic acid. Means in a column without a common letter differ, P < 0.05.

128
Table 4.10 Ferric reducing/antioxidant power (FRAP) level in liver, breast muscle and
three small intestinal segments from chickens fed a diet with or without methionine
supplementation at post-hatch days 10 and 26.
Items
FRAP (FeCl2, µM) 1
Duodenum Jejunum Ileum Liver Breast muscle
Treatment
(n=5)
C 709.3 492.0 391.6 1707.3 1565.6
DL-Met 665.5 489.4 406.4 1860.9 901.1
L-Met 779.1 439.6 370.9 1726.9 1127.0
DL-HMTBA 650.4 432.3 412.0 1914.5 1226.6
SEM 65.1 42.7 25.4 128.2 174.1
P-value 0.53 0.65 0.67 0.61 0.08
Age
(n=5)
Day 10 564.8
b
371.2b
335.0b
2080.4a
1238.0
Day 26 837.4
a
555.4a
455.5a
1524.4b
1172.1
SEM 46.0 30.22 18.0 90.6 123.1
P-value <0.01 <0.01 <0.01 <0.01 0.71
Interaction
(n=5) Treatment ×Age 0.36 0.90 0.25 0.95 0.64
1 Data presented are least squares means and standard errors of the mean. The statistical model included
main effect of treatment (C, DL-Met, L-Met, DL-HMTBA), main effect of age (d10, 26) and their
interactions. C: 0.78% Met+Cys for starter diet, 0.70% Met+Cys for grower diet and 0.62% Met+Cys for
finisher diet; DL-Met: basal diet supplemented with 0.22% DL-methionine; L-Met: basal diet
supplemented with 0.22% L-methionine; DL-HMTBA: basal diet supplemented with 0.31% DL-2-
hydroxy-4-methylthio butanoic acid. Means in a column without a common letter differ, P < 0.05.
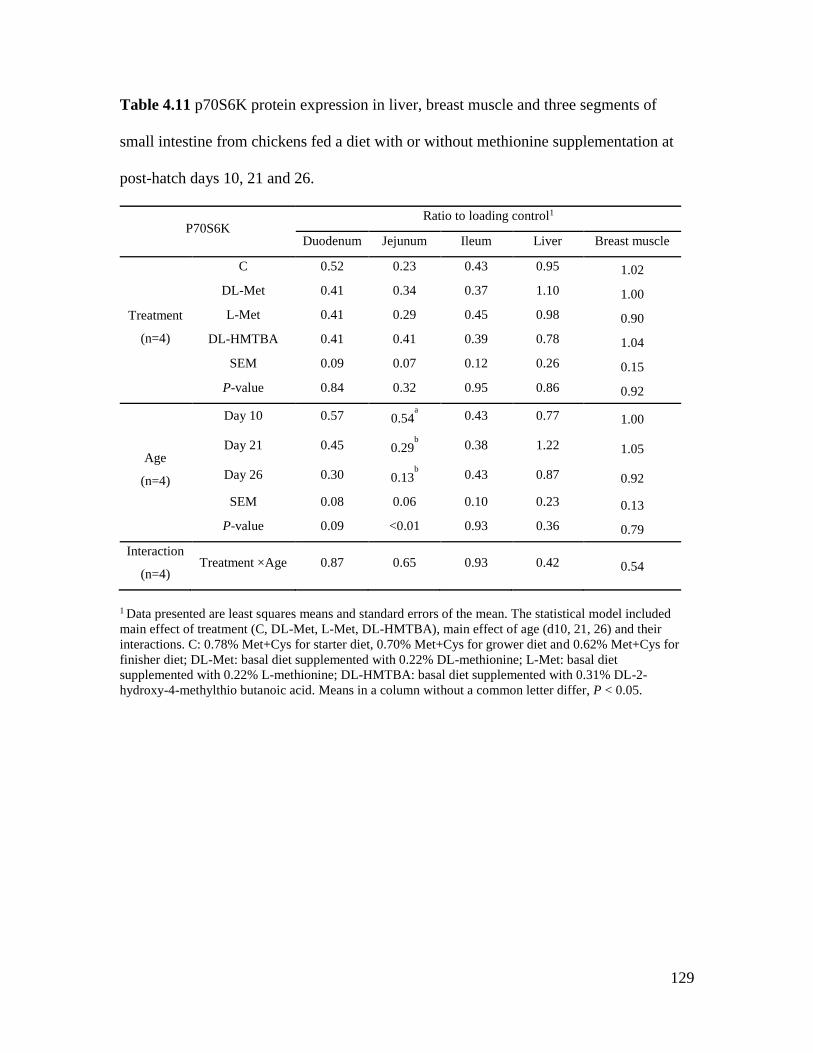
129
Table 4.11 p70S6K protein expression in liver, breast muscle and three segments of
small intestine from chickens fed a diet with or without methionine supplementation at
post-hatch days 10, 21 and 26.
P70S6K Ratio to loading control1
Duodenum Jejunum Ileum Liver Breast muscle
Treatment
(n=4)
C 0.52 0.23 0.43 0.95 1.02
DL-Met 0.41 0.34 0.37 1.10 1.00
L-Met 0.41 0.29 0.45 0.98 0.90
DL-HMTBA 0.41 0.41 0.39 0.78 1.04
SEM 0.09 0.07 0.12 0.26 0.15
P-value 0.84 0.32 0.95 0.86 0.92
Age
(n=4)
Day 10 0.57 0.54a
0.43 0.77 1.00
Day 21 0.45 0.29b
0.38 1.22 1.05
Day 26 0.30 0.13b
0.43 0.87 0.92
SEM 0.08 0.06 0.10 0.23 0.13
P-value 0.09 <0.01 0.93 0.36 0.79
Interaction
(n=4) Treatment ×Age 0.87 0.65 0.93 0.42 0.54
1 Data presented are least squares means and standard errors of the mean. The statistical model included
main effect of treatment (C, DL-Met, L-Met, DL-HMTBA), main effect of age (d10, 21, 26) and their
interactions. C: 0.78% Met+Cys for starter diet, 0.70% Met+Cys for grower diet and 0.62% Met+Cys for
finisher diet; DL-Met: basal diet supplemented with 0.22% DL-methionine; L-Met: basal diet
supplemented with 0.22% L-methionine; DL-HMTBA: basal diet supplemented with 0.31% DL-2-
hydroxy-4-methylthio butanoic acid. Means in a column without a common letter differ, P < 0.05.
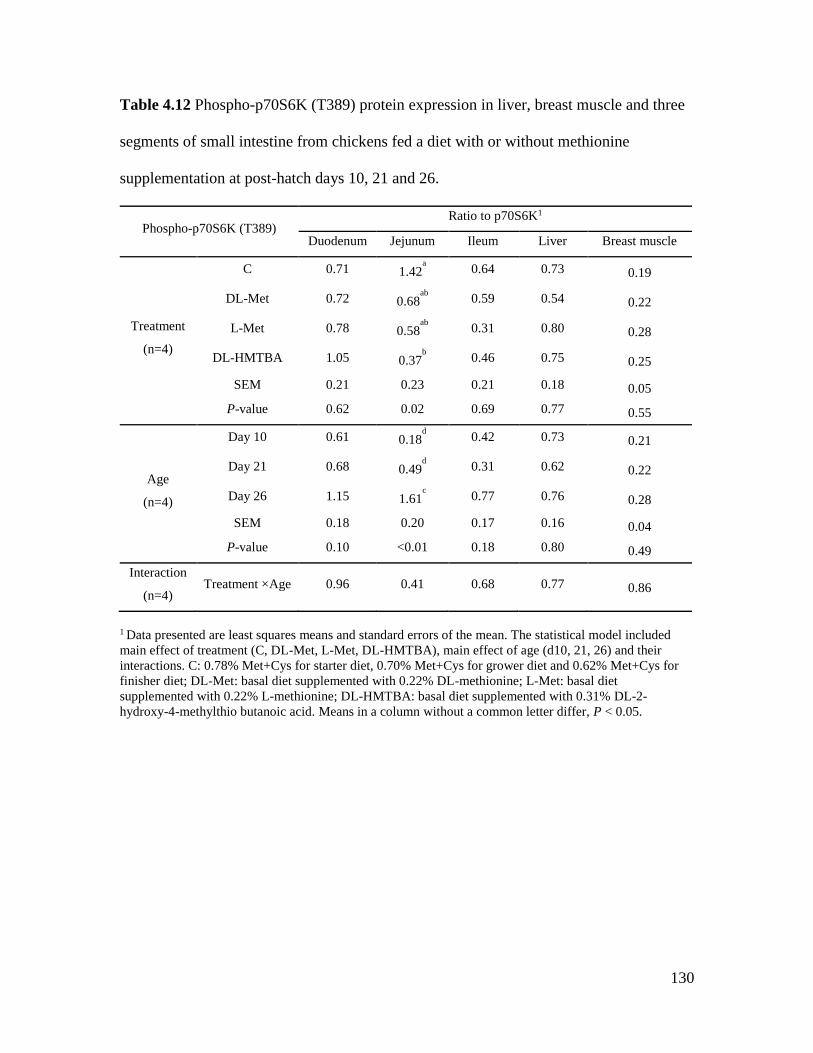
130
Table 4.12 Phospho-p70S6K (T389) protein expression in liver, breast muscle and three
segments of small intestine from chickens fed a diet with or without methionine
supplementation at post-hatch days 10, 21 and 26.
Phospho-p70S6K (T389) Ratio to p70S6K1
Duodenum Jejunum Ileum Liver Breast muscle
Treatment
(n=4)
C 0.71 1.42a
0.64 0.73 0.19
DL-Met 0.72 0.68ab
0.59 0.54 0.22
L-Met 0.78 0.58ab
0.31 0.80 0.28
DL-HMTBA 1.05 0.37b
0.46 0.75 0.25
SEM 0.21 0.23 0.21 0.18 0.05
P-value 0.62 0.02 0.69 0.77 0.55
Age
(n=4)
Day 10 0.61 0.18d
0.42 0.73 0.21
Day 21 0.68 0.49d
0.31 0.62 0.22
Day 26 1.15 1.61c
0.77 0.76 0.28
SEM 0.18 0.20 0.17 0.16 0.04
P-value 0.10 <0.01 0.18 0.80 0.49
Interaction
(n=4) Treatment ×Age 0.96 0.41 0.68 0.77 0.86
1 Data presented are least squares means and standard errors of the mean. The statistical model included
main effect of treatment (C, DL-Met, L-Met, DL-HMTBA), main effect of age (d10, 21, 26) and their
interactions. C: 0.78% Met+Cys for starter diet, 0.70% Met+Cys for grower diet and 0.62% Met+Cys for
finisher diet; DL-Met: basal diet supplemented with 0.22% DL-methionine; L-Met: basal diet
supplemented with 0.22% L-methionine; DL-HMTBA: basal diet supplemented with 0.31% DL-2-
hydroxy-4-methylthio butanoic acid. Means in a column without a common letter differ, P < 0.05.

131
Figure 4.1 Tissue distribution of mRNA expression for methionine oxidases and
transaminases. HAO1: L-2-hydroxy acid oxidase 1; LDHD: D-2-hydroxy acid
dehydrogenase; DAO: D-aspartate oxidase; AGXT: alanine-glyoxylate aminotransferase;
OAT: ornithine aminotransferase; BCAT1: branched chain amino acid transaminase;
GOT2: glutamic-oxaloacetic transaminase 2. Figure shows tissue effect within each gene
independent of treatment and age (n=60). Values represent least squares means ± SEM.
Means were separated using Tukey’s test. Bars with different letters within each gene
represent significant differences, P < 0.05.

132
Figure 4.2 Relative gene expression of methionine converting enzymes from chickens
fed different methionine sources analyzed by tissue. Relative HAO1 (L-2-hydroxy acid
oxidase 1) (A) and DAO (D-aspartate oxidase) (B) mRNA abundance in liver and GOT2
(glutamic-oxaloacetic transaminase 2) mRNA abundance in duodenum (C) in male
broiler chickens fed the diet deficient in Met+Cys (C), or the same diet supplemented
with 0.22% DL-methionine (DL-Met), 0.22% L-methionine (L-Met) or 0.31% DL-2-
hydroxy-4-methylthio butanoic acid (DL-HMTBA) (n=5). Figure shows main effect of
treatment within each tissue across all ages. Values represent least squares means ± SEM.
Means were compared using contrasts. * P < 0.05, ** P < 0.01.
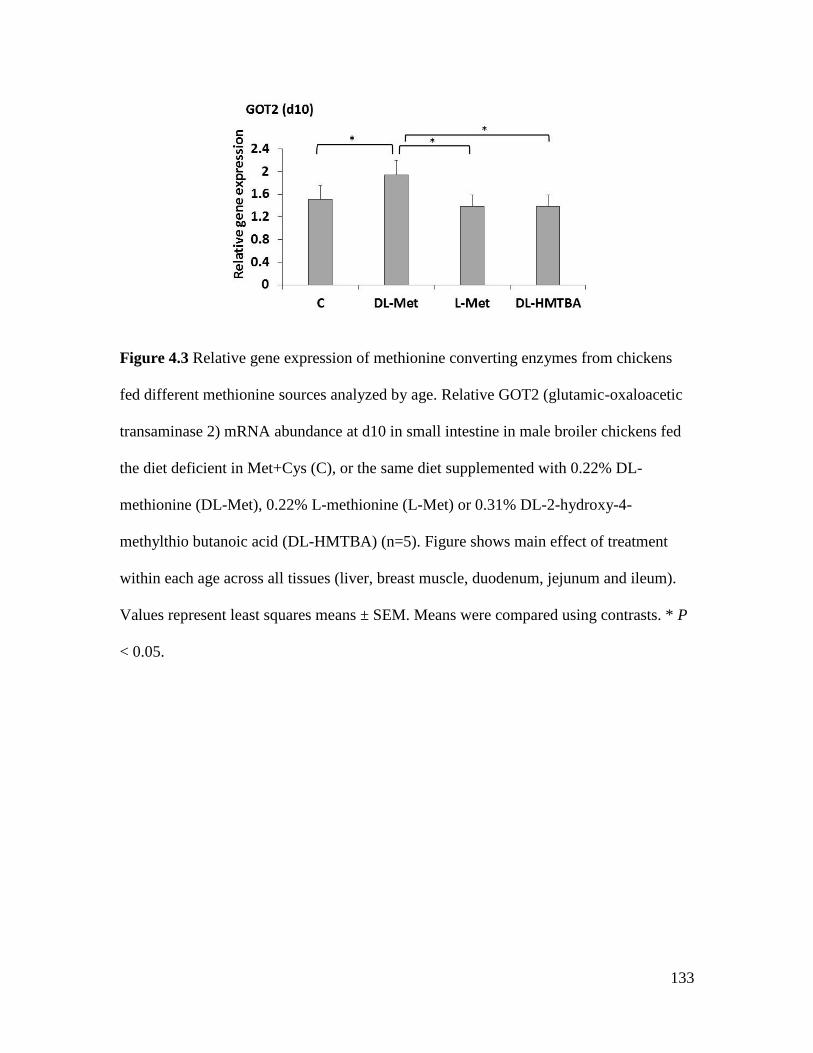
133
Figure 4.3 Relative gene expression of methionine converting enzymes from chickens
fed different methionine sources analyzed by age. Relative GOT2 (glutamic-oxaloacetic
transaminase 2) mRNA abundance at d10 in small intestine in male broiler chickens fed
the diet deficient in Met+Cys (C), or the same diet supplemented with 0.22% DL-
methionine (DL-Met), 0.22% L-methionine (L-Met) or 0.31% DL-2-hydroxy-4-
methylthio butanoic acid (DL-HMTBA) (n=5). Figure shows main effect of treatment
within each age across all tissues (liver, breast muscle, duodenum, jejunum and ileum).
Values represent least squares means ± SEM. Means were compared using contrasts. * P
< 0.05.

134
Figure 4.4 Hepatic methionine oxidase activity under different incubation times. D-
AAOX (D-amino acid oxidase), L-HAOX (L-2-hydroxy acid oxidase) and D-HADH (D-
2-hydroxy acid dehydrogenase) activity were measured in chicken liver extracts after the
reaction was incubated at 37oC for 0, 30, 60, 90 and 120 min. KMB: 2-keto-4
(methylthio) butanoic acid, which is the product of those oxidation reaction.

135
Figure 4.5 Tissue distribution of methionine oxidase activity normalized to per milligram
of protein. D-AAOX: D amino acid oxidase; L-HAOX: L-2-hydroxy acid oxidase; D-
HADH: D-2-hydroxy acid dehydrogenase. Figure shows tissue effect within each enzyme
independent of treatment and age (n=60). Values represent least squares means ± SEM.
Means were separated using Tukey’s test. Bars with different letters within each enzyme
represent significant differences, P < 0.05.

136
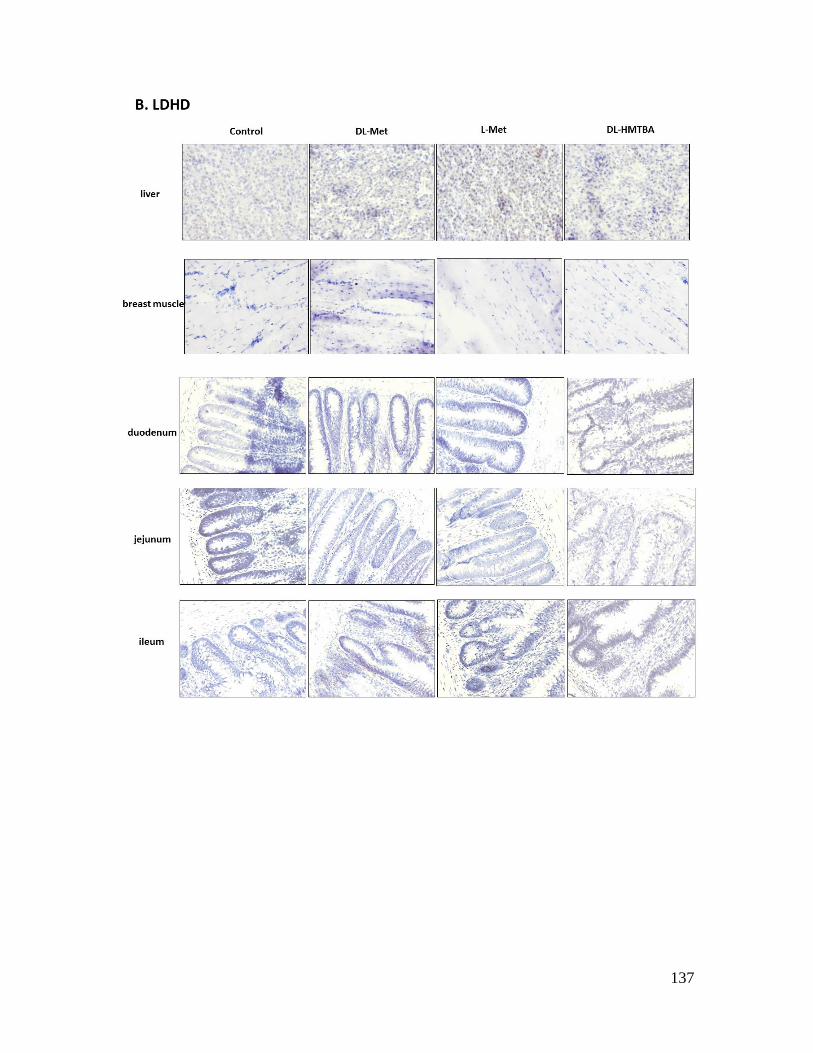
137

138

139
Figure 4.6 In situ hybridization of HAO1 and LDHD mRNA in different tissues from
chickens fed different methionine sources. (A) L-HMTBA oxidase (L-2-hydroxy acid
oxidase, HAO1) localization and (B) D-HMTBA oxidase (D-2-hydroxy acid
dehydrogenase, LDHD) localization in liver, breast muscle, duodenum, jejunum and
ileum from 10-day-old male broiler chickens fed the diet deficient in Met+Cys (Control),
or the same diet supplemented with 0.22% DL-methionine (DL-Met), 0.22% L-
methionine (L-Met) or 0.31% DL-2-hydroxy-4-methylthio butanoic acid (DL-HMTBA).
(C) The different distribution pattern of HAO1 and LDHD between small intestine crypt
and villus was compared. (D) PPIB (peptidylprolyl isomerase B) was used as a positive
control and (E) bacterial dapB (dihydrodipicolinate reductase) was used as a negative
control. Brown dots represent the target mRNA. Images were captured at 400 ×
magnification.

140

141
Figure 4.7 Tissue distribution of oxidative stress markers from chickens fed different
methionine sources at post-hatch days 10 and 26. (A) Reduced glutathione (rGSH) to
total glutathione (TGSH) ratio, (B) protein carbonyl level, (C) thiobarbituric acid reactive
substances (TBARS) level and (D) ferric reducing/antioxidant power (FRAP) level in
liver, breast muscle, duodenum, jejunum and ileum from male broiler chickens fed the
diet deficient in Met+Cys (C), or the same diet supplemented with 0.22% DL-methionine
(DL-Met), 0.22% L-methionine (L-Met) or 0.31% DL-2-hydroxy-4-methylthio butanoic
acid (DL-HMTBA) (n=40). Figures show main effect of tissue independent of treatment
and age. Values represent least squares means ± SEM. Means were separated using
Tukey’s test. Bars with different letters represent significant differences, P < 0.05.
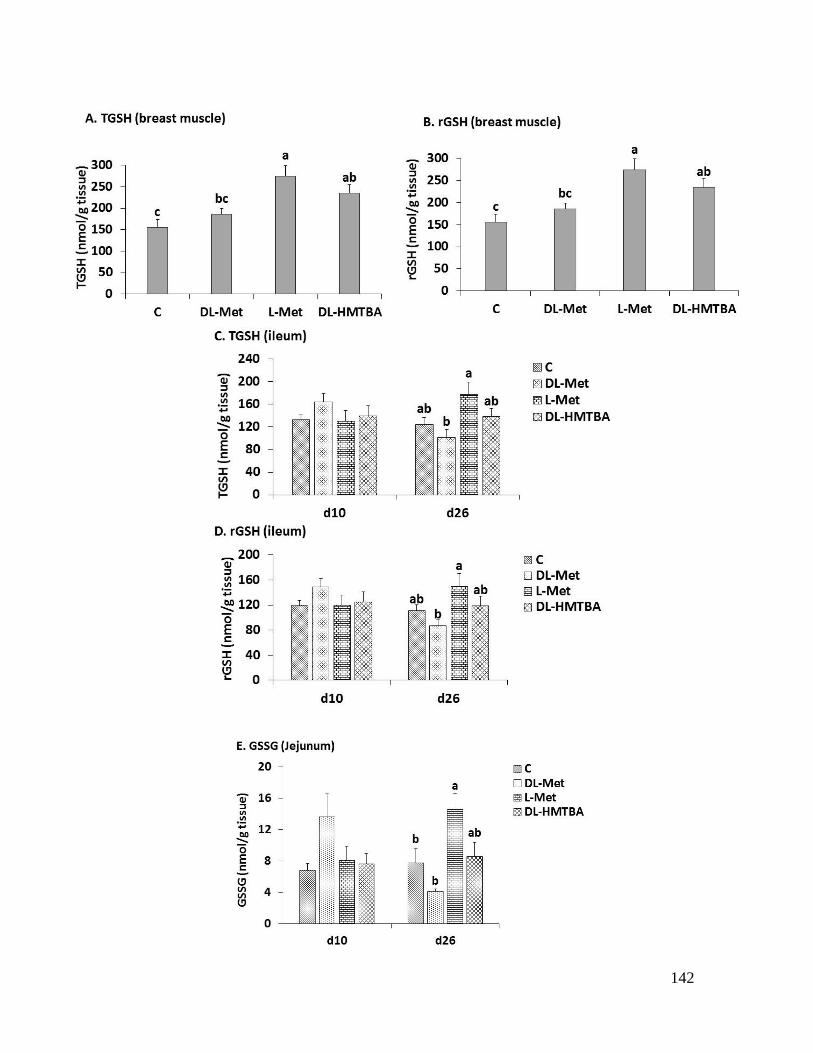
142

143
Figure 4.8 Glutathione profile from chickens fed different methionine sources at post-
hatch days 10 and 26 analyzed by tissue. (A) Total glutathione (TGSH) level in breast
muscle, (B) reduced glutathione (rGSH) level in breast muscle, (C) TGSH level in ileum,
(D) rGSH level in ileum and (E) oxidized glutathione (GSSG) level in jejunum in male
broiler chickens fed the diet deficient in Met+Cys (C), or the same diet supplemented
with 0.22% DL-methionine (DL-Met), 0.22% L-methionine (L-Met) or 0.31% DL-2-
hydroxy-4-methylthio butanoic acid (DL-HMTBA) (n=5). Figure (A) and (B) show main
effect of treatment within each tissue across all the ages. Figure (C) (D) and (E) show the
treatment × age interaction effect within each tissue. Values represent least squares
means ± SEM. Means were separated using Tukey’s test. Bars with different letters
represent significant differences, P < 0.05.

144
Figure 4.9 Protein carbonyl levels from chickens fed different methionine sources at
post-hatch days 10 and 26 analyzed by tissue. Protein carbonyl level in jejunum (A) and
in breast muscle (B) in male broiler chickens fed the diet deficient in Met+Cys (C), or the
same diet supplemented with 0.22% DL-methionine (DL-Met), 0.22% L-methionine (L-
Met) or 0.31% DL-2-hydroxy-4-methylthio butanoic acid (DL-HMTBA) (n=5). Figure
(A) shows main effect of treatment within each tissue across all the ages. Figure (B)
shows the treatment × age interaction effect within each tissue. Values represent least
squares means ± SEM. Means were separated using Tukey’s test. Bars with different
letters represent significant differences, P < 0.05.

145
Figure 4.10 Relative SAT2 mRNA expression in different tissues from chickens fed
different methionine sources at post-hatch days 10, 21 and 26. Figure shows tissue effect
within each day (n=5). Values represent least squares means ± SEM. Means were
separated using Tukey’s test. Bars with different letters within each age (d10, 21 and 26)
represent significant differences, P < 0.05.

146
(A)
(B)
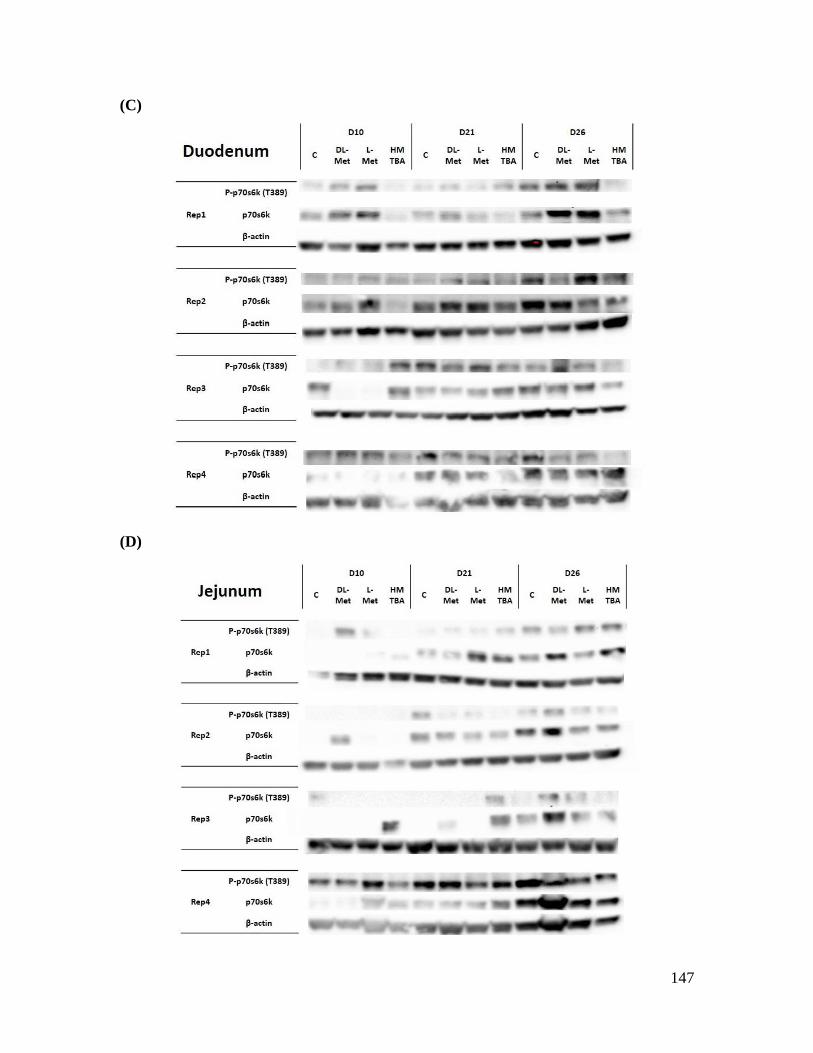
147
(C)
(D)

148
(E)
Figure 4.11 Phospho-p70S6K (T389) and p70S6K protein expression in different tissues
from chickens fed different methionine sources at post-hatch days 10, 21 and 26.
Representative western blots of p70S6K and phospho-p70S6K (T389) in liver (A), breast
muscle (B), duodenum (C), jejunum (D) and ileum (E) in male broiler chickens fed the
diet deficient in Met+Cys (C), or the same diet supplemented with 0.22% DL-methionine
(DL-Met), 0.22% L-methionine (L-Met) or 0.31% DL-2-hydroxy-4-methylthio butanoic
acid (DL-HMTBA) (n=4). Beta-actin was used as the internal control in liver and small
intestine, while GAPDH was used as the internal control in breast muscle.
149
CHAPTER 5 Expression of Intestinal Nutrient Transporters and Methionine
Oxidases in In Vitro Cultured Chicken Tissues Supplemented with Methionine
Isomers or Precursors
5.1 Abstract
The common dietary supplemental methionine (Met) sources include DL-Met and
the analog DL-2-hydroxy-4-(methylthio) butanoic acid (DL-HMTBA). D-Met and DL-
HMTBA must be converted to L-Met through oxidation for utilization. To determine the
in vitro effect of dietary supplemental Met sources on intestinal amino acid transporter
and oxidase gene expression, tissue explants (liver, breast muscle, jejunum and ileum)
from day of hatch Cobb 500 broiler chickens were cultured in control growth media (C)
and growth media without Met but supplemented with 2 mM or 10 mM L-Met, DL-Met
or DL-HMTBA. Tissues were collected at 24h and 48h of culture (n=5). Lactate
dehydrogenase (LDH) activity was monitored to estimate tissue viability. The mRNA
abundance of 14 transporter genes ATB0,+, b0,+AT, B0AT, 4F2hc, LAT1, MCT1, NHE3,
PepT1, rBAT, SAT1, SAT2, SAT3, y+LAT1, y+LAT2 and three oxidase genes L-
HMTBA oxidase (HAO1), D-HMTBA oxidase (LDHD) and D-Met oxidase (DAO) were
assayed by real time PCR. The statistical analysis was conducted within each time point
(24h and 48h) and the model included the main effects of treatment, tissue and their
interactions. Data were analyzed by ANOVA using JMP 11.0. Significance was set at P <
0.05. Means were separated using Tukey’s test. Only PepT1 showed greater mRNA
expression in the jejunum than ileum; whereas the amino acid transporters, LAT1,
y+LAT2, SAT1, SAT3, NHE3, showed greater mRNA abundance in the ileum than

150
jejunum. Most changes in nutrient transporter gene expression occurred at 24h of culture.
DL-HMTBA (10 mM) decreased mRNA expression of b0,+AT, rBAT, and MCT1 relative
to control. In contrast, 10 mM DL-HMTBA increased ATB0,+ mRNA expression
compared to C, L-Met (2 mM and 10 mM) and DL-Met (2 mM). At 48 h, 10 mM DL-
HMTBA reduced rBAT mRNA expression compared to both C and 2 mM L-Met. For the
oxidases, there were also significant tissue effects. At 48h, 10 mM DL-HMTBA reduced
DAO mRNA expression compared to 2 mM L-Met. In conclusion, of the Met sources
examined, 10 mM DL-HMTBA had the greatest effect on mRNA expression of specific
amino acid transporters and oxidases after 24 hours of culture.

151
5.2 Introduction
DL-methionine (DL-Met) and DL-2-hydroxy-4-(methylthio) butanoic acid (DL-
HMTBA) are two commonly used dietary supplemental methionine (Met) sources in the
poultry industry. DL-Met is a mixture of the natural Met isoform L-Met and its D-
configuration D-Met; while DL-HMTBA is an organic acid but can act as a Met
precursor. Carrier-mediated transport in the small intestine plays a major role in the
uptake of these dietary Met sources (reviewed by Zhang, et al., 2015). After absorption,
neither D-Met nor DL-HMTBA can be directly utilized by animals unless they are
converted to L-Met. Oxidation is the key step in the conversion process, which mainly
takes place in the liver and small intestine (Dibner, 1983; Martin-Venegas et al., 2006).
There are different oxidases that are responsible for the specific substrates during this
conversion, e.g., L-HMTBA is oxidized by L-2-hydroxy acid oxidase (EC 1.1.3.15,
encoded by HAO1); D-HMTBA is oxidized by D-2-hydroxy acid dehydrogenase (EC
1.1.99.6, encoded by LDHD); and D-Met is oxidized by D-amino acid oxidase (EC
1.4.3.3, encoded by DAO) (Dibner and Knight, 1984).
In the previous chapters, some tissue-, age- and treatment-dependent expression
patterns of nutrient transporter and oxidase genes were observed from chickens fed
different dietary supplemental Met sources (DL-Met, L-Met and DL-HMTBA). To
achieve a better understanding of how those genes are affected by different Met sources,
we used an in vitro culture tissue model. The objective of this study was to determine the
effects of different Met supplementation sources and concentration on gene expression of
intestinal nutrient transporters and Met oxidases in vitro.

152
5.3 Materials and Methods
5.3.1 Animals and tissue culture
A total of 100 fertilized Cobb 500 chicken eggs were obtained from hatcheries in
Siler City, NC and incubated at 37.5oC for 21 days. On day of hatch (day 21 of
incubation), newly hatched chicks were killed by cervical dislocation. Tissue samples
from jejunum, ileum, breast muscle and liver were collected, minced and placed into 12-
well cell culture plates. The protocol was approved by the Institutional Animal Care and
Use Committee at Virginia Tech.
Tissues were cultured in Dulbecco’s Modified Eagle’s Medium (with 4.5g/L
glucose and sodium bicarbonate, without L-methionine, L-cystine and L-glutamine)
(Sigma-Aldrich), and were supplemented with 2 mM L-glutamine (Sigma-Aldrich), 2
mM L-Cystine•2HCl (Sigma-Aldrich), 5% (v/v) fetal bovine serum (Sigma-Aldrich), 5%
(v/v) chicken serum (Sigma-Aldrich), antibiotic antimycotic solution (Genesee Scientific,
San Diego, CA) and gentamicin (50µg/mL, Thermo Scientific). Both the fetal bovine
serum and the chicken serum were dialyzed using Fisherbrand™ Regenerated Cellulose
Dialysis Tubing (3500 MWCO; Fisher Scientific, Waltham, MA) to remove amino acids
before use. Different treatments were supplemented with different Met sources: Control
(C, 0.2 mM L-Met), Treatment 1 (2 mM L-Met), Treatment 2 (10 mM L-Met), Treatment
3 (2 mM DL-Met), Treatment 4 (10 mM DL-Met), Treatment 5 (2 mM Ca2+(DL-
HMTBA)2), Treatment 6 (10 mM Ca2+(DL-HMTBA)2). Culture plates were kept in a
Modular Incubator Chamber (Billups-Rothenberg, San Diego, CA) at 37oC in a modified
atmosphere of 5% CO2 and 95% O2. Cultured tissue samples were collected at 24h and
48h (n=5).

153
5.3.2 Tissue viability estimation and real-time PCR assay
Tissue viability was estimated at 0h, 24h and 48h of in vitro culture by monitoring
lactate dehydrogenase (LDH) activity in the culture media using the Pierce LDH
Cytotoxicity Assay Kit (Thermo Scientific). Total RNA was isolated from collected
tissue samples and purified and first-strand cDNA was synthesized, following the same
protocol as described in section 3.3.5. Relative quantification real time PCR was used to
measure the expression of 14 nutrient transporter genes ATB0,+, b0,+AT, B0AT, 4F2hc,
LAT1, MCT1, NHE3, PepT1, rBAT, SAT1, SAT2, SAT3, y+LAT1 and y+LAT2, three
oxidase genes DAO, HAO1 and LDHD, and three reference genes PRL4, PRLP0 and
PRLP1. The nutrient transporter genes were only measured in jejunum and ileum.
Primers designed for real time PCR are listed in Table 3.1 and Table 4.1, and were
validated for amplification efficiency before use (90-115% efficiency). Real-time PCR
was performed and relative gene expression was calculated as described in section 3.3.5.
5.3.3 Data analysis
The LDH activity data were analyzed within each tissue (liver, muscle, jejunum
and ileum): 1) within each time point (24h and 48h), the differences between 7 treatments
were compared; 2) within each treatment, the differences between 3 time points (0h, 24h
and 48h) were compared.
The gene expression data were analyzed within each time point (24h and 48h).
The statistical model included the main effects of treatment, tissue and their interactions.
All data were checked for normality and homogeneity of variances and analyzed
by ANOVA. Means were separated using Tukey’s Test. JMP Pro version 11.0 (SAS
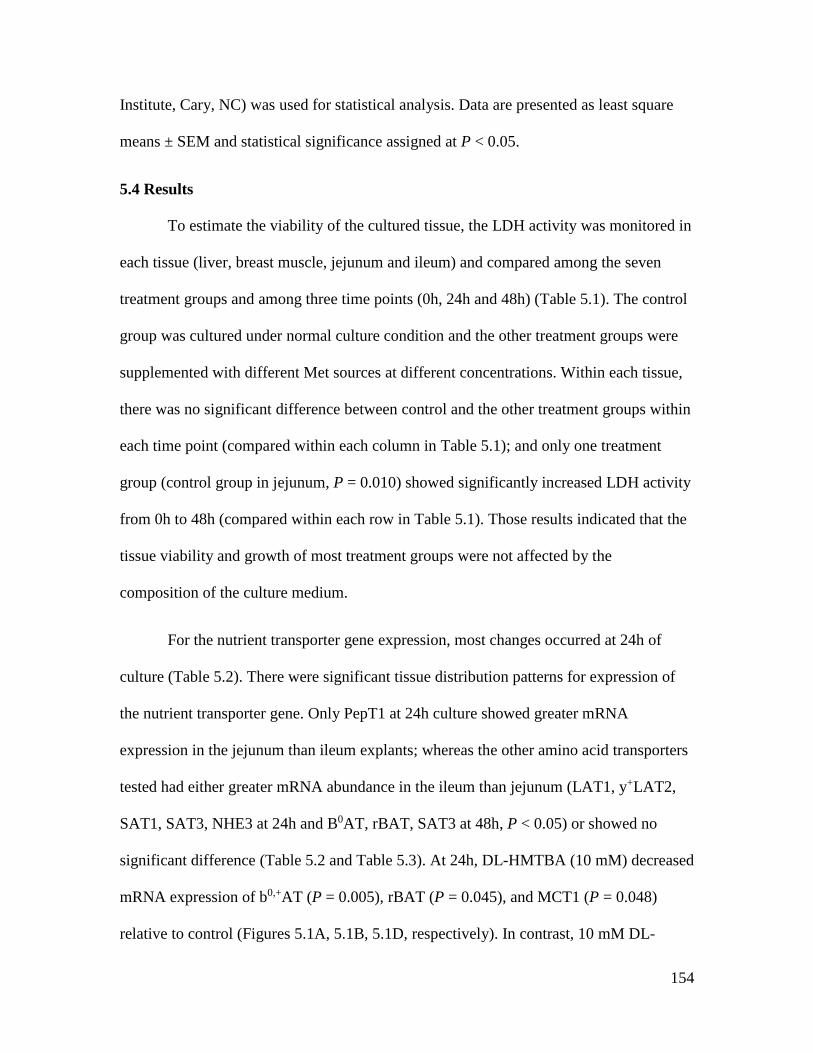
154
Institute, Cary, NC) was used for statistical analysis. Data are presented as least square
means ± SEM and statistical significance assigned at P < 0.05.
5.4 Results
To estimate the viability of the cultured tissue, the LDH activity was monitored in
each tissue (liver, breast muscle, jejunum and ileum) and compared among the seven
treatment groups and among three time points (0h, 24h and 48h) (Table 5.1). The control
group was cultured under normal culture condition and the other treatment groups were
supplemented with different Met sources at different concentrations. Within each tissue,
there was no significant difference between control and the other treatment groups within
each time point (compared within each column in Table 5.1); and only one treatment
group (control group in jejunum, P = 0.010) showed significantly increased LDH activity
from 0h to 48h (compared within each row in Table 5.1). Those results indicated that the
tissue viability and growth of most treatment groups were not affected by the
composition of the culture medium.
For the nutrient transporter gene expression, most changes occurred at 24h of
culture (Table 5.2). There were significant tissue distribution patterns for expression of
the nutrient transporter gene. Only PepT1 at 24h culture showed greater mRNA
expression in the jejunum than ileum explants; whereas the other amino acid transporters
tested had either greater mRNA abundance in the ileum than jejunum (LAT1, y+LAT2,
SAT1, SAT3, NHE3 at 24h and B0AT, rBAT, SAT3 at 48h, P < 0.05) or showed no
significant difference (Table 5.2 and Table 5.3). At 24h, DL-HMTBA (10 mM) decreased
mRNA expression of b0,+AT (P = 0.005), rBAT (P = 0.045), and MCT1 (P = 0.048)
relative to control (Figures 5.1A, 5.1B, 5.1D, respectively). In contrast, 10 mM DL-

155
HMTBA increased ATB0,+ mRNA expression compared to C, L-Met (2 mM and 10 mM)
and DL-Met (2 mM) (Figure 5.1E, P = 0.005). In addition, 2 mM DL-Met reduced
b0,+AT mRNA expression relative to control (Figure 5.1A, P = 0.005), and reduced SAT3
mRNA expression relative to control and 10 mM DL-HMTBA (Figure 5.1C, P = 0.012).
At 48h, 10 mM DL-HMTBA reduced rBAT mRNA expression compared to both C and 2
mM L-Met (Figure 5.1F, P = 0.031).
For the oxidases, there were also significant tissue effects (Table 5.4). Liver
showed the greatest DAO (Figure 5.2A, P < 0.001), HAO1 (Figure 5.2C, P < 0.001) and
LDHD (Figure 5.2B, P < 0.001) mRNA expression at 24h culture, and the greatest
HAO1 mRNA expression at 48h culture (Figure 5.2C, P < 0.001). Jejunum showed the
greatest DAO mRNA expression at 48h culture (Figure 5.2A, P < 0.001). Breast muscle
had lowest DAO mRNA expression at both 24h and 48h culture (Figure 5.2A, both P <
0.001). Liver had greater DAO and LDHD mRNA abundance compared to breast muscle
at 48h (Figure 5.2A and Figure 5.2B, P < 0.001 and P < 0.001, respectively). Few
significant treatment effects were observed. At 48h, 10 mM DL-HMTBA reduced DAO
mRNA expression compared to 2 mM L-Met (Figure 5.3, P = 0.025).
5.5 Discussion
To investigate the effects of Met supplementation on expression of nutrient
transporters in vitro, tissue explants were incubated with media containing different Met
sources. First it was necessary to monitor the viability of the tissue explants. LDH is a
cytosolic enzyme present in many different cell types, and can be released into the culture
media when the cell membrane is damaged (Decker and Lohmann-Matthes, 1988). Thus
tissue viability can be estimated by measuring LDH concentration in the culture media.
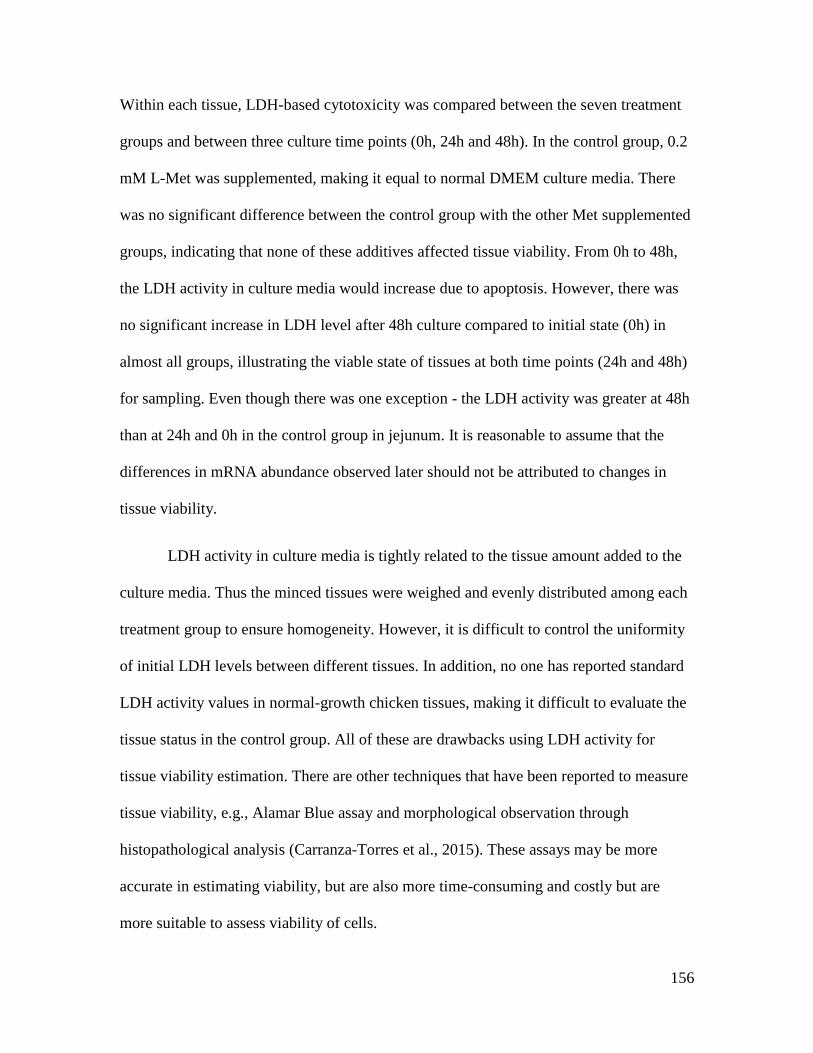
156
Within each tissue, LDH-based cytotoxicity was compared between the seven treatment
groups and between three culture time points (0h, 24h and 48h). In the control group, 0.2
mM L-Met was supplemented, making it equal to normal DMEM culture media. There
was no significant difference between the control group with the other Met supplemented
groups, indicating that none of these additives affected tissue viability. From 0h to 48h,
the LDH activity in culture media would increase due to apoptosis. However, there was
no significant increase in LDH level after 48h culture compared to initial state (0h) in
almost all groups, illustrating the viable state of tissues at both time points (24h and 48h)
for sampling. Even though there was one exception - the LDH activity was greater at 48h
than at 24h and 0h in the control group in jejunum. It is reasonable to assume that the
differences in mRNA abundance observed later should not be attributed to changes in
tissue viability.
LDH activity in culture media is tightly related to the tissue amount added to the
culture media. Thus the minced tissues were weighed and evenly distributed among each
treatment group to ensure homogeneity. However, it is difficult to control the uniformity
of initial LDH levels between different tissues. In addition, no one has reported standard
LDH activity values in normal-growth chicken tissues, making it difficult to evaluate the
tissue status in the control group. All of these are drawbacks using LDH activity for
tissue viability estimation. There are other techniques that have been reported to measure
tissue viability, e.g., Alamar Blue assay and morphological observation through
histopathological analysis (Carranza-Torres et al., 2015). These assays may be more
accurate in estimating viability, but are also more time-consuming and costly but are
more suitable to assess viability of cells.

157
Real-time PCR was used to estimate the gene expression of 14 intestinal nutrient
transporters and three Met oxidases in cultured tissue explants collected from day-of-
hatch broiler chickens. The same gene profile was also measured in the in vivo animal
trial, which was described in chapters 3 and 4. Similar to the in vivo results, there were
significant tissue effects for expression of the transporter and oxidase genes. In the in
vitro study, we only collected jejunum and ileum but not duodenum for culturing.
However, the nutrient transporter mRNA abundance demonstrated similar patterns as that
in the in vivo study: only the di- and tri- peptide transporter PepT1 showed significantly
greater mRNA expression in jejunum than ileum. The other transporters tested had either
greater mRNA abundance in ileum than jejunum or no significant difference. For the
three oxidases, the tissue effect was similar to the in vivo pattern: liver is the tissue with
the greatest HAO1 (encoding L-HMTBA oxidase) and LDHD (encoding D-HMTBA
oxidase) gene expression; for DAO (encoding D-Met oxidase) especially at 24h culture,
liver and jejunum had greater mRNA expression compared to breast muscle.
For treatment effects, there is little overlap between the in vitro and in vivo study.
This may be explained by the age-dependent gene expression difference. The in vitro
culture using tissues obtained from adult chickens is a great challenge due to
microorganism contamination, particularly for trying to culture intestinal segments. In the
in vitro study, most significant changes in nutrient transporter gene expression occurred
at 24h of culture or with addition of 10 mM DL-HMTBA. The 10 mM DL-HMTBA
supplementation decreased mRNA expression of neutral amino acid transporter b0,+AT,
its dimer rBAT, and the monocarboxylic acid transporter MCT1 relative to control. In
contrast, 10 mM DL-HMTBA supplementation increased neutral amino acid transporter

158
ATB0,+ mRNA expression compared to C, L-Met (2 mM and 10 mM) and DL-Met (2
mM). One possible explanation is that the toxicity of the high concentration of DL-
HMTBA leads to down-regulation of MCT1, which was reported to be related to DL-
HMTBA uptake in the small intestine (Martin-Venegas et al., 2007). Another reasonable
interpretation is the effect of high concentration of Ca2+. The calcium salt of HMTBA
was the only commercial source that was available for this project. The regulation of
amino acid transporters is very likely affected by a high concentration of Ca2+ due to the
high concentration of HMTBA calcium salt supplementation. The only significant
treatment effect for Met oxidase gene expression is also related to 10 mM DL-HMTBA
supplementation, with 2 mM L-Met showing greater DAO mRNA abundance compared
to 10 mM DL-HMTBA. However, the in vitro studies conducted in human Caco-2 cells
illustrated that 2 mM DL-HMTBA supplementation up-regulated the conversion of DL-
HMTBA to L-Met (Martin-Venegas et al., 2011), as well as MCT1 mRNA expression
(Martin-Venegas et al., 2014). This may be due to species difference, or difference
between cells and tissue explants.
In conclusion, supplementation of different Met sources had limited effects on
intestinal nutrient transporter and Met oxidase gene expression in vitro. Of the Met
sources examined, 10 mM DL-HMTBA had the greatest effect on mRNA expression of
specific amino acid transporters and oxidases after 24 hours of culture.
159
LITERATURE CITED
Carranza-Torres, I. E. et al. 2015. Organotypic culture of breast tumor explants as a
multicellular system for the screening of natural compounds with antineoplastic
potential. Biomed Res Int 2015: 618021.
Decker, T., and M. L. Lohmann-Matthes. 1988. A quick and simple method for the
quantitation of lactate dehydrogenase release in measurements of cellular
cytotoxicity and tumor necrosis factor (TNF) activity. J Immunol Methods 115: 61-
69.
Dibner, J. J. 1983. Utilization of supplemental methionine sources by primary cultures of
chick hepatocytes. J Nutr 113: 2116-2123.
Dibner, J. J., and C. D. Knight. 1984. Conversion of 2-hydroxy-4-(methylthio)butanoic
acid to L-methionine in the chick: a stereospecific pathway. J Nutr 114: 1716-1723.
Martin-Venegas, R. et al. 2014. Monocarboxylate transporter 1 is up-regulated in Caco-2
cells by the methionine precursor DL-2-hydroxy-(4-methylthio)butanoic acid. Vet J
202: 555-560.
Martin-Venegas, R., M. T. Brufau, Y. Mercier, P. A. Geraert, and R. Ferrer. 2011.
Intestinal cell conversion of DL-2-hydroxy-(4-methylthio)butanoic acid in vitro:
dietary up-regulation by this methionine precursor. Br J Nutr 106: 350-356.
Martin-Venegas, R., P. A. Geraert, and R. Ferrer. 2006. Conversion of the methionine
hydroxy analogue DL-2-hydroxy-(4-methylthio) butanoic acid to sulfur-containing
amino acids in the chicken small intestine. Poult Sci 85: 1932-1938.
Martin-Venegas, R., M. J. Rodriguez-Lagunas, P. A. Geraert, and R. Ferrer. 2007.
Monocarboxylate transporter 1 mediates DL-2-Hydroxy-(4-methylthio)butanoic acid
transport across the apical membrane of Caco-2 cell monolayers. J Nutr 137: 49-54.
Zhang, S., E. A. Wong, and E. R. Gilbert. 2015. Bioavailability of different dietary
supplemental methionine sources in animals. Front Biosci (Elite Ed) 7: 478-490.

160
Table 5.1 Lactate dehydrogenase (LDH) activity in culture media of in vitro cultured
liver, breast muscle, jejunum and ileum explants at 0h, 24h and 48h supplemented with
different methionine sources.
Treatment
(n=5)
LDH Activity (A490nm-A680nm)1
Liver Muscle Jejunum Ileum
0h 24h 48h 0h 24h 48h 0h 24h 48h 0h 24h 48h
C 2.90 3.57 3.58 1.75 2.39 2.61 1.75b 1.96b 2.52a 1.75 2.05 2.47
2 mM L-Met 3.01 3.61 3.59 1.90 2.25 2.41 1.82 2.08 2.47 1.88 2.14 2.46
10 mM L-Met 3.09 3.57 3.55 1.87 2.35 2.35 1.80 1.97 2.42 1.74 1.99 2.40
2 mM DL-Met 2.81 3.56 3.57 2.01 2.22 2.30 1.75 2.01 2.38 1.86 2.14 2.41
10 mM DL-Met 2.93 3.53 3.49 1.90 2.30 2.27 1.83 1.87 2.35 1.87 1.99 2.41
2 mM DL-
HMTBA 2.58 3.60 3.50 1.82 2.16 2.20 1.79 1.87 2.07 1.88 2.02 2.28
10 mM DL-
HMTBA 2.65 3.60 3.54 1.86 1.99 2.21 1.77 1.85 2.04 1.90 1.90 2.22
SEM 0.32 0.04 0.06 0.14 0.21 0.26 0.10 0.10 0.29 0.13 0.16 0.35
P-value 0.89 0.87 0.84 0.90 0.86 0.92 1.00 0.69 0.83 0.96 0.93 1.00
1Data are shown as least squares means ± standard errors of the means. The statistical models include: 1)
Analyzing within each tissue and each time point, compare the differences between 7 treatments. Under
this model, means in a column without a common letter differ, P < 0.05. 2) Analyzing within each tissue
and each treatment, compare the differences between 3 time points. Under this model, means in a row (in
the same tissue) without a common letter differ, P < 0.05.

161
Table 5.2 Relative intestinal nutrient transporter gene expression at 24h of in vitro tissue culture.
Item
Relative Nutrient Transporter Gene Expression1
B0AT b0,+AT rBAT PepT1 LAT1 y+LAT1 y+LAT2 SAT1 SAT2 SAT3 4F2hc MCT1 NHE3 ATB0,+
Treatment
(n=5)
C 1.37 1.11a 0.84a 1.02 0.88 0.70 0.84 0.93 0.69 1.06a
1.09 0.83a
0.82 0.72b
2 mM L-Met 0.98 0.68ab 0.62ab 0.70 0.71 0.54 0.66 0.76 0.53 0.65ab
0.76 0.65ab
0.56 0.76b
10 mM L-Met 0.98 0.70ab 0.71ab 0.61 0.79 0.57 0.73 0.82 0.55 0.76ab
0.84 0.60ab
0.59 0.53b
2 mM DL-Met 0.99 0.57b 0.69ab 0.61 0.70 0.49 0.67 0.69 0.57 0.52b
0.77 0.61ab
0.62 0.50b
10 mM DL-Met 1.10 0.75ab 0.76ab 0.66 0.83 0.57 0.83 0.84 1.03 0.80ab
0.80 0.63ab
0.72 1.18ab
2 mM DL-
HMTBA 1.00 0.65ab 0.69ab 0.52 0.79 0.50 0.80 0.75 0.86 0.83
ab
0.90 0.64ab
0.75 1.06ab
10 mM DL-
HMTBA 0.84 0.41b 0.50b 0.42 0.78 0.74 0.76 0.86 1.02 0.98
a
0.38 0.59b
0.86 1.93a
SEM 0.25 0.11 0.07 0.13 0.07 0.08 0.05 0.08 0.16 0.11 0.19 0.05 0.08 0.26
P-value 0.87 <0.01 0.04 0.07 0.62 0.26 0.13 0.44 0.12 0.01 0.27 0.04 0.06 <0.01
Tissue
(n=5)
Jejunum 0.90 0.67 0.67 0.77a 0.71b 0.55 0.72b 0.73b
0.66 0.61b
0.76 0.65 0.62b
0.85
Ileum 1.18 0.72 0.70 0.53b 0.85a 0.62 0.80a 0.89a
0.84 0.99a
0.82 0.65 0.79a
1.05
SEM 0.14 0.06 0.04 0.07 0.04 0.04 0.03 0.04 0.09 0.06 0.10 0.03 0.04 0.14
P-value 0.15 0.59 0.60 0.02 0.01 0.25 0.04 0.01 0.16 <0.01 0.68 0.94 <0.01 0.32
Interaction
(n=5)
Treatment
×Tissue 0.92 1.00 0.77 0.98 0.90 1.00 0.73 0.90 1.00 0.79 1.00 0.97 0.86 1.00
1Data are shown as least squares means ± standard errors of the means. The statistical model included main effects of treatment and tissue (jejunum, ileum) and
their interaction. Means in a column without a common letter differ, P < 0.05.

162
Table 5.3 Relative intestinal nutrient transporter gene expression at 48h of in vitro tissue culture.
Item
Relative Nutrient Transporter Gene Expression1
B0AT b0,+AT rBAT PepT1 LAT1 y+LAT1 y+LAT2 SAT1 SAT2 SAT3 4F2hc MCT1 NHE3 ATB0,+
Treatment
(n=5)
C 0.65 0.95 1.09a
1.17 0.89 1.16 0.82 0.71 1.29 0.71 0.77 0.84 1.09 1.07
2 mM L-Met 1.10 1.50 1.14a
1.73 0.81 1.41 0.94 0.90 1.53 1.23 1.30 0.97 1.25 1.74
10 mM L-Met 0.88 1.30 1.04ab
1.68 0.83 1.26 0.79 0.90 1.43 0.87 0.95 0.89 1.07 1.17
2 mM DL-Met 0.72 1.14 0.95ab
1.39 0.74 1.07 0.76 0.72 1.06 0.71 1.21 1.00 0.75 1.06
10 mM DL-Met 0.83 1.23 1.01ab
1.31 0.74 1.13 0.82 0.83 0.90 1.05 1.17 0.87 0.99 0.83
2 mM DL-
HMTBA 0.91 1.21 0.98
ab
1.36 0.86 1.03 0.86 0.74 1.20 0.94 1.16 0.98 1.00 1.23
10 mM DL-
HMTBA 1.04 0.75 0.67
b
1.21 0.79 1.27 0.72 0.80 1.15 1.02 0.89 0.92 1.12 1.29
SEM 0.16 0.22 0.10 0.18 0.11 0.16 0.06 0.10 0.36 0.13 0.22 0.06 0.19 0.40
P-value 0.45 0.29 0.03 0.21 0.96 0.65 0.26 0.67 0.90 0.09 0.62 0.42 0.68 0.80
Tissue
(n=5)
Jejunum 0.69b
1.00 0.87b
1.51 0.76 1.10 0.80 0.74 1.16 0.75b
1.01 0.91 0.99 1.14
Ileum 1.06a
1.31 1.10a
1.30 0.86 1.28 0.83 0.85 1.29 1.12a
1.11 0.94 1.09 1.26
SEM 0.09 0.12 0.05 0.10 0.60 0.08 0.03 0.05 0.19 0.07 0.12 0.03 0.10 0.21
P-value <0.01 0.06 <0.01 0.13 0.23 0.13 0.55 0.14 0.64 <0.01 0.56 0.58 0.46 0.70
Interaction
(n=5)
Treatment
×Tissue 0.85 0.95 0.72 0.93 0.86 0.97 0.75 0.95 0.98 0.62 0.96 0.99 0.79 0.98
1Data are shown as least squares means ± standard errors of the means. The statistical model included main effects of treatment and tissue (jejunum, ileum) and
their interaction. Means in a column without a common letter differ, P < 0.05.

163
Table 5.4 Relative Met oxidase gene expression at 24h and 48h of in vitro tissue culture.
Relative Oxidase Gene
Expression1
24H 48H
DAO LDHD HAO1 DAO LDHD HAO1
Treatment
(n=5)
C 1.68 1.78 4.60 1.72ab
0.94 3.41
2 mM L-Met 1.93 1.69 4.53 1.91a
1.35 3.80
10 mM L-Met 2.10 2.23 4.89 1.61ab
1.51 2.51
2 mM DL-Met 1.64 1.21 3.87 1.76ab
0.81 1.94
10 mM DL-Met 1.91 1.98 4.53 1.50ab
0.94 1.15
2 mM DL-HMTBA 1.67 1.40 3.93 1.74ab
0.81 2.48
10 mM DL-HMTBA 1.34 1.84 3.92 0.96b
0.91 1.59
SEM 0.29 0.39 1.05 0.19 0.26 0.68
P-value 0.60 0.59 0.99 0.03 0.34 0.08
Tissue
(n=5)
Liver 3.56a
2.87a
15.59a
1.63b
1.67a
7.90a
Muscle 0.37c
1.46b
0.56b
0.23c
0.44b
0.45b
Jejunum 1.84b
1.24b
0.53b
2.55a
0.97ab
0.59b
Ileum 1.23b
1.36b
0.61b
2.00b
1.08ab
0.71b
SEM 0.22 0.30 0.80 0.15 0.20 0.51
P-value <0.01 <0.01 <0.01 <0.01 <0.01 <0.01
Interaction
(n=5) Treatment ×Tissue 0.40 0.99 1.00 0.21 0.72 0.08
1Data are shown as least squares means ± standard errors of the means. The statistical model included main
effects of treatment and tissue (liver, breast muscle, jejunum, ileum) and their interaction. Means in a
column without a common letter differ, P < 0.05.
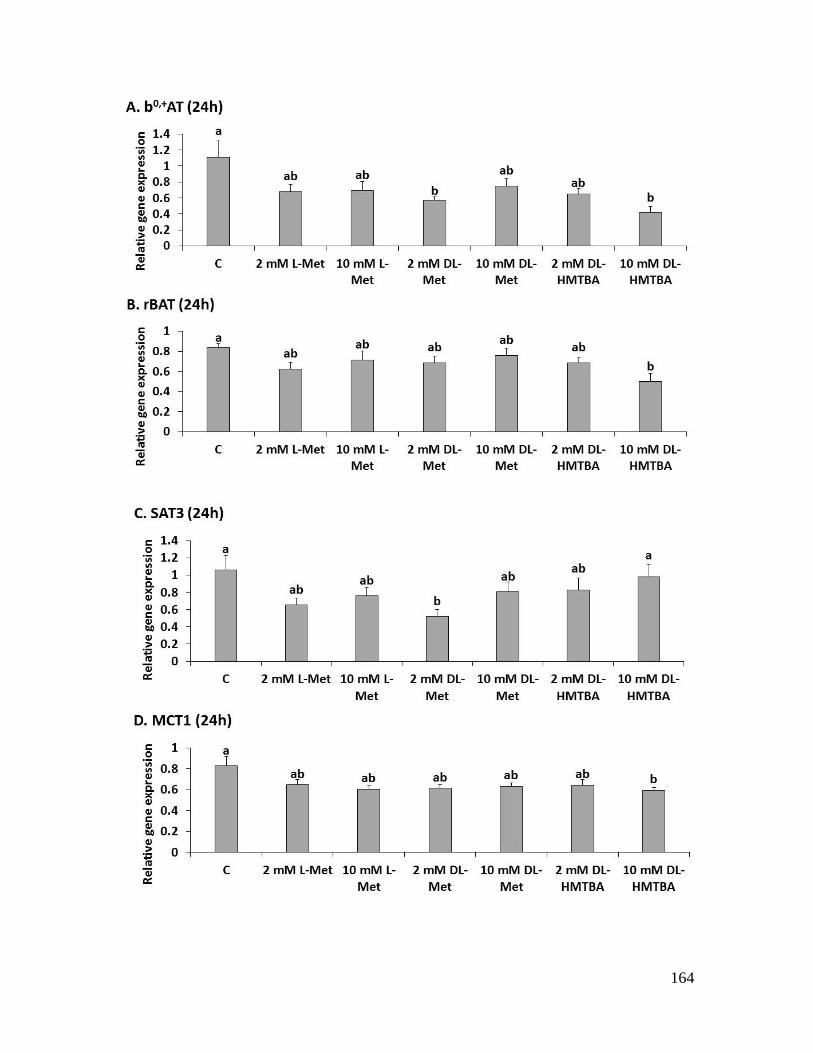
164

165
Figure 5.1 Relative intestinal nutrient transporter gene expression at 24h and 48h of in
vitro tissue culture. Relative b0,+AT (A), rBAT (B), SAT3 (C), MCT1 (D) and ATB0,+
(E) mRNA abundance at 24h and rBAT (F) mRNA abundance at 48h of in vitro cultured
jejunum and ileum supplemented with different methionine sources (n=5). Figure shows
main effect of treatment within each time point (24h and 48h) across jejunum and ileum.
Values represent least squares means ± SEM. Means were separated using Tukey’s test.
Bars with different letters represent significant differences, P < 0.05.

166
Figure 5.2 Relative methionine oxidases gene expression at 24h and 48h of in vitro
cultured liver, muscle and small intestine. (A) Relative D-amino acid oxidases (DAO),
(B) D-HMTBA oxidase (D-2-hydroxy acid dehydrogenase, LDHD) and (C) L-HMTBA
oxidase (L-2-hydroxy acid oxidase 1, HAO1) mRNA abundance at 24h and 48h of in
vitro cultured liver, breast muscle, jejunum and ileum supplemented with different
methionine sources (n=5). Figure shows main effect of tissue within each time point (24h
and 48h) across all the treatments. Values represent least squares means ± SEM. Means
were separated using Tukey’s test. Bars with different letters represent significant
differences, P < 0.05.

167
Figure 5.3 Relative D-amino acid oxidases (DAO) mRNA abundance at 48h of in vitro
tissue culture supplemented with different methionine sources. n=5. Figure shows main
effect of treatment within each time point (24h and 48h) across all the tissue (liver, breast
muscle, jejunum and ileum). Values represent least squares means ± SEM. Means were
separated using Tukey’s test. Bars with different letters represent significant differences,
P < 0.05.

168
CHAPTER 6 Hepatic Gene Expression via RNA Sequencing in Broiler Chickens
Fed Methionine Isomers or Precursors
6.1 Abstract
The objective of this study was to identify differentially expressed genes (DEGs)
in liver from chickens fed different dietary supplemental methionine (Met) sources
including DL-methionine (DL-Met), L-methionine (L-Met) and DL-2-hydroxy-4-
(methylthio) butanoic acid (DL-HMTBA) and Met deficient diet through next generation
sequencing technologies. Liver samples from 16 male Cobb 500 broiler chickens fed
different Met sources were collected at d26 (n=4). Total RNA was extracted and
sequenced via the Illumina HiSeq platform. A total of 745 DEGs were identified. Among
them, 107 DEGs were in common when one of the dietary Met supplemental groups
(DL-Met, L-Met or DL-HMTBA) was compared with the control group (C, Met
deficient). However, only two DEGs (FGD3 and TNNC1) were identified between DL-
Met and L-Met and none between DL-Met and DL-HMTBA or L-Met and DL-HMTBA.
The gene BHMT (betaine--homocysteine S-methyltransferase), which encodes a
cytosolic enzyme that catalyzes the conversion of homocysteine to Met in the methionine
degradation pathway, was down regulated in both DL-HMTBA and L-Met groups
compared with C. These results indicate that Met deficiency could lead to many DEGs.
However, different dietary supplemental Met sources minimally change the hepatic gene
expression profile in broilers.
169
6.2 Introduction
Next-generation sequencing technology is being widely applied in molecular
biology research for characterization and quantification of genomes, epigenomes and
transcriptomes in the last few years. As a high-throughput technology, it can produce
large and complex datasets at single nucleotide resolution, with continuously dropping
cost (Han et al., 2015). RNA sequencing (RNA-seq) is a technique that generates cDNA
sequences from the entire transcriptome, followed by library construction and massively
parallel deep sequencing (Han et al., 2015). Since gene expression is usually time-, cell-
type- and stimulus-dependent, many loci are only expressed under certain conditions.
RNA-seq allows quantification of the abundance of each transcript under specific
treatment conditions in a rather unbiased way with low background signals (Wang et al.,
2009). The objective of this study was to characterize the differentially expressed genes
(DEGs) in liver from chickens fed different dietary supplemental methionine (Met)
sources: DL-methionine (DL-Met), L-methionine (L-Met) or DL-2-hydroxy-4-
(methylthio) butanoic acid (DL-HMTBA), and Met deficient diet, using RNA sequencing
technology.
6.3 Materials and Methods
6.3.1 Animals
Details about the animals used in this study are the same as described in 3.3.1.
6.3.2 Total RNA extraction and sequencing
At d26, 16 liver samples from 4 replicates per treatment were collected for RNA
sequencing (n=4). Total RNA was extracted from liver using Tri-Reagent (Molecular
Research Center) and Tissue Lyser II (Qiagen). The RNeasy Mini Kit (Qiagen) and

170
RNase-free DNase I (Qiagen) were used for total RNA purification. The concentration
and purity of total RNA was assessed by spectrophotometry at 260/280/230 nm with a
NanoDropTM 1000 (Thermo Scientific). The quality of the total RNA was evaluated
with an Experion™ Automated Electrophoresis Station (Bio-rad) and Experion RNA
StdSens analysis kit (Bio-rad). RNA-seq libraries were prepared by the poly A-selection
method using the Illumina TruSeqTM DNA Library Preparation kit, followed by
sequencing on a HiSeq 1000 using 101-cycle single reads, and performed at the
Biocomplexity Institute of Virginia Tech (VTBI).
6.3.3 Mapping and data analysis
To generate predicted transcripts, RNA-seq reads were scrubbed for adaptor and
quality using a combination of ea-utils (for adaptor) (Aronesty, 2011) and Btrim (for
quality) (Kong, 2011). Following trimming, reads were mapped to the chicken genome,
Gallus_ gallus-4.0 (released 2011), using Cufflinks/Cuffmerge and TopHat2 (Bowtie2)
(Langmead and Salzberg, 2012; Ghosh and Chan, 2016). The assembled reads were
counted via HTSeq (Anders et al., 2015). Differential expression was determined using
contrasts between treatments and tested for significance using the Benjamini-Hochberg
corrected Wald Test in the R-package DESeq2 (Love et al., 2014). Results were called
differentially expressed if the adjusted P-value was less than 0.1.
To understand the biological systems involved, the identified DEGs were mapped
and molecular networks generated using Ingenuity Pathways Analysis (IPA) software
(Ingenuity® Systems) by VTBI. Pre-filtered DEG (P < 0.05) data were uploaded and the
significant pathways were identified using Fisher’s exact test with the cutoff P-value of

171
0.1. The P-value indicates the likelihood of the uploaded gene list in a given pathway or
network being found together due to random chance (Zhang, 2014).
6.4 Results and discussion
The RNA sequencing data were single-end 130 nucleotide reads. Because there
was a dark cycle at cycle 86, the data were hard clipped at cycle 85. However, analysis
with and without the hard trim at 85 cycles revealed minimal difference in terms of reads
mapping uniquely.
On average, 15.9M reads per sample (13.7M-18.7M) were received. After
accounting for potential novel read islands, more than 85% of the reads mapped uniquely
and to a read island. Of the 15% reads that did not get counted, about 10% were to a
region without a defined feature (known or novel) and 5% did not map uniquely. A target
of more than 75% was the goal. A majority of the reads not mapping is due to genomic
contamination, bacterial/viral contamination, etc.
From RNA sequencing of liver at d26, there were 399 DEGs between control (C)
and DL-Met, 298 DEGs between C and L-Met and 423 DEGs between C and DL-
HMTBA. Among these genes, there were 107 DEGs in common between C and DL-Met,
L-Met and DL-HMTBA. Only 2 genes were differentially expressed between DL-Met
and L-Met. No DEGs were found between DL-HMTBA and DL-Met, and DL-HMTBA
and L-Met (Figure 6.1).
The top up- and down-regulated genes comparing between C and the other
treatment groups are listed in Table 6.1A-C. The common genes among them are shown
in Table 6.1D. Three of the common top down-regulated genes were SLC1A6 (EAAT4),
which is a transporter of glutamate and aspartate, OVCH2 (ovochymase 2 or oviductin),

172
which has serine-type endopeptidase activity and HMP19, which is similar to the HMP19
(a 19 kD encoding protein) in humans. A common top up-regulated gene was FKBP1B
(FK506 binding protein 1B), which plays a role in basic cellular processes involving
protein folding and trafficking. Even in mammals and humans, there is little report about
the function or regulation of these genes. How these proteins relate to Met and Met
analogue transport and utilization remain unknown.
The two genes differentially expressed between DL-Met and L-Met were FYVE,
RhoGEF and PH domain containing 3 (FGD3) and Troponin C type 1 (slow) (TNNC1).
FGD3 was expressed greater in DL-Met fed chickens than L-Met fed chickens (P =
0.079). It is a guanyl nucleotide exchange factor that exchanges bound GDP for free GTP
and plays a role in regulating the actin cytoskeleton and cell shape. TNNC1 was also
expressed greater in DL-Met fed chickens than L-Met fed chickens (P = 0.079). Troponin
C type 1 is encoded by the TNNC1 gene. Troponin C is the central regulatory protein of
striated muscle contraction.
All the DEGs were subjected to pathway analysis and the top associated pathways
related to diseases and disorders, molecular and cellular functions, and physiological
system development and functions containing the DEGs in each comparison group are
shown in Table 6.2.
Through IPA analysis, the top regulated canonical pathways were identified in
each comparison group, with the threshold of -log (p-value) ≥ 1.5, shown in Figure 6.2A-
C. The canonical pathways revealed that are directly related to Met metabolism are the
superpathway of methionine degradation and the methionine salvage pathway. When
comparing L-Met and C, there were 3 genes in the superpathway of methionine

173
degradation that met the cutoff criteria: BHMT (betaine--homocysteine S-
methyltransferase), CTH (cystathionase, cystathionine gamma-lyase) and PCCA
(propionyl CoA carboxylase, alpha polypeptide) (Table 6.3A). When comparing DL-
HMTBA and C, there were 2 genes in the methionine salvage pathway that had
differential expression: BHMT and MTR (5-methyl-tetrahydrofolate-homocysteine
methyltransferase) (Table 6.3B). All of these genes encode a cytoplasmic enzyme.
BHMT catalyzes the conversion of betaine and homocysteine to dimethylglycine and
Met, respectively. CTH catalyzes the conversion of cystathione derived from Met into
cysteine in the transsulfuration pathway. PCCA catalyzes the carboxylation reaction of
propionyl CoA. MTR catalyzes the final step in Met biosynthesis. Their location in the
corresponding pathways are shown in Figure 6.3A-B, highlighted with colored diamonds.
In summary, the RNA sequencing data provided a global analysis of hepatic gene
expression. A total of 745 DGEs between DL-Met, L-Met, or DL-HMTBA and C were
identified. Interestingly there were only two genes (FGD3 and TNNC1) that were
differentially expressed between DL-Met and L-Met and none between DL-Met and DL-
HMTBA or L-Met and DL-HMTBA. A total of 107 genes were differentially expressed
in common between one of the dietary Met supplemental groups (DL-Met, L-Met or DL-
HMTBA) and C. The gene BHMT in the methionine degradation pathway, which
encodes a cytosolic enzyme that catalyzes the conversion of homocysteine to Met, was
down regulated in both DL-HMTBA and L-Met compared with C. Down regulation of
this gene would be expected to decrease the endogenous production of Met, which makes
sense since there is sufficient Met available from the diet in the Met supplementation
groups. In conclusion, Met deficiency greatly altered the hepatic gene expression profile.

174
However, different dietary supplemental Met sources had only minimal impact on overall
hepatic gene expression in broiler chickens.

175
LITERATURE CITED
Aronesty, E. 2011. ea-utils: "Command-line tools for processing biological sequencing
data". Retrieved from http://code.google.com/p/ea-utils
Anders, S., P. T. Pyl, and W. Huber. 2015. HTSeq--a Python framework to work with
high-throughput sequencing data. Bioinformatics 31: 166-169.
Ghosh, S., and C. K. Chan. 2016. Analysis of RNA-Seq data using TopHat and Cufflinks.
Methods Mol Biol 1374: 339-361.
Han, Y., S. Gao, K. Muegge, W. Zhang, and B. Zhou. 2015. Advanced applications of
RNA sequencing and challenges. Bioinform Biol Insights 9: 29-46.
Kong, Y. 2011. Btrim: a fast, lightweight adapter and quality trimming program for next-
generation sequencing technologies. Genomics 98: 152-153.
Langmead, B., and S. L. Salzberg. 2012. Fast gapped-read alignment with Bowtie 2. Nat
Methods 9: 357-359.
Love, M. I., W. Huber, and S. Anders. 2014. Moderated estimation of fold change and
dispersion for RNA-seq data with DESeq2. Genome Biol 15: 550.
Wang, Z., M. Gerstein, and M. Snyder. 2009. RNA-Seq: a revolutionary tool for
transcriptomics. Nat Rev Genet 10: 57-63.
Zhang, W. 2014. Neurological-molecular interface in food intake and metabolism in birds
and mammals (Doctoral thesis, Virginia Polytechnic Institute and State University,
Blacksburg, USA). Retrieved from https://vtechworks.lib.vt.edu/handle/10919/64416

176
Table 6.1 Top differentially expressed hepatic genes in chickens fed different
supplemental methionine sources compared to methionine deficient group.
(A) DL-methionine (DL-Met) fed chickens vs. control group.
Up-regulated Genes Down-regulated Genes
Genes1 Genebank ID Fold change Genes2 Genebank ID Fold change
DPP10 XM_422126.5 2.353 OVCH2 XM_015286412.1 -3.787
SHROOM3 XM_004941163.2 2.277 SLC1A6 XM_015299799.1 -2.820
COL4A4 XM_015276987.1 2.061 MYOM1 XM_015277934.1 -2.621
FKBP1B XM_015284949.1 2.028 HMP19 BM491299.1 -2.589
CDKN2B NM_204433.1 1.960 ATP13A5 XM_015291588.1 -2.450
ADAMTSL1 XM_004949124.2 1.957 ATP2B2 XM_015293477.1 -2.404
CYR61 NM_001031563.1 1.899 THSD7B XM_015289897.1 -2.319
OSBPL3 XM_015281839.1 1.868 IL22RA2 XM_001233761.4 -1.995
PKP2 XM_416362.5 1.780 KIAA1107 XM_015290685.1 -1.832
CDH17 XM_015282915.1 1.755 CA4 XM_415893.5 -1.760
1 DPP10: dipeptidyl-peptidase 10; SHROOM3: shroom family member 3; COL4A4: collagen, type IV,
alpha 4; FKBP1B: FK506 binding protein 1B; CDKN2B: cyclin-dependent kinase inhibitor 2B (p15,
inhibits CDK4); ADAMTSL1: ADAMTS-like 1; CYR61: cysteine rich angiogenic inducer 61; OSBPL3:
oxysterol binding protein-like 3; PKP2: plakophilin 2; CDH17: cadherin 17, LI cadherin (liver-intestine).
2 OVCH2: ovochymase 2; SLC1A6: solute carrier family 1 (high affinity aspartate/glutamate transporter),
member 6, EAAT4; MYOM1: myomesin 1; HMP19: similar to human HMP19 protein; ATP13A5:
ATPase type 13A5; ATP2B2: ATPase, Ca++ transporting, plasma membrane 2; THSD7B: thrombospondin,
type I, domain containing 7B; IL22RA2: interleukin 22 receptor, alpha 2; KIAA1107: coding protein, also
known as BTBD8; CA4: carbonic anhydrase IV.

177
(B) L-methionine (L-Met) fed chickens vs. control group.
Up-regulated Genes Down-regulated Genes
Genes1 Genebank ID Fold change Genes2 Genebank ID Fold change
SHROOM3 XM_004941163.2 1.935 OVCH2 XM_015286412.1 -3.148
DPP10 XM_422126.5 1.672 MYOM1 XM_015277934.1 -2.664
DHDH XM_015273067.1 1.671 SLC1A6 XM_015299799.1 -2.406
FKBP1B XM_015284949.1 1.660 HMP19 BM491299.1 -1.983
GUCY1A2 XM_001233953.4 1.632 ERMAP Not accessible -1.963
CPE XM_420392.5 1.593 IL22RA2 XM_001233761.4 -1.945
HLA-A NM_001245061.1 1.561 GUCY2C XM_416207.5 -1.835
PITX2 NM_205010.1 1.509 RBM11 XM_416676.5 -1.752
ETV7 XM_004934884.2 1.507 GLOD5 XM_001234978.3 -1.728
DOC2B XM_004946708.2 1.457 FBP2 XM_425039.5 -1.716
1 SHROOM3: shroom family member 3; DPP10: dipeptidyl-peptidase 10; DHDH: dihydrodiol
dehydrogenase; FKBP1B: FK506 binding protein 1B; GUCY1A2: guanylate cyclase 1, soluble, alpha 2;
CPE: carboxypeptidase E; HLA-A: major histocompatibility complex, class II, alpha; PITX2: paired-like
homeodomain 2; ETV7: ets variant 7; DOC2B: double C2-like domains, beta.
2 OVCH2: ovochymase 2; MYOM1: myomesin 1; SLC1A6: solute carrier family 1 (high affinity
aspartate/glutamate transporter), member 6, EAAT4; HMP19: similar to human HMP19 protein; ERMAP:
similar to human erythroblast membrane associated protein; IL22RA2: interleukin 22 receptor, alpha 2;
GUCY2C: guanylate cyclase 2C; RBM11: RNA binding motif protein 11; GLOD5: glyoxalase domain
containing 5; FBP2: fructose-1,6-bisphosphatase 2.

178
(C) DL-2-hydroxy-4-(methylthio) butanoic acid (DL-HMTBA) fed chickens vs. control
group.
Up-regulated Genes Down-regulated Genes
Genes1 Genebank ID Fold change Genes2 Genebank ID Fold change
OSBPL3 XM_015281839.1 2.669 OVCH2 XM_015286412.1 -3.204
ZFHX3 NM_001293088.1 2.594 MYOM1 XM_015277934.1 -2.800
ANXA13 NM_001199501.1 2.320 HEMGN XM_430508.5 -2.404
DAB1 NM_204238.1 2.002 HMP19 BM491299.1 -2.359
RERG XM_416404.5 1.920 GLOD5 XM_001234978.3 -2.333
GUCA2A NM_001197038.1 1.890 NAAA XM_015276425.1 -2.142
FKBP1B XM_015284949.1 1.826 ATP13A5 XM_015291588.1 -2.141
KRT20 NM_001277981.1 1.785 GUCY2C XM_416207.5 -2.097
ALDH1A3 NM_204669.1 1.772 SLC1A6 XM_015299799.1 -2.088
GUCY1A2 XM_001233953.4 1.756 ACTN2 NM_205323.1 -2.003
1 OSBPL3: oxysterol binding protein-like 3; ZFHX3: zinc finger homeobox 3; ANXA13: annexin A13;
DAB1: Dab, reelin signal transducer, homolog 1 (Drosophila); RERG: RAS-like, estrogen-regulated,
growth inhibitor; GUCA2A: guanylate cyclase activator 2B (uroguanylin); FKBP1B: FK506 binding
protein 1B; KRT20: keratin 20; ALDH1A3: aldehyde dehydrogenase 1 family, member A3; GUCY1A2:
guanylate cyclase 1, soluble, alpha 2.
2 OVCH2: ovochymase 2; MYOM1: myomesin 1; HEMGN: hemogen; HMP19: similar to human HMP19
protein; GLOD5: glyoxalase domain containing 5; NAAA: N-acylethanolamine acid amidase; ATP13A5:
ATPase type 13A5; GUCY2C: guanylate cyclase 2C; SLC1A6: solute carrier family 1 (high affinity
aspartate/glutamate transporter), member 6, EAAT4; ACTN2: actinin, alpha 2.

179
(D) Summary of the common 10 most up- and down-regulated genes.
Common Up-regulated Genes1
Genes DL-Met vs. control L-Met vs. control DL-HMTBA vs. control
DPP10 + +
SHROOM3 + +
FKBP1B + + +
GUCY1A2 + +
Common Down-regulated Genes2
Genes DL-Met vs. control L-Met vs. control DL-HMTBA vs. control
OVCH2 + + +
SLC1A6 + + +
MYOM1 + + +
HMP19 + + +
GUCY2C + +
IL22RA2 + +
ATP13A5 + +
1 DPP10: dipeptidyl-peptidase 10; SHROOM3: shroom family member 3; FKBP1B: FK506 binding
protein 1B; GUCY1A2: guanylate cyclase 1, soluble, alpha 2.
Control: 0.78% Met+Cys for starter diet, 0.70% Met+Cys for grower diet and 0.62% Met+Cys for finisher
diet; DL-Met: basal diet supplemented with 0.22% DL-methionine; L-Met: basal diet supplemented with
0.22% L-methionine; DL-HMTBA: basal diet supplemented with 0.31% DL-2-hydroxy-4-methylthio
butanoic acid.
2 OVCH2: ovochymase 2; SLC1A6: solute carrier family 1 (high affinity aspartate/glutamate transporter),
member 6, EAAT4; MYOM1: myomesin 1; HMP19: similar to human HMP19 protein; GUCY2C:
guanylate cyclase 2C; IL22RA2: interleukin 22 receptor, alpha 2; ATP13A5: ATPase type 13A5.

180
Table 6.2. Top diseases and Bio Functions in liver from chickens fed different
supplemental methionine sources compared to methionine deficient group based on
prediction analysis of differentially-expressed genes through RNA sequencing.
(A) DL-methionine (DL-Met) fed chickens vs. control group:
Diseases and Disorders
Name p-value # Genes
Cardiovascular Disease 4.01E-05 - 2.92E-02 28
Organismal Injury and Abnormalities 4.01E-05 - 2.92E-02 117
Endocrine System Disorders 4.54E-05 - 2.67E-02 30
Gastrointestinal Disease 4.54E-05 - 2.92E-02 46
Cancer 1.31E-04 - 2.92E-02 181
Molecular and Cellular Functions
Name p-value # Genes
Cellular Growth and Proliferation 4.54E-05 - 2.92E-02 39
Cell-To-Cell Signaling and Interaction 1.30E-04 - 2.92E-02 35
Cellular Movement 5.10E-04 - 2.92E-02 32
Cell Morphology 6.88E-04 - 2.92E-02 46
Cellular Assembly and Organization 6.88E-04 - 2.92E-02 43
Physiological System Development and Function
Name p-value # Genes
Embryonic Development 4.54E-05 - 2.92E-02 50
Skeletal and Muscular System Development and
Function
1.30E-04 - 2.92E-02 35
Tissue Development 1.30E-04 - 2.92E-02 68
Hematological System Development and Function 2.36E-04 - 2.92E-02 24
Organismal Development 2.36E-04 - 2.92E-02 60

181
(B) L-methionine (L-Met) fed chickens vs. control group.
Diseases and Disorders
Name p-value # Genes
Gastrointestinal Disease 6.05E-04 - 4.53E-02 96
Cancer 7.00E-04 - 4.06E-02 173
Metabolic Disease 1.08E-03 - 3.68E-02 21
Organismal Injury and Abnormalities 1.08E-03 - 4.53E-02 69
Renal and Urological Disease 1.08E-03 - 2.87E-02 15
Molecular and Cellular Functions
Name p-value # Genes
Cellular Development 6.05E-04 - 3.95E-02 17
Carbohydrate Metabolism 1.79E-03 - 3.39E-02 14
Cell-To-Cell Signaling and Interaction 1.79E-03 - 4.61E-02 24
Cellular Growth and Proliferation 3.00E-03 - 2.47E-02 14
Lipid Metabolism 3.51E-03 - 3.91E-02 14
Physiological System Development and Function
Name p-value # Genes
Digestive System Development and Function 6.05E-04 - 4.69E-02 13
Embryonic Development 6.05E-04 - 4.69E-02 24
Organ Development 6.05E-04 - 4.69E-02 26
Organismal Development 6.05E-04 - 4.69E-02 32
Tissue Development 6.05E-04 - 4.69E-02 37

182
(C) DL-2-hydroxy-4-(methylthio) butanoic acid (DL-HMTBA) fed chickens vs. control
group:
Diseases and Disorders
Name p-value # Genes
Cancer 4.56E-09 - 3.28E-02 238
Organismal Injury and Abnormalities 4.56E-09 - 3.31E-02 151
Reproductive System Disease 4.56E-09 - 3.31E-02 137
Gastrointestinal Disease 2.51E-05 - 3.31E-02 125
Hereditary Disorder 3.58E-05 - 3.31E-02 52
Molecular and Cellular Functions
Name p-value # Genes
Cell Cycle 2.06E-07 - 3.31E-02 52
Cellular Assembly and Organization 3.36E-07 - 3.31E-02 75
DNA Replication, Recombination, and Repair 3.36E-07 - 3.31E-02 23
Cellular Movement 1.46E-05 - 3.07E-02 58
Cellular Function and Maintenance 3.49E-04 - 3.04E-02 62
Physiological System Development and Function
Name p-value # Genes
Tissue Morphology 3.25E-05 - 3.31E-02 38
Endocrine System Development and Function 1.40E-04 - 1.82E-02 4
Tissue Development 1.40E-04 - 3.31E-02 85
Organ Morphology 2.56E-04 - 3.31E-02 36
Skeletal and Muscular System Development and
Function
2.56E-04 - 3.31E-02 31
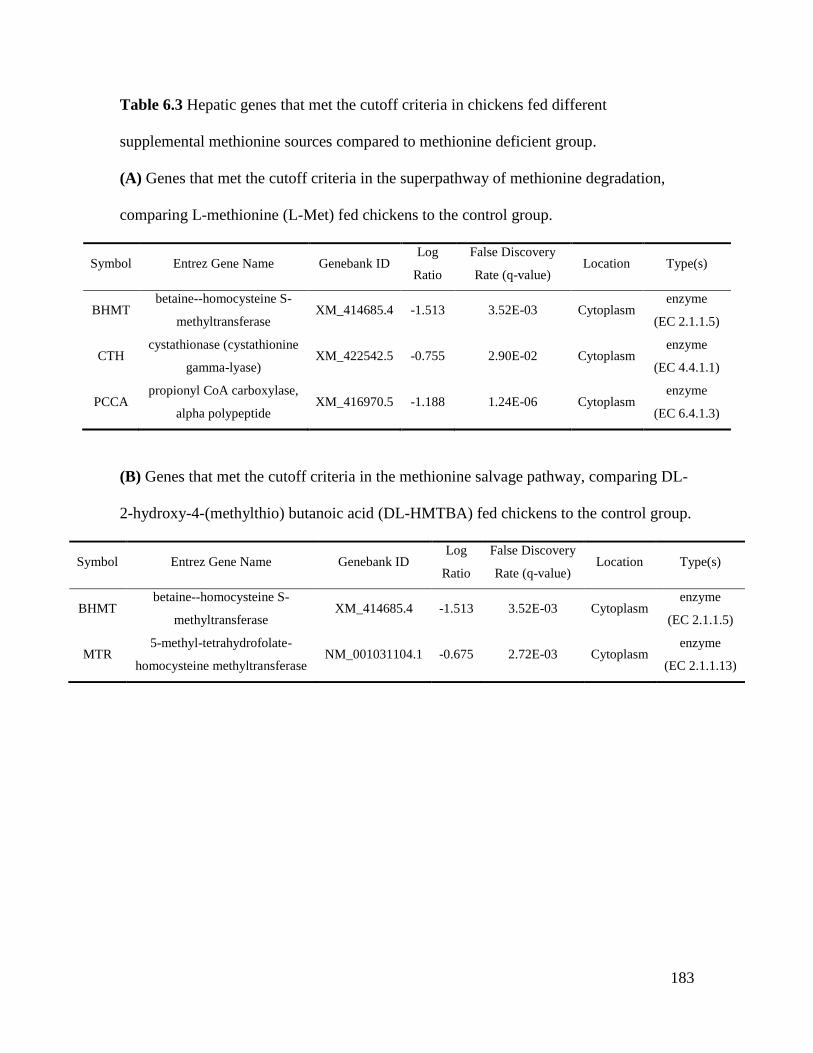
183
Table 6.3 Hepatic genes that met the cutoff criteria in chickens fed different
supplemental methionine sources compared to methionine deficient group.
(A) Genes that met the cutoff criteria in the superpathway of methionine degradation,
comparing L-methionine (L-Met) fed chickens to the control group.
Symbol Entrez Gene Name Genebank ID Log
Ratio
False Discovery
Rate (q-value) Location Type(s)
BHMT betaine--homocysteine S-
methyltransferase XM_414685.4 -1.513 3.52E-03 Cytoplasm
enzyme
(EC 2.1.1.5)
CTH cystathionase (cystathionine
gamma-lyase) XM_422542.5 -0.755 2.90E-02 Cytoplasm
enzyme
(EC 4.4.1.1)
PCCA propionyl CoA carboxylase,
alpha polypeptide XM_416970.5 -1.188 1.24E-06 Cytoplasm
enzyme
(EC 6.4.1.3)
(B) Genes that met the cutoff criteria in the methionine salvage pathway, comparing DL-
2-hydroxy-4-(methylthio) butanoic acid (DL-HMTBA) fed chickens to the control group.
Symbol Entrez Gene Name Genebank ID Log
Ratio
False Discovery
Rate (q-value) Location Type(s)
BHMT betaine--homocysteine S-
methyltransferase XM_414685.4 -1.513 3.52E-03 Cytoplasm
enzyme
(EC 2.1.1.5)
MTR 5-methyl-tetrahydrofolate-
homocysteine methyltransferase NM_001031104.1 -0.675 2.72E-03 Cytoplasm
enzyme
(EC 2.1.1.13)

184
Figure 6.1 Venn diagrams for differentially expressed hepatic genes in chickens fed
different supplemental methionine sources compared to methionine deficient group and
their overlapping genes. Male broiler chickens were fed the diet deficient in Met+Cys
(C), or the same diet supplemented with 0.22% DL-methionine (DL-Met), 0.22% L-
methionine (L-Met) or 0.31% DL-2-hydroxy-4-(methylthio) butanoic acid (DL-HMTBA)
and liver samples were collect at day 26 (n=4). Numbers of differentially expressed
hepatic genes are shown for each group.

185

186
Figure 6.2. Top canonical pathways in liver from chickens fed different supplemental
methionine sources compared to methionine deficient group. (-log (p-value) ≥ 1.5 as the
threshold). (A) DL-methionine (DL-Met) fed chickens vs. control group. (B) L-
methionine (L-Met) fed chickens vs. control group. (C) DL-2-hydroxy-4-(methylthio)
butanoic acid (DL-HMTBA) fed chickens vs. control group. The length of the bar
indicates the significance level of the pathway. The line indicates the ratio of numbers of
genes that met the cutoff criteria / the total number of genes that make up that pathway.

187
(A)

188
Figure 6.3 Superpathway of methionine degradation (A) and methionine salvage
pathway (B) with genes highlighted that met the cutoff criteria. Genes with differential
expression are marked with colored diamonds when comparing L-methionine (L-Met)
fed chickens to the control group (C), and comparing DL-2-hydroxy-4-(methylthio)
butanoic acid (DL-HMTBA) fed chickens to the control group (B).
(B)

189
CHAPTER 7 Epilogue
The research on methionine (Met) isomers and its analogue DL-2-hydroxy-4-
(methylthio) butanoic acid (DL-HMTBA) in poultry nutrition has increased in the last 50
years. Most of the studies focused on the relative efficacy between the common
supplementation forms DL-Met and DL-HMTBA in poultry. In recent years, an
increasing number of studies are investigating the metabolism of these Met sources and
the related underlying mechanisms. In this dissertation, three treatment diets L-Met, DL-
Met or DL-HMTBA were fed in a broiler chicken trial. A Met deficient group was set as
control. The recommended minimum methionine plus cysteine (Met + Cys) levels for
Cobb-500 broilers in starter, grower and finisher diets are 0.98%, 0.89% and 0.82%,
respectively. In our basal diet, the Met + Cys levels are 0.78%, 0.70% and 0.62% for
starter, grower and finisher diets respectively (Table A), with an approximate difference
of 0.2%. This amount of deficiency caused an obvious growth restriction. Based on the
diet formula, these three dietary Met sources were expected to be equally efficacious. The
growth performance data showed that these supplementations were equivalent, with no
significant differences in body weight gain, feed conversion ratio and relative breast
muscle weight between the three treatments. The objective of this dissertation was to
explore the underlying physiological and biochemical changes affected by these four
treatment groups.
Our primary interest was on the intestinal uptake of these dietary Met sources,
which is the prerequisite before they can be utilized by cells (Figure 7.1). As an organic
acid, a large proportion of DL-HMTBA is absorbed through diffusion. Even though,
carrier dependent uptake is still an important mechanism to transport these three Met
190
sources. Therefore, the transporter gene expression was expected to be influenced by
dietary Met supplementation. However, only a few amino acid transporter genes were
affected, e.g., the neutral amino acid transporter ATB0,+ was upregulated by both DL-Met
and L-Met supplementation compared to control in duodenum. The monocarboxylic acid
transporter MCT1 was upregulated by supplementation with all three Met sources
compared to control in jejunum. Because gene expression of intestinal nutrient
transporters is usually segment- and age- dependent, there were complex regulation
effects of nutrient transporter gene expression by the dietary supplemental Met sources.
The conversion of L-HMTBA, D-HMTBA and D-Met to the L-Met isoform was
the next process we were interested in (Figure 7.1). Because L-Met is the metabolically
active Met form animals can use, either DL-HMTBA or D-Met must undergo oxidation
and transamination steps to be converted into L-Met. Oxidation is the limiting step and
different substrates are catalyzed by their corresponding oxidases. Even though DL-
HMTBA and L-Met supplementation showed greater hepatic HAO1 (gene encodes L-
HMTBA oxidase) gene expression, the treatment effects for all oxidases and
transaminases were complex. Similar to the nutrient transporter gene expression, this was
due to the interaction with tissue effects and age effects. For the three oxidases that
convert D-Met, L-HMTBA and D-HMTBA, the in situ hybridization assay demonstrated
similar tissue distribution pattern for mRNA as that shown by real-time PCR assay, but
no significant results among treatments. The enzymatic activity assay also exhibited non-
significant treatment effects on protein expression. The tissue distribution patterns of
protein expression were different from those of mRNA expression. Nevertheless, the in
situ hybridization for L-HMTBA oxidase gene HAO1 and D-HMTBA oxidase gene

191
LDHD showed some interesting findings. In the small intestine, both mRNAs are more
abundant in epithelia and in crypts, with decreasing expression towards the villus tips.
Based on the mRNA localization in different tissues, we can also conclude that liver is
the major tissue for mRNA expression of both D- and L-HMTBA oxidases, while the
small intestine can express high levels of D-HMTBA oxidase mRNA. Theoretically, D-
Met accounts for 50% of the components in DL-Met. It was reported that D-Met has 90%
relative bioavailability compared to the L-isomer in chickens (Data from Baker, D.H.
(1994). Utilization of precursors of L-amino acids. In: Amino Acids in Farm Animal
Nutrition (J. P. F. D’ Mello, Ed.), CAB Int’l, London, pp. 37-63.). Thus the D-isomer in
DL-Met can be greatly converted, leading to the roughly equivalent bio-efficacy between
DL-Met and L-Met.
An in vitro study was conducted to further identify the expression of the intestinal
nutrient transporter and Met oxidase gene. The gene expression pattern observed in the
animal trial was not replicated in the in vitro cultured tissue explants. Thus in vitro
cultured explants may not be a good model for our in vivo chicken trial.
As the product of D-Met and DL-HMTBA conversion, L-Met can go into either
the transmethylation cycle or transsulfuration pathway for metabolism (Figure 7.1). S-
adenosylmethionine (SAM) is an intermediate from the transmethylation cycle and is the
major methyl donor in cells. Therefore, the hepatic DNA methylation and
methyltransferase activity in different treatments were measured, revealing that dietary
supplemental Met sources had no significant effects on DNA methylation in liver of
broiler chickens.

192
In regulation of cell function and metabolism, L-Met mainly plays three roles: 1)
precursors for protein synthesis, 2) antioxidant function (the reactive oxygen species
(ROS) scavengers glutathione (GSH) and cysteine are all intermediates in the
transsulfuration pathway, see Figure 1.1), and 3) nutrient signaling to affect intracellular
kinases. Thus the goal was to explore whether different dietary supplemental Met sources
and Met deficiency can also affect these roles.
To check the effect of dietary Met sources and Met deficiency on protein
synthesis, a potential idea was to examine the first step of mRNA translation in which
Met is mainly involved. More specifically, we can measure the expression of translation
initiator methionyl-tRNA (Met-tRNAi) under different treatment groups. Due to technical
limitations, this has not been conducted yet and can act as a future research direction.
To check the effect of dietary Met sources and Met deficiency on antioxidant
function, some oxidative stress markers were examined. There were no significant
treatment effects for those markers, which includes the thiol redox status (ratio of reduced
GSH to total GSH), protein oxidation (protein carbonyl level), lipid peroxidation
(thiobarbituric acid reactive substances level) and ferric antioxidant power. However, in
breast muscle, both L-Met and DL-HMTBA supplementation to the Met deficient diet
increased total GSH level, which indicates an improvement in intracellular antioxidant
capacity to some extent. Moreover, some blood/plasma parameters related to oxidative
stress were evaluated. Although neither white blood cell differential count nor red blood
cell packed cell volume was affected by Met sources, L-Met and DL-Met
supplementation reduced acute phase protein serum amyloid A level compared to control,
193
but DL-HMTBA did not. In summary, dietary Met supplementation especially L-Met
supplementation can cause some changes in the antioxidant function of Met.
To check the effect of dietary Met sources and Met deficiency on nutrient
signaling, our target intracellular kinase is the 70-kDa ribosomal protein S6 kinase
(p70S6K), which is an effector of the extensively explored mammalian target of
rapamycin (mTOR) pathway (Figure 7.2). p70S6K was chosen also because there was a
slight change in duodenum for the amino acid sensor SAT2 gene expression, and SAT2
most likely functions through the mTOR/p70S6K pathway. DL-HMTBA
supplementation decreased the expression of phosphorylated p70S6K in jejunum
compared to control, indicating reduced protein synthesis. This result was not expected.
Since there exist other downstream effectors of mTOR, such as eukaryotic initiation
factor 4E binding protein (4E-BP1), and the mTOR-independent effectors, such as
eukaryotic initiation factor 2α (eIF2α), the co-function of these factors and the influence
between these multiple pathways may lead to a final explanation (Figure 7.2). The
phosphatidylinositide 3-kinases (PI3K) that participate in the amino acid signaling
pathway to affect protein degradation can also interact with mTOR (Figure 7.2). As a
result, a reasonable follow-up study for this project would be checking the protein
expression of these potential factors (4E-BP1, eIF2α, PI3K, mTOR, etc.) in treatments
with different dietary Met sources compared to the Met deficient group. This would be
beneficial to better understand the role of different Met sources as nutrient signals to
affect intracellular kinases and protein turnover.
To summarize the above results, the different dietary supplemental Met sources
L-Met, DL-Met and DL-HMTBA exhibited great similarity in impacting intestinal amino

194
acid/peptide/monocarboxylic acid transporter gene expression and Met converting
enzyme activity in male broiler chickens. The regulation roles of Met as antioxidant and
nutrient signaling in cell metabolism were not affected by different dietary supplemental
Met sources (Figure 7.1). These conclusions were further validated by our RNA
sequencing results in liver. Few differentially expressed hepatic genes were found
between L-Met, DL-Met and DL-HMTBA fed chickens. However, Met deficiency of
~0.2% altered the mRNA expression of distinct nutrient transporters (e.g., MCT1) and
Met converting enzymes (e.g., DAO) compared to the Met sufficient groups. The RNA
sequencing results also identified more than 700 differentially expressed genes in liver
when comparing the control group with the three Met supplemental groups.
Sulfur amino acids especially Met play a vital role in animal growth and
development. Understanding the underlying mechanisms of how different supplemental
Met sources affect animals can greatly benefit the animal nutrition industry, particularly
the poultry industry. Our results demonstrated that both DL-Met and DL-HMTBA can
act as effective supplemental Met sources in broiler chicken diets, considering that they
showed very similar effects on many physiological and biochemical aspects compared to
the metabolically active Met form L-Met. Moreover, some recent studies are focusing on
the clinical utilization of amino acids as dietary supplements in humans, aiming to
minimize the loss of muscle mass and impaired immune function. Our study on
mechanisms have the potential to be extended into the biomedical research area, and may
contribute to future studies using other animal models to promote the health of humans.
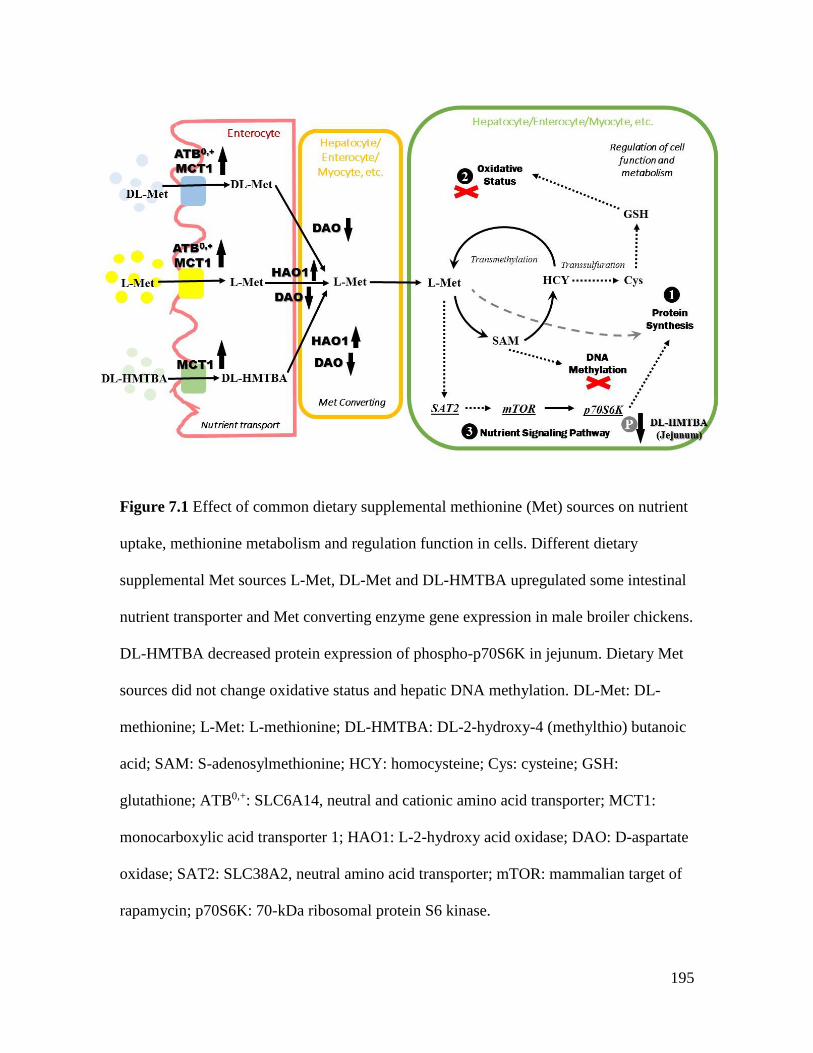
195
Figure 7.1 Effect of common dietary supplemental methionine (Met) sources on nutrient
uptake, methionine metabolism and regulation function in cells. Different dietary
supplemental Met sources L-Met, DL-Met and DL-HMTBA upregulated some intestinal
nutrient transporter and Met converting enzyme gene expression in male broiler chickens.
DL-HMTBA decreased protein expression of phospho-p70S6K in jejunum. Dietary Met
sources did not change oxidative status and hepatic DNA methylation. DL-Met: DL-
methionine; L-Met: L-methionine; DL-HMTBA: DL-2-hydroxy-4 (methylthio) butanoic
acid; SAM: S-adenosylmethionine; HCY: homocysteine; Cys: cysteine; GSH:
glutathione; ATB0,+: SLC6A14, neutral and cationic amino acid transporter; MCT1:
monocarboxylic acid transporter 1; HAO1: L-2-hydroxy acid oxidase; DAO: D-aspartate
oxidase; SAT2: SLC38A2, neutral amino acid transporter; mTOR: mammalian target of
rapamycin; p70S6K: 70-kDa ribosomal protein S6 kinase.

196
Figure 7.2 Pathways for amino acids as nutrient signals to affect protein turnover. SAT2:
SLC38A2, neutral amino acid transporter; mTOR: mammalian target of rapamycin;
p70S6K: 70-kDa ribosomal protein S6 kinase; 4E-BP1: eukaryotic initiation factor 4E
binding protein; eIF2α: eukaryotic initiation factor 2α; PI3K: phosphatidylinositide 3-
kinases.

197
APPENDIX A
Table A. Chemical composition and amino acid profile of the trial diets of the different
growth phases.
Basal diet Starter (d0 to d10) Grower (d11 to d21) Finisher (d22 to d35)
Ingredients (%)
Soybean meal, 48% CP 30.2 26.3 24.4
Wheat 32.9 23.8 28.0
Corn 20.0 20.0 20.0
Peas / 17.0 17.0
Corn gluten meal, 60% CP 6.65 2.62 /
Soybean oil 4.43 5.86 6.27
Dicalcium phosphate 1.92 1.89 1.91
Vitamin-mineral premix1 1.00 1.00 1.00
Limestone (CaCO3) 1.00 0.93 0.94
L-lysine 0.61 0.13 0.03
Salt (NaCl) 0.27 0.27 0.27
Sodium bicarbonate 0.83 0.14 0.15
L-threonine 0.09 0.03 0.03
L-valine 0.05 / /
Coccidiostat 0.05 0.05 0.05
Calculated content (%)
ME (kcal/kg) 3035 3083 3107
DM 89.1 89.1 89.2
CP 24.6 22.2 20.1
Ca 1.04 1.00 1.00
Available P 0.50 0.50 0.50

198
Analytical
Value (%)
Starter
(d0 to d10)
Grower
(d11 to d21)
Finisher
(d22 to d35)
Treat
Nutrient C
DL-
Met L-Met
DL-
HMTBA C
DL-
Met L-Met
DL-
HMTBA C
DL-
Met L-Met
DL-
HMTBA
DM 88.0 88.0 88.0 88.0 88.0 88.0 88.0 88.0 88.0 88.0 88.0 88.0
CP 25.4 24.8 25.4 24.9 22.9 22.8 22.7 22.5 21.0 21.2 21.1 20.8
MET 0.38 0.60 0.61 0.37 0.33 0.55 0.55 0.32 0.28 0.51 0.52 0.28
CYS 0.40 0.40 0.40 0.40 0.37 0.36 0.36 0.37 0.34 0.34 0.33 0.34
M+C 0.78 1.01 1.01 0.78(0.98)2 0.70 0.91 0.91 0.69(0.89) 2 0.62 0.85 0.85 0.62(0.82) 2
LYS 1.45 1.47 1.46 1.44 1.27 1.26 1.27 1.25 1.13 1.15 1.13 1.11
THR 0.94 0.95 0.95 0.95 0.86 0.83 0.83 0.85 0.78 0.77 0.76 0.78
TRP - - - - - - - - - - -
ARG 1.51 1.50 1.50 1.47 1.51 1.47 1.49 1.46 1.40 1.40 1.38 1.37
ILE 1.09 1.07 1.09 1.03 1.01 0.99 1.01 0.98 0.90 0.93 0.92 0.88
LEU 2.28 2.26 2.29 2.20 1.92 1.87 1.92 1.90 1.61 1.63 1.61 1.59
VAL 1.24 1.21 1.23 1.17 1.10 1.08 1.11 1.06 0.98 1.01 1.02 0.96
HIS 0.61 0.60 0.61 0.59 0.57 0.56 0.57 0.56 0.52 0.53 0.52 0.51
PHE 1.31 1.29 1.31 1.27 1.19 1.16 1.18 1.18 1.05 1.07 1.05 1.05
TYR - - - - - - - - - - - -
GLY 0.97 0.96 0.97 0.95 0.93 0.92 0.93 0.92 0.86 0.87 0.86 0.85
SER 1.16 1.19 1.18 1.19 1.10 1.05 1.05 1.10 1.00 0.97 0.93 1.00
PRO 1.65 1.65 1.64 1.64 1.41 1.34 1.36 1.43 1.26 1.28 1.27 1.28
ALA 1.26 1.25 1.27 1.22 1.08 1.05 1.08 1.07 0.91 0.92 0.91 0.91
ASP 2.29 2.27 2.28 2.22 2.27 2.22 2.24 2.23 2.07 2.09 2.07 2.04
GLU 5.03 5.02 5.05 4.97 4.47 4.36 4.44 4.40 4.08 4.12 4.07 4.07
DM: dry matter; CP: crude protein; MET: methionine; CYS: cysteine; M+C: methionine + cysteine, the
values in brackets also considering DL-2-hydroxy-4-(methylthio) butanoic acid content; LYS: lysine; THR:
threonine; TRP: tryptophan; ARG: arginine; ILE: isoleucine; LEU: leucine; VAL: valine; HIS: histidine;
PHE: phenylalanine; TYR: tyrosine; GLY: glycine; SER: serine; PRO: proline; ALA: alanine; ASP:
aspartate; GLU: glutamate.
1 The vitamin-mineral premix supplied the following per kilogram of diet: 12,000 IU vitamin A (retinyl
acetate), 2,400 IU vitamin D3 (cholecalciferol), 50 mg vitamin E (DL-α-tocopherol), 1.5 mg vitamin K3
(menadione), 2.0 mg vitamin B1 (thiamine), 7.5 mg vitamin B2 (riboflavin), 3.5 mg vitamin B6 (pyridoxine-
HCl), 20 μg vitamin B12 (cyanocobalamin), 35 mg niacin, 10 mg D-pantothenic acid, 460 mg choline
chloride, 1.0 mg folic acid, 0.2 mg biotin, 267 mg ferrous sulfate, 48 mg copper sulfate, 142 mg manganese
oxide, 169 mg zinc sulfate, 1.1 mg potassium iodide, 0.33 mg sodium selenite.
2 Numbers in brackets shows results of a calculation to transform HMTBA content to the equivalent
Met+Cys content by multiplying the HMTBA content by 0.65 (bioavailability of HMTBA).

199
APPENDIX B
Table B. Experimental design for the animal trial, sampling and data collection.
Arrangements of animals and treatments in floor pens were illustrated in (A), and time
points to collect samples and perform assays were specified in (B).
(A)
Floor Pen
Number Treatments
Number of
Chickens
Floor Pen
Number Treatments
Number of
chickens
9B2 DL-HMTBA 10
Passage
10B2 DL-HMTBA 10
9B1 L-Met 10 10B1 L-Met 10
9A2 DL-Met 11 10A2 DL-Met 11
9A1 C 10 10A1 C 10
7D2 DL-HMTBA 11 8D2 DL-HMTBA 10
7D1 L-Met 9 8D1 L-Met 10
7C2 DL-Met 11 8C2 DL-Met 10
7C1 C 10 8C1 C 9
7B2 DL-HMTBA 10 8B2 DL-HMTBA 10
7B1 L-Met 10 8B1 L-Met 10
7A2 DL-Met 11 8A2 DL-Met 11
7A1 C 9 8A1 C 9

200
(B)
Items Day 0 Day 3 Day 5 Day 10 Day 21 Day 26 Day 35
Number of chickens euthanized 8 24 24 24 24 24 24
Individual body weight recorded × × × × × × ×
Small intestine sampled × × × × × × ×
Liver sampled × × × × × × ×
Breast muscle sampled × × ×
Carcass weight recorded × × × ×
Abdominal fat weight recorded × × × ×
Kidney weight recorded × × × ×
Liver weight recorded × × × ×
Heart weight recorded × × × ×
Empty small intestine weight recorded × × ×
Dry matter digestibility measured ×
Blood parameter measured × × ×
Acute phase protein level × ×
Intestinal nutrient transporter gene
expression × × × × × × ×
Methionine converting enzyme assay × × ×
In situ hybridization assay ×
Oxidative stress marker expression × ×
Western blot for p70S6K expression × × ×
RNA sequencing ×
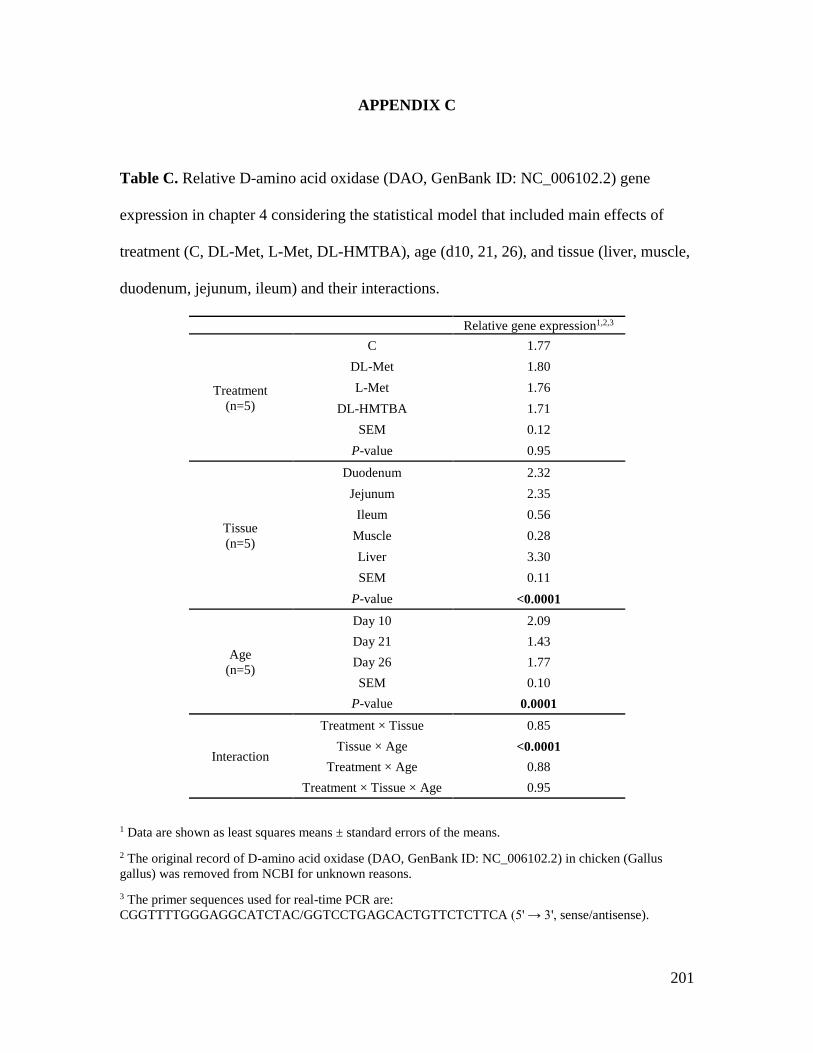
201
APPENDIX C
Table C. Relative D-amino acid oxidase (DAO, GenBank ID: NC_006102.2) gene
expression in chapter 4 considering the statistical model that included main effects of
treatment (C, DL-Met, L-Met, DL-HMTBA), age (d10, 21, 26), and tissue (liver, muscle,
duodenum, jejunum, ileum) and their interactions.
Relative gene expression1,2,3
Treatment
(n=5)
C 1.77
DL-Met 1.80
L-Met 1.76
DL-HMTBA 1.71
SEM 0.12
P-value 0.95
Tissue
(n=5)
Duodenum 2.32
Jejunum 2.35
Ileum 0.56
Muscle 0.28
Liver 3.30
SEM 0.11
P-value <0.0001
Age
(n=5)
Day 10 2.09
Day 21 1.43
Day 26 1.77
SEM 0.10
P-value 0.0001
Interaction
Treatment × Tissue 0.85
Tissue × Age <0.0001
Treatment × Age 0.88
Treatment × Tissue × Age 0.95
1 Data are shown as least squares means ± standard errors of the means.
2 The original record of D-amino acid oxidase (DAO, GenBank ID: NC_006102.2) in chicken (Gallus
gallus) was removed from NCBI for unknown reasons.
3 The primer sequences used for real-time PCR are:
CGGTTTTGGGAGGCATCTAC/GGTCCTGAGCACTGTTCTCTTCA (5' → 3', sense/antisense).