Physics 105 Physics for Decision Makers: The Global Energy Crisis Lecture 12 - Fossil Fuels Fall...
124
Physics 105 Physics for Decision Makers: The Global Energy Crisis Lecture 12 - Fossil Fuels Fall 2011
-
Upload
brendan-marshall -
Category
Documents
-
view
213 -
download
0
Transcript of Physics 105 Physics for Decision Makers: The Global Energy Crisis Lecture 12 - Fossil Fuels Fall...
Physics 105 Physics for Decision Makers:The Global Energy Crisis
Lecture 12 - Fossil Fuels
Fall 2011

Physics 105 – Fall 2011
Assignments
Energy Audit 3Assignment #3:
Prepare a report of your inventory of identified energy consumers gathered from your building walk thru. Include estimates of uncertainties in your numbers (we expect you to estimate, not count every light fixture, for example). Compare this to the measured consumption and give possible explanations for the discrepancies – what do you think you missed? Length: ~2 pages. Upload to ELMS. Due Date: Oct 13 (20 pts.)
Reading Assignment Finish - Chapter 5 Wolfson Post editorial about the Keystone XL pipeline (On Elms)
EXAM – Likely November 1

Physics 105 – Fall 2011
On this project my group members are doing a:1. A+ job2. A job3. B job4. C job5. no comment yet

Physics 105 – Fall 2011
As to reading chapter 5 of Wolfson
1. I have read it2. I have skimmed it3. I plan on reading it4. I don’t have the book5. I have the book but don’t plan on reading it

Physics 105 – Fall 2011
How I get to/around campus:
1. Bus2. Walk3. Bike4. Car5. Metro6. Bus/walk7. Bike/walk8. Car/bike9. Car/walk

Home heating - First Law vs. Second Law
First Law Efficiency:- Energy out/energy in Example: resistive electric heat ~ 100% efficient (1st
Law) Heating requires relatively low temperatures
(don’t want 500 deg air blowing out of ducts)- Need to go from Toutside
~ 273 K to Tinside ~ 300 K- Wouldn’t we be better off moving heat around, especially since the indoor and outdoor temperatures are not too different?
- Second Law Efficiency:- Energy of absolute best process (Carnot)/(energy in)- Tinside
/(Tinside-Toutside)=300 K/27k= 11 (Coefficient of Performance)
- Now electric heat is 9% efficient (2nd law) : We have lots of room for improvements!

Physics 105 – Fall 2011
My (parents) home is heated with…
1. Natural gas2. Propane3. Oil4. Electric (resistive) heat5. Heat Pump6. Solar7. I have no clue.

FurnacesOil -popular in New EnglandNatural gasPropane
Very efficient (1st Law)>90%
Not a lot of room for improvements
Home heating

Heat Pumps
Move heat from outside to inside ( a refrigerator run backwards - cooling the outdoors)

Heat Pumps
Rated with SEER rating (Seasonal Energy Efficiency rating)
SEER = ratio of seasonally averaged cooling power in BTU/h compared to Watts of electricity used (measured when used as air conditioner)
e.g. SEER of 16 produces almost 5X more cooling power than it uses in electricity
upgrading from SEER 9 to SEER 13, the power consumption is reduced by 30% (equal to 1 − 9/13) can save ~$300/yr
-remember - we are moving heat so we can have a 1st Law efficiency > 1!
-Why don’t we all have heat pumps?

A Cool Idea
Dig down 20 ft. and the ground temperature is about 55 F- Why not use this as a source of heat in the winter, and as a
place to dispose of heat in the summer?
Physics 105 – Fall 2011
FOSSIL FUELS
Page 12


Crude Oil Prices
Oil touches $140 a barrel Today $85 a barrel 1 barrel of oil = 42 US gallons

Gasoline Prices

Physics 105 – Fall 2011Marquee Lecture 4/12/11
How much do we (US) spend on oil?
The United States consumed 18.8 million barrels per day of petroleum products during 2009.
At the current price ~$100/barrel – this is ~$2B/day or $700B/yr
Discretionary spending US Govt.: $1.368 trillion - -$663.7 billion Department of Defense-Total US Government discretionary spending $700B/yr

Physics 105 – Fall 2011
How much would raising gas prices
$1/gallon cost the average US family?
1. $500/yr2. $1000/yr3. $1500/yr4. $2000/yr5. $2500/yr
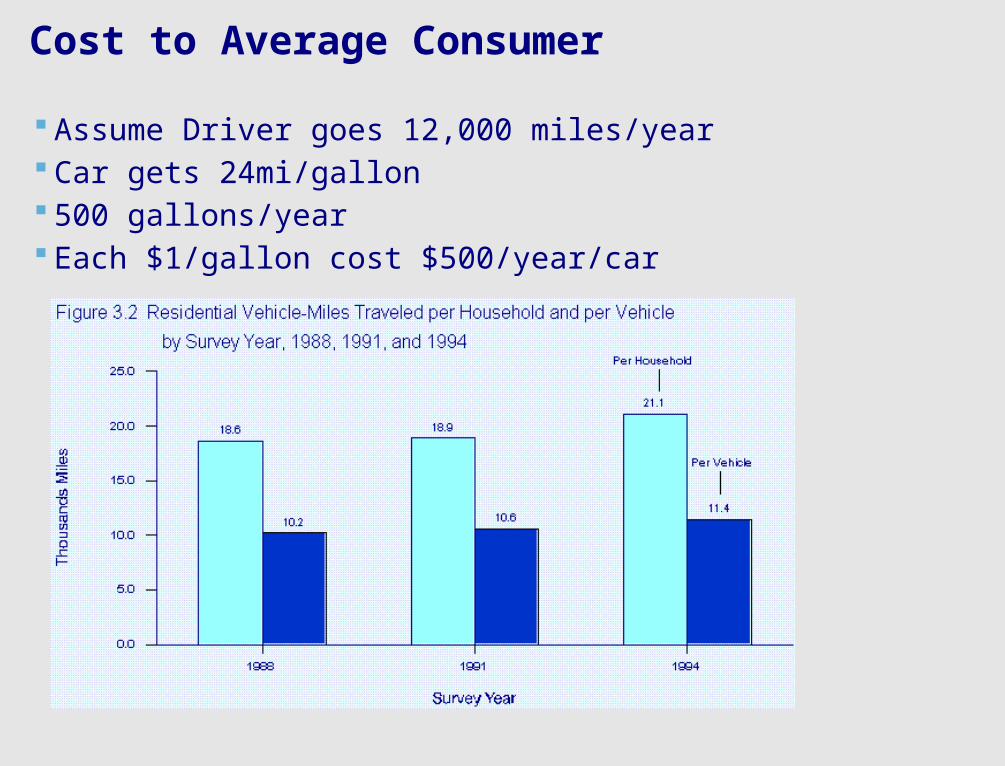
Cost to Average Consumer
Assume Driver goes 12,000 miles/year Car gets 24mi/gallon 500 gallons/year Each $1/gallon cost $500/year/car

Cost to Average Consumer
If you have 2 drivers per family $1,000 year

Cost to Average Consumer
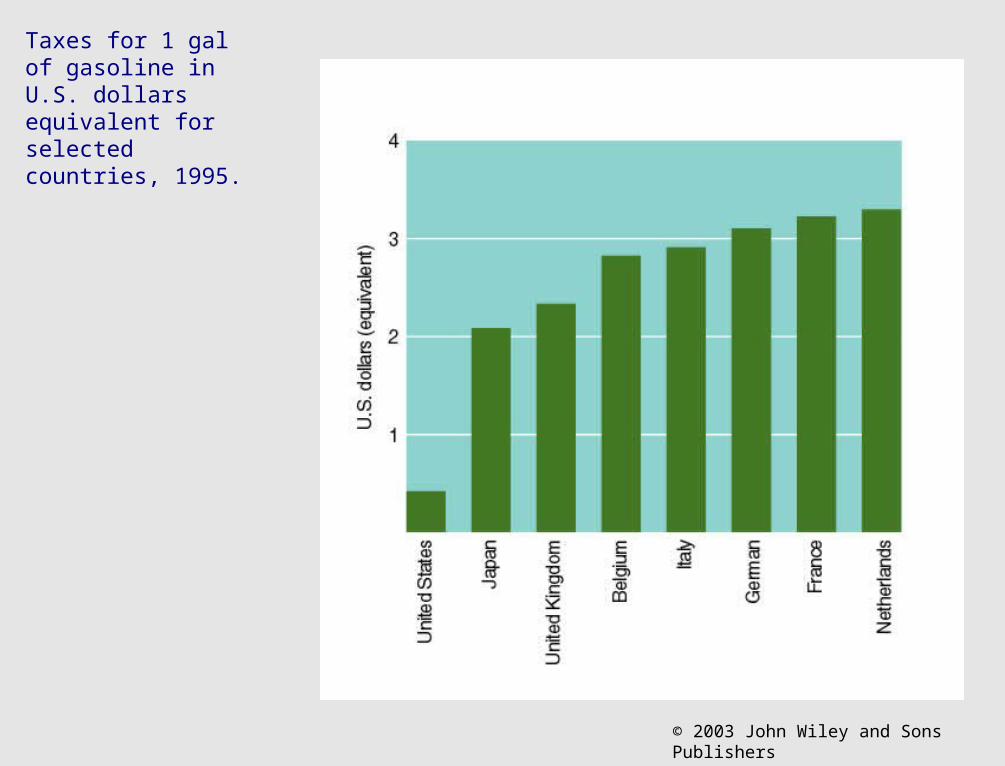
Taxes are NOT a percentage of the cost
Now around 13% $0.45/gallon Germany Tax - $4/gallon
O


Physics 105 – Fall 2011
Why did oil prices rise so much recently?
1. We are running out of oil2. Demand is greater than
supply3. Conspiracy of oil
companies4. Weak US dollar5. Speculators are bidding
price up6. OPEC is restricting supply7. The Iraq War has
introduced uncertainty

Physics 105 – Fall 2011
Fossil Fuels
Oil (petroleum)
Natural Gas (methane)
Coal
Peat Note: propane is derived from oil

Physics 105 – Fall 2011
When were there dinosaurs on earth
1. Never2. 100 thousand years ago3. 1 million years ago4. 25 million years ago5. 50 million years ago6. 100 million years ago7. 250 million years ago8. 500 million years ago9. 1 billion years ago10.3 billion years ago
Page 24

Geological Time scale

Where Fossil Fuels Come From
Where Fossil Fuels Come From
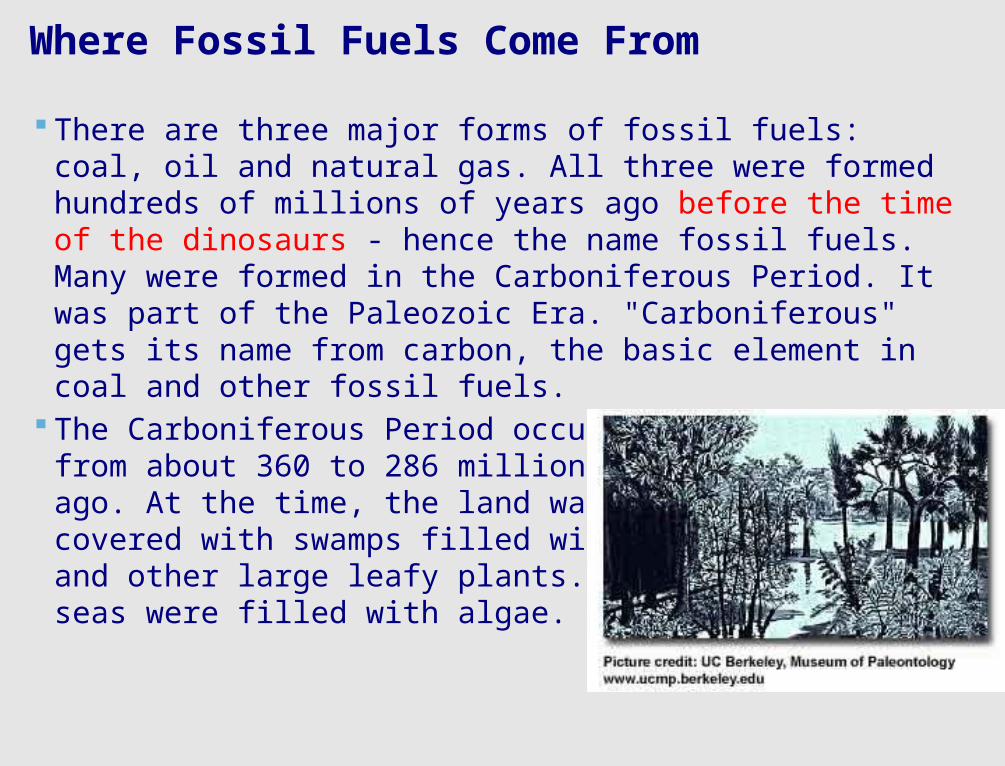
There are three major forms of fossil fuels: coal, oil and natural gas. All three were formed hundreds of millions of years ago before the time of the dinosaurs - hence the name fossil fuels. Many were formed in the Carboniferous Period. It was part of the Paleozoic Era. "Carboniferous" gets its name from carbon, the basic element in coal and other fossil fuels.
The Carboniferous Period occurredfrom about 360 to 286 million years ago. At the time, the land was covered with swamps filled with huge trees, ferns and other large leafy plants. The water and seas were filled with algae.
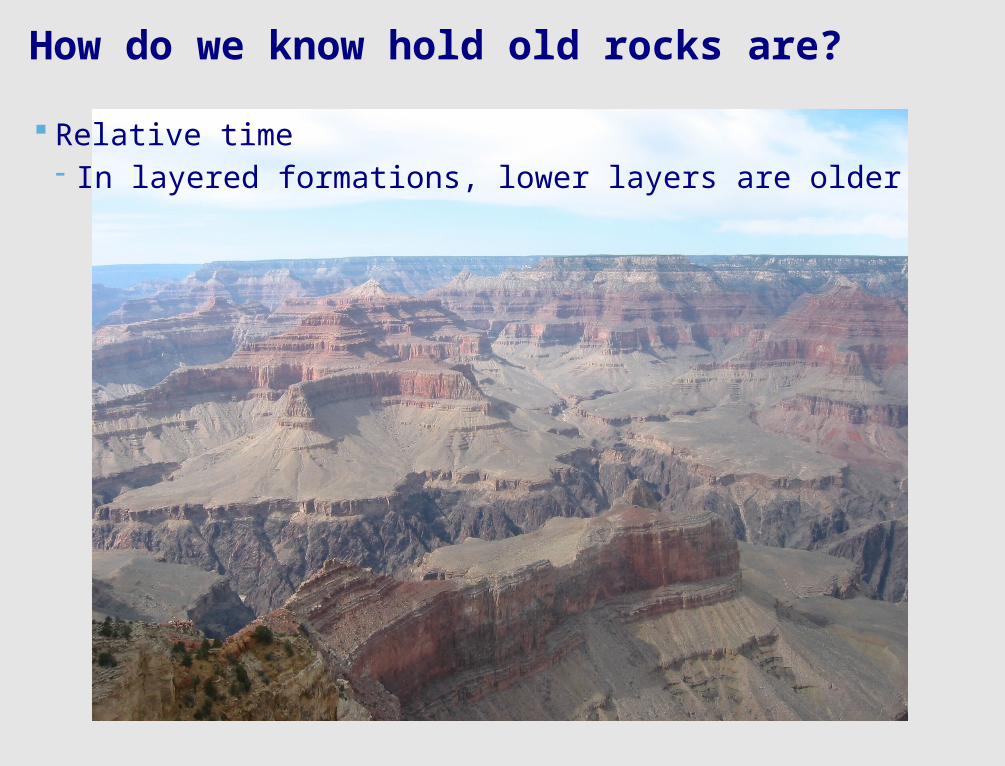
How do we know hold old rocks are?
Relative time- In layered formations, lower layers are older

How do we know how old rocks are?
Absolute time- Radiometric dating
- Certain isotope naturally decay (radioactivity) with a characteristic “half-life”- E.g. U235-> Pb207 t1/2 = 703.8 million years
- When rock forms, all U, no Pb - “clock starts”- Measure ratio of U235/Pb207- If = 1, T = 704 million yrs.- If =1/3, T = 2X 704 million yrs.
- This is exponential decay (the opposite of exponential growth)

Peat
As trees and plants die in swampy areas, they sink to the bottom of the water. If it is deficient in oxygen, it does not decay and eventually builds layers of a spongy material called peat.
Peat is 75% water, 15% carbon
Up to 2% of world’s land has peat
If burned peat is recent, can be thought of as renewable

Coal
Over many hundreds of years, the peat was covered by sand and clay and other minerals, compressing it into a form of sedimentary rock.
More and more rock piled on top of more rock, and it weighed more and more. It began to press down on the peat. The peat was squeezed and squeezed until the water came out of it and it eventually, over millions of years, it turned into coal.
Coal
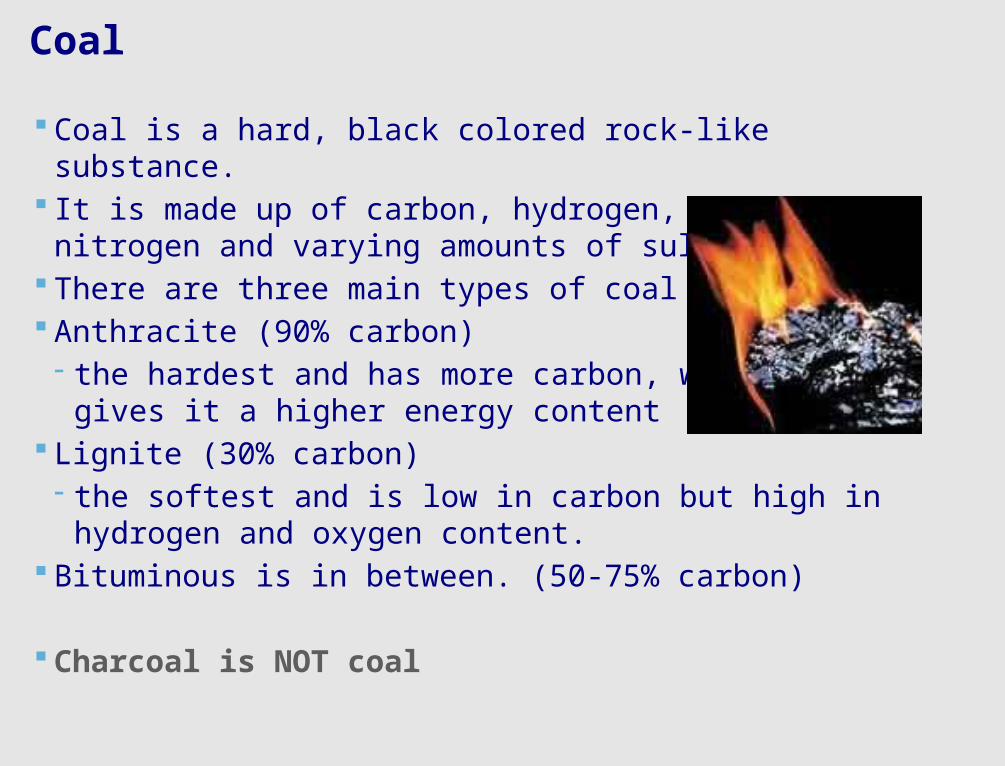
Coal is a hard, black colored rock-like substance. It is made up of carbon, hydrogen, oxygen, nitrogen and
varying amounts of sulfur. There are three main types of coal – Anthracite (90% carbon)- the hardest and has more carbon, which
gives it a higher energy content Lignite (30% carbon)- the softest and is low in carbon but high in hydrogen and
oxygen content. Bituminous is in between. (50-75% carbon)
Charcoal is NOT coal
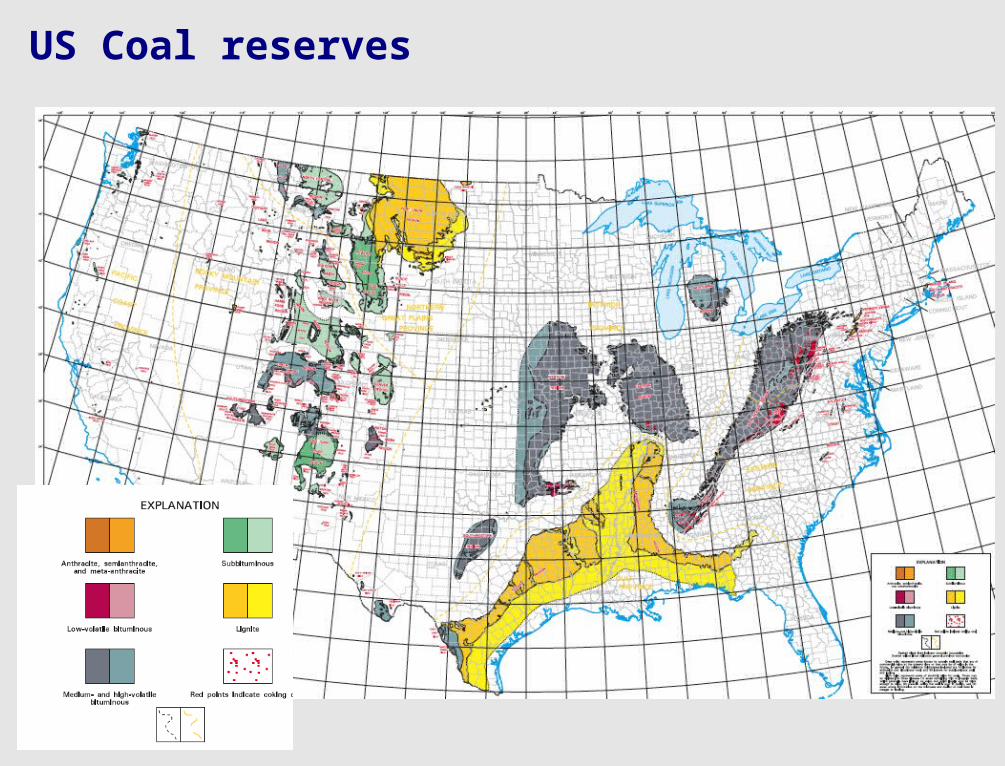
US Coal reserves
Physics 105 – Fall 2011
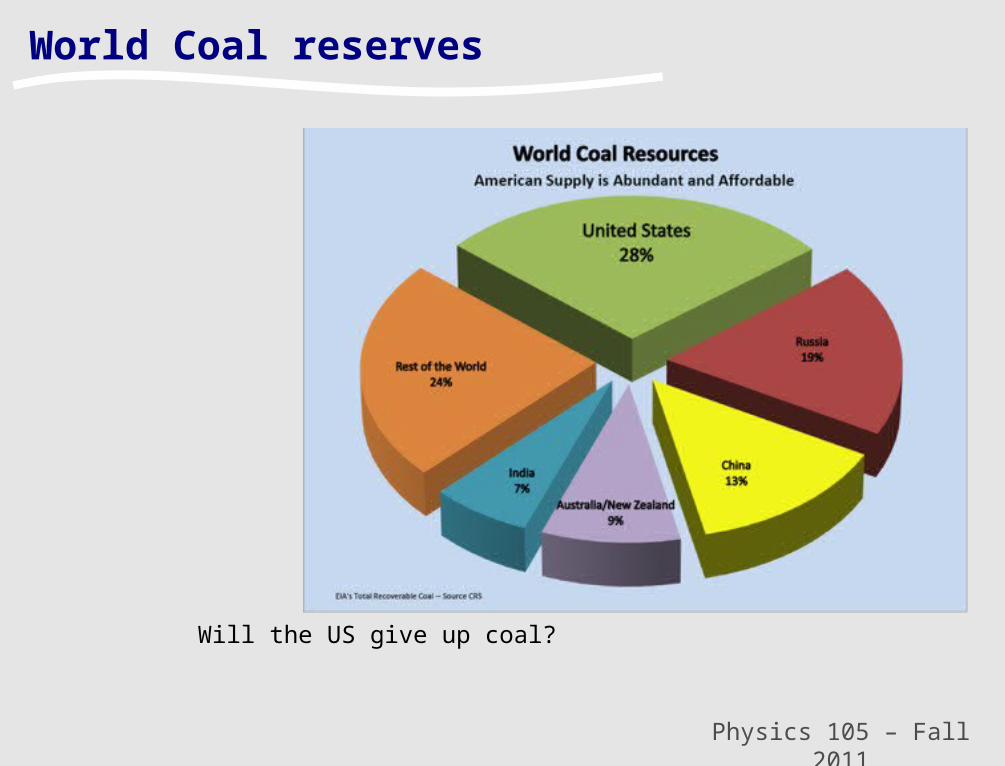
World Coal reserves
Will the US give up coal?

Proved recoverable coal reserves 2006 (million tonnes)

Mining Coal
3,000-5,000 mining deaths per yr. in China20-50 in USBlack lung disease…

Mountaintop removal in WV
Check out ilovemountains.org

Physics 105 – Fall 2011
Powder River Basin (Nebraska & Montana)
Page 38

Physics 105 – Fall 2011
Powder River Basin Coal
Powder River Basin coal is classified as "sub-bituminous" and contains an average of approximately 8,500 btu/lb, with low SO2. Contrast this with eastern, Appalachian bituminous coal containing an average of 12,500 btu/lb and high SO2. PRB coal was essentially worthless until air pollution emissions from power plants became a concern.
It gets harder to get as more is mined. USGS estimate that at most half will be practical to mine.
Page 39

Cautionary Note…
Coal is probably not the best energy source- Environmentally damaging- Major source of air pollution- Major source of global warming gases- Causes health problems/deaths in miners
- BUT:- US has 27% of world coal supply- US has 2.4% of world’s oil supply- US has 38X more energy in coal than oil…
-What happens when oil runs out?

Burn more coal…

Oil
Most scientists agree that oil comes from creatures the size of a pinhead. These one-celled creatures, known as diatoms, aren't really plants, but share one very important characteristic with them - they take light from the sun and convert it into energy
Diatoms float in the top few meters of the oceans (and lakes - which is part of the reason why not ALL oil comes from ocean deposits!) and also happen to be a major source of food for many forms of ocean swimmers.

Plankton
Two types - Phytoplankton: Plants of the Sea- Zooplankton: Sea Animals
Plankton either float passively in the water, or possess such limited powers of swimming that they are carried from place to place by the currents.

Plankton range in size from tiny microbes, which are invisible to the naked eye, to jellyfish meters long.
Apart from bacteria, planktonic organisms are the most abundant life form on earth
They are a critical part of the carbon energy chain The total amount of carbon in the ocean is about 50 times
greater than the amount in the atmosphere, and is exchanged with the atmosphere on a time-scale of several hundred years.
At least 1/2 of the oxygen we breathe comes from the photosynthesis of marine plants.
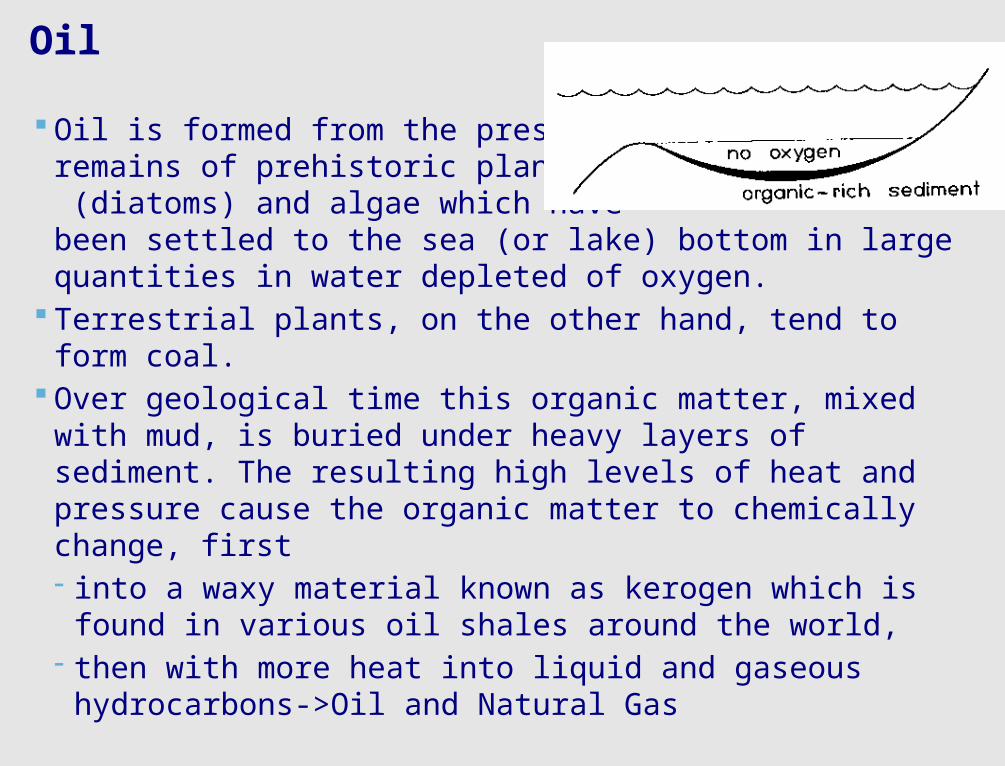
Oil
Oil is formed from the preserved remains of prehistoric plankton (diatoms) and algae which have been settled to the sea (or lake) bottom in large quantities in water depleted of oxygen.
Terrestrial plants, on the other hand, tend to form coal. Over geological time this organic matter, mixed with mud,
is buried under heavy layers of sediment. The resulting high levels of heat and pressure cause the organic matter to chemically change, first - into a waxy material known as kerogen which is found in
various oil shales around the world, - then with more heat into liquid and gaseous
hydrocarbons->Oil and Natural Gas

Depending on the balance of fresh water versus evaporation this can change with time and reverse providing different layers
This is why oil is often found just off shore or in regions that used to be water covered- Like the Middle East and
Gulfs

Source Rock
Oil comes from rocks (source rocks)– not big caverns There is "oil window" which is the temperature range that
oil forms in—below the minimum temperature oil remains trapped in the form of kerogen, and above the maximum temperature the oil is converted to natural gas
This corresponds to a certain depth in the earth
A rock won’t have oil if:- It wasn’t a rock with lots of
organic material- If the rock hasn’t been that deep- It was deeper than that depth

Three conditions must be present for oil reservoirs to form: - a source rock rich in organic material buried deep enough
for subterranean heat to cook it into oil; - a porous and permeable reservoir rock for it to
accumulate in; - a cap rock (seal) or other mechanism that prevents it
from escaping to the surface. Within these reservoirs fluids will typically organize
themselves like a three-layer cake with a layer of water below the oil layer and a layer of gas above it, although the different layers vary in size between reservoirs.

Page 49

The vast majority of oil that has been produced by the earth has long ago escaped to the surface and been biodegraded by oil-eating bacteria.
Oil companies are looking for the small fraction that has been trapped by this rare combination of circumstances.
Oil sands are reservoirs of partially biodegraded oil still in the process of escaping, but contain so much migrating oil that, although most of it has escaped, vast amounts are still present - more than can be found in conventional oil reservoirs. It is usually in the form of asphalt and is mined…
On the other hand, oil shales are source rocks that have never been buried deep enough to convert their trapped kerogen into oil.

Physics 105 – Fall 2011Marquee Lecture 4/12/11
US Oil Production
1991 – 7.4 million barrels/day
2009 – 5.3 million barrels/day
(1 barrel = 42 gallons)

Physics 105 – Fall 2011
Hubbert
Marion King Hubbert (1903–1989) geoscientist at Shell Oil
Predicted the end of the Oil Age
“Our ignorance is not so vast as our failure to use what we know.”

Hubbert’s basic idea
There is only so much oil recoverable on Earth- Therefore we eventually use it all up
Am
ount
use
d
0
100%
time

Hubbert’s basic idea
We can instead plot the rate of usage
Am
ount
use
d/yr
0
time
“Hubbert’s peak“Peak Oil”
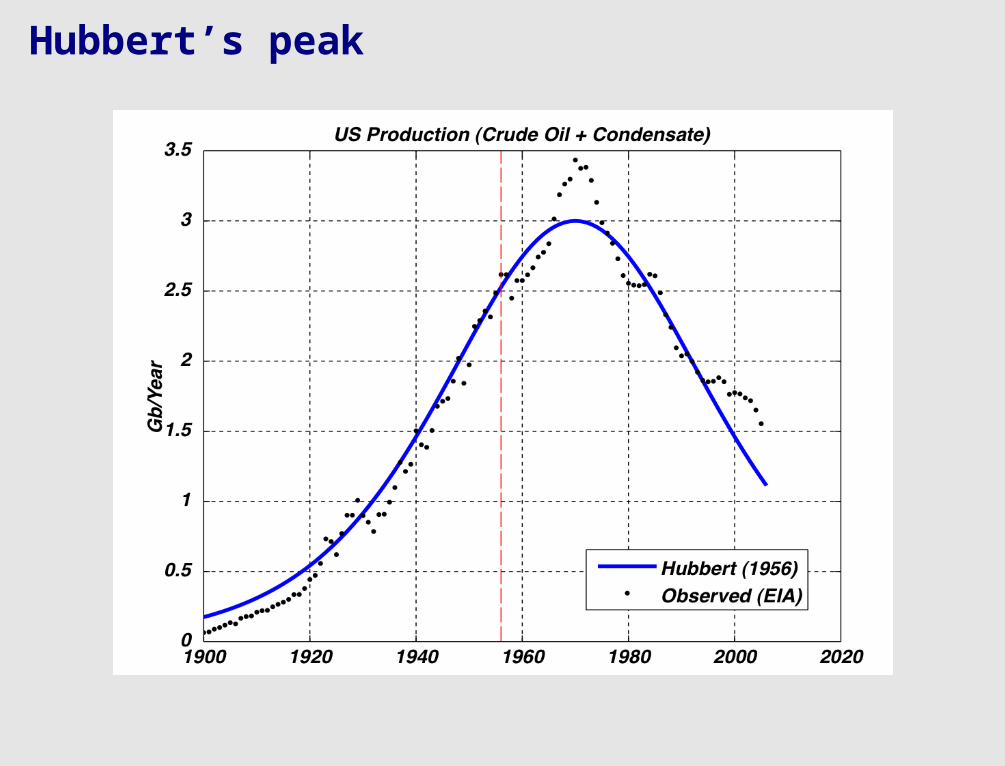
Hubbert’s peak

Hubbert Theory with Norway's production

World Oil

World Oil - except OPEC

Page 60
1994 1995 1996 1997 1998 1999 2000 2001 2002 2003 2004 2005 2006 2007 2008 200965000
70000
75000
80000
85000
90000
World Total Oil Supply
World

Physics 105 – Fall 2011
Have we already reached peak oil?
Page 61
1. Yes2. No3. Not sure


Best Fit World Data

Look at rate of discoveries…

Assume 300 billion bbls new discoveries Assume 600 billion bbls new discoveries
Peak Oil - 2012 Peak Oil - 2040
Oil & Gas Journal May 07, 2007 volume 105, issue 17
Author(s) : Steve H. Mohr Geoffrey M. Evans
Some current predictions


Page 67

OPEC

Physics 105 – Fall 2011
Criticisms of “Peak Oil”
Doesn’t account for new technology- Production- Discovery
Oil companies are overly conservative in what “proven” means Where there is a will there is a way…-If the price is high enough, other sources will be tapped

Physics 105 – Fall 2011
Oil (Tar) Sands
Oil sands or tar sands, are a type of unconventional petroleum
A mixture of sand, clay, water, and a dense and extremely viscous form of petroleum technically referred to as bitumen
Oil sands are found in large amounts in Canada and Venezuela
It is a thick, sticky form of crude oil, so heavy and viscous (thick) that it will not flow unless heated or diluted with lighter hydrocarbons
Page 70

Physics 105 – Fall 2011
Keystone Xl Pipeline
a
Page 71

Physics 105 – Fall 2011
Offshore drilling in the US
Most areas were put off limits in 1981 by congress, 1989 by Pres. Bush(Sr) after Exxon Valdez spill
Sept. 30, 2007 - Congress lets ban expire…except for Eastern Gulf of Mexico

Physics 105 – Fall 2011
What can (should) the US do?
Drill offshore Drill in ANWR
Estimates: ANWR: 5- 10 billion bbls.US offshore: 45 billion bbls.
World: 1237 billion bbls.
“The projections in the OCS access case indicate that access to the Pacific, Atlantic, and eastern Gulf regions would not have a significant impact on domestic crude oil and natural gas production or prices before 2030. “ - US Dept. of Energy 2007 report

Hirsch Report of DoE 2005
World oil peaking is going to happen, and will likely be abrupt.
Oil peaking will adversely affect global economies, particularly those most dependent on oil.
Oil peaking presents a unique challenge (“it will be abrupt and revolutionary”).
The problem is liquid fuels (growth in demand mainly from transportation sector).

Hirsch report
Mitigation efforts will require substantial time.- 20 years is required to transition without substantial
impacts- A 10 year rush transition with moderate impacts is
possible with extraordinary efforts from governments, industry, and consumers
- Late initiation of mitigation may result in severe consequences.
Both supply and demand will require attention. It is a matter of risk management (mitigating action must
come before the peak). Government intervention will be required.- Economic upheaval is not inevitable (“given enough lead-
time, the problems are soluble with existing technologies.”)
- More information is needed to more precisely determine the peak timeframe.
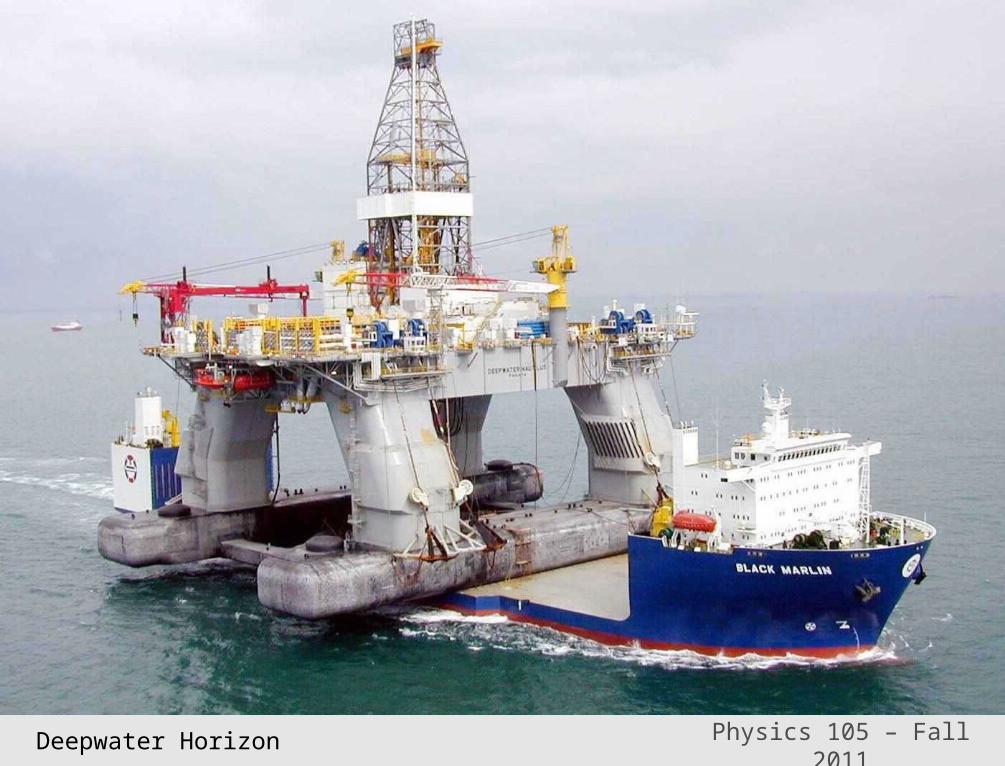
Physics 105 – Fall 2011Deepwater Horizon

Physics 105 – Fall 2011

Physics 105 – Fall 2011

Physics 105 – Fall 2011
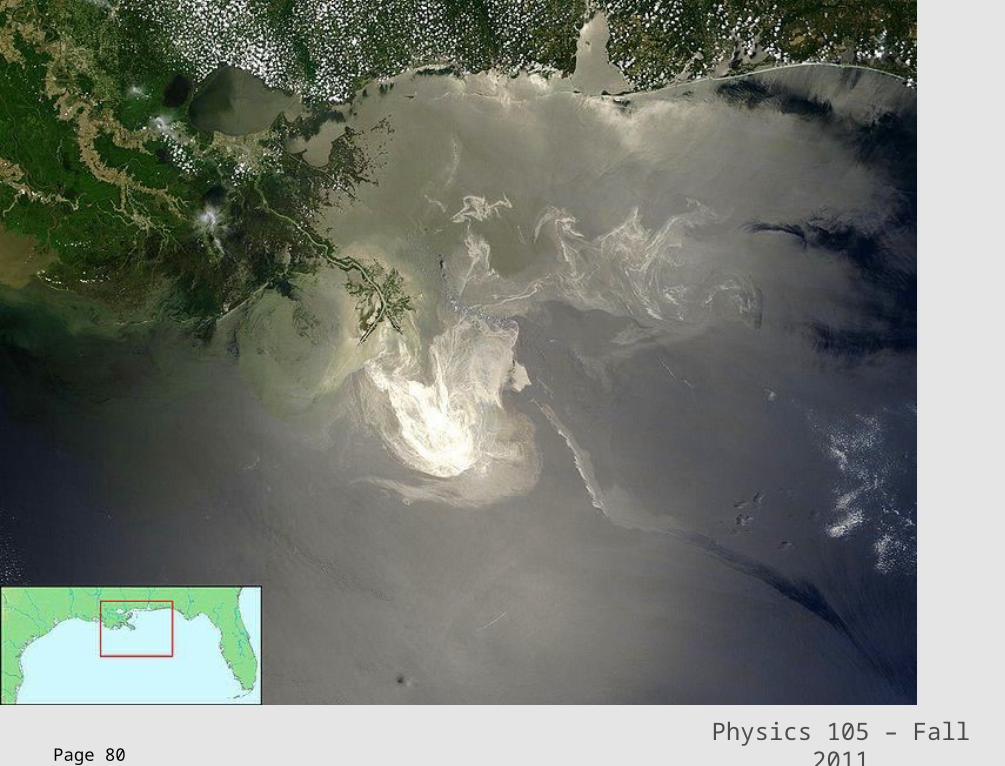
Physics 105 – Fall 2011 Page 80

Physics 105 – Fall 2011

Wed. March 31 Pres. Obama gives speech from Andrews Air force base
Tuesday, April 20 Deepwater Horizon suffers explosion in the Gulf of Mexico
Wed. April 21 Firefighters and rescue ships fight ongoing fire on Deepwater Horizon
Thursday, April 22, Earth Day, Deepwater Horizon sinks. Eleven crew missing
April to July, approx. 52,000 to 63,000 Barrels per day (3 Million Gals. per day) leaked
July 15, 2010 Cut-off well head capped
Sept 19, 2010 Well declared dead after filling top and bottom with cement

Physics 105 – Fall 2011
Should the US drill in
1. ANWR2. Offshore3. Both4. Neither

OLDUVAI THEORYONE VIEW OF THE FUTURE World Energy Production, Population Growth, And the Road to the Olduvai Gorge Richard C. Duncan Institute on Energy and Man As published in Population and Environment, May-June 2001.Named for the Olduvai Gorge in Tanzania where remains found are crucial to understanding human evolution were
found

Olduvai Theory
Defined by the ratio of world energy production and population.
It states that the life expectancy of Industrial Civilization is less than or equal to 100 years: 1930-2030.
After more than a century of strong growth — energy production per capita peaked in 1979.
Moreover, it says that energy production per capita will fall to its 1930 value by 2030, thus giving Industrial Civilization a lifetime of less than or equal to 100 years.
This analysis predicts that the collapse will be strongly correlated with an 'epidemic' of permanent blackouts of high-voltage electric power networks — worldwide.


World Energy Production per Capita: 1920-1999


Physics 105 – Fall 2011
When you are 50 years old, the world’s standard of living will be
1 2 3 4
0% 0%0%0%
1. Better than today2. About the same3. Somewhat worse4. Catastrophically worse

Duncan’s View
A keen question is posed: "Why are you confident about the Olduvai theory?" - My response: "Because Mother Nature then solves for us
the (apparently) insuperable problem of the Tragedy of the Unmanaged Commons, which the human race seems either incapable or unwilling to solve for itself.”
- Governments have lost respect. World organizations are ineffective. Neo- tribalism is rampant. The population is over six billion and counting. Global warming and emerging diseases are headlines. The reliability of electric power networks is falling. And the instant the power goes out, you are back in the Dark Age. If God made the Earth for human habitation, then He made it for the Stone Age mode of habitation.
- The Olduvai theory is thinkable.

The earth's immune system, so to speak, has recognized the presence of the human species and is starting to kick in. The earth is attempting to rid itself of an infection by the human parasite. — Richard Preston, 1994

Natural Gas
Since the late 1990s, natural gas has been the fuel of choice for the majority of new generating units, resulting in a 99.0 percent increase in natural gas-fired capacity since 1999.
The construction of natural gas plants began increasing in 1999, peaked during 2002 and 2003, but has since declined considerably.
On December 31, 2006, natural gas-fired generating capacity represented 388,294 MW or 39.4 percent of total net summer generating capacity. Although new natural gas-fired combined-cycle plants produce electricity more efficiently than older fossil-fueled plants, high natural gas prices can work against full utilization of these plants if such prices adversely affect economic dispatch

Natural Gas proven reserves
1. Russia 25%2. Iran 16%3. Qatar 14%4. Saudi Arabia 4%5. US 3%6. United Arab Emirates 3%7. Venezuela 3%8. Algeria 2%
World Reserves/Production Ratio - 60 years

Physics 105 – Fall 2011
An alternative transportation fuel
Metro: 164 CNG buses (out of 1600)
Honda Civic GX - on sale in CA, NY

Physics 105 – Fall 2011
Energy usage will continue to increase

Physics 105 – Fall 2011
Growth in developing countries

Physics 105 – Fall 2011
Fossil Fuel consumption will increase

Physics 105 – Fall 2011
China will burn a lot of coal

Physics 105 – Fall 2011
It will depend (somewhat) on the global economy

Physics 105 – Fall 2011
Depends on prices

Physics 105 – Fall 2011
Natural Gas

Physics 105 – Fall 2011
International organization of 30 countries that accept the principles of representative democracy and free-market economy. Most OECD members are high-income economies
Page 102

Physics 105 – Fall 2011
Coal

• Fossil fuels: petroleum, natural gas and coal (organic)• Relatively short-lived, ~ 500 years• Currently 85% of current US energy from from fossil fuels • Expected oil production peak: 2010-2030• Consumption currently increasing• Projected world oil production will be exhausted by 2100• Produces significant and diverse pollution problems
o Greenhouse gasseso Gaseous Sulfur and nitrogen oxideso Land-based disturbances
The Era of Fossil Fuels

Total energy consumption for the United States, 1950-1999.

© 2003 John Wiley and Sons Publishers
Proven world oil reserves in 1998.

© 2003 John Wiley and Sons Publishers
Major trade routes for the world’s oil, emphasizing the countries that use Middle Eastern oil.

© 2003 John Wiley and Sons Publishers
Estimating cost of driving with increased fuel economy.
© 2003 John Wiley and Sons Publishers
Taxes for 1 gal of gasoline in U.S. dollars equivalent for selected countries, 1995.

Sources: International Energy Annual 2005 and BP Statistical Review
2006 World Conventional Hydrocarbon Resources
2
Total World Resources19,960 Quadrillion Btu
6,970 Quadrillion Btu6,500 Quadrillion Btu
CoalOil
Natural Gas

Source: International Energy Annual 2005
Total World Production: 417 quadrillion Btu
2006 World Conventional Hydrocarbon Production
3

2006 World Conventional Hydrocarbon Consumption
Source: International Energy Annual 2005
4
World Consumption All Energy:Consumption Conventional Hydrocarbons:
465 quadrillion Btu417 quadrillion Btu

2006 Coal Trade Patterns
Source: International Energy Agency, Coal Information 2007
5
World Coal Exports: 815 mmt

Potential Demand for Electrification
(2005 kwh per capita)
Source: International Energy Agency, Key World Energy Statistics 2007
6

Source: World Resource Institute (http://earthtrends.wri.org/text/energy-resources/variables.html)
Potential Demand for Liquid Fuel(cars per 1,000 people)
7
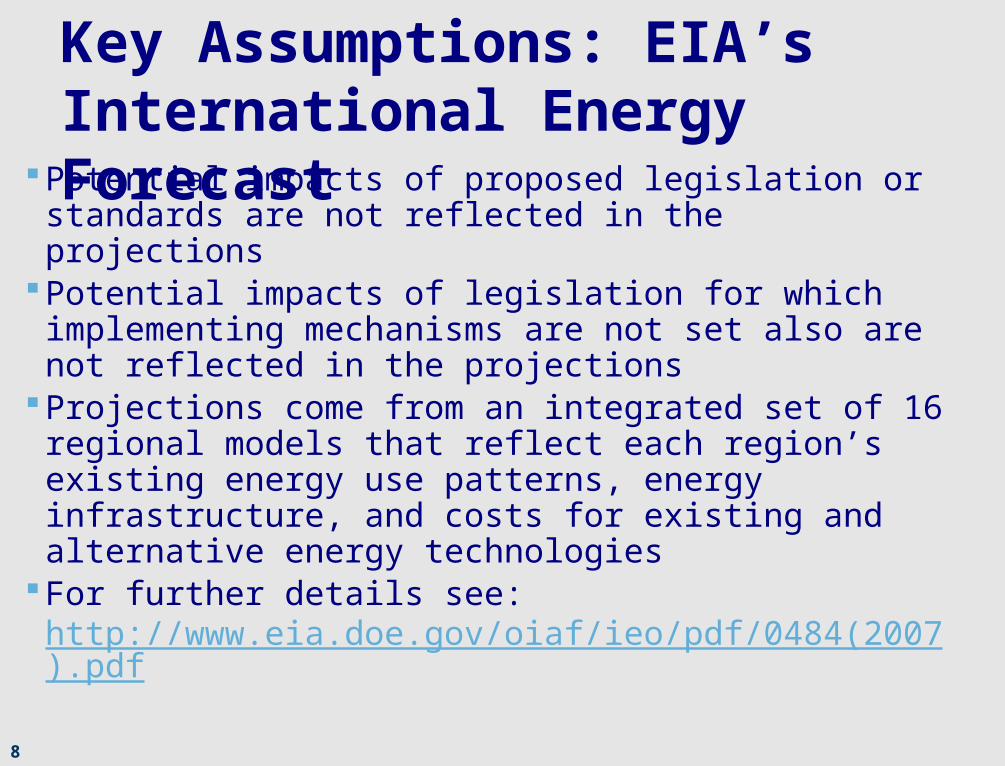
Key Assumptions: EIA’s International Energy ForecastPotential impacts of proposed legislation or standards
are not reflected in the projectionsPotential impacts of legislation for which implementing mechanisms are not set also are not reflected in the projections
Projections come from an integrated set of 16 regional models that reflect each region’s existing energy use patterns, energy infrastructure, and costs for existing and alternative energy technologies
For further details see: http://www.eia.doe.gov/oiaf/ieo/pdf/0484(2007).pdf
8

Annual Growth in Electricity Generation by Region (2004-2030)
Non-OECD
OECD – Organization for Economic Co-operation and Development
Source: EIA, International Energy Outlook 2007
9

Non-OECD
OECD
Annual Growth in Liquids Consumption by Region (2004-2030)
Source: EIA, International Energy Outlook 2007
10
0.0
1.9
2.3
2.2

World Energy Use by Fuel Type (1980 – 2030)
Source: EIA, International Energy Outlook 2007
0
50
100
150
200
250
300
1980 1990 2000 2010 2020 2030
Qu
adri
llio
n B
tu
Oil Natural Gas Coal Nuclear Renewables
11

World Coal Consumption by Region (2004 – 2030)
Source: EIA, International Energy Outlook 2007
0
50
100
150
200
250
2004 2010 2015 2020 2025 2030
Qu
ad
rilli
on
Btu
China United States India Rest of World
12
114.5
136.4151.6
167.2182.9
199.1

20
2
2224
2
26
31
2 2
35
0
5
10
15
20
25
30
35
40
Electricity Industrial Coal-to-Liquids Total
Qu
ad
rill
ion
Btu
2004 2015 2030
U.S. Coal Consumption by Sector (2004, 2015, 2030)
Source: EIA, Annual Energy Outlook 2007
13

2316
3
4139
23
3
65
56
37
3
95
0
10
20
30
40
50
60
70
80
90
100
Electricity Industrial Other Sectors Total
Qu
adri
llio
n B
tu
2004 2015 2030
Chinese Coal Consumption by Sector (2004, 2015, 2030)
Source: EIA, International Energy Outlook 2007
14

Carbon Dioxide Emissions from Coal Use by Region (2004, 2030)
Source: EIA, International Energy Outlook 2007
15

0
10,000
20,000
30,000
40,000
50,000
1990 2000 2010 2020 2030
Millio
n M
etr
ic T
on
s C
arb
on
Dio
xid
e
Carbon Dioxide Emissions by Region
Source: EIA, International Energy Outlook 2007
World
U.S., China & India
Europe & Eurasia
Japan, South Korea, Australia, New Zealand, & Other Asia
Middle East
16
Africa
Central & SouthAmerica

Future Challenges and Options
85% of that increase is in the U.S., China, India, & other Asia
U.S., China and India account for 86% of the increase in global coal use
Global CO2 emissions increase by 60%
90% of the increase in CO2 emissions occurs in the U.S., China, India, & other Asia
Coal accounts for 49% of global CO2 emission growth
Oil accounts for 29%Natural Gas accounts for
21%
Source: EIA, International Energy Outlook 2007
World Primary Energy Consumption over Next 25
Years Without Carbon Constraining Technology
17
World primary energy consumptionIncreases 57%


![[PPT]Fossil Fuelsehsapes.pbworks.com/f/Fossil+Fuels.ppt · Web viewFossil Fuels Formation, Distribution, Extraction & Purification, Advantages & Disadvantages, Alternatives Fossil](https://static.fdocuments.net/doc/165x107/5acd28987f8b9a6a678d2c19/pptfossil-fuelspptweb-viewfossil-fuels-formation-distribution-extraction-purification.jpg)


![[Arnold Goldman] the Monster Makers Mask Makers](https://static.fdocuments.net/doc/165x107/5695d4df1a28ab9b02a31e8f/arnold-goldman-the-monster-makers-mask-makers.jpg)