Physics 101 Lecture 2 Kinematics: Motion in 1-DimensionKinematics: Free Fall—A Special Case Free...
24
PHYS 101: Lecture 2 Physics 101 Lecture 2 Kinematics: Motion in 1 - Dimension
Transcript of Physics 101 Lecture 2 Kinematics: Motion in 1-DimensionKinematics: Free Fall—A Special Case Free...

PHYS 101: Lecture 2
Physics 101 Lecture 2Kinematics: Motion in 1-Dimension
PHYS 101: Lecture 2
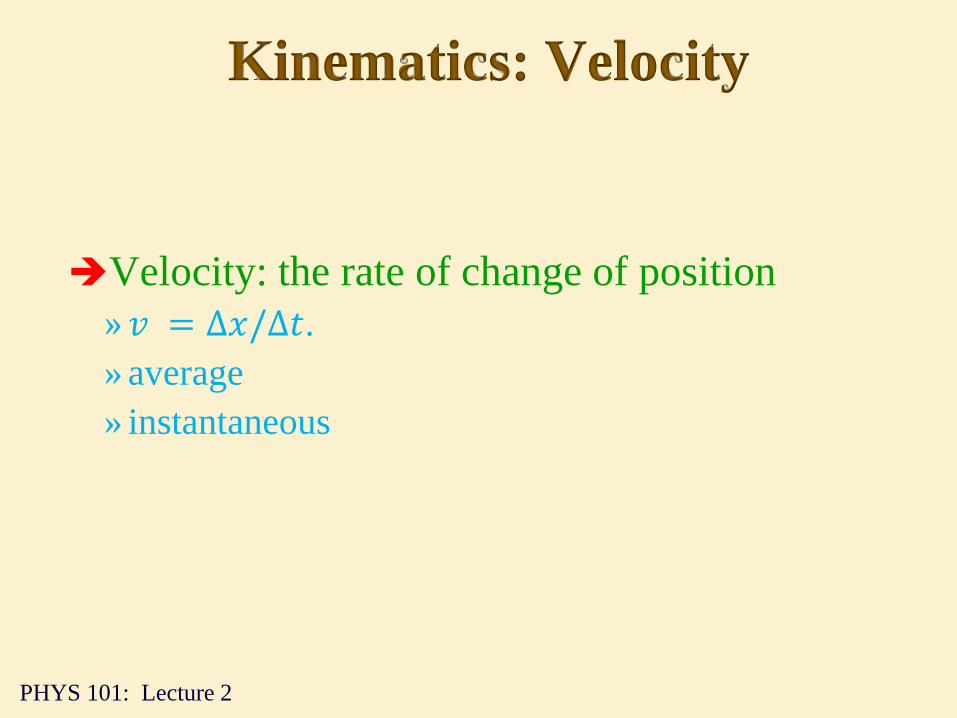
Kinematics: Velocity
Velocity: the rate of change of position
»𝑣 = Δ𝑥/Δ𝑡.
» average
» instantaneous
PHYS 101: Lecture 2
Instantaneous Velocity:
the slope of tangent line at any point on a position-time graph
Example: What is the instantaneousvelocity:
𝑥 = 2 m and 𝑡 = 1 s?
𝑣 = Δ𝑥tan/ΔttanΔ𝑥tan = (3 − 2) m
Δ𝑡tan = (1.25 − 1) s
𝑣 =1m
0.25 s= 4m/s
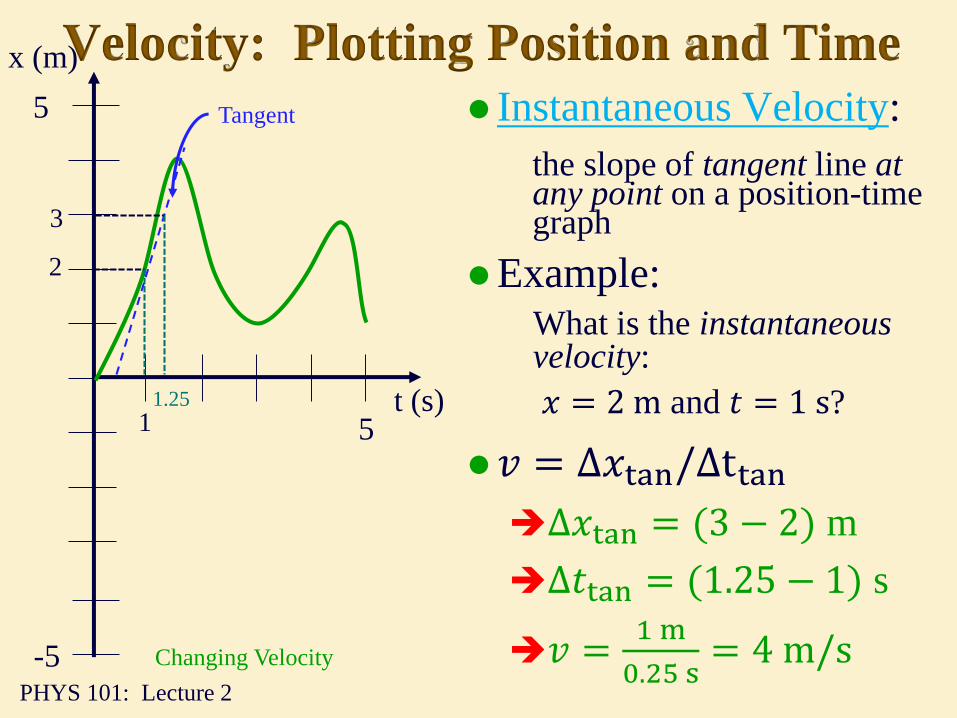
Velocity: Plotting Position and Timex (m)
t (s)5
-5 Changing Velocity
5 Tangent
1
2
3
1.25
PHYS 101: Lecture 2
Example:
What is the average velocity between :
𝑡 = 1 s and 𝑡 = 5 s?
Δ𝑣 = Δ𝑥/Δ𝑡
Δ𝑥 = (1 − 2) m
Δ𝑡 = (5 − 1) s
𝑣 =−1m
4 s= −0.25
m
s
What does “−” mean?
Velocity: Plotting Position and Timex (m)
t (s)5
-5 Changing Velocity
5
1
2
1
PHYS 101: Lecture 2
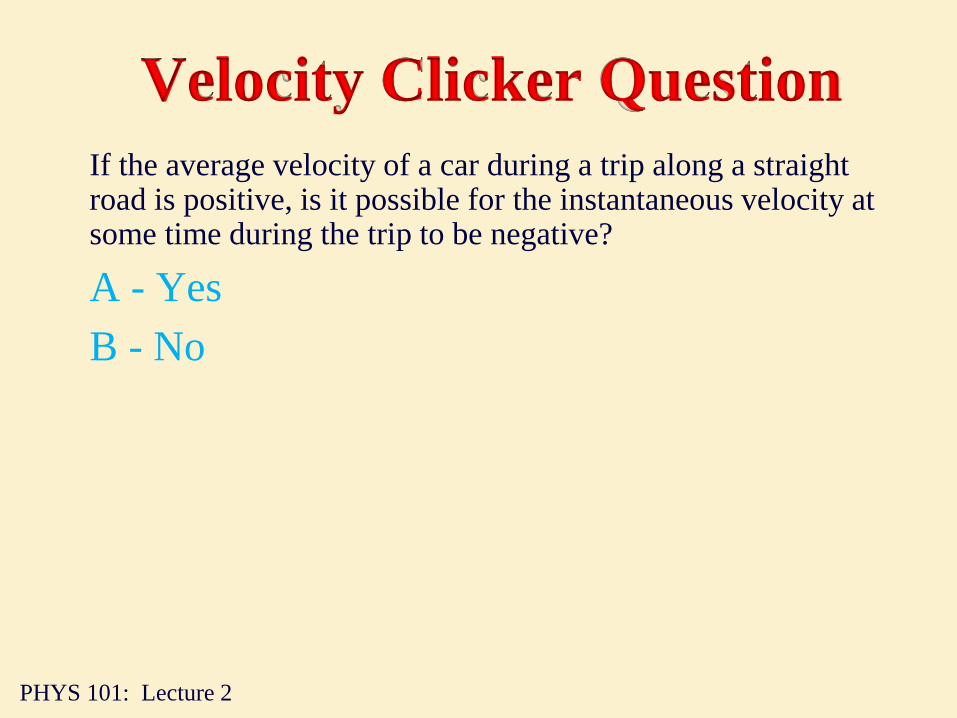
Velocity Clicker Question
If the average velocity of a car during a trip along a straight road is positive, is it possible for the instantaneous velocity at some time during the trip to be negative?
A - Yes
B - No
PHYS 101: Lecture 2
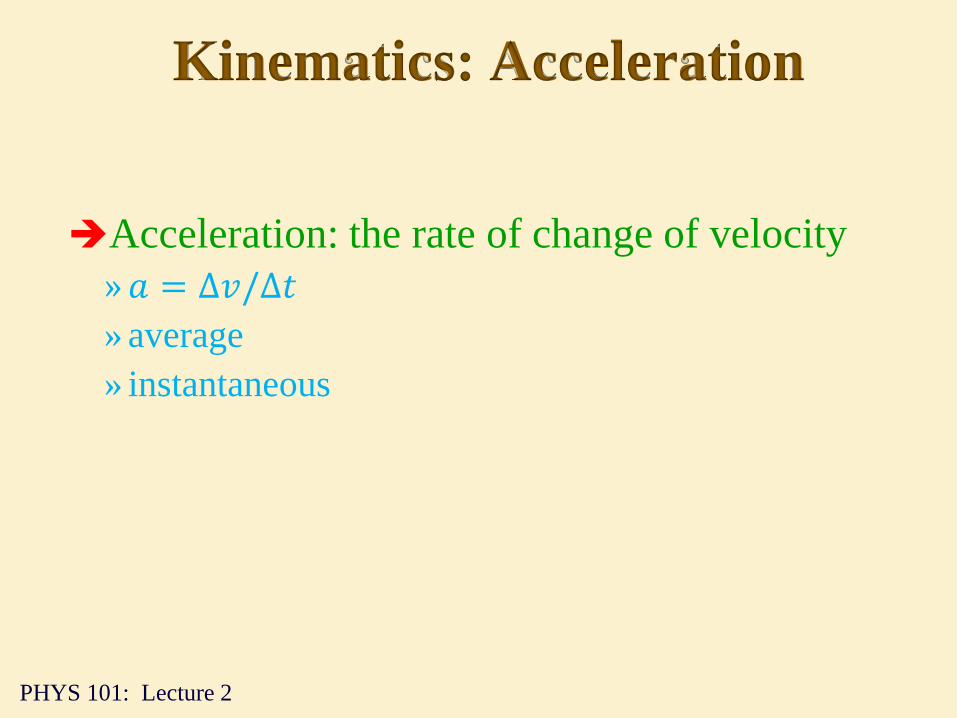
Kinematics: Acceleration
Acceleration: the rate of change of velocity
»𝑎 = Δ𝑣/Δ𝑡
» average
» instantaneous

PHYS 101: Lecture 2
Slope:
Instantaneous acceleration:
𝑎 =Δ𝑣
Δ𝑡𝑓𝑜𝑟 𝑠𝑚𝑎𝑙𝑙 Δ𝑡
Example:
Velocity at 𝑡 = 2
𝑣 2 = 3 m/s
Acceleration: Plotting Velocity and Time
v (m/s)5
5 t (s)
3
2
What’s acceleration at t=2?

PHYS 101: Lecture 2
Area: Displacement: Δ𝑥 = 𝑣Δ𝑡
Example:
Find the displacement between:
𝑡 = 0 s and 𝑡 = 3 s
𝑡 = 0 s to 𝑡 = 1 s
» Δ𝑥1 =1
23m
s1 s = 1.5 m
𝑡 = 1 s to 𝑡 = 3 s
» Δ𝑥2 = 3m
s3 − 1 s = 6 m
Δ𝑥 = Δ𝑥1 + Δ𝑥2 = 7.5 m
Acceleration: Plotting Velocity and Time
1.5
6
v (m/s)5
5
3
t (s)
PHYS 101: Lecture 2
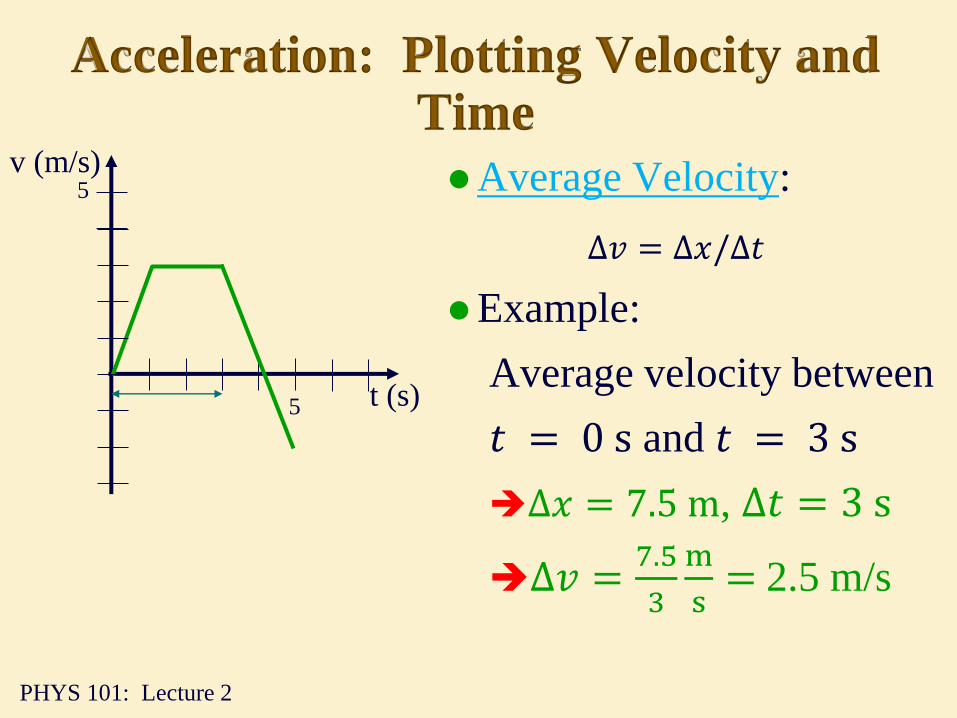
Average Velocity:
Δ𝑣 = Δ𝑥/Δ𝑡
Example:
Average velocity between
𝑡 = 0 s and 𝑡 = 3 s
Δ𝑥 = 7.5 m, Δ𝑡 = 3 s
Δ𝑣 =7.5
3
m
s= 2.5 m/s
Acceleration: Plotting Velocity and Time
v (m/s)5
5 t (s)

PHYS 101: Lecture 2
Average Acceleration: Δ𝑎 = Δ𝑣/Δ𝑡
Example:
Average acceleration between
𝑡 = 3 s and 𝑡 = 5 s
Δ𝑣 = −2 − 3m
s= −5
m
s
Δ𝑡 = 5 − 3 s = 2 s
Δ𝑎 = −5m
s
2 s= −2.5 m/s2
Acceleration: Plotting Velocity and Time
v (m/s)5
5t (s)
3
3
-2

PHYS 101: Lecture 2
Slope:
𝑎 = Δ𝑣/Δ𝑡
Example: Acceleration at 𝑡 = 4 s:
𝑎 4 s = −2𝑚
𝑠2
Graphical Representation of Acceleration: Plotting Acceleration and Time
a (m/s2 )
5
5 t (s)
-2

PHYS 101: Lecture 2
Area:
Δ𝑣 = 𝑎 Δ𝑡
Example: Change in velocity between 𝑡 = 1 s and 𝑡 = 4 s
𝑡 = 1 s to 𝑡 = 3 s
» Δ𝑣1 = 3m
s22 s = 6 m/s
𝑡 = 3 s to 𝑡 = 4 s
» Δ𝑣2 = −2m
s21 s =
− 2 m/s
Δ𝑣 = Δ𝑣1 + Δ𝑣2 = 4m/s
Acceleration: Plotting Velocity and Time
2
6
a (m/s2 )
5
5 t (s)
3
-2

PHYS 101: Lecture 2
Is it possible for an object to have a positive velocity at the same time as it has a negative acceleration?
1 - Yes
2 - No
Acceleration Clicker Qs
If the velocity of some object is not zero, can its acceleration ever be zero ?
1 - Yes
2 - No

PHYS 101: Lecture 2
Equations for Constant Acceleration
𝑥 = 𝑥0 + 𝑣0𝑡 +1
2𝑎𝑡2
𝑣 = 𝑣0 + 𝑎𝑡
𝑣2 = 𝑣02 + 2𝑎(𝑥 − 𝑥0)
0
5
10
15
20
0 5 10 15 20
v (m/s)
t (seconds)
0
50
100
150
200
0 5 10 15 20
x (meters)
t (seconds)
0
0.5
1
1.5
2
0 5 10 15 20
a (m/s2)
t (seconds) 14
Use these equations to predict the
future path and speed of an object
under constant acceleration!
PHYS 101: Lecture 2
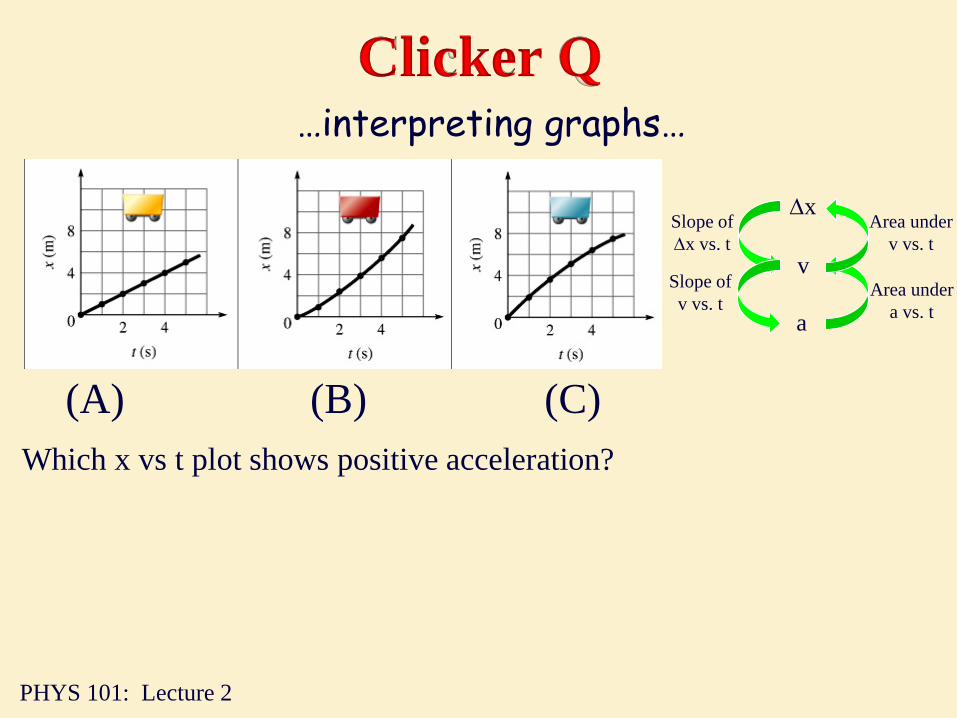
Clicker Q
(A) (B) (C)
Which x vs t plot shows positive acceleration?
…interpreting graphs…
Slope of
Dx vs. t
Slope of
v vs. tArea under
a vs. t
Area under
v vs. t
Dx
v
a

PHYS 101: Lecture 2
Kinematics: Free Fall—A Special Case
Free Fall: An object’s motion is caused by gravity alone
𝑎 = 𝑔, the acceleration of gravity
𝑔 = 9.8 m/s2
The 3 kinematic equations become:
»𝑦 = 𝑦0 + 𝑣0𝑦
𝑡 − 1/2 𝑔𝑡2
»𝑣𝑦 = 𝑣0𝑦 − 𝑔𝑡
»𝑣𝑦2 = 𝑣
0𝑦2 − 2𝑔 𝑦 − 𝑦0

PHYS 101: Lecture 2
A Few Facts About 𝒈
For Gravity: Acceleration is 𝑔 = 9.8 m/s2 near the surface of the earth.
𝑔 always points downward
Position may be positive, zero or negative
Velocity may be positive, zero or negative
To Calculate position or velocity as a function of time:
Position: 𝑦 = 𝑦0 + 𝑣0𝑦𝑡 −1
2𝑔𝑡2
Velocity: 𝑣𝑦 = 𝑣0𝑦 − 𝑔𝑡
To calculate velocity as a function of position:
𝑣𝑦2 = 𝑣0𝑦
2 − 2𝑔 𝑦 − 𝑦0
+y
+x
𝑔

PHYS 101: Lecture 2
Dropped Ball Clicker Q
Draw vy vs t
A ball is dropped from a height of
two meters above the ground.
-4
6v
t0.5
6
-4
v
t0.5
-4
v
t0.5
6
-4v
t0.5
6v
t0.5
6
-4
A B C
D E
y
x
v v
v v
PHYS 101: Lecture 2
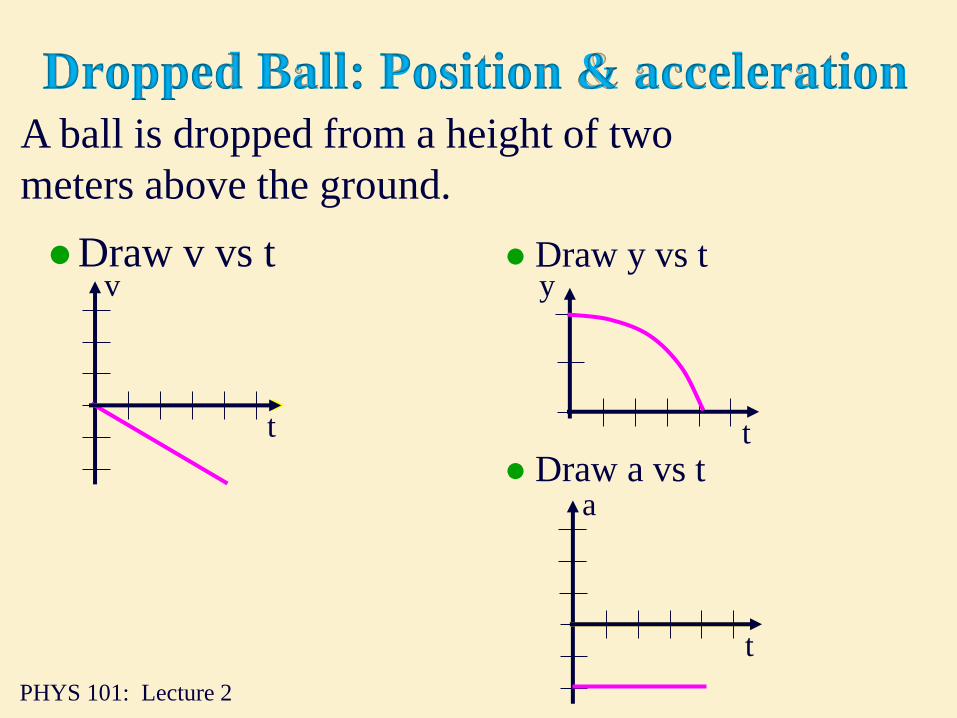
Dropped Ball: Position & acceleration
Draw v vs t Draw y vs t
Draw a vs t
v
t
y
t
a
t
A ball is dropped from a height of two
meters above the ground.
PHYS 101: Lecture 2
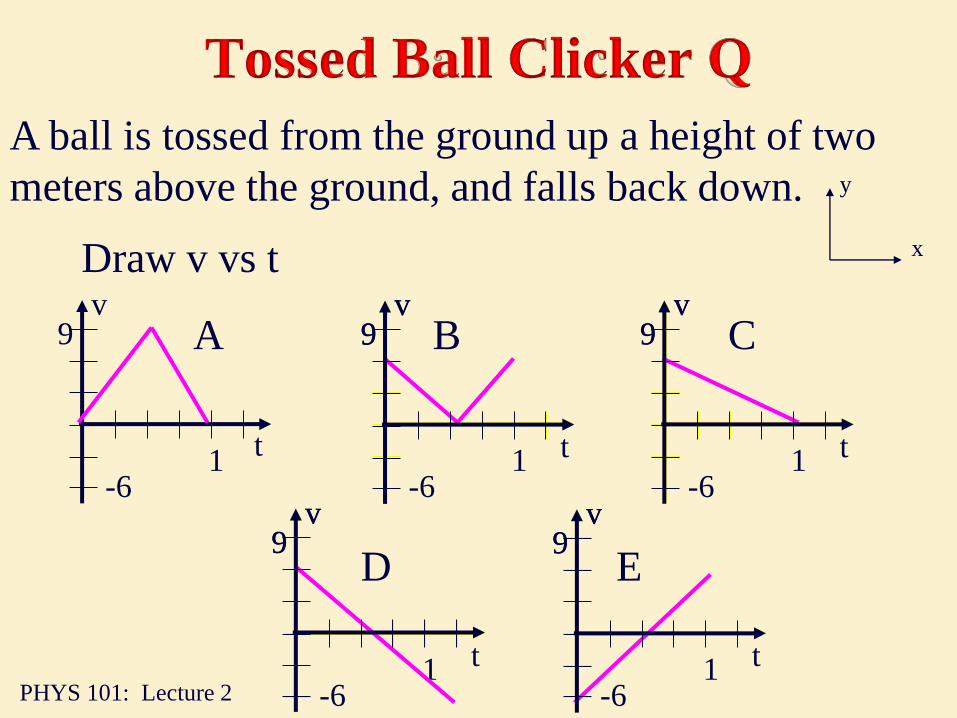
Tossed Ball Clicker Q
Draw v vs t
A ball is tossed from the ground up a height of two
meters above the ground, and falls back down.
vv v
-6 -6
9
t1
9
-6
t1
-6
t1
9
-6v
t1
9v
t1
9
A B C
D E
y
x
v9
v9
v9
v9

PHYS 101: Lecture 2
Tossed Ball, x, v, a relationships
Draw v vs t Draw y vs t
Draw a vs ta
t
A ball is tossed from the ground up a height of two
meters above the ground. And falls back down
v
tt
y
t
PHYS 101: Lecture 2
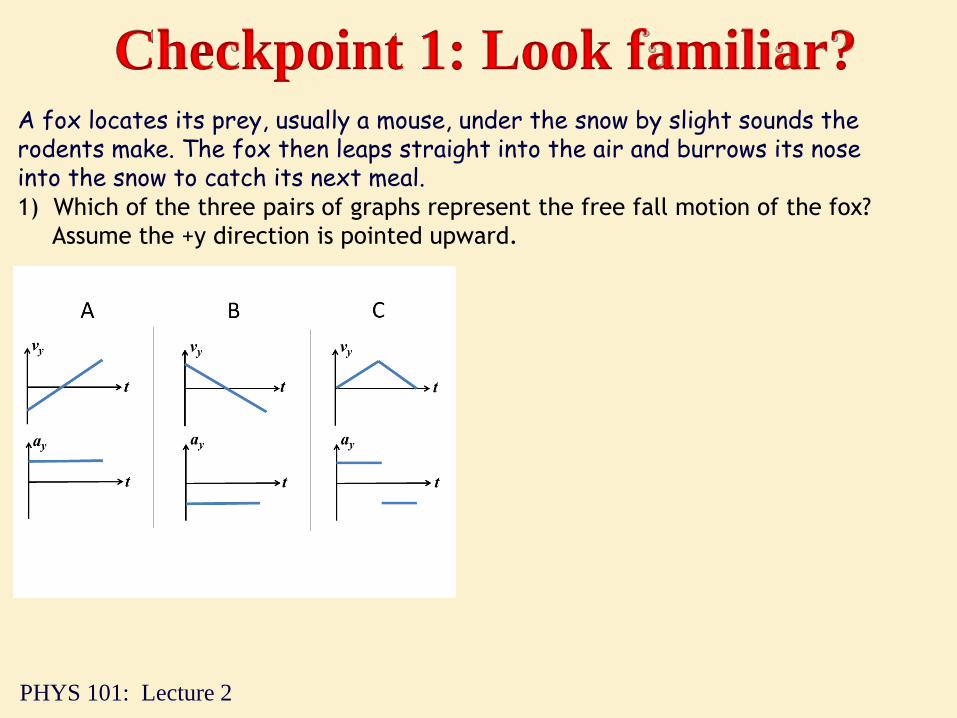
A fox locates its prey, usually a mouse, under the snow by slight sounds the rodents make. The fox then leaps straight into the air and burrows its nose into the snow to catch its next meal.1) Which of the three pairs of graphs represent the free fall motion of the fox?
Assume the +y direction is pointed upward.
Checkpoint 1: Look familiar?
PHYS 101: Lecture 2
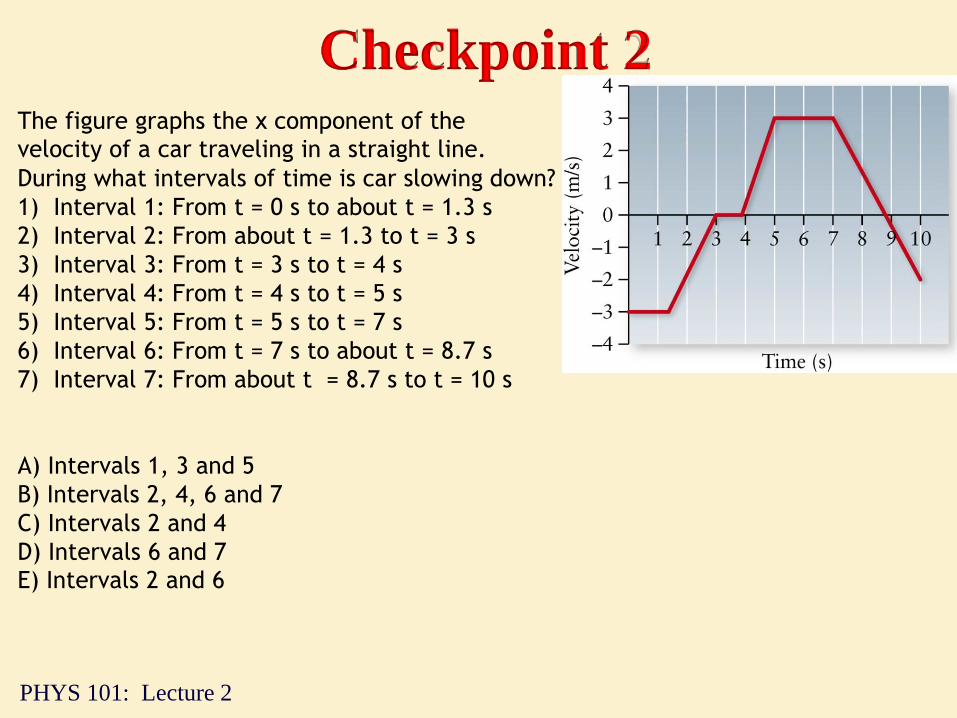
The figure graphs the x component of the
velocity of a car traveling in a straight line.
During what intervals of time is car slowing down?
1) Interval 1: From t = 0 s to about t = 1.3 s
2) Interval 2: From about t = 1.3 to t = 3 s
3) Interval 3: From t = 3 s to t = 4 s
4) Interval 4: From t = 4 s to t = 5 s
5) Interval 5: From t = 5 s to t = 7 s
6) Interval 6: From t = 7 s to about t = 8.7 s
7) Interval 7: From about t = 8.7 s to t = 10 s
A) Intervals 1, 3 and 5
B) Intervals 2, 4, 6 and 7
C) Intervals 2 and 4
D) Intervals 6 and 7
E) Intervals 2 and 6
Checkpoint 2

PHYS 101: Lecture 2
Summary of Concepts
Kinematic Quantities:
Position & Displacement
Velocity & Speed
Acceleration
Free Fall
𝑦 = 𝑦0 + 𝑣0𝑦
𝑡 − 1/2 𝑔𝑡2
𝑣𝑦 = 𝑣0𝑦 − 𝑔𝑡
𝑣𝑦2 = 𝑣
0𝑦2 − 2𝑔 𝑦 − 𝑦0


![Anno Accademico 2016 2017 - Politecnico di Milano€¦ · exchangers related to the net electric power output [2]. 𝛾= ̇ ß, ç K P𝑎 H 𝑎 N 𝑎 ℎ 𝑎 P ℎ𝑎 J O (0.2)](https://static.fdocuments.net/doc/165x107/605a4808b954ff556d1614a0/anno-accademico-2016-2017-politecnico-di-milano-exchangers-related-to-the-net.jpg)