Physics 218, Lecture XVI1 Physics 218 Lecture 16 Dr. David Toback.

Physics 100
Lecture 19
Solar Thermal Energy
April 9, 2018
1

Class Quiz Ch. 8-9: Which of the following is the
most important factor in understanding
the “carbon cycle” of the Earth?
2
A. Absorption of carbon by
plants
B. Absorption of carbon by
the ocean
C. Production of carbon by
plants
D. Production of carbon by
polar glaciers

A. Absorption of carbon by plants
B. Absorption of carbon by the ocean
C. Production of carbon by plants
D. Production of carbon by polar glaciers
Class Quiz Ch. 8-9: Which of the following is the
most important factor in understanding
the “carbon cycle” of the Earth?
See pp. 287-288
of the text.
3

Reminder of the hazards of
carbon-based energy
4
Citation: Physics Today 69, 11, 48 (2016); full articleEach row of the diagram represents a carbon reservoir, with the amount of carbon
in each reservoir in 1870 shown in the middle column in petagrams (1 Pg = 1015 g).
The boxes and arrows to the left and right depict the carbon budget16 in petagrams
for the period 1870–2014.

Some good news
5
https://www.eia.gov/todayinenergy/detail.php?id=30712

Alternatives to fossil fuel energy
Nuclear energy
• No emissions, but
safety and waste
disposal problems
Renewable energy
• Solar thermal
• Solar electric
• Wind
• Biomass
• Geothermal
• Nuclear fusion
6

Renewable energy overview
7 www.eia.gov/totalenergy/data/monthly/pdf/sec1_6.pdf
see also www.eia.gov/totalenergy/data/monthly/

Renewable energy trends
8
https://www.eia.gov/outlooks/steo/report/renew_co2.cfm?src=Environment-b1
2013 2014 2015 E 2016 2017 2018 P 2019 P
Geothermal 0.214 0.222 0.226 0.210 0.212 0.227 0.229
Hydropowera 2.562 2.469 2.257 2.472 2.772 2.594 2.542
Solar 0.305 0.427 0.522 0.570 0.770 0.904 1.069
Waste Biomass 0.496 0.488 0.494 0.503 0.484 0.492 0.496
Wind 1.596 1.729 1.765 2.113 2.367 2.454 2.642
Wood Biomass 2.170 2.214 2.041 2.153 2.172 2.154 2.158
Electricity Subtotalb 7.343 7.549 7.305 8.006 8.754 8.795 9.102
Biomass-based Diesel 0.205 0.198 0.222 0.291 0.279 0.325 0.361
Ethanol 1.090 1.107 1.141 1.182 1.189 1.218 1.223
Biofuels Subtotal 1.295 1.305 1.363 1.473 1.467 1.535 1.584
Otherc 0.801 0.817 0.823 0.832
Total 8.638 8.854 8.668 10.279 11.054 11.154 11.519
Doubling time:
3.24 y
7.01 y

The Solar Constant
S = 1354 W / m2
Fluctuates from 1321 (in July) to 1412 W / m2
(in January) due to slight change in distance
from Sun
Seasons are due to tilt of the Earth’s axis
relative to orbital plane, not the variation in
the solar constant
Includes infrared, visible, and ultraviolet light
9

Insolation
The amount of solar radiation that
reaches the Earth’s surface is called
insolation (incident solar radiation)
(not to be confused with insulation, a material
that impedes thermal conduction)
Insolation is affected by many factors…
10

Atmospheric absorption
The surface never gets more than 1050 W/m2
(on a clear day) due to atmospheric absorption
11

Energy Balance for the Earth
12
On average (including
cloudy days), only 50%
of solar radiation
reaches the Earth’s
surface.
Figure 6.4
page 156

A closer look
13
Atmosphere:+217% −217% = 0% net
Earth’s surface:+163% −160% = 3% net(in reality this is very
close to zero, the
numbers were rounded)
+48%
+23%
+33% +113%
−23%
−60%
−29% −105%
+8%+21%
+29% +105%−119%
−33%−8%

The tilt of the Earth’s Axis
Changes how much sunlight is received
by a location on the Earth throughout the
year
14

Seasonal change to insolation
The Sun’s angle above
the horizon changes
with the seasons
15

The sun doesn’t shine all day
Stevens Point gets about 1250 Btu/ft2/d
16
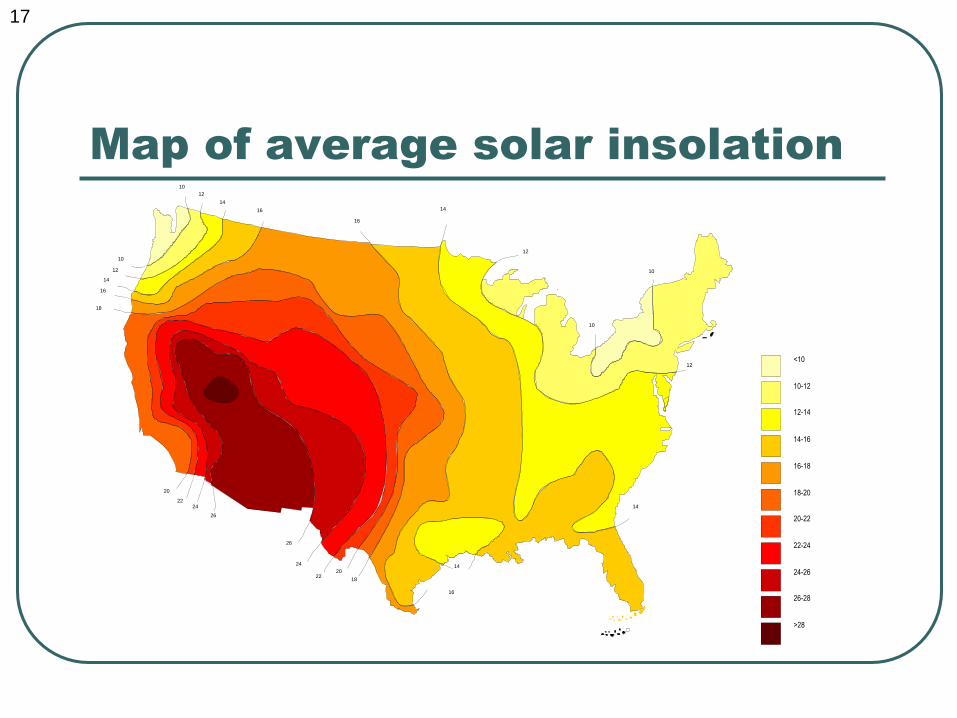
Map of average solar insolation
10
10
12
12
14
14
16
16
18
18
20
20
22
24
26
2224
26
16
14
14
16
14
12
10
10
12<10
10-12
12-14
14-16
16-18
18-20
20-22
22-24
24-26
26-28
>28
17
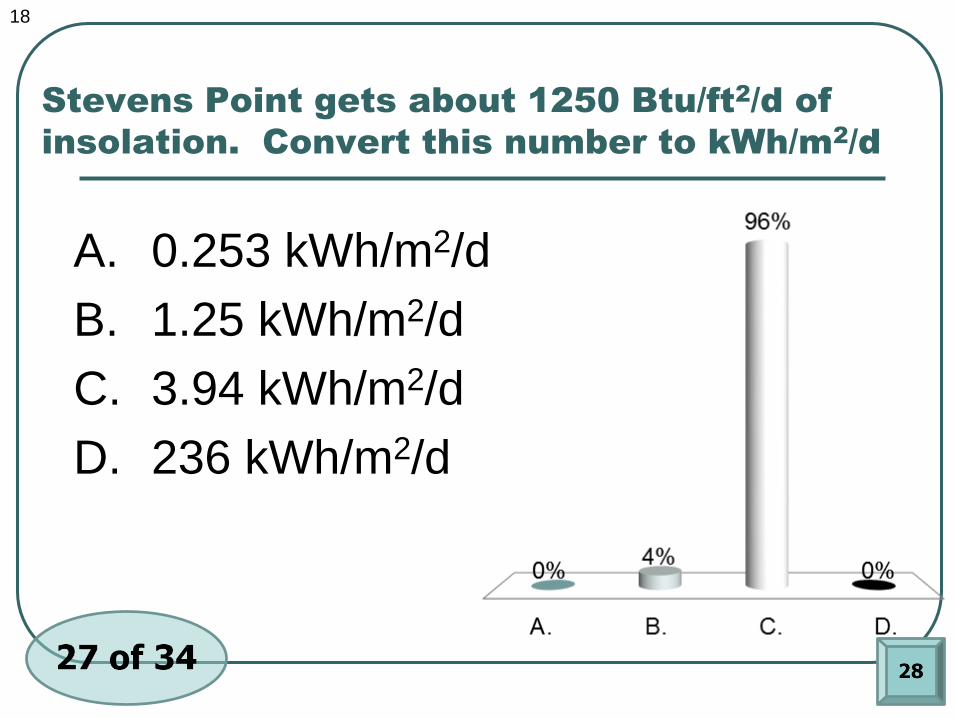
Stevens Point gets about 1250 Btu/ft2/d of
insolation. Convert this number to kWh/m2/d
18
A. 0.253 kWh/m2/d
B. 1.25 kWh/m2/d
C. 3.94 kWh/m2/d
D. 236 kWh/m2/d

Stevens Point gets about 1250 Btu/ft2/d of
insolation. Convert this number to kWh/m2/d
2 2
2 6 2
2
1250 Btu 1055 J 1 kWh 3.28 ft
ft d 1 Btu 3.6 10 J 1 m
kWh3.94
m d
19

How much water can you heat from 20ºC to
50ºC per day using a 10 m2, 50% efficient solar
collector in Stevens Point, on average?
20
A. 2260 kg
B. 565 kg
C. 150 kg
D. 3.94 kg

How much water can you heat from 20ºC to
50ºC per day using a 10 m2, 50% efficient solar
collector in Stevens Point, on average?
2
solar 2
67
7
kWh0.50 3.94 10 m 19.7 kWh/d
m d
kWh 3.6 10 J19.7 7.09 10 J/d
d 1 kWh
7.09 10 J/d565 kg
4190 J/kg °C 30°C
P IA
Qm
c T
21
about 147 gallons!

Solar Thermal Facts
Water heating is the most common
application for solar energy
Domestic hot water (DHW) systems are
being sold with a 5% annual growth (14 year
doubling time)
95% of solar heaters are for swimming pools,
only 5% for DHW
About two-thirds of a household’s DHW load
can be economically met by solar
EIA web site
22

Solar Thermal Facts
23
Estimated 35,464 new DHW
systems installed in 2010,
and 29,540 pool systems
Total US capacity is over 815
MWTh (megawatts thermal
equivalent)
Today there are an estimated
790,000 solar pool heating
systems installed in the U.S.,
more than any other solar
technology application.
SEIA Solar Industry Data graphs from 2013 report

Batch water heater
24

Flat-plate collector
25
US Solar Energy Year in Review 2008

Flat-plate collector
26
US Solar Energy Year in Review 2008

Right Here at UWSP
There is a solar water heating system on the roof of many residence halls and the HEC
Energy production used to be tracked on the web. There is a document about performance history of the HEC system and the eventual removal of the HEC panels in July 2016.
The UWSP Sustainabilitysite has some additionalinformation
27

Solar Space Heating
Three components:
• Insulation
• Solar collection
• Thermal storage
Can reduce heating
costs up to 80%
Not as popular due
to costs.
28
Compare 2008 installations: 139 MWTh hot water,
762 MWTh pool heating, 21 MWTh space heating
US Solar Market Insight SEIA Solar Heating & Cooling

Approximately what maximum percentage
of the 40,000 Btu/h home heating needs
can be met by a 700 ft2, 50% efficient
collector if the insolation is 1700 Btu/ft2/d?
29
A. 25%
B. 35%
C. 60%
D. 75%

Approximately what maximum percentage
of the 40,000 Btu/h home heating needs
can be met by a 700 ft2, 50% efficient
collector if the insolation is 1700 Btu/ft2/d?
2
solar 2
solar
Btu h40,000 24 960,000 Btu/d
h d
Btu1700 700 ft 0.50 595,000 Btu/d
ft d
595100 62%
960
Q
E
E
Q
30

Concrete has a density of 2400 kg/m3
and
a specific heat of 750 J/kg/oC. What
volume of concrete can store as much
heat as 10 m3
of water (42 MJ/oC)?
31
A. 4.29 m3
B. 12.1 m3
C. 18.5 m3
D. 23.3 m3

Concrete has a density of 2400 kg/m3
and
a specific heat of 750 J/kg/oC. What
volume of concrete can store as much
heat as 10 m3
of water (42 MJ/oC)?
A. 4.29 m3
B. 12.1 m3
C. 18.5 m3
D. 23.3 m3
32
6
3
3
and density
solve for :
42 10 J/ C
2400 kg/m 750 J kg C
23.3 m or about 12.7 tons of concrete!
mQ mc T
V
Qmc V c V
T
Q TV
c

National Solar Thermal Test
Facility – Albuquerque, NM
Can generate
about 1.5 MW
of electricity
Used for
research and
development
33

Solar Energy Generating Systems (SEGS)
Second largest solar
energy facility in the
world, with 354 MW
installed capacity
(California Mojave
Desert)
34
Entire image courtesy Wikipedia
Aerial view showing portions of four of the five SEGS III–VII plants located at Kramer Junction

Ivanpah Solar Electric Generating System
Commissioned 2014
CA Mojave desert
Currently world’s
largest solar
thermal facility
at 392 MW
List of worldwide
solar thermal
power stations
35