Physicochemical properties of Alaska Pollock (Theragra ...
116
Graduate Theses, Dissertations, and Problem Reports 2012 Physicochemical properties of Alaska Pollock (Theragra Physicochemical properties of Alaska Pollock (Theragra chalcogramma) surimi seafood nutrified with powdered cellulose chalcogramma) surimi seafood nutrified with powdered cellulose fiber and omega-3 polyunsaturated fatty acidS fiber and omega-3 polyunsaturated fatty acidS Alicia Debusca West Virginia University Follow this and additional works at: https://researchrepository.wvu.edu/etd Recommended Citation Recommended Citation Debusca, Alicia, "Physicochemical properties of Alaska Pollock (Theragra chalcogramma) surimi seafood nutrified with powdered cellulose fiber and omega-3 polyunsaturated fatty acidS" (2012). Graduate Theses, Dissertations, and Problem Reports. 3537. https://researchrepository.wvu.edu/etd/3537 This Thesis is protected by copyright and/or related rights. It has been brought to you by the The Research Repository @ WVU with permission from the rights-holder(s). You are free to use this Thesis in any way that is permitted by the copyright and related rights legislation that applies to your use. For other uses you must obtain permission from the rights-holder(s) directly, unless additional rights are indicated by a Creative Commons license in the record and/ or on the work itself. This Thesis has been accepted for inclusion in WVU Graduate Theses, Dissertations, and Problem Reports collection by an authorized administrator of The Research Repository @ WVU. For more information, please contact [email protected].
Transcript of Physicochemical properties of Alaska Pollock (Theragra ...
Graduate Theses, Dissertations, and Problem Reports
2012
Physicochemical properties of Alaska Pollock (Theragra Physicochemical properties of Alaska Pollock (Theragra
chalcogramma) surimi seafood nutrified with powdered cellulose chalcogramma) surimi seafood nutrified with powdered cellulose
fiber and omega-3 polyunsaturated fatty acidS fiber and omega-3 polyunsaturated fatty acidS
Alicia Debusca West Virginia University
Follow this and additional works at: https://researchrepository.wvu.edu/etd
Recommended Citation Recommended Citation Debusca, Alicia, "Physicochemical properties of Alaska Pollock (Theragra chalcogramma) surimi seafood nutrified with powdered cellulose fiber and omega-3 polyunsaturated fatty acidS" (2012). Graduate Theses, Dissertations, and Problem Reports. 3537. https://researchrepository.wvu.edu/etd/3537
This Thesis is protected by copyright and/or related rights. It has been brought to you by the The Research Repository @ WVU with permission from the rights-holder(s). You are free to use this Thesis in any way that is permitted by the copyright and related rights legislation that applies to your use. For other uses you must obtain permission from the rights-holder(s) directly, unless additional rights are indicated by a Creative Commons license in the record and/ or on the work itself. This Thesis has been accepted for inclusion in WVU Graduate Theses, Dissertations, and Problem Reports collection by an authorized administrator of The Research Repository @ WVU. For more information, please contact [email protected].

PHYSICOCHEMICAL PROPERTIES OF ALASKA POLLOCK (THERAGRA
CHALCOGRAMMA) SURIMI SEAFOOD NUTRIFIED WITH POWDERED CELLULOSE
FIBER AND OMEGA-3 POLYUNSATURATED FATTY ACIDS
Alicia Debusca
Thesis submitted to the
Davis College of Agriculture, Natural Resources and Design
at West Virginia University
in partial fulfillment of the requirements
for the degree of
Master of Science
in
Animal and Nutritional Sciences
Jacek Jaczynski, Ph.D., Chair
Kristen E. Matak, Ph.D.
Susan Partington, Ph.D., R.D.
Department of Animal and Nutritional Sciences
Morgantown, West Virginia
2012
Keywords: Surimi seafood, functional food, nutraceutical food, dietary fiber, powdered
cellulose, omega-3 polyunsaturated fatty acids, menhaden oil, algae oil, flaxseed oil, potassium
chloride, salt substitute

ABSTRACT
Physicochemical properties of Alaska Pollock (Theragra chalcogramma) surimi seafood
nutrified with powdered cellulose fiber and omega-3 polyunsaturated fatty acids
Alicia Debusca
Surimi is minced deboned fish meat that has been washed of lipids, sarcoplasmic proteins, and
other impurities. Surimi seafood, also known as “imitation crabmeat”, is widely enjoyed in the
United States; however, it is not currently nutrified with fiber, omega-3 polyunsaturated fatty
acids, and salt substitute. In the present study, preliminary experimentation was done to
determine the optimal level of fiber addition. Powdered cellulose was added to Alaska Pollock
surimi gels at levels of 0% (control), 2%, 4%, 6%, and 8% fiber. The objectives of this initial
study were to determine effect of dietary fiber on 1) color and textural properties and 2)
endothermic transitions and gelation properties of surimi gels. Increased fiber up to 6% resulted
in higher gel strength; however, detrimental effects were seen with 8% fiber, thus 6% fiber was
chosen for use. After determining optimal fiber concentration, Alaska Pollock surimi gels were
formulated containing 6% powdered cellulose fiber, 10% omega-3-rich oil (flax seed oil, algae
oil, and menhaden oil in a 8:1:1 ratio), and potassium chloride (KCl) as a salt substitute.
Treatments included a control (with no fiber or oil), 6% fiber, 10% oil, and fiber/oil (6% fiber +
10% oil). The objective of this study was to analyze the effects of added dietary fiber and ω-3
oil and their interactions with surimi. Surimi gel whiteness decreased (P<0.05) with fiber, oil,
and fiber/oil treatments due to increased (P<0.05) b* with oil addition and decreased (P<0.05) a*
with fiber addition and oil addition. Total TPA and Kramer shear force increased (P<0.05) with
the fiber/oil treatment indicating increased gel strength. Torsion shear stress and strain increased
(P<0.05) with the fiber treatment and oil treatment. Viscoelasticity (Gʹ) increased with the
fiber/oil treatment. Addition of both fiber and oil to surimi (fiber/oil treatment) increased the gel
strength and resulted in a quality product that could be useful for manufacturers in developing a
nutraceutical surimi product.

iii
ACKNOWLEDGEMENTS
I would first and foremost like to acknowledge and thank Dr. Jacek Jaczynski for his
guidance during this journey toward earning a Master’s degree. I appreciate all of his support,
encouragement, and answers to questions as I completed my research. I am also grateful for his
patience and prodding during the writing process. Without his guidance, I would still be at
square one.
I would also like to extend my gratitude to my committee members, Dr. Kristen Matak
and Dr. Susan Partington. I appreciate their expertise and support in this process and for the
privilege of being their student. Thank you to Dr. P. Brett Kenney for making his laboratory and
equipment available for use with my research. Thank you to Susan Slider for the use of her
laboratory equipment. I would also like to extend a big thank you to Reza Tahergorabi for taking
me under his wing in the lab, teaching me how to use the equipment, and helping me understand
the research process. Thank you to Sarah Beamer for helping me feel comfortable in the lab and
for being there whenever I had a question or concern.
Last, but not least, I would like to thank my family and friends. I would like to thank my
husband, David Debusca, for his endless support and patience during my bouts of frustration and
anxiety. I am so grateful for his loving encouragement and also for his technical assistance in the
formatting of this paper. I would like to thank my fellow interns (Jordan Bryan, Maria Dalzot,
and Christin Sell) for listening to my complaints and concerns. They have been a great support
throughout this process. Finally, I would like to thank my family for their endless support and
faith in me. Thank you!

iv
TABLE OF CONTENTS
Abstract ..................................................................................................................................... ii
Acknowledgements ................................................................................................................... iii
List of Tables ............................................................................................................................ vi
List of Figures .......................................................................................................................... vii
Chapter I .....................................................................................................................................1
Introduction .............................................................................................................................1
References ...............................................................................................................................2
Chapter II: Review of Literature ..................................................................................................5
Surimi .....................................................................................................................................5
Fiber ........................................................................................................................................7
Omega-3 Polyunsaturated Fatty Acids ................................................................................... 12
Salt and Salt Substitute .......................................................................................................... 22
Color ..................................................................................................................................... 32
Texture .................................................................................................................................. 33
Gelation and Thermal Denaturation ....................................................................................... 35
Summary ............................................................................................................................... 38
References ............................................................................................................................. 39
Chapter III: Pysicochemical Properties of Surimi Nutrified with Dietary Fiber .......................... 49
Introduction ........................................................................................................................... 49
Materials and Methods .......................................................................................................... 52
Surimi ................................................................................................................................ 52
Preparation of surimi paste ................................................................................................. 52
Preparation of surimi gels................................................................................................... 53
Color properties of heat-set surimi gels .............................................................................. 54
Texture properties of heat-set surimi gels ........................................................................... 54
Differential scanning calorimetry (DSC) ............................................................................ 55
Oscillatory dynamic rheology ............................................................................................ 56
Statistical Analysis ............................................................................................................. 56
Results and Discussion .......................................................................................................... 57
Color properties of heat-set surimi gels .............................................................................. 57
Texture properties of heat-set gels ...................................................................................... 58
Differential scanning calorimetry (DSC) ............................................................................ 61
Oscillatory dynamic rheology ............................................................................................ 62

v
Conclusion ............................................................................................................................ 64
References ............................................................................................................................. 64
Chapter IV: Interactions of Dietary Fiber and Omega-3-Rich Oils with Protein in Surimi Gels . 69
Introduction ........................................................................................................................... 69
Materials and Methods .......................................................................................................... 74
Surimi ................................................................................................................................ 74
Preparation of surimi paste ................................................................................................. 75
Preparation of surimi gels................................................................................................... 76
Color properties of heat-set surimi gels .............................................................................. 77
Texture properties of heat-set surimi gels ........................................................................... 77
Differential scanning calorimetry (DSC) ............................................................................ 78
Oscillatory dynamic rheology ............................................................................................ 79
Statistical analysis .............................................................................................................. 79
Results and Discussion .......................................................................................................... 80
Color properties of heat-set surimi gels .............................................................................. 80
Texture properties of heat-set surimi gels ........................................................................... 82
Differential scanning calorimetry (DSC) ............................................................................ 84
Oscillatory dynamic rheology ............................................................................................ 85
Conclusion ............................................................................................................................ 89
References ............................................................................................................................. 89
Tables ....................................................................................................................................... 96
Figures .................................................................................................................................... 100

vi
LIST OF TABLES
Table 1. Final surimi batter formulations. Batters with different levels of fiber were formulated
to contain 78% moisture and equal amount of protein, water, salt, and water-based crab flavor by
using inert filler, silicon dioxide (SiO2). Batch size was 1000g . ................................................ 96
Table 2. Effect of fiber on texture profile analysis* (TPA) of surimi gels. ................................. 97
Table 3. Final surimi batter formulations. Batters were formulated to contain equal amount of
protein (i.e., surimi) and salt substitute. Silicon dioxide (SiO2) was used as inert filler in place of
fiber. Oil replaced water at 1:1 ratio. Batch size was 1000g. ...................................................... 98
Table 4. Effect of nutraceutical additives on texture profile analysis* (TPA) of surimi gels. ..... 99

vii
LIST OF FIGURES
Figure 1. Effect of fiber on whiteness values* (top) and color properties* (bottom) of surimi
gels. ........................................................................................................................................ 100
Figure 2. Effect of fiber on torsion shear stress and strain* at mechanical fracture of surimi gels
(● – shear stress; ○ – shear strain). ......................................................................................... 101
Figure 3. Effect of fiber on Kramer shear force* (top) and hardness* (bottom) of surimi gels. 102
Figure 4. Average (n = 3) elastic moduli (G’, top graph) and differential scanning calorimetry
(DSC) thermograms (bottom graph) of surimi pastes with different levels of added fiber. ....... 103
Figure 5. Effect of nutraceutical additives on whiteness values* (top) and color properties*
(bottom) of surimi gels. ........................................................................................................... 104
Figure 6. Effect of nutraceutical additives on torsion shear stress and strain* at mechanical
fracture of surimi gels (● – shear stress; ○ – shear strain). ...................................................... 105
Figure 7. Effect of nutraceutical additives on Kramer shear force* (top) and hardness* (bottom)
of surimi gels. ......................................................................................................................... 106
Figure 8. Average (n = 3) differential scanning calorimetry (DSC) thermograms of surimi pastes
with added nutraceutical additives. .......................................................................................... 107
Figure 9. Average (n = 3) elastic moduli (G’) of surimi pastes with added nutraceutical
additives. ................................................................................................................................. 108

1
CHAPTER I
Introduction
Surimi is defined as an intermediate product used in the production of seafood analogues
and consists of myofibrillar fish protein that has been deboned and washed of lipids,
sarcoplasmic proteins, and other impurities (Hall, 2011). Surimi was traditionally a Japanese
product until the 1970s, after which both production and consumption expanded (Mansfield,
2003). Around that time, surimi was first introduced to North America where it is known as
“imitation crabmeat” (Park, 2005). Consumption in the United States has continued to steadily
increase over the years (Park, 2005). The popularity remains high and continues to grow
possibly due to the low-cholesterol, low-fat, and high nutrient content of surimi seafood (Campo
& Tovar, 2008).
Due to its low fat content, nutritional quality, and highly functional myofibrillar proteins,
surimi is a logical vehicle for functional additives. The market for functional foods is becoming
increasingly popular worldwide. Functional foods are those that contain added, technologically
developed ingredients with specific health benefits (Siró, Kápolna, Kápolna, & Lugasi, 2008).
Both fiber and omega-3 polyunsaturated fatty acids (PUFAs) are accepted to be physiologically
beneficial. Studies have shown that a high intake of dietary fiber is protective against coronary
heart disease, diabetes, obesity, and intestinal disorders (Anderson et al., 2009). Omega-3
PUFAs, especially eicosapentaenoic acid (EPA, 20:5n3) and docosahexaenoic acid (DHA,
22:6n3), are associated with improvement of cardiovascular measures, including decreased
triglycerides, total cholesterol, and low density lipoprotein (LDL) cholesterol, and increased high
density lipoprotein (HDL) cholesterol (Juturu, 2008; Nair, Leitch, Falconer, & Garg, 1997;

2
Narayan, Miyashita, & Hosakawa, 2006). In addition to fiber and omega-3 polyunsaturated fatty
acids, salt substitute in the form of potassium chloride (KCl) has been shown to reduce
hypertension by replacing sodium chloride (NaCl) in the diet and by the physiologically
beneficial effects of increased potassium intake itself (Houston, 2011; Matsui et al., 2006; Van
Mierlo, Greyling, Zock, Kok, & Geleijnse, 2010). Furthermore, the Food and Drug
Administration (FDA) encourages the production and use of foods that have low sodium and
high potassium (Karppanen & Marvaala, 2006). Incorporating fiber, omega-3 PUFAs, and
potassium chloride (as a salt substitute) into food would create a super-nutraceutical product with
the potential for cardiovascular and other health benefits.
Fiber, omega-3 PUFAs, and salt substitute have, individually, been successfully
incorporated into protein gels (Cardoso, Mendes, Vaz-Pires, & Nunes, 2009; Gimeno,
Astiasarán, & Bello, 1999; Horita, Morgano, Celeghini, & Pollonio, 2011; Pérez-Mateos, Boyd,
& Lanier, 2004; Sánchez-Alonso, Haji-Maleki, & Borderías, 2007). However, a combined
incorporation of fiber, omega-3 rich oils, and salt substitute has not been studied in surimi
seafood. The purpose of this study was to investigate the effects of these ingredients on
physicochemical properties, including texture, color, and gelation.
References
Anderson, J. W., Baird, P., Davis, R. H., Ferreri, S., Knudtson, M., Koraym, A., Waters, V., &
Williams, C. L. (2009). Health benefits of dietary fiber. Nutrition Reviews, 67(4), 188-
205. doi:10.1111/J.1753-4887.2009.00189.x
Campo, L., & Tovar, C. (2008). Influence of the starch content in the viscoelastic properties of
surimi gels. Journal of Food Engineering, 84, 140-147.
Cardoso, C., Mendes, R., Vaz-Pires, P., & Nunes, M. L. (2009). Effect of dietary fibre and
MTGase on the quality of mackerel surimi gels. Journal of the Science of Food and
Agriculture, 89, 1648-1658. doi:10.1002/jsfa.3636

3
Gimeno, O., Astiasarán, I., & Bello, J. (1999). Influence of partial replacement of NaCl with KCl
and CaCl2 on texture and color of dry fermented sausages. Journal of Agricultural and
Food Chemistry, 47, 873-877.
Hall, G. M. (2011). Surimi and fish mince products. In G. M. Hall (Ed.), Fish processing –
sustainability and new opportunities (pp. 98-111). Oxford: Wiley-Blackwell.
Horita, C. N., Morgano, M. A., Celeghini, R. M. S., & Pollonio, M. A. R. (2011). Physico-
chemical and sensory properties of reduced-fat mortadella prepared with blends of
calcium, magnesium and potassium chloride as partial substitutes for sodium chloride.
Meat Science, 89, 426-433.
Houston, M. C. (2011). The importance of potassium in managing hypertension. Current
Hypertension Reports, 13, 309-317.
Juturu, V. (2008). Omega-3 fatty acids and the cardiometabolic syndrome. Journal of the
Cardiometabolic Syndrome, 3, 244-253.
Karppanen, H., & Mervaala, E. (2006). Sodium intake and hypertension. Progress in
Cardiovascular diseases, 49(2), 59-75.
Mansfield, B. (2003). Spatial globalization: A “geography of quality” in the seafood industry.
Economic Geography, 79(1), 1-16.
Matsui, H., Shimosawa, T., Uetake, Y., Wang, H., Ogura, S., Kaneko, T., Liu, J., Ando, K., &
Fujita, T. (2006). Protective effect of potassium against hypertensive cardiac dysfunction:
Association with reactive oxygen species reduction. Hypertension, 48, 225-231.
Nair, S. S. D., Leitch, J. W., Falconder, J., & Garg, M. L. (1997). Prevention of cardiac
arrhythmia by dietary (n-3) polyunsaturated fatty acids and their mechanism of action.
Journal of Nutrition, 127, 383-393.
Narayan, B., Miyashita, K., & Hosakawa, M. (2006). Physiological effects of eicosapentaenoic
acid (EPA) and docosahexaenoic acid (DHA) – a review. Food Reviews International,
22, 291-307.
Park, J. W., & Lin, T. M. J. (2005). Surimi: Manufacturing and evaluation. In J. W. Park (Ed.),
Surimi and surimi seafood, 2nd
ed (pp. 33-106), Boca Raton, FL: Taylor and Francis
Group.
Pérez-Mateos, M., Boyd, L. C., & Lanier, T. C. (2004). Stability of omega-3 fatty acids in
fortified surimi seafoods during chilled storage. Journal of Agricultural and Food
Chemistry, 55, 7944-7949.

4
Sánchez-Alonso, I., Haji-Maleki, R., & Borderias, A. J. (2007). Wheat fiber as a functional
ingredient in restructured fish products. Food Chemistry, 100, 1037-1043.
doi:10.1016/j.foodchem.2005.09.090
Siró, I., Kápolna, E., Kápolna, B., & Lugasi, A. (2008). Functional food. Product development,
marketing and consumer acceptance – a review. Appetite, 51, 456-467.
Van Mierlo, L. A. J., Greyling, A., Zock, P. L., Kok, F. J., & Geleijnse, J. M. (2010). Suboptimal
potassium intake and potential impact on population blood pressure. Archives of Internal
Medicine, 170(16), 1501-1502.

5
CHAPTER II: REVIEW OF LITERATURE
Surimi
Surimi is defined as an intermediate product used in the production of seafood analogues
(Hall, 2011). The process used to create surimi involves washing debonded, minced fish meat to
isolate protein (Park & Lin, 2005). Mechanical deboners and mincers were developed in the
1970s, making surimi processing much easier and contributing to the boom in surimi production
seen in the 1980s (Hall & Ahmad, 1997). After the surimi is minced and deboned, it is washed
to remove sarcoplasmic proteins, enzymes, pigments, lipids, and heme compounds. The removal
of these impurities results in whiter color values, which indicate a higher quality surimi product
(Hastings, Keay, & Young, 1990). It also increases the concentration of actin and myosin in the
final product resulting in a surimi product with better gelation qualities (Hall & Ahmad, 1997;
Park, Lin, & Yongsawatdigul, 1997). The excess water is pressed out of the surimi and
cryoprotectants are added to prevent protein denaturation during freezing (Hall & Ahmad, 1997).
The surimi can then be stored at very low temperatures for later use (Park & Lin, 2005).
Every year, more than six million metric tons of whitefish are harvested (Guenneugues &
Morrissey, 2005). In 1999, Alaska Pollock (Theragra charcogramma) was the third most
abundantly harvested species in the world, and was the main source for surimi production
(Larkin & Sylvia, 1999; Mansfield, 2003). Although many other species are now being used for
surimi production, Alaska Pollock is still predominately favored, being used in about 50-70% of
surimi production (Park et al., 1997; Park & Lin, 2005). In fact, many manufacturers still
consider Alaska Pollock to the be the “premium” fish species for surimi production likely
because of its high whiteness values and lack of protease activity which contribute to a higher

6
quality product (Klesk, Yongsawatdigul, Park, Viratchakul, & Virulhakul, 2000; Reed & Park,
2008). In general, white fish like Alaska Pollock are favored in the production of surimi because
they contain fewer color pigments and fewer lipids (Hall, 2011). Other factors that are taken into
account when commercially producing surimi are the cost of the fish used and the properties of
the surimi produced (Hastings et al., 1990).
Surimi popularity has broadened over the years. Surimi was traditionally a Japanese
product until the 1970s, after which both production and consumption expanded (Mansfield,
2003). Around that time, surimi was first introduced to North America in the form of crabmeat
leg (Park, 2005). Surimi seafood in the United States is mainly found in the form of sticks,
flakes, or chunks and is known as “imitation crabmeat” (Park, 2005). The popularity of surimi
seafood in the United States dramatically increased in the 1980s when the United States began
catching Alaska Pollock and producing surimi (Mansfield, 2003). Although popularity declined
somewhat in the early 1990s, consumption in the United States has continued to steadily increase
over the years (Park, 2005). The consumption of surimi seafood in the United States reached
200 million pounds by 2008 (Reed & Park, 2008). The popularity remains high and continues to
grow possibly due to the low-cholesterol, low-fat, and high nutrient content of surimi seafood
(Campo & Tovar, 2008). Currently, the United States is one of the major producers of surimi
followed closely by Japan and Thailand (Hall, 2011). With consumption and popularity
becoming more widespread, surimi exports are becoming more globalized to areas such as
Southeast Asia, Western Europe, and North America (Mansfield, 2003). With this growing
popularity and globalization of surimi seafood, “the only limit to the use of surimi lies in the
imagination of the product developers” (Hall & Ahmad, 1997).

7
Fiber
Dietary fiber has become more popular in research and supplementation after
observations that populations consuming diets high in dietary fiber have lower incidence of the
chronic diseases that are commonly seen in Western populations with diets low in fiber
(Raninen, Lappi, Mykkänen, & Poutanen, 2011). Dietary fiber is defined as “remnants of the
edible part of the plant and analogous carbohydrate that are resistant to digestion and absorption
in the human small intestine with complete or partial fermentation in the human large intestine. It
includes polysaccharides, oligosaccharides, lignin and associated plant substances…that promote
beneficial physiological effects” (Bodner & Sieg, 2009; Prosky, 2000). There are two basic
types of dietary fiber: soluble and insoluble (Raninen et al., 2011). Insoluble fibers are mainly
composed of cellulose, hemicelluloses, and lignin whereas soluble fibers consist of gums,
polyfructoses, pectins, and mucilages (Bodner & Sieg, 2009).
It has been shown that a high intake of dietary fiber is protective against intestinal
disorders, heart disease, obesity, and diabetes (Anderson et al., 2009; Smith & Tucker, 2011).
Most Americans, however, consume less than half of the recommended daily fiber, or about 15
grams on average each day (Anderson et al., 2009; Dietary Guidelines Advisory Committee,
2010). The Institute of Medicine recommends an intake of 25 to 38 grams of fiber each day,
depending on age and gender (Dietary Guidelines Advisory Committee, 2010). This
recommendation includes both soluble and insoluble fiber, yet these two types of fiber have
different physiological effects (Brownlee, Dettmar, Strugala, & Pearson, 2006; Raninen et al.,
2011).
Fiber is well-known for its beneficial effects on cardiovascular risk factors. A high
intake of dietary fiber is associated with reduced risk of cardiovascular disease (Raninen et al.,

8
2011). The Nurses’ Health Study followed 75,521 women for 10 years and found that a dietary
fiber intake of 14 to 20 grams per day, although below the recommended intake for women, was
associated with greater protection from fatal and non-fatal cardiovascular disease (Smith &
Tucker, 2011). Soluble fiber has been implicated in reducing total and low density lipoprotein
(LDL) cholesterol, most likely due to its ability to bind bile acids, thus impeding micelle
formation and increasing cholesterol and bile acids excreted in the feces (Anderson et al., 2009;
Smith & Tucker, 2011).
Dietary fiber intake is related to intestinal health. Dietary fiber has been theorized to
reduce colorectal cancer via various mechanisms such as the dilution of fecal carcinogens by
fiber, decreased transit time that decreases the amount of time the colonocytes are exposed to
these compounds, and the production of short chain fatty acids that contribute to colonocyte
health (Anderson et al., 2009; Brownlee et al., 2006). Some of these mechanisms are related to
the effects of soluble fiber and others to insoluble fiber. Soluble fiber also can act to form a sort
of gel in the intestines, slowing transit time, whereas insoluble fiber creates “intestinal hurry,”
reducing the transit time (Anderson et al., 2009). Insoluble fiber, specifically, has been
implicated in easing defecation and reducing gut and stomach intolerance by increasing fecal
volume and weight and therefore adding bulk, improving stool consistency, decreasing transit
time, and increasing stool frequency (Raninen et al., 2011). Insoluble fiber is also associated
with hypertrophy of colonic smooth muscle due to its bulking effect (Brownlee et al., 2006).
There is a strong negative association between fiber intake and obesity (Anderson et al.,
2009; Smith & Tucker, 2011). This association can be explained by various mechanisms related
to fiber intake, including the feeling of fullness, delayed gastric emptying, and increased release
of satiating gut hormones (Anderson et al., 2009). Soluble fibers seem to contribute to slowing

9
the rate of gastric emptying and thereby delaying hunger and increasing satiety (Smith & Tucker,
2011). A similar reduction in gastric emptying rate is also seen after insoluble fiber
consumption; however, in terms of satiety, insoluble fiber seems to have more beneficial effects
on increasing short-term satiety as opposed to long-term satiety (Smith & Tucker, 2011).
There is a similar inverse relationship between fiber intake and diabetes risk via
mechanisms related to reduced obesity, improved lipid profile, and improved glucose
metabolism as seen in the Nurses’ Health Study, the Black Women’s Health Study, and the
Framingham Offspring Study (Smith & Tucker, 2011). In previous studies, individuals with the
highest fiber intake had a 62% reduction in the progression of prediabetes to diabetes over a
four-year period (Anderson et al., 2009). The mechanisms of this response were initially
attributed to soluble viscous fibers; however, recent research has shown insoluble cereal dietary
fiber, mainly comprised of cellulose and hemicelluloses, to be more significantly associated with
reducing the risk factors for diabetes (Weickert & Pfeiffer, 2008). Whereas soluble fibers may
reduce or slow down glucose absorption after a meal, insoluble fiber has been shown to increase
insulin sensitivity and the body’s glycemic response (Raninen et al., 2011; Smith & Tucker,
2011). In one study, consumption of 31 grams per day of highly purified insoluble oat fiber for
three days resulted in a 13% improvement in whole body insulin sensitivity in overweight and
obese women (Smith & Tucker, 2011). The distinct mechanisms of insoluble fiber may be
attributed to the beneficial effects of insoluble fiber on factors of obesity, such as increasing
satiety and gut transit time postmeal and reducing weight gain; however, no obvious mechanisms
exist (Weickert & Pfeiffer, 2008).
Although fiber has been proven to be physiologically beneficial, it was not until the
1980s that consumers became aware of dietary fiber (Bodner & Sieg, 2009). Generally, whole

10
foods are promoted and recommended as sources of fiber; however, the low intake of dietary
fiber seen in the current U.S. diet is evidence that Americans are not meeting their needs with
whole food sources, and supplementation or fortification with isolated food components may be
necessary (Smith & Tucker, 2011). In addition, observations from the Women’s Health
Initiative and observations by the Food and Drug Admnistration (FDA) indicate that consumers
are not as effective in modifying dietary habits as they intend to be (Anderson et al., 2009).
When adding dietary fiber to foods as a supplemented or fortified ingredient, it is
important that the original taste and other sensory characteristics are maintained as consumers
are unlikely to change traditional quality expectations for health benefits (Bodner & Sieg, 2009).
Fiber-containing ingredients such as whole grains, flours, and bread crumbs are currently used in
a variety of products (Bodner & Sieg, 2009). Processed meats may also be a vehicle for fiber
supplementation (Bodner & Sieg, 2009). Germany has already come out with meat products
marketed as “enriched with fibers” and “rich in fibers” (Bodner & Sieg, 2009).
Researchers have studied fiber incorporation in surimi; however, fiber is not currently
used as an additive in surimi production (Cardoso, Vas-Pires, & Nunes., 2009; Sánchez-Alonso,
Haji-Maleki, & Borderías, 2007). Fibers commonly used in research include carrageenans,
garrofin, guar, and xanthan, which are soluble fibers (Montero, Hurtado, & Pérez-Mateos, 2000;
Sánchez-Alonso et al., 2007). Soluble fibers often have the effect of softening surimi gel
products and are thus detrimental to textural properties, whereas insoluble fibers were seen to
improve hardness and springiness in a study by Cardoso et al. (2009). Sanchez-Alonso et al.
(2007) found that wheat dietary fiber improved the hardness and the whiteness of surimi made
from hake and horse mackerel, demonstrating the potential for fiber incorporation in surimi
seafood.

11
Research supports the use of highly-extracted, long-chain cellulosic fibers in increasing
the functionality of processed meats (Bodner & Sieg, 2009). Powdered cellulose is a food-grade
refined fiber that is formed by cooking organic plant material in a caustic solution at high
temperatures and pressure to dissolve the lignin structure and remove impurities by filtering and
washing (Bodner & Sieg, 2009). The remaining material is bleached, dried and ground, resulting
in powdered cellulose fiber (Bodner & Sieg, 2009). The organic material used to make
powdered cellulose typically comes from wood, cotton, or bamboo sources (Bodner & Sieg,
2009). Powdered cellulose is typically used as a noncaloric bulking agent in calorie-reduced
foods (Ang & Miller, 1991). In addition to being noncaloric, powdered cellulose fiber is
insoluble, neutral in taste and odor, white in color, and inert toward other ingredients (Ang,
1991; Bodner & Sieg, 2009; Sánchez-González, Rodríguez-Casado, Careche, & Carmona, 2009).
Cellulose is a porous fiber and can absorb water and oil; however, these physical properties are
dependent on fiber length, with longer fibers having a higher water and oil holding capacity than
shorter fibers (Ang, 1991; Bodner & Sieg, 2009). Water holding capacity is significantly higher
in fiber around 100 microns in length compared to 35 microns in length, but fiber lengths more
than 110 microns only had slightly increased water holding capacity compared to lengthsaround
100 microns. Oil retention capacity follows the same trend; however, oil retention capacity is
not as great as water retention capacity in powdered cellulose fiber of all lengths (Ang, 1991).
Fiber length also seems to be important in textural properties of surimi gels as powdered
cellulose fiber of 11 to 55 microns in length resulted in significantly decreased firmness,
chewiness, and rubberiness at the 2% level compared to incorporation of longer fibers (Yoon,
Lee, & Chung, 1987). Powdered cellulose with a fiber length of 110 microns also showed some
thickening properties, but this observation was not seen with other fiber lengths, and the fiber
12
will settle out of solution upon sitting (Ang, 1991). Yoon and Lee (1990) found cellulose to
have some cryoprotectant properties, but these properties were not seen in other studies.
Omega-3 Polyunsaturated Fatty Acids
In populations where total fat constitutes more than 30% of total energy, mortality from
cardiovascular disease is seen to be low, contrary to the belief that high-fat diets contribute to
cardiovascular disease; however in these populations, fish and plant oils are the primary sources
of fat consumed (Psota, Gebauer, & Kris-Etherton, 2006). One population specifically, the
Greenland Eskimos, consumed a diet very high in fat from seal, whale, and fish, but had a very
low incidence in coronary heart disease (Narayan, Miyashita, & Hosakawa, 2006). The lower
rates of cardiovascular disease seen in these fish eating communities prompted investigations
into the nutritional benefits of fish consumption (Ruxton, Reed, Simpson, & Millington, 2007).
Since this discovery, the global market for omega-3 polyunsaturated fatty acid (PUFA)
supplements has grown to over US$700 million, with an annual growth rate of 8% (Clough,
2008).
Omega-3 PUFAs include α-linolenic acid (ALA, 18:3n3), eicosapentaenoic acid (EPA,
20:5n3), and docosahexaenoic acid (DHA, 22:6n3). ALA is the “parent” fatty acid of the
omega-3 family and is primarily found among plant sources, including nuts (like English
walnuts), seeds (such as sesame), and flaxseed, soybean, canola, and olive oils (Calder &
Yaqoob, 2009; Gogus & Smith, 2010; Psota et al., 2006; Ratnayake & Galli, 2009). Humans do
not possess the enzymes necessary to synthesize ALA, thus ALA is considered an essential fatty
acid that must be consumed in the diet (McManus, Merga, & Newton, 2011). EPA and DHA
can be synthesized from ALA in the body, but the conversion rates are low (McManus et al.,

13
2011). In the diet, EPA and DHA are major components of marine lipids and are especially high
in cold-water fish species (Gogus & Smith, 2010; Ratnayake & Galli, 2009). Unicellular
phytoplankton, including algae, and seaweeds appear to be an exception in that they are able to
synthesize EPA and DHA and thus are a major source of long-chain omega-3 PUFAs for both
fish and for humans (Narayan et al., 2006; Ratnayake & Galli, 2009).
In the typical Western diet, the current ratio of omega-6 to omega-3 intake is close to
16:1 whereas the recommended ratio is 4:1 (n-6:n-3) (Simopoulos, 2003). In North America,
Europe, and Australia, lineleic acid (an omega-6 fatty acid) is consumed in quantities of 8.3 to
19.0 grams per day in men and 6.8 to 13.2 grams per day in women, which is approximately ten
times as high as ALA intake (Ratnayake & Galli, 2009). Psota et al. (2006) report ALA intake to
be 1.7 grams/day for men and 1.3 grams/day for women. EPA and DHA intake is reported to be
on average 0.1 to 0.2 grams/day in North America (Anderson & Ma, 2009).
Studies have shown that reducing the omega-6 to omega-3 ratio to 4:1 by increasing
omega-3 PUFA intake and/or decreasing omega-6 PUFA intake results in decreased total
mortality by 70% via secondary prevention of cardiovascular disease (McManus et al., 2011).
The Institute of Medicine (2005) has recommended that ALA intake should be 1.6 grams per day
for men and 1.1 grams per day for women. In addition, the Dietary Guidelines for Americans
recommends consuming 8 ounces of a variety of seafood each week to provide 250 mg per day
of EPA and DHA (Dietary Guidelines Advisory Committee, 2010). The American Heart
Association (AHA) similarly recommends two servings of fish per week, but recommends a total
intake of one gram of EPA and DHA per day with cardiovascular disease (Kris-Etherton, Harris,
Appel, & AHA Nutrition Committee, 2002). To expound, at least 500 mg per day is
recommended for cardiovascular disease risk reduction and one gram per day is recommended

14
with existing cardiovascular disease (Domingo, 2007). Another source recommends 200 to 650
milligrams per day for general good health, one gram per day for secondary prevention of
myocardial infarction, and two to four grams per day to lower blood triglycerides (Calder &
Yaqoob, 2009). The minimum effective doses of omega-3 PUFAs has not yet been determined;
however, the Food and Drug Administration (FDA) has determined that an intake of three grams
per day is generally regarded as safe (Gogus & Smith, 2010).
After ingestion, omega-3 PUFAs are digested the same as other long-chain fatty acids
(Ratnayake & Galli, 2009). Digestion begins by the action of the enzyme lipase that hydrolyzes
fatty acids from triglycerides (Ratnayake & Galli, 2009). Although lipase is found in the mouth
(lingual lipase), stomach (gastric lipase), and small intestines (pancreatic juices), the small
intestine is the major site of fat digestion (Ratnayake & Galli, 2009). The presence of fat in the
duodenum signals the gall bladder to release bile and pancreatic juices (Ratnayake & Galli,
2009). Bile assists in emulsifying fats while pancreatic juices contain sn-1(3) lipase that yields
2-monoacylglycerol and free fatty acids as final products (Ratnayake & Galli, 2009). The
remaining 2-monoacylclycerol and free fatty acids as well as cholesterol and phospholipids are
stabilized with bile salts to form micelles that are able to diffuse between microvilli of
enterocytes and enter the intestinal cells (Ratnayake & Galli, 2009). Inside the intestinal cells,
free fatty acids and 2-monoacylglycerols are then re-esterified to form triglycerides which are
transported out of the cell via chylomicrons (Ratnayake & Galli, 2009). These chylomicrons
travel through the lymph system into the blood stream and eventually reach the liver where the
triglycerides are repackaged into very low density lipoproteins (VLDLs) that which travel
throughout the body as a source of free fatty acids for cellular uptake (Ratnayake & Galli, 2009).

15
In the cells of the body, ALA can be converted to EPA and DHA, although this process is
very inefficient, as previously mentioned (McManus et al., 2011). ALA is converted to EPA and
DHA via a series of enzymes that are shared with the omega-6 fatty acids, with the rate limiting
step being the first enzyme in the process, Δ-6 desaturase (Ratnayake & Galli, 2009). Although
Δ-6 desaturase has a greater affinity for ALA than linolenic acid (LA, of the omega-6 fatty acid
series), this advantage is offset by the high concentration of LA found in the typical Western diet
in comparison to ALA (Ratnayake & Galli, 2009). In addition, study has shown that the
conversion rate of ALA to EPA is 0.2% and the subsequent conversion to DHA is only 0.05%,
although other sources report the conversion rates to be 5 to 10% and 2 to 5% for EPA and DHA,
respectively (Psota, Bebauer, & Kris-Etherton, 2006; Ratnayake & Galli, 2009). Because of
these low conversion rates, individuals who do not eat seafood will not achieve recommended
DHA intake without supplementation (McManus et al., 2011).
EPA and arachidonic acid (AA) are more biologically active than their respective parent
fatty acids, ALA and LA, as these 20-carbon molecules can be converted to eicosanoids (Psota et
al., 2006). Eicosanoids act as local hormones and include prostaglandins, thromboxanes,
prostacyclins, and lipoxins (Ratnayake & Galli, 2009). As a 22-carbon molecule, DHA is
converted to docosanoids (Ratnayake & Galli, 2009). Upon intracellular stimulation by
phospholipase A2, these long-chain fatty acids are released from cell membrane phospholipids
and are rapidly metabolized to form eicosanoids (Ratnayake & Galli, 2009). Eicosanoids and
docosanoids contribute to blood pressure regulation, platelet aggregation, blood clotting, blood
lipid profiles, immune responses, and inflammatory responses (Ratnayake & Galli, 2009). AA
and EPA are metabolized using the same enzymes (e.g. COX II), however EPA produces 3-
series eicosanoids that are less pro-inflammatory and decrease platelet aggregation compared to

16
AA which produces proinflammatory and proaggregatory 2-series eicosanoids (Tou, Altman,
Gigliotti, Benedito, & Cordonier, 2011). With an increased consumption of EPA and DHA,
these omega-3 PUFAs are incorporated into cells at the expense of AA, and eicosanoid
production shifts from 2-series eicosanoids to 3-series eicosanoids due to the lower quantity of
AA available for use as a substrate (Nair, Leitch, Falconer, & Garg, 1997).
An imbalance in eicosanoids, in favor of omega-6 metabolites, can lead to development
of certain pathological conditions (Ratnayake & Galli, 2009). Benefits of omega-3 PUFAs have
been implicated in various physiological conditions including cardiovascular disease, platelet
aggregation, hypertension, hyperlipidemia, inflammation, cancer, dementia, Alzheimer’s disease,
and depression (McManus et al., 2011). This is perhaps because a chronically upregulated
inflammatory state, due in part to the production of pro-inflammatory eicosanoids from omega-6
derivatives, is involved in the etiology of these conditions, including cardiovascular disease,
insulin resistance, and cancer (Anderson & Ma, 2009). The mechanisms of action involved in
the progression or prevention of these diseases by omega-3 fatty acids include the ability of these
PUFAs to alter physical properties of cell membranes (including fluidity), affect cell signaling
pathways by modifying expression and activity of membrane receptors or modifying intracellular
signal transduction mechanisms, and alter patterns of eicosanoids produced (Calder & Yaqoob,
2009).
Omega-3 PUFAs have been shown to reduce mortality caused by myocardial infarction
(MI) and sudden death in patients with coronary heart disease (CHD) and in so doing have been
proven useful in the secondary prevention of cardiovascular disease (Ruxton et al., 2007). A
meta-analysis of epidemiological studies showed a 7% and 14% reduction in coronary artery
disease (CAD) with a 20 gram per day increase in fish intake and for any amount of fish intake,

17
respectively (Psota et al., 2006). Additional epidemiological studies reported decreases in
cardiovascular disease (CVD) with fish oil consumption possibly explained by the role of fish oil
in reducing hypertriglyceridemia (Nair et al., 1997). Salmon consumption has been shown to
significantly decrease triglyceride levels by 15% and low density lipoprotein (LDL) cholesterol
by 7% and increase high density lipoprotein (HDL) cholesterol by 5% (Juturu, 2008). EPA and
DHA have been shown to lower blood pressure and prevent hypertension (Narayan et al., 2006).
EPA and DHA are inversely associated with CVD mortality, reducing CVD mortality by 30% to
60% in some studies (Psota et al., 2006).
Study shows that increased EPA incorporation into cells increases competition with AA
resulting in lower production of the eicosanoids thromboxane-A2, leukotriene-B4, and
prostaglandin-E2 and increased production of less potent eicosanoids thereby reducing platelet
aggregation, vasoconstriction, and leukocyte chemotaxis and adherence (Anderson & Ma, 2009).
The eicosanoids produced from EPA and DHA result in a decrease in platelet aggregation that
reduces the development of atherosclerotic plaques by making blood less viscous and decreasing
the likelihood of thrombus formation, and also an increase in vasodilation that promotes blood
flow with less resistance thereby decreasing the likelihood of endothelial damage and plaque
initiation (Anderson & Ma, 2009).
Although most cardiovascular benefits are seen with EPA and DHA, ALA also has an
overall cardio-protective effect that is not explained by modest reductions in cholesterol levels
(Anderson & Ma, 2009). In one study, a high ALA diet (6.5% of total energy from ALA)
resulted in approximately 75% decrease in C-reactive protein (CRP), which is a marker of
inflammation associated with heart disease (Zhao, Etherton, Martin, West, Gillies, & Kris-
Etherton, 2004).
18
Omega-6 PUFAs have been shown to promote cancer development whereas omega-3
PUFAs may reduce or protect against tumor development (Narayan et al., 2006). A study using
menhaden oil at 20% of total energy found reduced tumor incidence and prolonged tumor
latency (Anderson & Ma, 2009). EPA and DHA inhibit the enzyme cycloxygenase, reducing the
amount of the prostaglandin eicosanoids produced, and increasing the activity of the enzyme
lipoxygenase which produces the eicosanoids hydroxyeicosatrienoic acid and leukotriene-B4
which may slow the process of cancerous cells overtaking a tissue (Narayan et al., 2006). EPA
and DHA act to decrease the activation of oncogene transcription factors, inhibit angiogenesis,
and promote apoptosis (Anderson & Ma, 2009). ALA has also been seen to decrease
angiogenesis and metastasis in some studies (Anderson & Ma, 2009).
Both EPA and DHA had favorable effects on markers of diabetes, resulting in increased
insulin sensitivity, decreased inflammatory mediators, and altered lipid metabolism in lean adults
(Anderson & Ma, 2009). When EPA and DHA are incorporated into cell membranes, they
increase membrane fluidity which has the effect of increasing the number of insulin receptors on
cell membranes and increasing the affinity of the receptors to insulin (Anderson & Ma, 2009).
EPA also increases the ability of erythrocytes to clear glucose when EPA is given to individuals
with type 2 diabetes mellitus (Narayan et al., 2006).
Research has shown that DHA supports neural and visual development of infants,
improving cognitive performance and visual acuity (Arterburn, Oken, Hall, Hamersley, Kuratko,
& Hoffman, 2008). DHA has also been found to be protective against all-cause dementia
(Arterburn et al., 2008). Plasma studies show that low omega-3 levels are associated with
dementia (Ruxton et al., 2007). In individuals 55 years of age and older, fish consumption over
20 grams per day reduced the risk of cognitive impairment, cognitive decline, dementia, and
19
Alzheimer’s disease (Ruxton et al., 2007). Fish consumption is also associated with higher self-
reported mental health status, and reduced tissue levels of omega-3 PUFAs were seen in
depressed patients (Ruxton et al., 2007). DHA is a major constituent of membrane
phospholipids in neural structures including those of the brain and retina (Narayan et al., 2006).
By enabling fluidity in neuronal membranes, omega-3 PUFAs help regulate neurotransmitters
(Ruxton et al., 2007). Omega-3 PUFAs may also reduce the severity of depression by enhancing
the rate of serotonin production (Gogus & Smith, 2010).
Omega-3 PUFAs have been used in the treatment of inflammatory diseases such as
inflammatory bowel disease (IBD), eczema, psoriasis, and rheumatoid arthritis (Gogus & Smith,
2010). There is good evidence that omega-3 PUFAs are therapeutically beneficial in the case of
rheumatoid arthritis by mediating the inflammatory effects of the immune system (Ruxton et al.,
2007). Significant improvement has also been seen in active mild-to-moderate ulcerative colitis,
an inflammatory bowel disease (Ruxton et al., 2007). EPA and DHA are substrates for anti-
inflammatory compounds, such as resolvins and protectins, which inhibit activation of nuclear
factors (including nuclear factor-κB and interleukins) that produce inflammation (Gogus &
Smith, 2010). The incorporation of EPA and DHA into cell membranes also increases the
fluidity of the membranes, making them more flexible and resistant to extrinsic and intrinsic
destructive factors, especially inflammatory agents (Gogus & Smith, 2010).
The various sources of omega-3 PUFAs have different properties. The most bioavailable
sources of omega-3 PUFAs are from fish and seafood (McManus et al., 2011). Menhaden oil is
a type of fish oil that contains omega-3 PUFAs primarily in the form of EPA and DHA
(Pietrowski, Tahergorabi, Matak, Tou, & Jaczynski, 2011). Menhaden oil has a ratio of EPA to
DHA of 3:1 (Tou et al., 2011). Narcisco-Gaytán et al. (2011) found that EPA and DHA from

20
menhaden oil could successfully be incorporated into thigh muscles of broilers. In comparison,
algae oil has been found to be a bioavailable source of omega-3 PUFAs when delivered in
capsules and fortified in snack bars (Arterburn et al., 2007). In a study by Pietrowski et al.
(2011), algae was been found to be high in DHA compared to menhaden, flaxseed, and krill oils.
Arterburn et al. (2008) found that equivalent amounts of DHA from algal-oil capsules and
salmon oil were incorporated into plasma phospholipids and erythrocytes. Algae oil also
contains carotenoids and vitamin E which may be useful in providing antioxidative properties as
well as providing added nutritional benefit (Nitsan, Mokady, & Sukenik, 1999). Flaxseed oil has
the highest omega-3 to omega-6 ratio among plant sources (53.5% ALA and 12.7% LA), with
the majority of the omega-3 being ALA (Chen, Nguyen, Semmens, Beamer, & Jaczynski, 2006).
The high cost of fish as well as the potential for contaminants, such as mercury,
cadmium, polychlorinated biphenyl (PCB), polycyclic aromatic hydrocarbon (PAH), etc., may
contribute to the lack of fish intake in the Western diet (Candela, López, & Kohen, 2011;
Domingo, 2007). However, if individuals do not eat fish or change dietary habits to include fish
in their diet, they are not likely to achieve the recommended EPA and DHA intake (Calder &
Yaqoob, 2009). Food enrichment is a potential option for consumers who do not wish to
consume oily fish or fish oil supplements (Calder & Yaqoob, 2009). Because of this, there is a
growing need to find ways to enrich or fortify foods with omega-3 PUFAs to create an
inexpensive, desirable product that contains significant amounts of omega-3 PUFAs for
consumers (Tolasa, Lee, & Cakli, 2010). Also known as a functional food, these products would
contain added, technologically developed ingredients with specific health benefits and would
provide a way to achieve health effects without the ingestion of supplements or the original food
source (Kassis, Beamer, Matak, Tou, & Jaczynski, 2010; Siró, Kápolna, Kápolna, & Lugasi,
21
2008). The presence of a food matrix augments the rate of entry of omega-3 PUFAs into the
intestinal mucosal cells, supporting the fortification of omega-3 PUFAs in food products
(McManus et al., 2011). Levels of fortification should be significant in the serving size
consumed; however, the level of enrichment is currently limited by food technology, processing,
and storage conditions (Calder & Yaqoob, 2009; McManus et al., 2011). Incorporation of
omega-3 PUFAs may alter taste, but incorporation has been successful in egg-products (Kassis et
al., 2010). Enriching other food products such as meat, milk, eggs, spreads, and yogurts would
allow consumers to increase intake of EPA and DHA without changing dietary habits (Calder &
Yaqoob, 2009).
Surimi is isolated fish protein that has been washed during manufacturing to remove fats
and other substances and thereby create a functional actomyosin concentrate (Park, Lin, &
Yongsawatdigul, 1997). Surimi is a logical vehicle for omega-3 PUFA incorporation because it
is a good source of protein and lacks accompanying high quantities of saturated fat found in
many other meat sources (Tolasa et al., 2010). Addition of omega-3 PUFAs would “mimic”
natural fish products that already contain these nutrients (Park, Kelleher, McClements, &
Decker, 2004). For successful incorporation, it is necessary to have a highly cohesive structure,
such as that provided by surimi, to allow for uniform dispersion of oil droplets (Tolasa et al.,
2010). It is theorized that oil droplets may be protected by protein membranes or a cohesive
protein matrix, thus allowing for complete incorporation into the product (Tolasa et al., 2010).
Park et al. (2004) observed that addition of oil as an emulsion did not decrease gel strength of
surimi in comparison to a control with no oil added; however, a decrease in gel strength was seen
with bulk oil addition. Tolasa et al. (2010) reported that gel-softening occurs when oil has a
disrupting effect on the structure of the gel. On the other hand, an increase in gel strength was

22
seen when oil was added in place of the same amount of water used in formulation (Pérez-
Mateos, Boyd, & Lanier, 2004). Pérez-Mateos et al. (2004) observed an increase in breaking
force and hardness in heat-induced mackerel gels containing 2.5% omega-3 rich oil compared to
a control with no oil added. The same researchers also observed an increase in lightness (L*) in
the samples with oil. Oil has been found to act as a whitener in surimi due to the ability of oil
droplets to scatter light (Benjakul, Visessanguan, & Kwalumtharn, 2004). These properties show
that oil can be successfully incorporated into surimi seafood.
Salt and Salt Substitute
Hypertension is one of the leading causes of heart disease and death in developed
countries (Houston, 2011; Karppanen & Mervaala, 2006). Hypertension, however, is a
modifiable cause of death that resulted in 395,000 preventable deaths in the United States alone
in 2005 (Appel et al., 2011). Worldwide, hypertension is responsible for 7.6 million deaths, or
13.5% or total mortality (Montasser et al., 2010). Hypertension accounts for 54% of strokes and
47% of coronary heart disease events worldwide (Appel et al., 2011). Although more than 72
million Americans, or one third of all adults, are estimated to have hypertension, only 34%
achieve blood pressure (BP) control. Hypertension is the most common reason for patient visits
to physician offices, and resulted in an estimated $55 billion in medical costs in 2001 (Cotugna
& Wolpert, 2011; Houston, 2011). Direct and indirect costs for cardiovascular disease (CVD),
for which hypertension is a risk factor, were estimated to be over $400 billion in 2009 (Appel et
al., 2011).
Hypertension, or blood pressure (BP) more than 140/90 mm Hg, is one of the main risk
factors for cardiovascular disease and as such increases the risk for myocardial infarction,

23
coronary heart disease, cerebrovascular accident, and end-stage renal disease (Cotugna &
Wolpert, 2011; Karppanen & Mervaala, 2006). It is estimated that suboptimal BP levels
attribute to two-thirds of cerebrovascular disease and half of coronary heart disease worldwide
(China Salt Substitute Study Collaborative Group, 2007). A reduction in systolic BP by 2 to 3
mm Hg could result in reductions CVD events (Taylor, Ashton, Moxham, Hooper, & Ebrahim,
2011). Such a reduction may decrease stroke mortality by 10% and ischemic heart disease
mortality by 7% (Montasser et al., 2010). If these reductions are maintained long-term, a 1 mm
Hg reduction and 4 mm Hg reduction would result in a 5% and 20% decrease in CVD,
respectively (Taylor et al., 2011).
Diet has been found to play an important role in BP, indicating the possible role of
therapeutic dietary strategies for reducing BP (Houston, 2011). Dietary therapies include
decreased sodium intake, increased potassium and magnesium intake, a diet rich in fruits and
vegetables, and various antioxidants (Houston, 2011). Other lifestyle interventions also include
weight control and exercise (Montasser et al., 2010). Dietary goals of the United States and
other countries worldwide include a reduction of sodium as a key factor in lowering BP
(Karppanen & Mervaala, 2006). Increased potassium and the Dietary Approaches to Stop
Hypertension (DASH) diet, which focuses on increased fruit and vegetable intake alongside
reduced sodium intake, are current dietary recommendations for lowering BP from the European
Society of Hypertension (ESH), the World Health Organization (WHO), the International
Society of Hypertension (ISH), and the British Hypertension Society (Houston, 2011). Because
of the positive relationship of sodium intake to BP, a reduction in sodium intake of 1200 mg per
day could save $10 to $24 billion in health care costs annually (Appel et al., 2011; Taylor et al.,
2011). This may be especially true for the elderly population as the strength of association

24
between sodium and BP increases with age and BP in cross-sectional studies (Geleijnse,
Witteman, Bak, den Breeijen, & Grobbee, 1994). Studies show that therapeutic diets may be
more effective in reducing BP if the intake of several minerals is changed at once, for example
reducing sodium intake while increasing potassium intake (Geleijnse et al., 1994; Van Mierlo,
Greyling, Zock, Kok, & Geleijnse, 2010).
The relationship between salt intake, high BP, and CVD is well-established (Wesseling,
Koeners, & Joles, 2011). It has been shown that high salt-loading on salt-sensitive subjects can
result in hypertension as well as left ventricular hypertrophy and hypertensive heart failure
(Matsui et al., 2006). Although sodium intake is related to increased BP which results in the
development of more progressed disease states, sodium also has physiological effects
independent of BP including fibrosis in the heart, kidneys, and arteries (Appel et al., 2011). This
is because a high sodium intake is associated with increased large elastic artery stiffness with
aging (Appel et al., 2011). High sodium intake can also cause direct damage to the kidney,
accelerating kidney disease caused by other conditions (Appel et al., 2011). An increased 24-
hour urinary sodium excretion, which is reflective of sodium intake, correlated significantly with
an increased risk of type 2 diabetes mellitus independent of obesity and hypertension (Cotugna &
Wolpert, 2011).
Whereas increased sodium intake contributes to multiple disease states, a reduction in
sodium intake has been seen to blunt the rise in BP seen with increasing age (Appel et al., 2011).
In a trial of patients with resistant hypertension, a reduction in sodium intake by 4600 mg per day
lowered systolic and diastolic BP by 22.9 mm Hg and 9.1 mm Hg, respectively (Appel et al.,
2011). In a study by Lennie et al. (2011), it was observed that individuals with New York Heart
Association (NYHA) class III and IV heart failure who consumed more than 3 grams of sodium

25
per day were more likely to be hospitalized for cardiac problems than those who consumed less
than 3 grams per day. Sodium restriction to 40% of the usual dietary level produced a fall of 6.7
mm Hg and 3.5 mm Hg in systolic and diastolic BP, respectively, in the DASH study
(Karppanen & Mervaala, 2006). A major trial in the United States also reported that reduced
sodium intake can prevent hypertension by about 20% (Appel et al., 2011).
There are many mechanisms for the impact of sodium on various disease states. In
regards to hypertension, the body controls sodium balance via extracellular fluid volume
(Karppanen & Mervaala, 2006). By increasing the BP level, the body is able to rid itself of
excess sodium and water through the pressure-natriuresis mechanism (Karppanen & Mervaala,
2006). High sodium has also been implicated in inducing modifications in the arterial wall,
including hypertrophy, that result in arterial stiffening (Buyck et al., 2009). An increase in
collagen fibers and decrease in elastin fibers is also implicated in the development of artery
stiffening with increased sodium consumption (Buyck et al., 2009). In addition, sodium
retention decreases the synthesis of nitric oxide, which acts as an arteriolar vasodilator. High salt
consumption has also been seen to induce over-production of reactive oxygen species (ROS),
which have a positive correlation with severity of heart failure, by activating NADPH oxidase
(Matsui et al., 2006).
The harmful effect of high dietary sodium on BP is mainly observed in individuals with a
low potassium intake (Buyck et al., 2009). Increased intakes of potassium, calcium, and
magnesium have been found to increase the excretion of excess sodium (Karppanen & Mervaala,
2006). Whereas dietary sodium intake is positively associated with pulse pressure, a peripheral
marker of central arterial stiffness, potassium intake is negatively associated with systolic BP,
diastolic BP, and mean arterial pressure after adjusting for demographic and nutritional factors

26
that may affect BP (Buyck et al., 2009). The BP-lowering effect of potassium has been observed
to be even greater in the presence of a high intake of sodium (Houston, 2011; Lee, Zhekov,
Owens, Kim, & Meullenet, 2012).
Increasing potassium intake has been shown to lower blood pressure (Van Mierlo et al.,
2010). Higher sodium to potassium ratio in the diet is associated with a higher BP and risk of
CVD; however, the ratio of potassium intake to sodium intake in the United States is less than
1:2 compared to the 5:1 ratio recommended (Houston, 2011). This low potassium intake is
considered by some to be a major contributor to the prevalence of hypertension and
cardiovascular disease (Houston, 2011). Increasing potassium intake to the recommended
amount of 4.7 grams per day would lower systolic BP by 1.7 to 3.2 mm Hg, similar to the
amount seen by reducing sodium intake from 9 grams to 5 grams per day (Van Mierlo et al.,
2010). Such an increase in potassium alone could decrease the prevalence of hypertension in the
United States by 17% and increase life expectancy by 5.1 years (Houston, 2011). In addition to
attenuating hypertension, potassium has also been implicated in reducing the risk of
cerebrovascular accidents and cardiac arrhythmias (Houston, 2011). Increased potassium intake,
even in initial stages of cardiac dysfunction, has been shown to be beneficial (Matsui et al.,
2006). Potassium has been proven to have physiological effects independent of BP, such as
improving the function of the left ventricle of the heart (Matsui et al., 2006). Although
potassium supplementation is beneficial in cardiovascular diseases, individuals with renal
disease, such as end-stage renal failure, have a reduced secretory ability for potassium and must
limit potassium intake (Houston, 2011; Taylor et al., 2011).
In past studies, three meta-analyses showed that increased potassium intake significantly
lowered BP in a dose dependent manner in both non-hypertensive and hypertensive individuals

27
(Houston, 2011). In one study, increase potassium intake by about 700 to 1000 mg per day
lowered systolic BP by 2 to 3 mm Hg (Houston, 2011). Similarly, another study found that
increasing potassium by 1800 to 1900 mg per day lowered systolic BP by 4 mm Hg and diastolic
BP by 2.5 mm Hg (Karppanen & Mervaala, 2006). When potassium chloride (KCl) was
supplemented an average of 86 mmol per day, reductions of 5.9 and 3.4 mm Hg were seen over a
period of about 39 days for systolic BP and diastolic BP, respectively (Houston, 2011). In a
study including rural citizens in China, the effect of salt substitute increased over time with a
maximum systolic BP reduction of about 5.4 mm Hg after 12 months (China Salt Substitute
Study Collaborative Group, 2007). Along with the effect of decreasing BP, potassium
supplementation has also been found to reduce the need for antihypertensive medications by
50% (Houston, 2011). Similar effects of potassium have also been seen for other physiological
states, such as cerebrovascular accidents, which were seen to decrease with high potassium
intake (Houston, 2011).
The effects of potassium in lowering BP are explained my mechanisms including
improved natriuresis, reduced sympathetic nervous activity, and decreased pressor response to
noradrenaline and angiotensin II (Karppanen & Mervaala, 2006). Specific effects on the
endothelial pathways of the vasculature include stimulation of nitric oxide production, which
acts as a potent vasodilator and thus maintains normal BP (Montasser et al., 2010). An increase
in potassium also causes endothelium-dependent vasodilation by hyperpolarizing the endothelial
cell, which in turn decreases the cytosolic calcium of vascular smooth muscle cells and promotes
this vasodilatory mechanism (Houston, 2011). Potassium also protects the integrity of the
vascular endothelium by reducing the production of free radicals which may initiate damage to
the endothelium (Montasser et al., 2010). Potassium has been shown to inhibit ROS formation

28
from endothelium and white blood cells (Matsui et al., 2006). Further protecting the vasculature
from endothelial injuries, high potassium intake reduces leukocyte adherence to the vascular wall
(Montasser et al., 2010).
Despite the risk of high sodium intake and low potassium intake, current consumption of
both minerals is suboptimal (Karppanen & Mervaala, 2006). The human body requires only 180
mg of sodium to maintain physiological functions; however, the current dietary intake in the
United States is over 3400 mg each day for individuals ages 2 and older (Dietary Guidelines
Advisory Committee, 2010). The Dietary Guidelines Advisory Committee (2010) recommends
a sodium intake less than 2300 mg for the general population, and an intake less than 1500 mg
for those aged 51 or older, of African American ethnicity, or afflicted with hypertension,
diabetes, or chronic kidney disease. Similarly, most developed countries have a dietary goal to
reduce sodium intake by half (Taylor et al., 2011). Despite these recommendations, sodium
intake has continued to rise, and NHANES data from 1999 to 2004 showed that only about 30%
of the American population consumed less than the recommended sodium intake (Cotugna &
Wolpert, 2011; Karppanen & Mervaala, 2006). In addition, per capita use of salt increased by
about 55% from 1983 to 1998, remaining high and corresponding to a similar increase in high
BP in the population starting in the late 1980s and early 1990s (Karppanen & Mervaala, 2006).
Potassium intake is similarly suboptimal with only 43% of individuals meeting the current
recommended intake of 4700 mg of potassium per day (Dietary Guidelines Advisory Committee,
2010; Karppanen & Mervaala, 2006). Potassium intake has been observed to be about 2000 mg
in a typical 2400 calorie American diet (Karppanen & Mervaala, 2006).
Although individuals with hypertension generally receive counseling, this counseling has
had a minimal impact on population sodium intake, leading researchers to believe that the only

29
effective way of decreasing overall sodium intake would be to reduce the level of salt added in
industrial manufacturing of foods (Cotugna & Wolpert, 2011; Karppanen & Mervaala, 2006).
Whereas 12% of salt intake occurs naturally in foods, 6% is added to foods at the table, and 5%
is added during the at-home cooking process, more than 75% of sodium intake comes from salt
added to processed foods (Appel et al., 2011; Cotugna & Wolpert, 2011; Karppanen & Mervaala,
2006). The consumption of meat has been criticized due to its high sodium and fat levels and
lack of fiber and calcium (Horita, Morgano, Celeghini, & Pollonio, 2011). This criticism of meat
may be well-founded as meat products contribute to about 16% to 25% of the recommended
sodium intake (Horita et al., 2011)
Surimi is isolated fish protein that has been washed during manufacturing to remove fats
and other substances and thereby create a functional actomyosin concentrate (Park, Lin, &
Yongsawatdigul, 1997). Surimi seafood is known to be relatively high in sodium content (Kim
& Park, 2008). The typical salt content of manufactured surimi is about 1% to 3%, with the
maximum acceptable concentration for taste being 2% to 2.5% (Kim & Park, 2008; Pigott, 1986;
Tahergorabi, Beamer, Matak, & Jaczynski, submitted for publication). Salt plays an essential
role in meat products, such as surimi, due to its contribution to texture, addition to flavor, and
ability to control microbial growth by lowering the water activity of the product (Kim & Park,
2008; Lee et al., 2012). Textural properties are of critical importance for surimi quality and
acceptance, thus the addition of salt it also critical because it improves texture (Tahergorabi &
Jaczynski, 2012). Salt acts in meats to solubilize myofibrillar proteins, with more myofibrillar
proteins being solubilized at higher salt concentrations (Alvarez, Couso, & Tehada, 1995). If
less salt is used in manufacturing a negative effect is seen on the functional and mechanical
properties of the resulting surimi seafood (Tahergorabi & Jaczynski, 2012). Sodium chloride

30
(NaCl) solubilizes protein by causing the myofibrillar proteins to swell and break into
actomyosin, myosin, and a variety of protein aggregates and complexes upon chopping and
kneading of the salted surimi paste (Lian, Lee, & Chung, 2002; Pigott, 1986). The dissociated
actomyosin participates in forming the protein matrix of the gel and in binding water (Horita et
al., 2011; Kim & Park, 2008; Pigott, 1986). The solubilized proteins form crosslinks with other
myofibrils during gelation to make gels more firm, thus a decrease in solubilized proteins caused
by reduced sodium addition would result in a product with lower gel strength (Horita et al., 2011;
Lian et al., 2002). Salt also strengthens the hydrophobic interactions between proteins in the gel,
thus contributing to gel strength (Kim & Park, 2008).
Tahergorabi and Jaczynski (2012) proposed that it is possible to reduce sodium content in
surimi by 1) lowing the concentration of added salt (NaCl), 2) replacing all or part of the salt
(NaCl) with other chloride salts (such as KCl, CaCl2, or MgCl2), flavors, and preservatives, or 3)
using a combination of the aforementioned approaches. The type of salt used, however, can
influence the salting process to a greater or lesser extent depending upon the characteristics of
the salt; for example, divalent metal ions (including calcium, magnesium, and zinc) may cause
changes in protein conformation by interacting with the negative charges on polypeptide chains
of proteins and decreasing electrostatic interactions between protein molecules (Ding et al.,
2011; Martínez-Alvarez, Borderías, & Gómez-Guillén, 2005). The use of chloride salts is
supported by the hypothesis that the chloride ion is the main contributor to the effect of NaCl on
myofibrillar proteins because the chloride ion more strongly reacts with positive charges on
muscle protein whereas the cation (such as sodium, in NaCl) is only weakly bound, thus the
chloride ion may continue to exert its effect regardless of the cation present (Lian et al., 2002).
Potassium chloride (KCl) has been the most investigated chloride substitute for NaCl due to its

31
positive health impact in reducing blood pressure in humans (Horita et al., 2011; Lee et al.,
2012). In addition, food products that have a low sodium and high potassium content are eligible
for health claims on their labels, possibly increasing consumer consumption (Karppanen &
Mervaala, 2006). Possible negative effects reported from the use of KCl as a salt substitute
include complaints of a metallic or bitter aftertaste (Lee et al., 2012). If salt substitute were used
in place of NaCl in the manufacturing of surimi seafood, these products would contribute to 4%
of the recommended sodium intake in a 100 gram serving compared to surimi seafood with 1%
to 3% NaCl which would contribute 16% to 44% of the recommended intake, respectively
(Tahergorabi et al., submitted for publication).
When used as a substitute for NaCl in Alaska Pollock surimi, KCl has been found to
produce an acceptable product with acceptable color and textural character traits (Tahergorabi et
al., submitted for publication). Using KCl as a salt substitute, however, did result in softer gels
with decreased hardness (Gimeno, Astiasarán, & Bello, 1999; Montero & Pérez-Mateos, 2001;
Tahergorabi et al., submitted for publication). This decrease in hardness and gel strength is most
likely due to the increase in moisture that is seen with the use of KCl (Martínez-Alvarez et al.,
2005). In formulations of surimi, dry-cured pork loin, and mortadella that used only partial
substitutions of KCl for NaCl, gel firmness was not affected (Gou, Guerrero, Gelabert, & Arnau,
1996; Horita et al., 2011; Lian et al., 2002). Although some differences were seen in texture,
surimi gelation patterns and viscoelasticity were unchanged when KCl was used in place of NaCl
(Lian et al., 2002; Tahergorabi & Jaczynski, 2012). Salt substitution has also been reported to
have little effect on the color of resulting gels (Tahergorabi et al., submitted for publication).
Sensory evaluations of products using KCl as a salt substitute confirmed that KCl may contribute
a metallic or bitter taste resulting in sensory rejection by consumers (Gou et al., 1996; Horita et

32
al., 2011). KCl may only have an effect on taste, however, when KCl fully replaces NaCl (Lian
et al., 2002). Martínez-Alvarez et al. (2005) found that KCl negatively influenced taste when the
level of replacement for NaCl was more than 50%. Potassium may have additional benefits in
protecting against oxidation, as Horita et al. (2011) observed the lowest pro-oxidant action in
mortadella after 30 days in samples containing KCl and CaCl2. These results show KCl to be a
potential salt substitute for surimi.
Color
The concept of color was initially a difficult concept to express due to the limitations of
human vocabulary to adequately describe magnitude and direction of color variations (Lauro,
Inami, & Johnson, 2005). It was soon determined that color could be measured based on
measuring wavelengths of energy (Lauro et al., 2005). With this knowledge, instruments were
developed that could measure color with adequate reproducibility (Lauro et al., 2005). The
Commision Internationale de l’Eclairage (CIE) later established criteria to test and express color
mathematically, and developed a model patterned after the color perception of the human eye
and known as the tristimulus color scale, which was a tool for measuring the amount of red,
green, and blue light in a sample (Lauro et al., 2005). The L*a*b* color space was subsequently
developed to more closely correlate with color as perceived by the human eye (Lauro et al.,
2005). In the L*a*b* color space, L* is a value from 0 to 100 that indicates darkness (closer to
0) or lightness (closer to 100), a* indicates redness (positive value) or greenness (negative
value), and b* indicates yellowness (positive value) or blueness (negative value) (Lauro et al.,
2005). These L*a*b* values can be combined in the equation 100 - [(100 - L*)2
+ a*2 + b*
2]
1/2 to

33
indicate overall whiteness (Lanier, 1992). This L*a*b* concept of color is widely used in surimi
seafood (Lauro et al., 2005).
Color, especially whiteness, is an essential characteristic of surimi seafood (Gehring,
Gigliotti, Moritz, Tou, & Jaczynski, 2011; Pigott, 1986). For this reason, white-fleshed fish such
as Alaska pollock, Pacific whiting, and hake, are used for the production of surimi as opposed to
darker-fleshed fish such as mackerel or sardine (Benjakul, Visessanguan, & Kwalumtharn, 2004;
Guenneugues & Morrissey, 2005). Surimi generally has L* (lightness) values well above 50 and
a* and b* values near zero (Lanier, 1992).
In surimi gels, various additives influence color properties. Park (1995) found that gels
with added moisture tended to be lighter with less yellowness, causing them to look whiter then
gels with lower moisture. In addition to moisture, various components can be added to surimi
pastes to improve the whiteness of the gels, including titanium dioxide, calcium carbonate, and
oil (Benjakul et al., 2004; Gehring et al., 2011). Pérez-Mateos et al. (2004) observed that oil
increased lightness (L*) through the light scattering effect of emulsified oil droplets. Although
oil may increase lightness through this light-scattering effect, some oils also contain pigments
that increase either a* or b*. Algae oil, for example, contains carotenoids that are yellow-orange
in color and these colors are reflected in surimi gels (Nitsan, Mokady, & Sukenik, 1999; Park,
Kelleher, McClements, & Decker, 2004; Pietrowski, Tahergorabi, Matak, Tou, & Jaczynski,
2011).
Texture
Texture is one of the most important characteristics of surimi seafood (Hamann &
MacDonald, 1992). The measurement of texture is the sum of the properties of individual
34
protein fibers and matrix between these fibers that causes them to adhere (Hamann &
MacDonald, 1992). Surimi seafood texture can be affected by various factors, including protein
concentration, heating temperature, heating period, and additives (Hamann & MacDonald, 1992;
Luo, Kuwahara, Kaneniwa, Murata, & Kokoyama, 2001). There are three classes of
instrumental analyses: fundamental which is objective in nature, empirical which correlates well
with textural properties, and imitative which imitates conditions of the mouth or plate (Kim,
Park, & Yoon, 2005). Instruments can correlate well with the “mechanical” sensory
characteristics, or the reaction of food to stress (Hamann & MacDonald, 19992). However,
because texture is a multi-faceted property, using only one of the above instrumental analyses is
not adequate for measuring and describing the different aspects of textural characteristics
(Hamann & MacDonald, 1992).
Torsion is a fundamental test that measures shear stress and shear strain of a sample at
failure when the sample is subjected to twisting forces (Hamann & MacDonald, 1992; Kim et al.,
2005). Shear stress and shear strain correspond to gel strength and cohesiveness, respectively, of
the surimi seafood (Kim et al., 2005). Lanier (1986) identified shear strain as the most important
and sensitive parameter to describe the functional ability of myofibrillar protein in surimi gel.
Higher values of shear stress and shear strain indicate premium products (Shie & Park, 1999).
Kramer shear is considered to be an empirical test and imitates mastication (Kim et al.,
2005). As opposed to a puncture test, Kramer shear test uses a multiple slot-and-blade fixture
that has the advantage of testing a sample over a broader area, thus reducing the effect of local
irregularities (Hamann & MacDonald, 1992; Kim et al., 2005). The Kramer shear test measures
gel strength or stiffness of surimi seafood (Kim et al., 2005).

35
Texture profile analysis (TPA) is an empirical measure that involves compressing a
sample twice between two parallel surfaces to imitate the action of the human jaw (Hamann &
MacDonald, 1992; Kim et al., 2005). TPA uses data measured to report multiple parameters,
including hardness, the peak height on the first compression (food’s resistance during the first
bite); springiness, the ratio of product height on the second compression to the original
compression distance (ability of the product to retain its shape and size after one bite);
cohesiveness, the ratio of the second compression area to the first compression area (resistance
of the product during chewing); gumminess, the product of hardness and chewiness (strength
required in chewing); chewiness, the product of gumminess and springiness (energy used in
chewing); and resilience, a measure of how well a product regains its original position, (Cardoso,
Mendes, Pedro, & Nunes, 2008). TPA characteristics have been found to correlate well with
sensory ratings (Bourne, 1978).
Gelation and Thermal Denaturation
Gelation consists of the conversion of a viscous sol to the formation of a three
dimensional elastic network with cross-linked protein (Karthikeyan, Dileep, & Shamasundar,
2006; Niwa, 1992). Myofibrillar proteins, that are solubilized by the addition of salt during
processing, form bonds with each other when heat is applied, thus changing the viscosity and
mechanical properties of the surimi gel (Hamann & MacDonald, 1992). Heat-induced gelation
consists of two steps. First is the initiation (or denaturation) step during which protein molecules
are unfolded (Yoon, Gunasekaran, & Park, 2004). Proteins are naturally in a highly folded state;
however, the addition of heat enhances structural changes such as the unfolding of protein
molecules (Yoon et al., 2004). Second is the aggregation step which occurs at higher
36
temperatures (above 55°C) and triggers chemical reactions among exposed surfaces of
neighboring protein molecules, including the formation of covalent bonds, electrostatic bonds,
hydrogen bonds, and hydrophobic bonds that result in three-dimensional network formation
(Yoon et al., 2004). Because these bonds are heat-induced, rheological and thermal properties of
surimi gels are methods of assessing the quality of surimi gels (Yoon et al., 2004).
The chemical reactions occur at different temperatures during gelation and act on
different components of the protein molecules. During the heating of surimi paste, hydrophobic
interactions and disulfide covalent bonds form (Hamann & MacDonald, 1992; Niwa, 1992).
Hydrophobic interactions are strengthened with increased temperature and play a role in
stabilizing the molecular structure of proteins (Niwa, 1992). Disulfide bonds usually form at
higher temperatures in the later stages of the cooking process by the oxidation of two cysteine
residues (Hamann & MacDonald, 1992). The heating process also degrades the natural α-helix
structure of surimi paste and β-sheets are formed (Niwa, 1992). Because a higher percentage of
β-sheet structure is found in more elastic products, this contributes to protein network formation
(Niwa & Nakajima, 1975; Sánchez-González et al., 2008). Intermolecular hydrogen bonds are
formed among amino acid groups and help to stabilize the gel network within cooled surimi gels
(Niwa, 1992).
Dynamic oscillatory rheology is a small strain test widely used in studying the heat-
induced gelation of myofibrillar proteins (Karthikeyan et al., 2006). Because such small strains
are used in these tests, it is possible to measure physical and molecular changes during gelation
without disrupting network structure development of the gels (Hamann & MacDonald, 1992;
Yoon et al., 2004). These gelation experiments are performed by heating a sample of surimi
paste at a constant rate (Yoon et al., 2004). The instrument then measures viscous and elastic

37
properties that lend insight into chemical changes taking place, including mechanical, thermal,
and chemical reactions (Kim, Park, & Yoon, 2005). The storage modulus (Gʹ) is used for
assessing viscoelasticity, or gel-forming ability, of the proteins (Karthikeyan et al., 2006). A
perfectly viscous sample is indicated by Gʹ equal to zero, whereas Gʹ increases as the elasticity of
the sample increases (Hamann & MacDonald, 1992). This change in elasticity relates to protein
unfolding and bond formation during protein gelation (Hamann & MacDonald, 1992). The
temperature at which Gʹ initially begins to increase is associated with the beginning of covalent
bonding and hydrophobic interactions, while the maximum temperature of Gʹ indicates the
completion of most covalent bonding (Karthikeyan et al., 2006; Yoon et al., 2004).
Additives in surimi pastes may contribute to or inhibit the gelation of surimi protein.
Xiong (1992) discussed three different types of multi-component gelling systems to explain
interactions between protein and additives: filled, which involves active filler within a matrix;
complex, involving copolymerization with protein; and mixed gels. Previous studies have found
a positive association between pre-emulsified lipids and gel network formation (Dickinson &
Chen, 1999; Pietrowski, Tahergorabi, & Jaczynski, 2012; Wu et al., 2009). Wu and others
(2009) observed that fat molecules coated with protein may crosslink with the protein matrix.
Dickinson and Chen (1999) concluded that these protein-coated fat droplets acted as active fillers
in heat-set whey protein-stabilized emulsions and thereby increased the elastic modulus of the
resulting gels. In a study investigating the effect of fiber on surimi gelation, Sánchez-González
and others (2009) observed an increase in β-sheet formation, possibly due to the dehydrating
effect of fiber on protein molecules, contributing to the elasticity of surimi gels.
Differential scanning calorimetry (DSC) is used to monitor physicochemical changes that
occur during heating (Wu, Akahane, Lanier, & Hamann, 1985). It provides information on the

38
temperature of protein denaturation and the enthalpy change (ΔH) associated with these
denaturation transitions (Murray, Arntfield, & Ismond, 1985). ΔH values represent the sum of
exothermic reactions (disruption of hydrophobic interactions) and endothermic reactions
(disruption of hydrogen bonds) and are determined by measuring the area under the DSC
transition curve (Murray et al., 1985; Wright, Leach & Wilding, 1977). Protein denaturation is
indicated by peaks in the DSC thermograms (Koshiyama, Hamano, & Fukushima, 1980-1981;
Wu et al., 1985). Wright and others attributed the first peak to the denaturation of myosin and
the second peak to the denaturation of actin, signifying that myosin denatures at a lower
temperature than actin (Park, Lin, Yongsawatdigul, 1997; Wright et al., 1977). Broad peaks in
DSC thermograms show that the protein denaturation does not occur at a single temperature
point, but instead can occur over a range of temperatures (Park & Lanier, 1989). Because
protein denaturation results in changes in rheological properties, DSC thermograms can be
compared with rheological properties (Wu et al., 1985).
Summary
The current American diet is low in both fiber and omega-3 polyunsaturated fatty acids
(Anderson et al., 2009; Dietary Guidelines Advisory Committee, 2010; Ratnayake & Galli,
2009). Fiber and omega-3 rich oils have been incorporated independently into surimi seafood
gels resulting in gels with acceptable textural and rheological characteristics (Benjakul,
Visessanguan, & Kwalumtharn, 2004; Cardoso, Mendes, Vaz-Pires, & Nunes, 2009; Park,
Kelleher, McClements, & Decker, 2004; Pérez-Mateos, Boyd, & Lanier, 2004; Sánchez-Alonso,
Haji-Maleki, & Borderías, 2007). The use of salt substitute in the form of potassium chloride
(KCl) in surimi gels also results in acceptable products (Gimeno, Astiasarán, & Bello, 1999;

39
Gou, Guerrero, Gelabert, & Arnau, 1996; Horita, Morgano, Celeghini, & Pollonio, 2011;
Montero & Pérez-Mateos, 2001). No research has studied the combined incorporation of fiber,
omega-3 rich oils, and salt substitute in surimi seafood. The incorporation of these ingredients
would create a heart-healthy, nutraceutical product. The goal of this study was to investigate the
effects of a combination of fiber, omega-3 rich oil, and salt substitute on the physicochemical
properties of surimi seafood.
References
Alvarez, C., Couso, L., & Tehada, M. (1995). Sardine surimi as affected by salt concentration,
blending, heat treatment and moisture. Journal of Food Science, 60(3), 622-625.
Anderson, B. M., & Ma, D. W. L. (2009). Are all n-3 polyunsaturated fatty acids created equal?
Lipids in Health and Disease, 8, 33.
Anderson, J. W., Baird, P., Davis, R. H., Ferreri, S., Knudtson, M., Koraym, A., Waters, V., &
Williams, C. L. (2009). Health benefits of dietary fiber. Nutrition Reviews, 67(4), 188-
205. doi:10.1111/J.1753-4887.2009.00189.x
Ang, J. F. (1991). Water retention capacity and viscosity effect of powdered cellulose. Journal of
Food Science, 56(6), 1682-1684.
Ang, J. F., & Miller, W. B. (1991). Multiple functions of powdered cellulose as a food
ingredient. Cereal Foods World, 36(7), 558-564.
Appel, L. J., Frohlich, E. D., Hall, J. E., Pearson, T. A., Sacco, R. L., Seals, D. R., Sacks, F. M.,
Smith, S. C., Vafiadis, D. K., & Van Horn, L. V. (2011). The importance of population-
wide sodium reduction as a means to prevent cardiovascular disease and stroke: A call to
action from the American Heart Association. Circulation, 123, 1138-1143.
Arterburn, L. M., Oken, H. A., Hoffman, J. P., Bailey-Hall, E., Chung, G., Rom, D., Hamersley,
J., & McCarthy, D. (2007). Bioequivalence of docosahexaenoic acid from different algal
oils in capsules and in a DHA-fortified food. Lipids, 42(11), 1011-1024.
Arterburn, L. M., Oken, H. A., Hall, E. B., Hamersley, J., Kuratko, C. N., & Hoffman, J. P.
(2008). Algal-oil capsules and cooked salmon: nutritionally equivalent sources of
docosahexaenoic acid. Journal of the American Dietetic Association, 108, 1204-1209.

40
Benjakul, S., Visessanguan, W., & Kwalumtharn, Y. (2004). The effect of whitening agents on
the gel-forming ability and whiteness of surimi. International Journal of Food Science
and Technology, 39(7), 773-781.
Bodner, J. M., & Sieg, J. (2009). Fiber. In R. Tarté (ed.), Ingredients in meat products:
Properties, functionality and applications (pp. 83-108). Springer Science + Business
Media, LLC. doi:10.1007/978-0-387-71327-4_4. Retrieved January 25, 2012, from
http://powderedcellulose.com/wp-content/themes/agency-sweetener-supply-
pc/images/fiber-properties-functionality-applications.pdf.
Bourne, M. C. (1978). Texture analysis profile. Food Technology, 37(7), 62-65.
Brownlee, I. A., Dettmar, P. W., Strugala, V., & Pearson, J. P. (2006). The interaction of dietary
fibres with the colon. Current Nutrition and Food Science, 2, 243-264.
Buyck, J. F., Blacher, J., Kesse-Guyot, E., Castetbon, K., Galan, P., Safar, M. E., Hercberg, S., &
Czernichow, S. (2009). Differential associations of dietary sodium and potassium intake
with blood pressure: A focus on pulse pressure. Journal of Hypertension, 27, 1158-1164.
Calder, P. C., & Yaqoob, P. (2009). Omega-3 polyunsaturated fatty acids and human health
outcomes. BioFactors, 53(3), 266-272.
Campo, L., & Tovar, C. (2008). Influence of the starch content in the viscoelastic properties of
surimi gels. Journal of Food Engineering, 84, 140-147.
Candela, C. G., López, L. M. B., & Kohen, V. L. (2011). Importance of a balanced omega
6/omega 3 ratio for the maintenance of health. Nutritional implications. Nutrición
Hospitalaria, 26(2), 323-329.
Cardoso, C., Mendes, R., Pedro, S., & Nunes, M. L. (2008). Quality changes during storage of
fish sausages containing dietary fiber. Journal of Aquatic Food Product Technology,
17(1), 73-95.
Cardoso, C., Mendes, R., Vaz-Pires, P., & Nunes, M. L. (2009). Effect of dietary fibre and
MTGase on the quality of mackerel surimi gels. Journal of the Science of Food and
Agriculture, 89, 1648-1658. doi:10.1002/jsfa.3636
Chen, Y. C., Nguyen, J., Semmens, K., Beamer, S., & Jaczynski, J. (2006). Ehancement of
omega-3 fatty acid content in rainbow trout (Oncorhynchus mykiss) fillets. Journal of
Food Science, 71(7), C383-C389.
China Salt Substitute Study Collaborative Group. (2007). Salt substitution: A low-cost strategy
for blood pressure control among rural Chinese. A randomized control trial. Journal of
Hypertension, 25(10), 2011-2018.

41
Clough, P. (2008). Marketing omega-3 products as nutraceuticals. International symposium on
fatty acids – opportunities for health education and investment, 19(3), 233-234.
Cotugna, N., & Wolpert, S. (2011). Sodium recommendations for special populations and the
resulting implications. Journal of Community Health, 36, 874-882.
Dickinson, E., & Chen, J. (1999). Heat-set whey protein emulsion gels: role of active and
interactive filler particles. Journal of Dispersion Science and Technology, 20(1&2), 197-
213.
Dietary Guidelines Advisory Committee. (2010). Report of the dietary guidelines advisory
committee on the dietary guidelines for Americans, 2010, to the secretary of Agriculture
and the Secretary of Health and Human Services. Washington, DC: Government printing
office. Retrieved from http://www.cnpp.usda.gov/Publications/DietaryGuidelines/2010/
PolicyDoc/PolicyDoc.pdf
Ding, Y., Liu, Y., Yang, H., Liu, R., Rong, J., Zhao, S., & Xiong, S. (2011). Effects of CaCl2 on
chemical interactions and gel properties of surimi gels from two species of carps.
European Food Research and Technology, 233, 569-576.
Domingo, J. L. (2007). Omega-3 fatty acids and the benefits of fish consumption: Is all that
glitters gold? Environment International, 33, 993-998.
Gehring, C. K., Gigliotti, J. C., Moritz, J. S., Tou, J. C., & Jaczynski, J. (2011). Functional and
nutritional characteristics of proteins and lipids recovered by isoelectric processing of
fish by-products and low-value fish: A review. Food Chemistry, 124, 422-431.
Geleijnse, J. M., Witteman, J. C. M., Bak, A. A. A., den Breeijen, J. H, & Grobbee, D. E. (1994).
Reduction in blood pressure with a low sodium, high potassium, high magnesium salt in
older subjects with mild to moderate hypertension. British Medical Journal, 309(6952),
436-440.
Gimeno, O., Astiasarán, I., & Bello, J. (1999). Influence of partial replacement of NaCl with KCl
and CaCl2 on texture and color of dry fermented sausages. Journal of Agricultural and
Food Chemistry, 47, 873-877.
Gogus, U., & Smith, C. (2010). n-3 omega fatty acids: a review of current knowledge.
International Journal of Food Science & Technology, 45, 417-436.
Gou, P., Guerrero, L., Gelabert, J., & Arnau, J. (1996). Potassium chloride, potassium lactate and
glycine as sodium chloride substitutes in fermented sausages and in dry-cured pork loin.
Meat Science, 42(1), 37-48.
Guenneugues, P., & Morrissey, M. T. (2005). Surimi resources. In J. W. Park (Ed.), Surimi and
surimi seafood 2nd
ed. (pp. 3-32), Boca Raton, FL: Taylor and Francis Group.

42
Hall, G. M, & Ahmad, N. H. (1997). Surimi and fish-mince products. In G. M. Hall (Ed.), Fish
processing technology, 2nd
ed. (pp. 74-92). New York: Blackie Academic and
Professional.
Hall, G. M. (2011). Surimi and fish mince products. In G. M. Hall (Ed.), Fish processing –
sustainability and new opportunities (pp. 98-111). Oxford: Wiley-Blackwell.
Hamann, D. D., & MacDonald, G. A. (1992). Rheology and texture properties of surimi and
surimi-based foods. In T. C. Lanier & C. M. Lee (Eds.), Surimi technology (pp. 123-166),
New York, NY: Marcel Dekker, Inc.
Hastings, R. J., Keay, J. N., & Young, K. W. (1990). The properties of surimi and kamaboko
gels from nine British species of fish. International Journal of Food Science and
Technology, 25, 281-294.
Horita, C. N., Morgano, M. A., Celeghini, R. M. S., & Pollonio, M. A. R. (2011). Physico-
chemical and sensory properties of reduced-fat mortadella prepared with blends of
calcium, magnesium and potassium chloride as partial substitutes for sodium chloride.
Meat Science, 89, 426-433.
Houston, M. C. (2011). The importance of potassium in managing hypertension. Current
Hypertension Reports, 13, 309-317.
Institute of Medicine. (2005) Dietary reference intakes for energy, carbohydrate, fiber, fat, fatty
acids, cholesterol, protein, and amino acids (macronutrients). National Academy Press,
Washington, DC.
Juturu, V. (2008). Omega-3 fatty acids and the cardiometabolic syndrome. Journal of the
Cardiometabolic Syndrome, 3, 244-253.
Karppanen, H., & Mervaala, E. (2006). Sodium intake and hypertension. Progress in
Cardiovascular diseases, 49(2), 59-75.
Karthikeyan, M., Dileep, A. O., & Shamasundar, B. A. (2006). Effect of water washing on the
functional and rheological properties of proteins from threadfin bream (Nemipterus
japonicus) meat. International Journal of Food Science and Technology, 41, 1002-1010.
Kassis, N. M., Beamer, S. K., Matak, K. E., Tou, J. C., & Jaczynski, J. (2010). Nutritional
composition of novel nutraceutical egg products developed with omega-3-rich oils. Food
Science and Technology, 43, 1204-1212.
Kim, Y. S., & Park, J. W. (2008). Negative roles of salt in gelation properties of fish protein
isolate. Journal of Food Science, 73(8), C585-C588.

43
Kim, B. Y., Park, J. W., & Yoon, W. B. (2005). Rheology and texture properties of surimi gels.
In J.W. Park (Ed.), Surimi and surimi seafood 2nd
ed. (pp. 491-582), Boca Raton, FL:
Taylor and Francis Group.
Klesk, K., Yongsawatdigul, J., Park, J. W., Viratchakul, S., & Virulhakul, P. (2000). Gel forming
ability of tropical tilapia surimi as compared with Alaska pollock and pacific whiting
surimi. Journal of Aquatic Food Product Technology, 9(3), 91-104.
Koshiyama, I., Hamano, M., & Fukushima, D. (1980-1981). A heat denaturation study of the 11s
globulin in soybean seeds. Food Chemistry, 6, 309-322.
Kris-Etherton, P. M., Harris, W. S., Appel, L. J., & AHA Nutrition Committee. (2002). Fish
consumption, fish oil, omega-3 fatty acids, and cardiovascular disease. Circulation, 106,
2747-2757.
Lanier, T. C. (1986). Functional properties of surimi. Food Technology, 40(3), 107-114, 124.
Lanier, T. C. (1992). Measurement of surimi composition and functional properties. In T. C.
Lanier & C. M. Lee (Eds.), Surimi technology (pp. 123-166), New York, NY: Marcel
Dekker, Inc.
Larkin, S. L., Sylvia, G. (1999). Firm-level hedonic analysis of U.S. produced surimi:
Implications for processors and resource managers. Marine Resource Economics, 14,
179-198.
Lauro, G. J., Inami, O., & Johnson, C. (2005). Color measurement and colorants for surimi
seafood. In J. W. Park (Ed.), Surimi and surimi seafood 2nd
ed. (pp. 749-801), Boca
Raton, FL: Taylor and Francis Group.
Lee, Y. S., Zhekov, Z. G., Owens, C. M., Kim, M., & Meullenet, J. F. (2011). Effects of partial
and complete replacement of sodium chloride with potassium chloride on the texture,
flavor, and water-holding capacity of marinated broiler breast fillets. Journal of Texture
Studies, 43, 124-132.
Lennie, T. A., Song, E. K., Wu, H. R., Chung, M. L., Dunbar, S. B., Pressler, S. J., & Moser, D.
K. (2011). Three gram sodium intake is associated with longer event-free survival only in
patients with advanced heart failure. Journal of Cardiac Failure, 17(4), 325-330.
Lian, P. Z., Lee, C. M., & Chung, K. H. (2002). Textural and physical properties of acid-induced
and potassium-substituted low-sodium surimi gels. Journal of Food Science, 67(1), 109-
112.
Luo, Y. K., Kuwahara, R., Kaneniwa, M., Murata, Y., & Kokoyama, M. (2001). Comparison of
gel properties of surimi from Alaska Pollock and three freshwater fish species: Effects of
thermal processing and protein concentration. Journal of Food Science, 66(3), 548-554.

44
Mansfield, B. (2003). Spatial globalization: A “geography of quality” in the seafood industry.
Economic Geography, 79(1), 1-16.
McManus, A., Merga, M., Newton, W. (2011). Omega-3 fatty acids. What consumers need to
know. Appetite, 57, 80-83.
Martínez-Alvarez, O., Borderías, A. J., & Gómez-Guillén, M. C. (2005). Sodium replacement in
the cod (Gadus morhua) muscle salting process. Food Chemistry, 93, 125-133.
Matsui, H., Shimosawa, T., Uetake, Y., Wang, H., Ogura, S., Kaneko, T., Liu, J., Ando, K., &
Fujita, T. (2006). Protective effect of potassium against hypertensive cardiac dysfunction:
Association with reactive oxygen species reduction. Hypertension, 48, 225-231.
Montasser, M. E., Shimmin, L. C., Gu, D., Chen, J., Gu, C., Kelly, T. N., Jaquish, C. E., Rice, T.,
Rao, D. C., Cao, J., Chen, J., Liu, D. P., Whelton, P., He, J., & Hixson, J. E. (2010).
Blood pressure response to potassium supplementation is associated with genetic
variation in endothelin 1 and interactions with E selectin in rural Chinese. Journal of
Hypertension, 28, 748-755.
Montero, P., Hurtado, J. L., & Pérez-Mateos, M. (2000). Microstructural behaviour and gelling
characteristics of myosystem protein gels interacting with hydrocolloids. Food
Hydrocolloids, 14, 455-461.
Montero, P., & Pérez-Mateos, M. (2001). Mince gels with hydrocolloids and salts:
Composition/function relationships and discrimination of functionality by multivariate
analysis. European Food Research and Technology, 213, 338-342.
Murray, E. D., Arntfield, S. D., & Ismond, M. A. H. (1985). The influence of processing
parameters on food protein functionality II. Factors affecting thermal properties as
analyzed by differential scanning calorimetry. Canadian Institute of Food Science and
Technology Journal, 18(2), 158-162.
Nair, S. S. D., Leitch, J. W., Falconder, J., & Garg, M. L. (1997). Prevention of cardiac
arrhythmia by dietary (n-3) polyunsaturated fatty acids and their mechanism of action.
Journal of Nutrition, 127, 383-393.
Narayan, B., Miyashita, K., & Hosakawa, M. (2006). Physiological effects of eicosapentaenoic
acid (EPA) and docosahexaenoic acid (DHA) – a review. Food Reviews International,
22, 291-307.
Narcisco-Gaytán, C., Shin, D., Sams, A. R., Keeton, J. T., Miller, R. K., Smith, S. B., &
Sánchez-Plata, M. X. (2011). Lipid oxidation stability of omega-3- and conjugated
linolenic acid-enriched sous vide chicken meat. Poultry Science, 90, 473-480.

45
Nitsan, Z., Mokady, S., & Sukenik, A. (1999). Enrichment of poultry products with ω3 fatty
acids by dietary supplementation with the alga Nannochloropsis and mantur oil. Journal
of Agricultural and Food Chemistry, 47, 5127-5132.
Niwa, E. (1992). Chemistry of surimi gelation. In T. C. Lanier & C. M. Lee (Eds.), Surimi
Technology (pp. 429-500), New York, NY: Marcel Dekker, Inc.
Niwa, E., & Nakajima, G. (1975). Differences in protein structure between elastic kamaboko and
brittle one. Nippon Suisan Gakkaishi, 41, 579.
Park, J. W. (1995). Surimi gel colors as affected by moisture content and physical conditions.
Journal of Food Science, 60(1), 15-18.
Park, J. W. (2005). Surimi seafood: Products, market, and manufacturing. In J. W. Park (Ed.),
Surimi and surimi seafood, 2nd
ed. (pp. 375-433), Boca Raton, FL: Taylor and Francis
Group.
Park, Y., Kelleher S. D., McClements, D. J., & Decker, E. A. (2004). Incorporation and
stabilization of omega-3 fatty acids in surimi made from cod, Gadus morhua. Journal of
Agricultural and Food Chemistry, 52, 597-601.
Park, J. W., & Lanier, T. C. (1989). Scanning calorimetric behavior of tilapia myosin and actin
due to processing of muscle and protein purification. Journal of Food Science, 54, 49-51.
Park, J. W., & Lin, T. M. J. (2005). Surimi: Manufacturing and evaluation. In J. W. Park (Ed.),
Surimi and surimi seafood, 2nd
ed. (pp. 33-106), Boca Raton, FL: Taylor and Francis
Group.
Park, J. W., Lin, T. M., & Yongsawatdigul, J. (1997). New developments in manufacturing of
surimi and surimi seafood. Food Reviews International, 13(4), 577-610.
Pérez-Mateos, M., Boyd, L. C., & Lanier, T. C. (2004). Stability of omega-3 fatty acids in
fortified surimi seafoods during chilled storage. Journal of Agricultural and Food
Chemistry, 55, 7944-7949.
Pietrowski, B. N., Tahergorabi, R., Matak, K. E., Tou, J. C., & Jaczynski, J. (2011). Chemical
properties of surimi seafood nutrified with ω-3 rich oils. Food Chemistry, 129, 912-919.
Pietrowski, B. N., Tahergorabi, R., Jaczynski, J. (2012). Dynamic rheology ant thermal
transitions of surimi seafood enhanced with ω-3-rich oils. Food Hydrocolloids, 27, 384-
389.
Pigott, G. M. (1986). Surimi: The “high tech” raw materials from minced fish. Food Reviews
International, 2(2), 213-246.
Prosky, L. (2000) When is dietary fiber considered a functional food? BioFactors, 12, 289-297.

46
Psota, P. L., Gebauer, S. K., & Kris-Etherton, P. (2006). Dietary omega-3 fatty acid intake and
cardiovascular risk. American Journal of Cardiology, 98 (suppl), 3i-18i.
Raninen, K., Lappi, J., Mykkänen, H., & Poutanen, K. (2010). Dietary fiber type reflects
physiological functionality: Comparison of grain fiber, inulin, and polydextrose.
Nutrition Reviews, 69(1), 9-21. doi:10.1111/J.1753-4887.2010.00358.x
Ratnayake, W. M., & Galli, C. (2009). Fat and fatty acid terminology, methods of analysis and
fat digestion and metabolism: A background review paper. Annals of Nutrition and
Metabolism, 55, 8-43.
Reed, Z. H., & Park, J. W. (2008). Qualification and quantification of fish protein in prepared
surimi crabstick. Journal of Food Science, 73(5), c329-c334.
Ruxton, C. H. S., Reed, S. C., Simpson, M. J. A., & Millington, K. J. (2007). The health benefits
of omega-3 polyunsaturated fatty acids: A review of the evidence. Journal of Human
Nutrition and Dietetics, 20, 275-285.
Sánchez-Alonso, I., Haji-Maleki, R., & Borderias, A. J. (2007). Wheat fiber as a functional
ingredient in restructured fish products. Food Chemistry, 100, 1037-1043.
doi:10.1016/j.foodchem.2005.09.090
Sánchez-Gonzalez, I., Carmona, P., Moreno, P., Borderías, J., Sánchez-Alonso, I., Rodríguez-
Casado, A., & Careche, M. (2008). Protein and water structural changes in fish surimi
during gelation as revealed by isotropic H/D exchange and Raman spectroscopy. Food
Chemistry, 106, 56-64.
Sánchez-González, I., Rodríguez-Casado, A., Careche, M., & Carmona, P. (2009). Raman
analysis of surimi gelation by addition of wheat dietary fibre. Food Chemistry, 112, 162-
168.
Shie, J. S., & Park, J. W. (1999). Physical characteristics of surimi seafood as affected by
thermal processing conditions. Journal of Food Science, 64(2), 287-290.
Simopoulos, A. P. (2003). Importance of the ratio of omega-6/omega-3 essential fatty acids:
Evolutionary aspects. World Review of Nutrition and Dietetics, 92, 1-22.
Siró, I., Kápolna, E., Kápolna, B., & Lugasi, A. (2008). Functional food. Product development,
marketing and consumer acceptance – a review. Appetite, 51, 456-467.
Smith, C. E., & Tucker, K. L. (2011). Health benefits of cereal fibre: A review of clinical trials.
Nutrition Research Reviews, 24, 118-131. doi:10.1017/S0954422411000023
Tahergorabi, R., Beamer, S. K., Matak, K. E., & Jaczynski, J. Salt substitution in surimi seafood
and its effects on instrumental quality attributes. LWT, submitted for publication.

47
Tahergorabi, R., & Jaczynski, J. (2012). Physiochemical changes in surimi with salt substitute.
Food Chemistry, 132, 1281-1286.
Taylor, R. S., Ashton, K. E., Moxham, T., Hooper, L., & Ebrahim, S. (2011). Reduced dietary
salt for the prevention of cardiovascular disease: A meta-analysis of randomized
controlled trials (Cochrane review). American Journal of Hypertension, 24(8), 843-853.
Tolasa, S., Lee, C. M., Cakli, S. (2010). Physical and oxidative stabilization of omega-3 fatty
acids in surimi gels. Journal of Food Science, 75(3), C305-C310.
Tou, J. C., Jaczynski, J., & Chen, Y. C. (2007). Krill for human consumption: nutritional value
and potential health benefits. Nutrition Reviews, 65(2), 63-77.
Van Mierlo, L. A. J., Greyling, A., Zock, P. L., Kok, F. J., & Geleijnse, J. M. (2010). Suboptimal
potassium intake and potential impact on population blood pressure. Archives of Internal
Medicine, 170(16), 1501-1502.
Weickert, M. O., & Pfeiffer, A. F. H. (2008). Metabolic effects of dietary fiber consumption and
prevention of diabetes. Journal of Nutrition, 138, 439-442.
Wesseling, S., Koeners, M. P., & Joles, J. A. (2011). Salt sensitivity of blood pressure:
Developmental and sex-related effects. American Journal of Clinical Nutrition,
94(suppl), 1928S-1932S.
Wright, D. J., Leach, I. B. & Wilding, P. (1977). Differential scanning calorimetric studies of
muscle and its constituent proteins. Journal of the Science of Food and Agriculture, 28,
557-564.
Wu, M. C., Akahane, T., Lanier, T. C., & Hamann, D. D. (1985). Thermal transitions of
actomyosin and surimi prepared from Atlantic croaker as studied by differential scanning
calorimetry. Journal of Food Science, 50, 10-13.
Wu, M., Youling, L., Xiong, Y. L., Chen, J., Tang, X., Zhou, G. (2009). Rheological and
microstructural properties of porcine myofibrillar protein – lipid emulsion composite
gels. Journal of Food Science, 74(4), e207-e217.
Xiong, Y. L. (1992). Thermally induced interactions and gelation of combined myofibrillar
protein from white and red broiler muscles. Journal of Food Science, 57(3), 581-585.
Yoon, W. B., Gunasekaran, S., & Park, J. W. (2004). Characterization of thermorheological
behavior of Alaska Pollock and pacific whiting surimi. Journal of Food Science, 69(7),
E338-E343.

48
Yoon, K. S., & Lee, C. M. (1990). Effect of powdered cellulose on the texture and freeze-thaw
stability of surimi-based shellfish analog products. Journal of Food Science, 55(1), 87-
91.
Yoon, K., Lee, C. M., & Chung, K. H. (1987, November). Effect of powdered cellulose on the
texture and water binding properties of surimi-based products. 1st Joint Conference of
Tropical and Subtropical Fisheries Technology and Atlantic Fisheries Technology,
Orlando, FL. Retrieved from http://fshn.ifas.ufl.edu/seafood/sst/AnnPdf/12th_516.pdf
Zhao, G., Etherton, T. D., Martin, K. R., West, S. G., Gillies, P. J., & Kris-Etherton, P. M.
(2004). Dietary α-linolenic acid reduces inflammatory and lipid cardiovascular factors in
hypercholesterolemic men and women. The Journal of Nutrition, 134, 2991-2997.

49
CHAPTER III: PYSICOCHEMICAL PROPERTIES OF SURIMI
NUTRIFIED WITH DIETARY FIBER
Introduction
Most American diets are deficient in dietary fiber. The Institute of Medicine
recommends fiber intake to be 25-38 grams of fiber per day; however the average intake is only
about 15 grams each day (Dietary Guidelines Advisory Committee, 2010). Dietary fiber is
defined as “remnants of the edible part of the plant and analogous carbohydrate that are resistant
to digestion and absorption in the human small intestine with complete or partial fermentation in
the human large intestine. It includes polysaccharides, oligosaccharides, lignin and associated
plant substances…that promote beneficial physiological effects” (Bodner & Sieg, 2009; Prosky,
2000). It has been shown that a high intake of dietary fiber is protective against coronary heart
disease, diabetes, obesity, and intestinal disorders (Anderson et al., 2009).
Although most beneficial health effects associated with fiber are attributed to soluble
fiber, insoluble fiber has been shown to have a significant impact on health, especially in recent
years. Insoluble fiber is generally associated with intestinal health due to its effect of increasing
fecal bulk and stool frequency, decreasing transit time, and diluting carcinogenic compounds,
thereby preventing constipation and possibly reducing the risk of colorectal cancer (Brownlee,
Dettmar, Strugala, & Pearson, 2006; Raninen, Lappi, Mykkänen, & Poutanen, 2010). Insoluble
fiber specifically has also been implicated in being protective against cardiovascular disease
(Smith & Tucker, 2011). Insoluble fiber intake more than soluble fiber intake is associated with
a reduced risk of type 2 diabetes mellitus and improved insulin sensitivity (Smith & Tucker,

50
2011; Weickert & Pfeiffer, 2008). Insoluble fiber may also reduce the risk of obesity possibly by
replacing energy dense foods and increasing satiety (Smith & Tucker, 2011).
In addition to these physiological effects, insoluble fiber also has technological effects
that are of benefit to the food science industry. Powdered cellulose specifically is white in color
and has a bland taste (Bodner & Sieg, 2009). It is also chemically inert. Specific fiber lengths of
powdered cellulose have distinct effects, with longer fibers (>110 micron) having the ability to
bind more water or oil than shorter fiber lengths due to the porous matrix of long fiber length
powdered cellulose (Ang, 1991). Although thickening properties are not generally seen with
insoluble fiber, cellulose with a fiber length of 110 microns has been shown to have some
thickening properties and therefore may have additional functional benefits when compared to
other insoluble fibers (Ang, 1991). These characteristics show powdered cellulose may have
possible potential for incorporation into food products.
Already, powdered cellulose has been successfully incorporated in baked goods and some
processed meat products as a non-caloric bulking agent. Cellulose has improved the volume and
stability of cake products and decreased the fat content of fried baked goods while maintaining
moisture (Ang & Miller, 1991). It has also been applied to sausages to reduce fat while retaining
textural properties (Bengtsson, Montelius, & Tornberg, 2011). In these uses, fiber has been
shown to have beneficial effects on the properties of the products.
Although insoluble fiber has been well researched in baked goods, its application in
surimi seafood has not been thoroughly studied and it is not traditionally added to surimi. Many
previous studies incorporating fiber into surimi have utilized soluble fibers such as carrageenan,
chicory root inulin, garrofin, guar, and xanthan (Cardoso, Mendes, & Nunes, 2007; Cardoso,
Mendes, Vaz-Pires, & Nunes, 2009; Sánchez-Alonso, Haji-Maleki, & Borderias, 2007a). These

51
soluble fibers have shown some detrimental effects on textural properties of surimi gels,
including loss of elasticity and gel strength combined with hardening of gels (Cardoso et al.,
2007). In some cases a softening of surimi gels is seen with soluble fiber addition (Cardoso et
al., 2009). These effects are especially noticeable when compared to insoluble fiber addition,
which tend to improve hardness, springiness, and chewiness (Cardoso et al., 2009; Sánchez-
Alonso et al., 2007a).
The bland flavor and white color of powdered cellulose make it an optimal choice for
addition to surimi, for which whiteness is an essential characteristic; however, the effects of
powdered cellulose on gelation and textural properties have not been thoroughly researched.
Many previous studies have used inner pea fiber and wheat dietary fiber (Cardoso et al., 2009;
Sánchez-Alonso et al., 2007a; Sánchez-Alonso, Solas, & Borderías, 2007b). Also, research with
insoluble fiber has produced conflicting results. Cardoso et al. (2009) found that inner pea fiber
addition to chub and Atlantic mackerel increased hardness, springiness, and chewiness and
improved elastic and viscous modules. Sánchez-Alonso et al. (2007a) also found that wheat
fiber addition to hake and horse mackerel improved whiteness and harness of surimi gels.
However, Sánchez-Alonso et al. (2007b) observed a loss of hardness and gel strength as well as a
decrease in whiteness with wheat fiber addition to giant squid surimi. One study also observed
the effects of powdered cellulose with fiber lengths of 11 to 55 microns on surimi gels and found
that more than 2% fiber addition resulted in significantly lower firmness, chewiness, and
rubberiness (Yoon, Lee, & Chung, 1987).
These varied results may be caused by the variation in marine species. The type or brand
of insoluble fiber as well as the fiber length used have different effects in application to surimi
gels. In addition, in the design of many of the previously mentioned studies, protein composition

52
of the surimi gels was displaced by added fiber, making protein a variable contributing to the
results. Surimi gels with lower percent composition of protein will have poorer textural
properties compared to gels with a higher composition of protein (Park, 2005). Thus the effects
of powdered cellulose fiber on physicochemical properties of surimi seafood have not been
thoroughly studied. The objectives of this study are to determine the effects of dietary fiber on
1) color and textural properties and 2) endothermic transitions and gelation properties of surimi
gels formulated with a constant protein component.
Materials and Methods
Surimi
Frozen Alaska Pollock surimi grade A was obtained from Trident Seafoods Corp.
(Seattle, WA). Surimi contained cryoprotectants (4 g/100 g of sorbitol and 4 g/100 g of sucrose),
0.15 g/100 g of sodium tripolyphosphate, and 0.15 g/100 g of tetrasodium pyrophosphate.
Frozen surimi blocks (10 kg each) were shipped overnight in heavily insulated industrial strength
boxes filled with ice. Upon arrival surimi blocks were cut into approximately 800 g units,
vacuum-packaged, and stored at -80°C until needed. The moisture content of surimi was
determined as 76.04 g/100 g (AOAC, 1995).
Preparation of surimi paste
Surimi pastes were made using the procedure described by Jaczynski and Park (2003,
2004). Briefly, frozen surimi was thawed in the refrigerator (4°C) for 1 day. Surimi was
chopped in a universal food processor (Model UMC5, Stephan Machinery Corp., Columbus,
OH) at low speed for 1 min. A surimi paste was obtained by adding 2 g/100 g of NaCl and
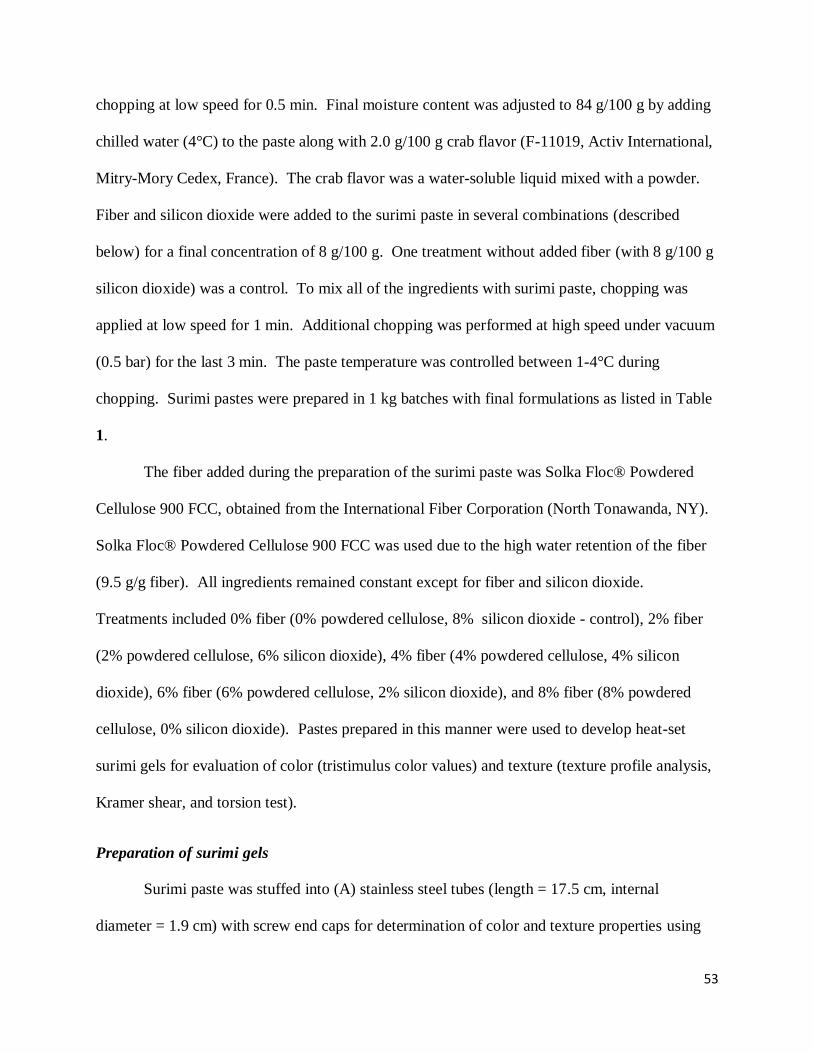
53
chopping at low speed for 0.5 min. Final moisture content was adjusted to 84 g/100 g by adding
chilled water (4°C) to the paste along with 2.0 g/100 g crab flavor (F-11019, Activ International,
Mitry-Mory Cedex, France). The crab flavor was a water-soluble liquid mixed with a powder.
Fiber and silicon dioxide were added to the surimi paste in several combinations (described
below) for a final concentration of 8 g/100 g. One treatment without added fiber (with 8 g/100 g
silicon dioxide) was a control. To mix all of the ingredients with surimi paste, chopping was
applied at low speed for 1 min. Additional chopping was performed at high speed under vacuum
(0.5 bar) for the last 3 min. The paste temperature was controlled between 1-4°C during
chopping. Surimi pastes were prepared in 1 kg batches with final formulations as listed in Table
1.
The fiber added during the preparation of the surimi paste was Solka Floc® Powdered
Cellulose 900 FCC, obtained from the International Fiber Corporation (North Tonawanda, NY).
Solka Floc® Powdered Cellulose 900 FCC was used due to the high water retention of the fiber
(9.5 g/g fiber). All ingredients remained constant except for fiber and silicon dioxide.
Treatments included 0% fiber (0% powdered cellulose, 8% silicon dioxide - control), 2% fiber
(2% powdered cellulose, 6% silicon dioxide), 4% fiber (4% powdered cellulose, 4% silicon
dioxide), 6% fiber (6% powdered cellulose, 2% silicon dioxide), and 8% fiber (8% powdered
cellulose, 0% silicon dioxide). Pastes prepared in this manner were used to develop heat-set
surimi gels for evaluation of color (tristimulus color values) and texture (texture profile analysis,
Kramer shear, and torsion test).
Preparation of surimi gels
Surimi paste was stuffed into (A) stainless steel tubes (length = 17.5 cm, internal
diameter = 1.9 cm) with screw end caps for determination of color and texture properties using

54
tristimulus color values (L*a*b*), texture profile analysis (TPA) and Kramer shear test; and (B)
hour-glass pre-molded stainless steel torsion tubes (length = 17.5 cm, end diameter = 1.9 cm,
midsection diameter = 1.0 cm) with screw and caps for determination of texture properties using
the torsion shear stress and shear strain. The tubes were heated in a water bath set at 90°C for 15
min (Taskaya, Chen, Beamer, & Jaczynski, 2009). Following heating, tubes were chilled in ice
slush and surimi gels were removed for analysis.
Color properties of heat-set surimi gels
The gel samples were equilibrated to room temperature for 2 h prior to the color
measurement. The color properties of heat-set surimi gels were determined using a Minolta
Chroma Meter CR-300 colorimeter (Minolta Camera Co. Ltd., Osaka, Japan). At least ten
cylindrical gels (height = 2.54 cm, diameter = 1.90 cm) per treatment were used for color
measurements. The values for the CIE (Commission Internationale d’Eclairage of France) color
system using L*a*b* tristimulus color values were determined. Whiteness of gels was
calculated by the following equation (Kristinsson et al., 2005; National Fisheries Institute, 1991):
Whiteness = 100 - [(100 - L*)2 + a*
2 + b*
2]
1/2
Texture properties of heat-set surimi gels
Three different methods were employed to determine texture: the torsion test, Kramer
shear test, and texture profile analysis (TPA). Although these measurements are commonly
employed for determination of textural properties, each method provides slightly different
information. The torsion test is considered a fundamental test for texture, while the Kramer
shear test and TPA are empirical tests (Kim et al., 2005). The most comprehensive
understanding of textural properties is provided by a combination of the fundamental methods

55
and empirical tests; therefore, these three different methods were employed in the present study.
The gel samples were equilibrated to room temperature for 2 h prior to the texture measurement.
Torsion test of heat-set surimi gels was performed according to Chen & Jaczynski
(2007a; 2007b) and Jaczynski & Park (2003b). At least six hour-glass cylindrical gels per
treatment were glued to plastic discs and subjected to torsional shear using a Hamman Gelometer
(Gel Consultant, Raleigh, NC) set at 2.5 rpm. Shear stress and shear strain at mechanical
fracture were measured to determine gel strength and gel cohesiveness, respectively.
For the Kramer shear test, at least ten cylindrical gels (height = 8.0 cm, diameter = 1.9
cm) per treatment were tested using a texture analyzer (Model TA-HDi, Texture Technologies
Corp., Scarsdale, NY) with a Kramer cell attachment (Tahergorabi et al., 2011). The Kramer
shear cell consisted of five 3.0-mm thick and 70-mm wide shear blades passing through a cell
with a corresponding number of slots. Individual gel samples were weighed and placed under
the blades in the Kramer cell. Shear force was measured at a 127 mm/min crosshead speed and
expressed as maximum peak force (g peak force per g of gel sample).
Texture profile analysis (TPA) of the gels was performed according to Cheret et al.
(2005). At least ten cylindrical gels (height = 2.54 cm, diameter = 1.90 cm) per treatment were
used for the TPA measurement. Gel samples were subjected to two-cycle compression at 50%
compression using the texture analyzer with a 70-mm TPA compression plate attachment
moving at a speed of 127 mm/min. From the resulting force-time curves, hardness, springiness,
cohesiveness, gumminess, chewiness, and resilience were determined.
Differential scanning calorimetry (DSC)
Surimi paste was tested to determine the net heat energy (enthalpy, ∆H) as well as the
onset (Tonset) and maximum (Tmax) temperatures for endothermic transitions of the proteins using

56
differential scanning calorimeter (DSC Infinity Series F5010, Instrument Specialists, Inc., Spring
Grove, IL). Approximately 20 mg of a paste sample was hermetically sealed in an aluminum
pan and scanned between 20 and 90C at a heating rate of 10C/min (Park & Lanier, 1989;
Yongsawatdigul et al., 2004). Careful attention was paid to ensure good contact between the
paste sample and the bottom of the aluminum pan. Temperature calibrations were performed
prior to measurements according to the manufacturer and an empty pan was used as reference.
At least five thermograms per treatment were generated to determine ∆H, Tonset, and Tmax.
Oscillatory dynamic rheology
The non-destructive, gelation properties of the surimi pastes were determined using a
cone and plate attached to an oscillatory dynamic rheometer (Bohlin CVOR 200, Malvern
Instruments Ltd., Worcestershire, UK). Once the sample was pressed by lowering the measuring
geometry plate, excess sample was removed with a stainless steel spatula. The gap between
measuring geometry and peliter plates was adjusted to 150 µm. The storage modulus (G’) was
measured with a temperature increasing from 25 to 95C at the heating rate of 1C/min (Chen &
Jaczynski 2007a; 2007b). Tests were conducted at 1% strain and 0.1 Hz frequency. A plastic
cover supplied from the company was used to prevent moisture evaporation during
measurement. An average of 3 rheograms per treatment was used to determine G’.
Statistical Analysis
One batch of each treatment was created. In each batch at least ten measurements for
determination color (L* a* b*) were performed, six for torsion test, ten for Kramer test, and ten
for TPA. Data were subjected to one-way analysis of variance (ANOVA). A significant
difference was determined at the 0.05 probability level and differences between treatments were
tested using the Least Significant Difference (LSD) test (Freud and Wilson, 1997). All statistical

57
analyses of data were performed using SAS (2002). The data are reported as mean values ±
standard deviation (SD).
Results and Discussion
Color properties of heat-set surimi gels
Figure 1 shows the tristimulus color values (L* a* b*) and a plot of the whiteness values.
L* is a scale, 0-100, of blackness and whiteness with 0 being more black and 100 being more
white. The value a* correlates with redness (positive values) and greenness (negative values),
and b* is a measure of yellowness (positive values) and blueness (negative values). Whiteness
was calculating using L*, a*, and b* as previously described. Overall whiteness decreased with
the addition of fiber. This is mainly seen in the 6% and 8% treatments as they are significantly
less white (P<0.05) than the 2% and 4% treatments. This decrease in whiteness correlates with a
decrease in L* values with increasing fiber (P<0.05); however, this decrease is only seen with
more than 4% fiber added to the product. The a* and b* measures showed a similar trend.
These values showed a significant decrease with each incremental increase in fiber (P<0.05) (a*:
0.30.0 for control vs. -2.80.1 for 8% fiber; b*: 9.50.7 for control vs. 5.40.2 for 8% fiber).
This indicates a shift away from neutral for a* toward a greener product, and in the case of b*, a
shift toward a less yellow product. Although whiteness decreased with these samples, these
values are still acceptable of high quality surimi gels.
Other studies have also observed the effects of fiber on color values. Sánchez-Alonso et
al. (2007a) used wheat fiber as an additive in hake and horse mackerel. They found a significant
increase (P<0.05) in whiteness in proportion to the amount of fiber added (0%, 3%, or 6%) in
both raw and cooked samples. Cardoso et al. (2009) compared treatments of mackerel with inner

58
pea fiber to mackerel with chicory root inulin and found no significant effect on color values or
whiteness in treatments with 0%, 2% and 4% fiber. In another study, Sánchez-Alonso et al.
(2007b) incorporated wheat dietary fiber into giant squid surimi and found a slight decrease in
whiteness from 83.5% with 0% fiber to 79.6% with 6% fiber. This is comparable to the present
study where a decrease in whiteness was also seen; however, in the present study the 4% fiber
treatment had the highest whiteness value (even over the 0% fiber treatment) at 84.08% and this
value decrease with the addition of fiber to 81.53% with 8% fiber. Sánchez-Alonso et al.
(2007b) observed a similar decrease in lightness (L*) and a significant increase in yellowness
(+b*). The present study also observed a slight decrease in lightness. In contrast, the yellowness
was seen to decrease proportional to added fiber.
There are several possible explanations for the effects seen in these studies. It is probable
that both the fiber type and the species of fish used impacted the tristimulus color values. Fish
species may have the largest impact since the flesh of some species is darker than that of others.
This may explain the lack of significant color differences with the mackerel, which has darker
flesh than Alaska Pollock. In fish with darker flesh, fiber seems to have a whitening effect,
whereas fish with white flesh do not benefit from the whitening effect.
Texture properties of heat-set gels
Torsion test was used to measure shear stress and shear strain at mechanical fracture of
surimi gels. These measures correspond to gel strength and cohesiveness, respectively (Kim et
al., 2005). Shear stress and shear strain are shown in Figure 2. Treatments with 2%, 4%, and
6% fiber showed significantly higher (P<0.05) shear stress than the control and 8% fiber
treatments, indicating a greater gel strength with 2% to 6% fiber addition. Although these
treatments all had similar shear stress, shear strain was highest for the 2% fiber treatment

59
(P<0.05) indicating that 2% fiber formed the most cohesive gel. The 4% and 6% fiber treatments
had similar, yet lower (P<0.05) shear strain values. The control and 8% fiber treatments had the
lowest shear strain values (P<0.05). These results indicate that a fiber addition of 2% to 6% will
produce gels with greater gel strength and cohesiveness.
The Kramer shear test is another measure of gel strength. Treatments with 6% and 8%
fiber demonstrated the highest Kramer force (P<0.05) (Figure 3). This is contradictory to the
torsion test which showed 8% fiber having the lowest shear stress and thus gel strength, showing
that multiple instruments are necessary to evaluate the various components of texture. Both 2%
fiber and 4% fiber showed a higher Kramer force than the control (P<0.05), but were lower than
the 6% and 8% treatments.
Texture Profile Analysis (TPA) (Table 2) measures various textural parameters: hardness,
the peak height on the first compression that measures a food’s resistance during a bite;
springiness, the ratio of product height on the second compression to the original compression
distance that measures the ability of the product to retain its shape and size after one bite;
cohesiveness, the ratio of the second compression area to the first compression area that
measures the resistance of the product during chewing; gumminess, the product of hardness and
chewiness that measures strength required in chewing; chewiness, the product of gumminess and
springiness that measures the energy used in chewing; and resilience, a measure of how well a
product regains its original position, (Cardoso, Mendes, Pedro, & Nunes., 2008). There was no
difference in springiness among the treatments. Cohesiveness results reflected shear stress and
shear strain values, with 2% and 4% fiber having the highest values (P<0.05) and the control and
8% fiber having the lowest values (P<0.05). Hardness (Figure 3), gumminess and chewiness
showed similar trends, increasing incrementally with the addition of fiber. 6% and 8% fiber had

60
the greatest gumminess and chewiness (P<0.05), and 8% fiber had the greatest hardness
(P<0.05). Resilience, however, showed the opposite trend among the treatments with resilience
decreasing as percent fiber increased. Resilience was greatest for 2% fiber (P<0.05).
In general, the results of the torsion test, Kramer shear test, and TPA were supportive of
each other. Similar results were found among all tests. The control treatment showed properties
of a weak, soft gel, whereas the 8% fiber treatment formed a gel with great hardness, chewiness
and gumminess, yet was also a weaker gel than the 2%, 4%, and 6% treatments. These
treatments showed greater gel strength and cohesiveness, with 6% fiber having the greater
hardness.
Previous studies of fiber addition to surimi report mixed results. Some studies report a
decrease in chewiness, cohesiveness, springiness, hardness, gel strength, and elasticity (Cardoso
et al., 2007; Cardoso et al., 2008; Sánchez-Alonso et al., 2007b; Yoon et al., 1987). Others
report increased chewiness, springiness, hardness, elasticity, and gel strength (Cardoso et al.,
2007; 2008; 2009; Sánchez-Alonso et al., 2007a). These results vary depending on the type of
fiber used and their level of incorporation in surimi. Yoon et al. (1987) reported a decrease in
firmness, chewiness, and rubberiness when fiber was incorporated above 2% in surimi gels.
Similarly, Sánchez-Alonso et al. (2007b) reported a decrease in chewiness, gel strength,
hardness, and cohesiveness with wheat dietary fiber incorporated at 3% and 6% levels.
However, in another study, Sánchez-Alonso et al. (2007a) found hardness to increase when water
was not added to maintain constant moisture. Cardoso et al. (2007, 2009) found chicory root
inulin to reduce hardness and increase elasticity of surimi gels. When inner pea fiber was used
instead, increased hardness, springiness, and chewiness was seen (Cardoso et al., 2009).

61
The mechanisms for these findings may be related to a loss of gel strength seen related to
decreased protein concentration in proportion to the increased fiber addition. Surimi with lower
protein content is known to produce less firm gels, which would affect the textural properties of
the gels. In the present study, protein concentration remained constant. This may explain the
increased hardness, chewiness, gumminess, springiness, Kramer shear force, and shear stress and
strain seen in this study. In addition, it is possible that fiber incorporation may disrupt the
existing protein matrix (Cardoso et al., 2007; Sánchez-Alonso et al., 2007b). High fiber
incorporation of 8% in the present study did result in significantly lower shear stress and shear
strain values, which may be explained by disruption of the protein matrix.
Differential scanning calorimetry (DSC)
Irreversible denaturation of protein is a necessary step in the process of heat-induced
surimi protein gelation. Because surimi has been washed of sarcoplasmic proteins, the protein
components present in the surimi used in this study are myofibrillar proteins, composed of actin
and myosin. These proteins denature at different temperatures, with the myosin undergoing
thermal denaturation at a lower temperature than actin. Therefore, the first peak in the DSC
thermograms (Figure 4) corresponds to myosin denaturation and the second peak corresponds to
actin denaturation (Wright, Leach, & Wilding, 1977).
The objective of evaluating DSC in this study was to measure thermal denaturation of
actin and myosin under the influence of powdered cellulose fiber. Surimi pastes were used for
the DSC tests. Results showed that the changes in Tmax of myosin and actin were relatively
unchanged among the treatments, with Peak 1 occurring around 30-35°C and Peak 2 occurring
around 70-75°C for all treatments. From these results it is seen that powdered cellulose fiber
does not affect denaturation of actin or myosin. This implies that fiber does not interact with
62
thermal gelation of proteins in the surimi gels. Powdered cellulose fiber has been reported to be
a chemically inert product, and therefore does not interfere with gelation or denaturation
(Sánchez-Alonso, et al., 2007a; Yoon et al., 1987).
Oscillatory dynamic rheology
In addition to DSC, dynamic rheology was used to study heat-induced gelation of
myofibrillar proteins. Rheology is useful in determining textural characteristics of gels as well
as chemical characteristics that contribute to gelation (Hamann & MacDonald, 1992).
Viscoelasticity is one measure of dynamic rheology and is indicated by the elastic modulus, Gʹ.
Gʹ is a measure of the viscous vs. elastic nature of a sample. When Gʹ is equal to zero the sample
is entirely viscous in nature. As a sample becomes more elastic, this value increases. This
process occurs in steps: 1) initiation step characterized by the unfolding of protein molecules,
and 2) aggregation step which results in gel formation via hydrogen bonds, electrostatic bonds,
and hydrophobic interactions, usually occurring above 55°C (Yoon, Gunasekaran, & Park,
2004). Dynamic rheology is used in this study to determine the effect of fiber on gelation
curves.
In the present study, the graphical portrayal of elastic modulus for each treatment
followed the same approximate trend, with one large peak and plateau between 80 and 90°C. In
addition, all treatments showed an initial increase in elastic modulus at around 55°C indicating
the formation of hydrogen bonds, electrostatic bonds, and hydrophobic interactions as mentioned
by Yoon et al. (2004). There were differences between the treatments, however. In general there
was an increase in final Gʹ at 90°C as fiber concentration increased (Figure 4). With each
addition of fiber (from 0% to 2% to 4%, etc.) the final elastic modulus of the sample increased.
This trend was seen for all treatments except for the 6% and 8% treatments. For these

63
treatments, 6% fiber created a more elastic product than 8% fiber. This observation is interesting
to note since the only variation in the treatments is the fiber concentration, yet as previously
mentioned, powdered cellulose fiber has is a chemically inert additive. The fiber must therefore
have an effect, independent of protein gelation, which contributes to the elastic nature of the
surimi gel.
There are a few factors that may contribute to enhanced gelation with the addition of
fiber. One factor may be the dehydration effect of the fiber. Yoon, Gunasekaran, & Park (2004)
noted that proteins with a lower moister and thus having a higher protein concentration more
readily began the gelation process. This may also be related to the high rate of increase in elastic
modulus after fiber addition since the concentrated proteins more willingly undergo protein
unfolding and subsequent formation of disulphide and hydrophobic interactions (Karthikeyan,
Dileep, & Shamasundar, 2006).
Although the treatments in this study had a constant concentration of protein (thus
removing protein concentration as a variable), powdered cellulose fiber has a large water holding
capacity, thereby removing moisture from the protein portion of the surimi sol and concentrating
the myofibrillar proteins. Sánchez-González et al. (2009) used wheat dietary fiber as an additive
in Alaska Pollock surimi and found that the fiber did absorb moisture from the gel, increasing the
moisture in the fiber portion of the gel. They also noted an increase in β-sheet formation with
increased fiber concentration (6% fiber) which may have been caused by the dehydration effect
of the fiber on the protein, leading to increased protein aggregation and formation of β-sheets as
opposed to α-helices. This is beneficial to gel strength as increased β-sheet formation is directly
correlated with higher elasticity and possibly indicates a more regular arrangement of the protein
network (Niwa & Nakajima, 1975; Sánchez-González et al., 2009). It could also be

64
hypothesized that the powdered cellulose may form its own network that complements the
protein network (Chen., 2006). The decrease in elastic modulus seen with 8% fiber may be due
to over-incorporation of fiber causing some disruption in the protein matrix. Overall, these high
elastic modulus values indicate that surimi with fiber addition is able to form a highly ordered
network leading to increased gel strength as evidenced by the textural effects discussed earlier
(Karthikeyan et al., 2006).
Conclusion
This study demonstrated that powdered cellulose fiber can be a beneficial additive in
surimi seafood. Although fiber addition resulted in slightly lower color values, these values are
still acceptable of premium grade surimi. In addition, fiber improved textural properties such as
hardness, cohesiveness, chewiness, and gel strength. Some decline in gel strength was seen in
8% fiber and was further evidenced in rheological data. This suggests that there may be some
disruption of the protein matrix with a high concentration of fiber. Lower concentrations of fiber
showed a large increase in elastic modulus, indicating fiber may support the existing protein
matrix to create a stronger gel. These results are promising for the future implications of
manufacturing and marketing a surimi product with added fiber and possible health benefits.
Sensory evaluation is recommended to assess consumer acceptance of the product.
References
Anderson, J. W., Baird, P., Davis, R. H., Ferreri, S., Knudtson, M., Koraym, A., Waters, V., &
Williams, C. L. (2009). Health benefits of dietary fiber. Nutrition Reviews, 67(4), 188-
205. doi:10.1111/J.1753-4887.2009.00189.x

65
Ang, J. F. (1991). Water retention capacity and viscosity effect of powdered cellulose. Journal of
Food Science, 56(6), 1682-1684.
Ang, J. F., & Miller, W. B. (1991). Multiple functions of powdered cellulose as a food
ingredient. Cereal Foods World, 36(7), 558-564.
Association of Official Analytical Chemists. (1995). Official Methods of Analysis. (16th ed).
Washington, DC: Association of Official Analytical Chemists.
Bengtsson, H., Montelius, C., Tornberg, E. (2011). Heat-treated and homogenised potato pulp
suspensions as additives in low-fat sausages. Meat Science, 88, 75-81.
doi:10.1016/j.meatsci.2010.12.005
Bodner, J. M., & Sieg, J. (2009). Fiber. In R. Tarté (ed.), Ingredients in meat products:
Properties, functionality and applications (pp. 83-108). Springer Science + Business
Media, LLC. doi:10.1007/978-0-387-71327-4_4. Retrieved January 25, 2012, from
http://powderedcellulose.com/wp-content/themes/agency-sweetener-supply-
pc/images/fiber-properties-functionality-applications.pdf.
Brownlee, I. A., Dettmar, P. W., Strugala, V., & Pearson, J. P. (2006). The interaction of dietary
fibres with the colon. Current Nutrition and Food Science, 2, 243-264.
Cardoso, C., Mendes, R., & Nunes, M. L. (2007). Effect of transglutaminase and carrageenan on
restructured fish products containing dietary fibres. International Journal of Food
Science and Technology, 42, 1257-1264. doi:10.1111/j.1365-2621.2006.01231.x
Cardoso, C., Mendes, R., Pedro, S., & Nunes, M. L. (2008). Quality changes during storage of
fish sausages containing dietary fiber. Journal of Aquatic Food Product Technology,
17(1), 73-95.
Cardoso, C., Mendes, R., Vaz-Pires, P., & Nunes, M. L. (2009). Effect of dietary fibre and
MTGase on the quality of mackerel surimi gels. Journal of the Science of Food and
Agriculture, 89, 1648-1658. doi:10.1002/jsfa.3636
Chen, H. H. (2006). Thermal gelation behaviors of surimi protein mixed with
hydroxypropylmethylcellulose. Fisheries Science, 72, 679-685.
Chen, Y. C., & Jaczynski, J. (2007a). Gelation of protein recovered from Antarctic krill
(Euphausia superb) by isoelectric solubilization/precipitation as affected by function
additives. Journal of Agricultural and Food Chemistry, 55, 1814-1822.
Chen, Y. C., & Jaczynski, J. (2007b). Protein recovery from rainbow trout (Oncorhynchus
mykiss) processing by-products via isoelectric solubilization/precipitation and its gelation
properties as affected by functional additives. Journal of Agricultural and Food
Chemistry, 55, 9079-9088.
66
Cheret, R., Chapleau, N., Delbarre-Ladrat, C., Verrez-Bagnis, V., & Lamballerie, M. D. (2005).
Effects of high pressure on texture and microstructure of sea bass (Dicentrarchus labrax
L.) fillets. Journal of Food Science, 70, E477-E483.
Dietary Guidelines Advisory Committee. (2010). Report of the dietary guidelines advisory
committee on the dietary guidelines for Americans, 2010, to the secretary of Agriculture
and the Secretary of Health and Human Services. Washington, DC: Government printing
office. Retrieved from
http://www.cnpp.usda.gov/Publications/DietaryGuidelines/2010/PolicyDoc/PolicyDoc.pd
f
Freud, R. J., & Wilson, W. J. (1997). Design of experiments. San Diego (CA): Academic Press.
p. 464.
Hamann, D. D., & MacDonald, G. A. (1992). Rheology and textural properties of surimi and
surimi-based foods. In T. C. Lanier & C. M. Lee (Eds.), Surimi Technology (pp. 429-
500), New York, NY: Marcel Dekker, Inc.
Jaczynski, J., & Park, J. W. (2003). Microbial inactivation and electron penetration in surimi
seafood during electron beam processing. Journal of Food Science, 68(5), 1788-1792.
Jaczynski, J., & Park, J. W. (2004). Physiochemical changes in Alaska Pollock surimi and
surimi gel as affected by electron beam. Journal of Food Science, 69(1), 53-57.
Karthikeyan, M., Dileep, A. O., & Shamasundar, B. A. (2006). Effect of water washing on the
functional and rheological properties of proteins from threadfin bream (Nemipterus
japonicas) meat. International Journal of Food Science and Technology, 41, 1002-1010.
Kim, B. Y., Park, J. W., & Yoon, W. B. (2005). Rheology and texture properties of surimi gels.
In J.W. Park (Ed.), Surimi and surimi seafood 2nd
ed. (pp. 491-582), Boca Raton, FL:
Taylor and Francis Group.
Kristinsson, H. G., Theodore, A. E., Demir, N., & Ingadottir, B. (2005). A comparative study
between acid- and alkali-aided processing and surimi processing for the recovery of
proteins from channel catfish muscle. Journal of Food Science, 70, C298-C306.
National Fisheries Institute. (1991). A manual of standard methods for measuring and specifying
the properties of surimi. Washington (D.C.): National Fisheries Institute.
Niwa, E., & Nakajima, G. (1975). Differences in protein structure between elastic kamaboko and
brittle one. Nippon Suisan Gakkaishi, 41, 579.
Park, J. W., & Lanier, T. C. (1989). Scanning calorimetric behavior of tilapia myosin and actin
due to processing of muscle and protein purification. Journal of Food Science, 54, 49-51.
Prosky, L. (2000) When is dietary fiber considered a functional food? BioFactors, 12, 289-297.

67
Raninen, K., Lappi, J., Mykkänen, H., & Poutanen, K. (2010). Dietary fiber type reflects
physiological functionality: Comparison of grain fiber, inulin, and polydextrose.
Nutrition Reviews, 69(1), 9-21. doi:10.1111/J.1753-4887.2010.00358.x
Sánchez-Alonso, I., Haji-Maleki, R., & Borderias, A. J. (2007a). Wheat fiber as a functional
ingredient in restructured fish products. Food Chemistry, 100, 1037-1043.
doi:10.1016/j.foodchem.2005.09.090
Sánchez-Alonso, I., Solas, M. T., & Borderías, A. J. (2007b) Technological implications of
addition of wheat dietary fibre to giant squid (Dosidicus gigas) surimi gels. Journal of
Food Engineering, 81, 404-411. doi:10.1016/j.jfoodeng.2006.11.015
Sánchez-González, I., Rodríguez-Casado, A., Careche, M., & Carmona, P. (2009). Raman
analysis of surimi gelation by addition of wheat dietary fibre. Food Chemistry, 112, 162-
168.
SAS Institute. (2002). SAS/STAT guide for personal computers, version 8.1. Cary (NC): SAS
Institute.
Smith, C. E., & Tucker, K. L. (2011). Health benefits of cereal fibre: A review of clinical trials.
Nutrition Research Reviews, 24, 118-131. doi:10.1017/S0954422411000023
Tahergorabi, R., Beamer, S. K., Matak, K. E., & Jaczynski, J. (2011). Effect of isoelectric
solubilization/precipitation and titanium dioxide on whitening and texture of proteins
recovered from dark chicken-meat processing by-products. LWT – Food Science and
Technology, 44(4), 896-903.
Taskaya, L., Chen, Y. C., & Jaczynski, J. (2009a). Functional properties of proteins recovered
from whole gutted silver carp (Hypophthalmichthys molitrix) by isoelectric solubilization
/ precipitation. LWT – Food Science and Technology, 42(6), 1082-1089.
Weickert, M. O., & Pfeiffer, A. F. H. (2008). Metabolic effects of dietary fiber consumption and
prevention of diabetes. Journal of Nutrition, 138, 439-442.
Wright, D. J., Leach, I. B. & Wilding, P. (1977). Differential scanning calorimetric studies of
muscle and its constituent proteins. Journal of the Science of Food and Agriculture, 28,
557-564.
Yongsawatdigul, J., & Park, J. W. (2004). Effects of alkali and acid solubilization on gelation
characteristics of rockfish muscle proteins. Journal of Food Science, 69, 499-505.
Yoon, K., Lee, C. M., & Chung, K. H. (1987, November). Effect of powdered cellulose on the
texture and water binding properties of surimi-based products. 1st Joint Conference of
Tropical and Subtropical Fisheries Technology and Atlantic Fisheries Technology,
Orlando, FL. Retrieved from http://fshn.ifas.ufl.edu/seafood/sst/AnnPdf/12th_516.pdf

68
Yoon, W. B., Gunasekaran, S., & Park, J. W. (2004). Characterization of thermorheological
behavior of Alaska pollock and pacific whiting surimi. Journal of Food Science, 69(7),
E338-E343.

69
CHAPTER IV: INTERACTIONS OF DIETARY FIBER AND
OMEGA-3-RICH OILS WITH PROTEIN IN SURIMI GELS
Introduction
Heart disease is one of the leading causes of death in the United States. As of 2006,
mortality from cardiovascular disease (CVD) was 34.3%, translating to 1 of every 2.9 deaths
(Lloyd-Jones et al., 2010). Similarly, mortality from coronary heart disease (CHD) is 1 of every
6 deaths in the United States (Lloyd-Jones et al., 2010). In response to these high rates of heart
disease, the American Heart Association (AHA) released dietary recommendations, with major
points including limiting foods high in cholesterol and saturated fat, substituting saturated fats
with unsaturated fats, increasing fiber intake, and reducing salt (sodium chloride) intake (Krauss
et al., 2000).
Fiber has been implicated in preventing heart disease; however, most American diets are
deficient in dietary fiber. The Institute of Medicine recommends fiber intake to be 25-38 grams
of fiber per day; however the average intake is only about 15 grams each day (Dietary Guidelines
Advisory Committee, 2010). Dietary fiber is defined as “remnants of the edible part of the plant
and analogous carbohydrate that are resistant to digestion and absorption in the human small
intestine with complete or partial fermentation in the human large intestine. It includes
polysaccharides, oligosaccharides, lignin and associated plant substances…that promote
beneficial physiological effects” (Bodner & Sieg, 2009; Prosky, 2000). It has been shown that a
high intake of dietary fiber is protective against coronary heart disease, diabetes, obesity, and
intestinal disorders (Anderson et al., 2009).

70
Populations with fat intake of >30% total energy had low mortality rates from CVD
possibly associated with an observed high intake of fish oils (Psota, Gebauer, & Kris-Etherton,
2006). Further studies have associated omega-3 polyunsaturated fatty acid (PUFA) intake with
improvement of various cardiovascular measures. α-linolenic acid (ALA, 18:3n3) has been
found to decrease levels of C-reactive protein (CRP), a measure of inflammation associated with
cardiovascular disease, and thereby reduce risk of heart disease (Zhao, Etherton, Martin, West,
Gillies, & Kris-Etherton, 2004). Eicosapentaenoic acid (EPA, 20:5n3) and docosahexaenoic acid
(DHA, 22:6n3) intake have shown positive effects on cardiovascular measure by decreasing
triglycerides, total cholesterol, and LDL cholesterol, and increasing HDL cholesterol (Juturu,
2008; Nair, Leitch, Falconer, & Garg, 1997; Narayan, Miyashita, & Hosakawa, 2006). They
have also been found to decrease hypertension and prevent arrhythmia (Narayan et al., 2006).
Studies show adequate dietary EPA and DHA may reduce CVD mortality by 30-60% (Psota et
al., 2006). Because of these cardioprotective effects, the AHA, World Health Organization, and
Dietary Guidelines Advisory Committee Report recommend consuming two servings of fatty
fish or fish high in omega-3 PUFAs, EPA and DHA, twice per week (Dietary Guidelines
Advisory Committee, 2010; Krauss et al., 2000; World Health Organization, 2003). A more in
depth review of cardioprotective benefits of omega-3 PUFAs is discussed elsewhere
(Mozaffarian, & Wu, 2011; Psota et al., 2006).
Omega-3 PUFAs can be derived from plants and marine sources. Plant sources such as
walnuts, seeds, flaxseed, soybean, and canola oil are generally abundant in ALA, although algal
oils have been found to be a good source of DHA (Arterburn et al., 2008; Calder & Yaqoob,
2009; Gogus & Smith, 2010). Marine sources, especially cold water fish, are abundant in EPA
and DHA, which are the physiologically active forms of omega-3 PUFAs (Narayan et al., 2006).

71
Currently, dietary intakes of ALA, EPA, and DHA among western adults are 0.5-2 g/day (ALA)
and as low as <0.1 g/day (EPA and DHA) in individuals who do not consume fish, whereas the
recommended intakes are 1.1 to 1.6 g/day (ALA) for females and males, respectively, and 0.3-
0.4 g/day of EPA and DHA, although some sources recommend 0.5 g/d or more (Calder &
Yaqoob, 2009; IOM, 2005; Juturu, 2008; Kris-Etherton, Grieger, & Etherton, 2009). Although
the human metabolism is capable of converting ALA to EPA and DHA, these conversion rates
are inefficient with 5-10% of ALA being converted to EPA and only 2-5% to DHA (Anderson &
Ma, 2009; Psota et al., 2006). This low EPA/DHA level necessitates an increased intake of
omega-3 PUFAs in the form of EPA and DHA to observe the stated health benefits. Some have
suggested a possible deficiency in omega-3 PUFAs may contribute to deaths associated with
heart disease and that supplementation or change in diet to include increased omega-3 PUFAs
could help prevent the progression of this condition (Gogus & Smith, 2010).
In addition to fiber and omega-3 PUFAs, sodium has also been implicated in
cardiovascular disease. High sodium intake is associated with hypertension, or high blood
pressure (BP), which can attribute to the development of cardiovascular disease. High sodium
intake is also attributed to the development of fibrosis in the heart, kidneys, and arteries (Appel
et al., 2011). The Dietary Guidelines Advisory Committee (2010) recommends a sodium intake
of less than 2300 mg per day for the general population and an intake of less than 1500 mg per
day for those aged 51 years or older, or African American ethnicity, or afflicted with
hypertension, diabetes, or chronic kidney disease. Despite these recommendations, sodium
intake has continued to rise, possibly due to the high sodium content of processed foods. Using
salt substitutes in manufacturing food products may help reduce sodium intake. Potassium

72
chloride (KCl) is commonly used as a salt substitute due to the cardioprotective effects of
potassium, including reducing BP and mean arterial pressure (Buyck et al., 2009).
The market for functional foods is becoming increasingly popular worldwide. Functional
foods are those that contain added, technologically developed ingredients with specific health
benefits (Siró, Kápolna, Kápolna, & Lugasi, 2008). In regards to omega-3 PUFAs, the high cost
of fish and potential for contamination with compounds such as mercury may drive consumers to
choose enriched foods over fish sources to increase omega-3 PUFA consumption (Candela,
López, & Kohen, 2011). Surimi is myofibrillar fish protein that has been washed of lipids and
other impurities. It is a logical vehicle for functional additives as surimi is naturally low in fat,
of good nutritional quality, and consists of highly functional myofibrillar proteins. In a way, the
addition of omega-3 PUFAs into surimi would mimic natural fish products (Park, Kelleher,
McClements, & Decker, 2004).
Surimi seafood is not currently fortified with fiber or omega-3 oils, nor is salt substitute
(KCl) traditionally used in the formulation of surimi. Although there is little research on the
combined effect of fiber, omega-3 oils, and KCl on the functional properties of surimi seafood,
studies have looked at the distinct effects of fiber, omega-3-rich oil, and KCl addition. Fiber
incorporation in surimi shows mixed results and seem to be dependent on the source of fiber
used. Many previous studies have utilized soluble fibers such as carrageenan, chicory root
inulin, garrofin, guar, and xanthan (Cardoso, Mendes, & Nunes, 2007; Cardoso, Mendes, Vaz-
Pires, & Nunes, 2009; Sánchez-Alonso, Haji-Maleki, & Borderias, 2007a). These soluble fibers
have shown some detrimental effects on textural properties of surimi gels, including loss of
elasticity and gel strength combined with hardening of gels (Cardoso et al., 2007; 2009).
Research with insoluble fiber, on the other hand, has produced conflicting results. Sánchez-

73
Alonso et al. (2007b) observed a loss of hardness and gel strength with wheat fiber addition to
giant squid surimi. Another study observed the effects of powdered cellulose with fiber lengths
of 11 to 55 microns on surimi gels and found that more than 2% fiber addition resulted in
significantly lower firmness, chewiness, and rubberiness (Yoon, Lee, & Chung, 1987). In
contrast, Cardoso et al. (2009) found that inner pea fiber addition to chub and Atlantic mackerel
increased hardness, springiness, and chewiness and improved elastic and viscous modules.
When looking at surimi with omega-3-rich oil added in the form of fish oil concentrate,
menhaden oil, or marine oil, Peréz-Mateos et al. (2004) observed increased shear stress, breaking
force, and hardness with omega-3 addition when compared to control. Another study found that
surimi addition of algal oil (high in DHA) as an emulsified oil had no effect on gel strength,
whereas addition as bulk oil significantly decreased gel strength (P<0.05) when compared to the
control that contained no oil (Park et al., 2004). A study using flaxseed, algae, menhaden, krill,
and a blend of oils incorporated in surimi found no significant difference in shear stress or strain
between the samples and the control and texture profile analysis measures showed no significant
difference when compared to control except in the case of krill oil, which was significantly
(P<0.05) lower than the control (Pietrowski, Tahergorabi, Matak, Tou, & Jaczynski, 2011). In a
follow-up study Pietrowski et al. (2012) found that incorporating the aforementioned omega-3-
rich oils increased the elastic modulus (as measured by Gʹ) of the surimi gel, indicating possible
contribution of the oils to the protein matrix. These studies show that incorporation of omega-3-
rich oils in surimi can produce quality products.
When used as a substitute for NaCl in Alaska Pollock surimi, KCl has been found to
produce an acceptable product with acceptable color and textural character traits (Tahergorabi et
al., submitted for publication). Using KCl as a salt substitute, however, did result in softer gels

74
with decreased hardness (Gimeno, Astiasarán, & Bello, 1999; Montero & Pérez-Mateos, 2001;
Tahergorabi et al., submitted for publication). In formulations of surimi, dry-cured pork loin,
and mortadella that used only partial substitutions of KCl for NaCl, gel firmness was not affected
(Gou, Guerrero, Gelabert, & Arnau, 1996; Horita et al., 2011; Lian et al., 2002). Although some
differences were seen in texture, surimi gelation patterns and viscoelasticity were unchanged
when KCl was used in place of NaCl (Lian et al., 2002; Tahergorabi & Jaczynski, 2012). Salt
substitution has also been reported to have little effect on the color of resulting gels (Tahergorabi
et al., submitted for publication).
Although previous research has reviewed the distinct effects of the incorporation of fiber,
omega-3 oils, or KCl on textural quality and gelation of surimi seafood products, no known
study has evaluated the effect of the combined addition of fiber and omega-3 oils, with KCl used
as a substitute for NaCl. This would render a nutraceutical product that addresses the dietary
recommendations posed by the American Heart Association. The objective of this study was to
analyze the effects of added dietary fiber and omega-3 oil, with KCl used as a salt substitute, and
their effect on physicochemical properties of surimi.
Materials and Methods
Surimi
Frozen Alaska Pollock surimi grade A was obtained from Trident Seafoods Corp.
(Seattle, WA). Surimi contained cryoprotectants (4 g/100 g of sorbitol and 4 g/100 g of sucrose),
0.15 g/100 g of sodium tripolyphosphate, and 0.15 g/100 g of tetrasodium pyrophosphate.
Frozen surimi blocks (10 kg each) were shipped overnight in heavily insulated industrial strength
boxes filled with ice. Upon arrival surimi blocks were cut into approximately 800 g units,

75
vacuum-packaged, and stored at -80°C until needed. The moisture content of surimi was
determined as 76.04 g/100 g (AOAC, 1995).
Preparation of surimi paste
Surimi pastes were made using the procedure described by Jaczynski and Park (2003,
2004). Briefly, frozen surimi was thawed in the refrigerator (4°C) for 1 day. Surimi was
chopped in a universal food processor (Model UMC5, Stephan Machinery Corp., Columbus,
OH) at low speed for 1 min. A surimi paste was obtained by adding 2.8 g/100 g of KCl and
chopping at low speed for 0.5 min. KCl concentration was calculated as described in
Tahergorabi et al. (2012). Final moisture content was adjusted to 79 g/100 g by adding chilled
water (4°C) to the paste. Either fiber or silicon dioxide was added to the surimi paste for a final
concentration of 6 g/100 g. Omega-3-rich oils (see below) were added at 10 g/100 g by
replacing water (1:1) added to the surimi paste (Park, 2005; Pérez-Mateos et al., 2004; 2006).
The oil was homogenized with water to dilute the color before addition to surimi. Final
combined oil and water concentration was 37.2 g/100 g in all treatments. One treatment without
added fiber or omega-3-rich oil, with 6 g/100 g silicon dioxide was a control. To mix all of the
ingredients with surimi paste, chopping was applied at low speed for 1 min. Additional
chopping was performed at high speed under vacuum (0.5 bar) for the last 3 minutes. The paste
temperature was controlled between 1-4°C during chopping. Surimi pastes were prepared in 1
kg batches with final formulations as listed in Table 3.
The fiber added during the preparation of the surimi paste was Solka Floc® Powdered
Cellulose 900 FCC, obtained from the International Fiber Corporation (North Tonawanda, NY).
Solka Floc® Powdered Cellulose 900 FCC was used due to the high water retention of the fiber
(9.5 g/g fiber). Silicon dioxide was added as inert filler in place of fiber at a concentration of 6

76
g/100 g. The following omega-3-rich oils were added to surimi paste: flaxseed oil, obtained
from Jedwards International, Inc. (Quincy, MA); algae oil (DHAS), obtained from Martek
Biosciences (Columbia, MD); and menhaden oil (Omega Pure 8042TE), obtained from Omega
Pure (Reedsville, VA). These oils were combined in a blend (Flaxseed:Algae:Menhaden 8:1:1)
and added to surimi paste at a concentration of 10 g/ 100g.
Treatments consisted of 1) control with 0% oil and 6% silicone dioxide (in place of
fiber), 2) fiber treatment with 6% fiber added (no silicon dioxide), 3) oil treatment with 10%
omega-3-rich oil blend and 6% silicon dioxide (in place of fiber), and 4) fiber/oil treatment with
6% fiber (no silicone dioxide), and 10% omega-3-rich oil blend. Pastes prepared in this manner
were used to develop heat-set surimi gels for evaluation of color (tristimulus color values) and
texture (texture profile analysis, Kramer shear, and torsion test), as well as for DSC and dynamic
rheology tests.
Preparation of surimi gels
Surimi paste was stuffed into (A) stainless steel tubes (length = 17.5 cm, internal
diameter = 1.9 cm) with screw end caps for determination of color and texture properties with
tristimulus color values (L*a*b*), texture profile analysis (TPA) and Kramer shear test; and (B)
hour-glass pre-molded stainless steel torsion tubes (length = 17.5 cm, end diameter = 1.9 cm,
midsection diameter = 1.0 cm) with screw and caps for determination of texture properties with
the torsion test. The tubes were heated in a water bath set at 90°C for 15 min (Taskaya, Chen,
Beamer, & Jaczynski, 2009). Following heating, tubes were chilled in ice slush and surimi gels
were removed for analysis.

77
Color properties of heat-set surimi gels
The gel samples were equilibrated to room temperature for 2 h prior to the color
measurement. The color properties of heat-set surimi gels were determined using a Minolta
Chroma Meter CR-300 colorimeter (Minolta Camera Co. Ltd., Osaka, Japan). At least fifteen
cylindrical gels (height = 2.54 cm, diameter = 1.90 cm) per treatment were used for color
measurements. The values for the CIE (Commission Internationale d’Eclairage of France) color
system using L*a*b* tristimulus color values were determined. Whiteness of gels was
calculated by the following equation (Kristinsson et al., 2005; National Fisheries Institute, 1991):
Whiteness = 100 - [(100 - L*)2 + a*
2 + b*
2]
1/2
Texture properties of heat-set surimi gels
Three different methods were employed to determine texture: the torsion test, Kramer
shear test, and texture profile analysis (TPA). Although these measurements are commonly
employed for determination of textural properties, each method provides slightly different
information. The torsion test is considered a fundamental test for texture, while the Kramer
shear test and TPA are empirical tests (Kim et al., 2005). The most comprehensive
understanding of textural properties is provided by a combination of the fundamental methods
and empirical tests; therefore, these three different methods were employed in the present study.
The gel samples were equilibrated to room temperature for 2 h prior to the texture measurement.
Torsion test of heat-set surimi gels was performed according to Chen & Jaczynski
(2007a; 2007b) and Jaczynski & Park (2003). At least five hour-glass cylindrical gels per
treatment were glued to plastic discs and subjected to torsional shear using a Hamman Gelometer

78
(Gel Consultant, Raleigh, NC) set at 2.5 rpm. Shear stress and shear strain at mechanical
fracture were measured to determine gel strength and gel cohesiveness, respectively.
For the Kramer shear test, at least eight cylindrical gels (height = 8.0 cm, diameter = 1.9
cm) per treatment were tested using a texture analyzer (Model TA-HDi, Texture Technologies
Corp., Scarsdale, NY) with a Kramer cell attachment (Tahergorabi et al., 2011). The Kramer
shear cell consisted of five 3.0-mm thick and 70-mm wide shear blades passing through a cell
with a corresponding number of slots. Individual gel samples were weighed and placed under
the blades in the Kramer cell. Shear force was measured at a 127 mm/min crosshead speed and
expressed as maximum peak force (g peak force per g of gel sample).
Texture profile analysis (TPA) of the gels was performed according to Cheret et al.
(2005). At least fifteen cylindrical gels (height = 2.54 cm, diameter = 1.90 cm) per treatment
were used for the TPA measurement. Gel samples were subjected to two-cycle compression at
50% compression using the texture analyzer with a 70-mm TPA compression plate attachment
moving at a speed of 127 mm/min. From the resulting force-time curves, hardness, springiness,
cohesiveness, gumminess, chewiness, and resilience were determined.
Differential scanning calorimetry (DSC)
Surimi paste was tested to determine the net heat energy (enthalpy, ∆H) as well as the
onset (Tonset) and maximum (Tmax) temperatures for endothermic transitions of the proteins using
differential scanning calorimeter (DSC Infinity Series F5010, Instrument Specialists, Inc., Spring
Grove, IL). Approximately 20 mg of a paste sample was hermetically sealed in an aluminum
pan and scanned between 20 and 90C at a heating rate of 10C/min (Park & Lanier, 1989;
Yongsawatdigul et al., 2004). Careful attention was paid to ensure good contact between the
paste sample and the bottom of the aluminum pan. Temperature calibrations were performed

79
prior to measurements according to the manufacturer and an empty pan was used as reference.
At least five thermograms per treatment were generated to determine ∆H, Tonset, and Tmax.
Oscillatory dynamic rheology
The non-destructive, gelation properties of the surimi pastes were determined using a
cone and plate attached to an oscillatory dynamic rheometer (Bohlin CVOR 200, Malvern
Instruments Ltd., Worcestershire, UK). Once the sample was pressed by lowering the measuring
geometry plate, excess sample was removed with a stainless steel spatula. The gap between
measuring geometry and peliter plates was adjusted to 150 µm. The storage modulus (G’) was
measured with a temperature increasing from 25 to 95C at the heating rate of 1C/min (Chen &
Jaczynski 2007a; 2007b). Tests were conducted at 1% strain and 0.1 Hz frequency. A plastic
cover supplied from the company was used to prevent moisture evaporation during
measurement. An average of 3 rheograms per treatment was used to determine G’.
Statistical analysis
One batch of each treatment was created. In each batch at least ten measurements for
determination color (L* a* b*) were performed, six for torsion test, ten for Kramer test, and ten
for TPA. Data were subjected to one-way analysis of variance (ANOVA). A significant
difference was determined at the 0.05 probability level and differences between treatments were
tested using the Least Significant Difference (LSD) test (Freud and Wilson, 1997). All statistical
analyses of data were performed using SAS (2002). The data are reported as mean values ±
standard deviation (SD).

80
Results and Discussion
Color properties of heat-set surimi gels
Figure 5 shows the tristimulus color values (L* a* b*) and a graphical depiction of
whiteness values. L* is a scale, 0-100, of blackness and whiteness with 0 being more black and
100 being more white. The value a* correlates with redness (positive values) and greenness
(negative values), and b* is a measure of yellowness (positive values) and blueness (negative
values). Whiteness was calculating using L*, a*, and b* as previously described.
In this study, lightness (L*) increased with the addition of oil (P<0.05). Although L* was
significantly (P<0.05) lower for the fiber treatment compared to the control, the fiber/oil
treatment showed the highest lightness values (P<0.05) among all treatments. Sánchez-Alonso et
al. (2007b) observed a similar decrease in lightness (L*) with the addition of wheat dietary fiber
to giant squid surimi, although the decrease in lightness was accompanied by an increase in
yellowness (+b*) that was not observed in this study. Oil addition to surimi caused an increase
in lightness that Pérez-Mateos et al. (2004) explained was due to an increased dispersion of light
caused by the presence of emulsified oil droplets. Pietrowski et al. (2011) saw a similar increase
in lightness compared to the control with the addition of corn, flaxseed, algae, and menhaden oil
to surimi.
Addition of fiber to surimi, both in the fiber and fiber/oil treatments, resulted in more
negative a* values, indicating a slightly greater green hue in these treatments. The oil treatment
was also significantly (P<0.05) more green than the control; however, the fiber/oil treatment
displayed the lowest (P<0.05) a* values. These results differ from those of Pietrowski et al.
(2011) who used a similar oil blend (Flaxseed:Algae:Krill 8:1:1) and found a significant increase
in redness (+a*) from -3.41±0.07 in the control to 23.24±0.4 with the oil blend. Krill has a

81
natural red color due to the presence of the antioxidant and carotenoid astaxanthin, which
explains the red color seen in the study by Pietrowski et al. (2011) (Gigliotti, Davenport,
Beamer, Tou, & Jaczynski, 2011; Tou, Jaczynski, & Chen, 2007). In the present study,
menhaden was substituted for krill oil in the blend to avoid the coloration seen with krill oil.
Fiber improved the b* (yellowness) value over the control (P<0.05) by decreasing +b*.
Although fiber decreased the whiteness when added alone to surimi, the fiber/oil treatment
increased the yellowness (+b*) value (P<0.05) more than the addition of oil alone (oil treatment
19.89±0.18, fiber/oil treatment 23.32±0.15). A similar increase in yellowness (+b*) was seen in
the addition of algal oil to cod surimi (Park et al., 2004). Pietrowski et al. (2011) observed the
largest increase in yellowness with algae and krill oils. The coloration present with the current
blend of Flaxseed:Algae:Menhaden oils (8:1:1) can be explained by the high carotenoid content
of algae oil, which produced the yellow-orange coloration seen in treatments with oil (Moretti et
al., 2006; Nitsan, Mokady, & Sukenik, 1999; Pietrowski et al., 2011). Evidently, the effect of
homogenization was not great enough to overcome the strong yellow pigmentation of these
carotenoids. It is interesting to note that fiber in the presence of oil resulted in an increase in
yellowness compared to the oil treatment when fiber alone decreased the yellowness in
comparison to the control. It is possible the presence of fiber may enhance the coloring already
present in the surimi gel.
Overall whiteness decreased with the treatments compared to the control. The decrease
seen with fiber was most likely due to low L* and a* values compared to the control. The oil
treatment, although lightness increased, had a large increase in b* resulting in a lower whiteness
value. The fiber/oil treatment showed the lowest (P<0.05) whiteness. This treatment showed the

82
most greenness and yellowness compared to other treatments. As previously mentioned, the
strong yellow pigmentation was likely due to the natural presence of carotenoids in algae oil.
A previous study by Sánchez-Alonso et al. (2007a) used wheat fiber as an additive in
hake and horse mackerel. They found a significant increase (P<0.05) in whiteness in proportion
to the amount of fiber added (0%, 3%, or 6%) in both raw and cooked samples. In another study,
Sánchez-Alonso et al. (2007b) incorporated wheat dietary fiber into giant squid surimi and found
a slight decrease in whiteness from 83.5% with 0% fiber to 79.6% with 6% fiber. The
differences in whiteness with fiber addition are most likely due to the type of fiber and quality of
surimi used in the study. Fiber may have a whitening effect on low quality surimi, whereas it
may detract from the whiteness of high quality surimi.
Texture properties of heat-set surimi gels
Torsion test was used to measure shear stress and shear strain at mechanical fracture of
surimi gels. These measures correspond to gel strength and cohesiveness, respectively (Kim et
al., 2005). Shear stress and shear strain are shown in Figure 7. Shear stress was significantly
higher (P<0.05) than the control for the fiber, oil, and fiber/oil treatments. Shear strain showed
an increase with the addition of fiber and oil separately, however, the fiber/oil treatment was not
significantly different from the control.
The Kramer shear test is another measure of gel strength and is shown in Figure 7.
Kramer shear force increased compared to the control with the separate addition of fiber and oil.
In the fiber/oil treatment, samples showed significantly (P<0.05) greater shear force than the
control, fiber, and oil treatments.
Texture Profile Analysis (TPA) measures various textural parameters: hardness, the peak
height on the first compression that measures a food’s resistance during a bite; springiness, the

83
ratio of product height on the second compression to the original compression distance that
measures the ability of the product to retain its shape and size after one bite; cohesiveness, the
ratio of the second compression area to the first compression area that measures the resistance of
the product during chewing; gumminess, the product of hardness and chewiness that measures
strength required in chewing; chewiness, the product of gumminess and springiness that
measures the energy used in chewing; and resilience, a measure of how well a product regains its
original position, (Cardoso, Mendes, Pedro, & Nunes, 2008). See Table 4 and Figure 7 for TPA
and hardness, respectively. This data shows that oil addition or fiber/oil addition resulted in
treatments with the greatest (P<0.05) springiness, cohesiveness, chewiness, and resilience. Fiber
treatments both alone and with oil showed a decrease in springiness, cohesiveness, and
resilience. However the fiber/oil treatment had significantly greater gumminess and chewiness
than both the fiber treatment and the control. Hardness (shown in Figure 7) followed a trend
similar to Kramer shear force with the fiber/oil treatment having the greatest (P<0.05) hardness
compared to the control, fiber, and oil treatments.
Previous studies of fiber incorporation in surimi show mixed results, with some reporting
a decrease in gel strength and hardness, and others reporting an increase in these measures
(Cardoso et al., 2007; 2008; 2009; Sánchez-Alonso et al., 2007a; 2007b; Yoon, Lee, & Chung,
1987). These results likely vary due to the differences in fiber types used and amount of addition
to surimi. In a study by Sánchez-Alonso et al. (2007a), researchers observed an increase in
hardness with 3% wheat dietary fiber addition when water was not added to maintain constant
moisture. In the present study, water (or water plus oil) addition was constant among all
treatments and additional water was not added to fiber treatments to balance the water-absorbing
capacity of fiber. This may have contributed to the hardness seen with fiber treatments. An

84
unassociated increase in hardness and gel strength was also seen with the oil treatments. In
another study, an increase in hardness and breaking force was seen with 2.5% oil addition to
surimi when compared to a control with no added oil (Pérez-Mateos, Gómez-Guillién, Hurtado,
Solas, & Montero, 2002). Pérez-Mateos et al. (2004) observed a similar increase in shear stress
(which correlates with gel strength) with menhaden oil and marine oil addition to surimi. These
researchers attributed the increase in gel strength to the substitution of oil for the same amount of
water used in that study. Another theory is that oil may occupy the void spaces of the protein
matrix, restraining the protein matrix against movement and possibly interacting with the matrix
to increase gel strength (Dickinson & Chen, 1999; Wu et al., 2009; Yost & Kinsella, 1992).
Differential scanning calorimetry (DSC)
DSC allows for continuous non-destructive monitoring of changes occurring during
heating (Wu, Akahane, Lanier, & Hamann, 1985). Irreversible denaturation of protein is a
necessary step in the process of heat-induced surimi protein gelation. Because surimi has been
washed of sarcoplasmic proteins, the protein components present in the surimi used in this study
are myofibrillar proteins, composed of actin and myosin. These proteins denature at different
temperatures, with the myosin undergoing thermal denaturation at a lower temperature than
actin. Therefore, the first peak in the DSC thermograms (Figure 8) corresponds to myosin
denaturation and the second peak corresponds to actin denaturation (Wright, Leach, & Wilding,
1977). Enthalpy, or ΔH, is the heat change required thermal denaturation. ΔH represents
exothermic reactions, including those associated with disruption of hydrophobic interactions, and
endothermic reactions due to the disruption of hydrogen bonds (Murray, Arntfield, & Ismond,
1985). It is determined by measuring the area under the DSC transition curve.

85
The objective of evaluating DSC in this study was to measure thermal denaturation of
actin and myosin under the influence of powdered cellulose fiber, an omega-3-rich oil blend, and
both fiber and oil together. Surimi pastes were used for the DSC tests. All treatments showed
peak one, associated with myosin denaturation, to occur between 25 and 55°C and peak two,
associated with actin denaturation, to occur between 62 and 77°C. Actin denaturation occurred
at slightly lower temperatures in treatments with oil (oil and fiber/oil) than in the fiber and
control treatments. ΔH for myosin denaturation (not calculated) is much greater than that of
actin denaturation for all treatments, indicating a greater amount of energy required for
denaturation of myosin. Myosin denaturation also showed a much broader peak, which suggests
that thermal denaturation did not occur at one temperature, but over a wide temperature range
(Park & Lanier, 1989). The DSC thermograms show that protein denaturation is not disrupted
with the addition of fiber or oil to surimi pastes. This is important since protein denaturation is
an essential step in protein network formation as it leads to the molecular associations that form
the gel network (Park & Lanier, 1989).
Oscillatory dynamic rheology
Dynamic rheology was used to study heat-induced gelation of myofibrillar proteins.
Rheology is useful in determining textural characteristics of gels as well as chemical
characteristics that contribute to gelation (Hamann & MacDonald, 1992). Viscoelasticity is one
measure of dynamic rheology and is indicated by the elastic modulus, Gʹ. Gʹ is a measure of the
viscous vs. elastic nature of a sample. When Gʹ is equal to zero the sample is entirely viscous in
nature. As a sample becomes more elastic, the value increases. This process occurs in steps: 1)
initiation step characterized by the unfolding of protein molecules, and 2) aggregation step which
results in gel formation via hydrogen bonds, electrostatic bonds, and hydrophobic interactions,

86
usually occurring above 55°C (Yoon, Gunasekaran, & Park, 2004). Dynamic rheology is used in
this study to determine the effect of individual additives (fiber or oil) and the combination of
these additives (fiber with oil) on gelation curves.
In the present study, all treatments had the same general effect on elastic modulus (Gʹ),
with an increase beginning around 45°C and continuing until about 85 to 90°C (see Figure 9). In
a study by Yoon et al. (2004), the minimum temperature of increase in viscoelasticity
corresponds to the beginning of intermolecular disulphide covalent bonding, with the maximum
temperature at approximately 74°C indicating completion of most covalent bonding in Alaska
Pollock and Pacific Whiting surimi. The rate and amount of increase in elastic modulus varied
with each treatment in the current study. Although both the fiber treatment and the oil treatment
resulted in increased elastic modulus over the control (fiber more so than oil), the fiber/oil
treatment had a much larger final elastic modulus at 90°C as well as a greater rate of increase in
elastic modulus between 55°C and 90°C. This large increase in elastic modulus is greater than
the summation of the elastic modulus for the separate fiber and oil treatments, possibly
suggesting an interaction between fiber, oil, and myofibrillar protein of surimi that resulted in
increased viscoelasticity.
Previous studies have shown both fiber and oil to have distinct effects on myofibrillar
protein gelation and network formation that result in increased viscoelasticity. The effects seen
with fiber may be attributed to moisture distribution in the surimi gels. Powdered cellulose in
the sample used has a water holding capacity of 9.5 g water/g fiber. This draws some moisture
away from the protein portion of the surimi sol resulting in more concentrated myofibrillar
proteins. In support of this theory, Sánchez-González et al. (2009) used wheat dietary fiber as an
additive in Alaska Pollock surimi and found that the fiber absorbed moisture from the gel,

87
increasing the moisture in the fiber portion of the gel. They also noted an increase in β-sheet
formation with increased fiber concentration (6% fiber) which may have been caused by the
dehydration effect of the fiber on the protein, leading to increased protein aggregation and
formation of β-sheets as opposed to α-helices. This is beneficial to gel strength as increased β-
sheet formation is directly correlated with higher elasticity and possibly indicates a more regular
arrangement of the protein network (Niwa & Nakajima, 1975; Sánchez-González et al., 2009).
A similar increase in viscoelasticity with oil addition to Alaska Pollock surimi was
observed in another study (Pietrowski et al., 2012). The unsaturated nature of omega-3 fatty
acids may contribute this beneficial effect as Wu et al. (2009) observed that unsaturated fatty
acids are more structurally flexible than saturated fatty acids and are able to interact more
strongly with proteins at the oil/water interface. Yost & Kinsella (1992) also observed that
unsaturated fats occupied the outer surface of the butterfat droplet and associated with dialyzed
whey protein isolate more than saturated fat, which were found in the center of the fat droplets.
Wu et al. (2009) observed a distinct membrane around fat globules in porcine myofibrillar
protein and reported that the membrane was most likely comprised of proteins, suggesting that
fat globules can behave as interactive fillers. Dickinson & Chen (1999) described active fillers
as compounds that have a strong interaction with the gel matrix, mechanically reinforcing the
protein network and increasing gel strength. They also observed that oil droplets behave
strongly as active filler in whey protein emulsion gels via integration into the gel matrix through
chemical and physical interactions both with protein on different oil droplets and between
protein of the gel matrix and protein monolayers at the droplet surface. Yost & Kinsella (1992)
similarly observed that the majority of fat globules were covered with protein aggregates and that
clumps or strands of protein aggregates projected from fat droplets and linked them to the protein

88
matrix. They found pre-emulsified fat droplets to behave as active fillers that increase gel
strength since smaller fat droplets increase the area available for protein adsorption and
integration into the gel microstructure upon heating (Yost & Kinsella, 1992).
Although no studies have assessed the viscoelastic fiber-oil interaction in surimi, the
nature of these additives lends to possible theories. Powdered cellulose is porous in nature,
allowing it to retain both water and oil (Ang, 1991; 1993). Although the oil retention capacity of
powdered cellulose is less than that for water, Ang & Miller (1991) found that powdered
cellulose of 110 microns in length (the length used in this study) could retain up to 8 g oil/g
powdered cellulose. This explains how fiber may associate with oil in surimi gels and thereby be
incorporated into the protein matrix. In addition, there is a possibility that fiber-fat complexes
may form at elevated temperatures, such as during frying (Ang, 1993). The temperatures in this
study are much lower than potential frying temperatures; however, the minimum temperature
required for fiber-fat complex formation is not known. The addition of oil in place of water may
also have a further dehydrating effect on surimi gels. The adsorption and association of protein
with oil droplets may decrease the volume of oil that can associate with fiber. Also, as less water
is used in the formulation of treatments with added oil, fiber may be able to bind a higher percent
of total water used resulting in a lower moisture content of the myofibrillar protein portion of
surimi gels. This dehydration would cause a decrease in protein-water interaction, resulting in
increased β-sheet formation and a subsequent increase in elasticity possible more regular
arrangement of the protein network (Niwa & Nakajima, 1975; Sánchez-Gonzalez et al., 2008;
2009). The combined effect of greater β-sheet formation and enhanced structural stability due to
the oil-protein network may explain the elevated viscoelasticity seen in this study.

89
Conclusion
Powdered cellulose fiber and omega-3-rich oils improve both textural and rheological
characteristic of surimi gels. With the combined addition of these additives, a large increase was
seen in viscoelasticity that was not seen with fiber and oil when added separately. This indicates
greater protein network formation and suggests a possible interaction among fiber, oil, and
myofibrillar proteins. This increase in viscoelasticity was reflected in textural properties of heat-
set gels, such as hardness and Kramer shear force. Although color properties were negatively
affected with the addition of oil, mainly by increased yellowness (+b*), this may be overcome by
addition of whitening agents or possibly by further homogenizing or emulsifying the oil with
water or another substance to disperse the color pigments. Overall, this study suggests that fiber
and oil may be used together as additives in surimi seafood to create a product with improved
textural properties. These results are promising for possible future manufacturing and marketing
of surimi seafood with added heart-health benefits, especially when taking into consideration the
increased popularity of functional/nutraceutical foods. Although results are promising, sensory
evaluation is recommended to assess consumer acceptance of the product.
References
Anderson, B. M., & Ma, D. W. L. (2009). Are all n-3 polyunsaturated fatty acids created equal?
Lipids in Health and Disease, 8, 33.
Anderson, J. W., Baird, P., Davis, R. H., Ferreri, S., Knudtson, M., Koraym, A., Waters, V., &
Williams, C. L. (2009). Health benefits of dietary fiber. Nutrition Reviews, 67(4), 188-
205. doi:10.1111/J.1753-4887.2009.00189.x
Ang, J. F. (1991). Water retention capacity and viscosity effect of powdered cellulose. Journal of
Food Science, 56(6), 1682-1684.

90
Ang, J. F., (1993). Reduction of fat in fried batter coatings with powdered cellulose. Journal of
the American Oil Chemists’ Society, 70(6), 619-622.
Ang, J. F., & Miller, W. B. (1991). Multiple functions of powdered cellulose as a food
ingredient. Cereal Foods World, 36(7), 558-564.
Appel, L. J., Frohlich, E. D., Hall, J. E., Pearson, T. A., Sacco, R. L., Seals, D. R., Sacks, F. M.,
Smith, S. C., Vafiadis, D. K., & Van Horn, L. V. (2011). The importance of population-
wide sodium reduction as a means to prevent cardiovascular disease and stroke: A call to
action from the American Heart Association. Circulation, 123, 1138-1143.
Arterburn, L. M., Oken, H. A., Hall, E. B., Hamersley, J., Kuratko, C. N., & Hoffman, J. P.
(2008). Algal-oil capsules and cooked salmon: nutritionally equivalent sources of
docosahexaenoic acid. Journal of the American Dietetic Association, 108, 1204-1209.
Association of Official Analytical Chemists. (1995). Official Methods of Analysis. (16th ed).
Washington, DC: Association of Official Analytical Chemists.
Bodner, J. M., & Sieg, J. (2009). Fiber. In R. Tarté (ed.), Ingredients in meat products:
Properties, functionality and applications (pp. 83-108). Springer Science + Business
Media, LLC. doi:10.1007/978-0-387-71327-4_4. Retrieved January 25, 2012, from
http://powderedcellulose.com/wp-content/themes/agency-sweetener-supply-
pc/images/fiber-properties-functionality-applications.pdf.
Buyck, J. F., Blacher, J., Kesse-Guyot, E., Castetbon, K., Galan, P., Safar, M. E., Hercberg, S., &
Czernichow, S. (2009). Differential associations of dietary sodium and potassium intake
with blood pressure: A focus on pulse pressure. Journal of Hypertension, 27, 1158-1164.
Calder, P. C., & Yaqoob, P. (2009). Omega-3 polyunsaturated fatty acids and human health
outcomes. BioFactors, 53(3), 266-272.
Candela, C. G., López, L. M. B., & Kohen, V. L. (2011). Importance of a balanced omega
6/omega 3 ratio for the maintenance of health. Nutritional implications. Nutrición
Hospitalaria, 26(2), 323-329.
Cardoso, C., Mendes, R., & Nunes, M. L. (2007). Effect of transglutaminase and carrageenan on
restructured fish products containing dietary fibres. International Journal of Food
Science and Technology, 42, 1257-1264. doi:10.1111/j.1365-2621.2006.01231.x
Cardoso, C., Mendes, R., Pedro, S., & Nunes, M. L. (2008). Quality changes during storage of
fish sausages containing dietary fiber. Journal of Aquatic Food Product Technology,
17(1), 73-95.
Cardoso, C., Mendes, R., Vaz-Pires, P., & Nunes, M. L. (2009). Effect of dietary fibre and
MTGase on the quality of mackerel surimi gels. Journal of the Science of Food and
Agriculture, 89, 1648-1658. doi:10.1002/jsfa.3636

91
Chen, Y. C., & Jaczynski, J. (2007a). Gelation of protein recovered from Antarctic krill
(Euphausia superb) by isoelectric solubilization/precipitation as affected by function
additives. Journal of Agricultural and Food Chemistry, 55, 1814-1822.
Chen, Y. C., & Jaczynski, J. (2007b). Protein recovery from rainbow trout (Oncorhynchus
mykiss) processing by-products via isoelectric solubilization/precipitation and its gelation
properties as affected by functional additives. Journal of Agricultural and Food
Chemistry, 55, 9079-9088.
Cheret, R., Chapleau, N., Delbarre-Ladrat, C., Verrez-Bagnis, V., & Lamballerie, M. D. (2005).
Effects of high pressure on texture and microstructure of sea bass (Dicentrarchus labrax
L.) fillets. Journal of Food Science, 70, E477-E483.
Dickinson, E., & Chen, J. (1999). Heat-set whey protein emulsion gels: role of active and
interactive filler particles. Journal of Dispersion Science and Technology, 20(1&2), 197-
213.
Dietary Guidelines Advisory Committee. (2010). Report of the dietary guidelines advisory
committee on the dietary guidelines for Americans, 2010, to the secretary of Agriculture
and the Secretary of Health and Human Services. Washington, DC: Government printing
office. Retrieved from
http://www.cnpp.usda.gov/Publications/DietaryGuidelines/2010/PolicyDoc/PolicyDoc.pd
f
Freud, R. J., & Wilson, W. J. (1997). Design of experiments. San Diego (CA): Academic Press.
p. 464.
Gigliotti, J. C., Davenport, M. P., Beamer, S. K., Tou, J. C., & Jaczynski, J. (2011). Extraction
and characterisation of lipids from Antarctic krill (Euphausia superba). Food Chemistry,
125, 1028-1036.
Gogus, U., & Smith, C. (2010). n-3 omega fatty acids: a review of current knowledge.
International Journal of Food Science & Technology, 45, 417-436.
Hamann, D. D., & MacDonald, G. A. (1992). Rheology and textural properties of surimi and
surimi-based foods. In T. C. Lanier & C. M. Lee (Eds.), Surimi Technology (pp. 429-
500), New York, NY: Marcel Dekker, Inc.
Institute of Medicine. (2005) Dietary reference intakes for energy, carbohydrate, fiber, fat, fatty
acids, cholesterol, protein, and amino acids (macronutrients). National Academy Press,
Washington, DC.
Jaczynski, J., & Park, J. W. (2003). Microbial inactivation and electron penetration in surimi
seafood during electron beam processing. Journal of Food Science, 68(5), 1788-1792.

92
Jaczynski, J., & Park, J. W. (2004). Physiochemical changes in Alaska Pollock surimi and
surimi gel as affected by electron beam. Journal of Food Science, 69(1), 53-57.
Juturu, V. (2008). Omega-3 fatty acids and the cardiometabolic syndrome. Journal of the
Cardiometabolic Syndrome, 3, 244-253.
Kim, B. Y., Park, J. W., & Yoon, W. B. (2005). Rheology and texture properties of surimi gels.
In J.W. Park (Ed.), Surimi and surimi seafood 2nd
ed. (pp. 491-582), Boca Raton, FL:
Taylor and Francis Group.
Krauss, R. M., Eckel, R. H., Howard, B., Appel, L. J., Daniels, S. R., Deckelbaum, R. J.,
Erdman, J. W., Kris-Etherton, P., Goldberg, I. J., Kotchen, T. A., Lichtenstein, A. H.,
Mitch, W. E., Mullis, R., Robinson, K., Wylie-Rosett, J., St. Jeor, S., Suttie, J., Tribble,
D. L., Bazzarre, T. L. (2000). AHA dietary guidelines: revision 2000: a statement for
healthcare professionals from the nutrition committee of the American Heart Association.
Stroke, 31, 2751-2766.
Kris-Etherton, P. M., Grieger, J. A., & Etherton, T. D. (2009). Dietary reference intakes for DHA
and EPA. Prostaglandins, Leukotrienes and Essential Fatty Acids, 81, 99-104.
Kristinsson, H. G., Theodore, A. E., Demir, N., & Ingadottir, B. (2005). A comparative study
between acid- and alkali-aided processing and surimi processing for the recovery of
proteins from channel catfish muscle. Journal of Food Science, 70, C298-C306.
Lloyd-Jones, D., Adams, R. J., Brown, T. M., Carnethon, M., Dai, S., De Simone, G., Ferguson,
T. B., Ford, E., Furie, K., Gillepsie, C., Go, A., Greenlund, K., Haase, N., Hailpern, S.,
Ho, P. M., Howard, V., Kissela, B., Kittner, S., Lackland, D., Lisabeth, L., Marelli, A.,
McDermott, M. M., Meigs, J., Mozaffarian, D., Mussolino, M., Nichol, G., Roger, V. L.,
Rosamond, W., Sacco, R., Sorlie, P., Stafford, R., Thom, T., Wasserthiel-Smoller, S.,
Wong, N. D., Wylie-Rosett, J. (2010). Heart disease and stroke statistics – 2010 update: a
report from the American heart association. Circulation, 121, e46-e215.
Moretti, V. M., Mentasti, T., Bellagamba, F., Luzzana, U., Caprino, F., Turchini, G. M., Giani,
I., & Valfre, F. (2006). Determination of astaxanthin stereoisomers and colour attributes
in flesh of rainbow trout (Oncorhynchus mykiss) as a tool to distinguish the dietary
pigment source. Food Additives and Contaminants, 23(11), 1056-1063.
Mozaffarian, D., & Wu, J. H. Y. (2011). Omega-3 fatty acids and cardiovascular disease.
Journal of the American College of Cardiology, 58(20), 2047-2067.
Murray, E. D., Arntfield, S. D., & Ismond, M. A. H. (1985). The influence of processing
parameters on food protein functionality II. Factors affecting thermal properties as
analyzed by differential scanning calorimetry. Canadian Institute of Food Science and
Technology Journal, 18(2), 158-162.

93
Nair, S. S. D., Leitch, J. W., Falconder, J., & Garg, M. L. (1997). Prevention of cardiac
arrhythmia by dietary (n-3) polyunsaturated fatty acids and their mechanism of action.
Journal of Nutrition, 127, 383-393.
Narayan, B., Miyashita, K., & Hosakawa, M. (2006). Physiological effects of eicosapentaenoic
acid (EPA) and docosahexaenoic acid (DHA) – a review. Food Reviews International,
22, 291-307.
National Fisheries Institute. (1991). A manual of standard methods for measuring and specifying
the properties of surimi. Washington (D.C.): National Fisheries Institute.
Nitsan, Z., Mokady, S., & Sukenik, A. (1999). Enrichment of poultry products with ω3 fatty
acids by dietary supplementation with the alga Nannochloropsis and mantur oil. Journal
of Agricultural and Food Chemistry, 47, 5127-5132.
Niwa, E., & Nakajima, G. (1975). Differences in protein structure between elastic kamaboko and
brittle one. Nippon Suisan Gakkaishi, 41, 579.
Park, J. W. (2005). Ingredient technology for surimi and surimi seafood. In J. W. Park, Surimi
and Surimi Seafood, 2nd
, ed. (p 649-707). Boca Raton (FL): Taylor and Francis Group.
Park, J. W., & Lanier, T. C. (1989). Scanning calorimetric behavior of tilapia myosin and actin
due to processing of muscle and protein purification. Journal of Food Science, 54, 49-51.
Park, Y., Kelleher S. D., McClements, D. J., & Decker, E. A. (2004). Incorporation and
stabilization of omega-3 fatty acids in surimi made from cod, Gadus morhua. Journal of
Agricultural and Food Chemistry, 52, 597-601.
Pérez-Mateos, M., Gómez-Guillién, M. C., Hurtado, J. L., Solas, M. T., & Montero, P. (2002).
The effect of rosemary extract and omega-3 unsaturated fatty acids on the properties of
gels made from the flesh of mackerel (Scomber scombrus) by high pressure and heat
treatments. Food Chemistry, 79, 1-8.
Pérez-Mateos, M., Boyd, L. C., & Lanier, T. C. (2004). Stability of omega-3 fatty acids in
fortified surimi seafoods during chilled storage. Journal of Agricultural and Food
Chemistry, 55, 7944-7949.
Pérez-Mateos, M., Lanier, T. C., & Boyd, L. C. (2006). Effects of rosemary and green tea
extracts on frozen surimi gels fortified with omega-3 fatty acids. Journal of the Science of
Food and Agriculture, 86, 558-567.
Pietrowski, B. N., Tahergorabi, R., Matak, K. E., Tou, J. C., & Jaczynski, J. (2011). Chemical
properties of surimi seafood nutrified with ω-3 rich oils. Food Chemistry, 129, 912-919.

94
Pietrowski, B. N., Tahergorabi, R., Jaczynski, J. (2012). Dynamic rheology ant thermal
transitions of surimi seafood enhanced with ω-3-rich oils. Food Hydrocolloids, 27, 384-
389.
Prosky, L. (2000) When is dietary fiber considered a functional food? BioFactors, 12, 289-297.
Psota, P. L., Gebauer, S. K., & Kris-Etherton, P. (2006). Dietary omega-3 fatty acid intake and
cardiovascular risk. American Journal of Cardiology, 98 (suppl), 3i-18i.
Sánchez-Alonso, I., Haji-Maleki, R., & Borderias, A. J. (2007a). Wheat fiber as a functional
ingredient in restructured fish products. Food Chemistry, 100, 1037-1043.
doi:10.1016/j.foodchem.2005.09.090
Sánchez-Alonso, I., Solas, M. T., & Borderías, A. J. (2007b) Technological implications of
addition of wheat dietary fibre to giant squid (Dosidicus gigas) surimi gels. Journal of
Food Engineering, 81, 404-411. doi:10.1016/j.jfoodeng.2006.11.015
Sánchez-González, I., Rodríguez-Casado, A., Careche, M., & Carmona, P. (2009). Raman
analysis of surimi gelation by addition of wheat dietary fibre. Food Chemistry, 112, 162-
168.
Sánchez-Gonzalez, I., Carmona, P., Moreno, P., Borderías, J., Sánchez-Alonso, I., Rodríguez-
Casado, A., & Careche, M. (2008). Protein and water structural changes in fish surimi
during gelation as revealed by isotropic H/D exchange and Raman spectroscopy. Food
Chemistry, 106, 56-64.
SAS Institute. (2002). SAS/STAT guide for personal computers, version 8.1. Cary (NC): SAS
Institute.
Siró, I., Kápolna, E., Kápolna, B., & Lugasi, A. (2008). Functional food. Product development,
marketing and consumer acceptance – a review. Appetite, 51, 456-467.
Tahergorabi, R., Beamer, S. K., Matak, K. E., & Jaczynski, J. (2011). Effect of isoelectric
solubilization/precipitation and titanium dioxide on whitening and texture of proteins
recovered from dark chicken-meat processing by-products. LWT – Food Science and
Technology, 44(4), 896-903.
Tahergorabi, R., Jaczynski, J. (2012). Physiochemical changes in surimi with salt substitute.
Food Chemistry, 132, 1281-1286.
Taskaya, L., Chen, Y. C., Beamer, S., & Jaczynski, J. (2009). Texture and colour properties of
proteins recovered from whole gutted silver carp (Hypophthalmichthys molitrix) using
isoelectric solubilisation / precipitation. Journal of the Science of Food and Agriculture,
89(2), 349-358.

95
Tou, J. C., Jaczynski, J., & Chen, Y. C. (2007). Krill for human consumption: nutritional value
and potential health benefits. Nutrition Reviews, 65(2), 63-77.
World Health Organization. (2003). Diet, Nutrition, and the Prevention of Chronic Diseases.
Geneva: World Health Organization, 2003. Technical report No. 916.
Wright, D. J., Leach, I. B. & Wilding, P. (1977). Differential scanning calorimetric studies of
muscle and its constituent proteins. Journal of the Science of Food and Agriculture, 28,
557-564.
Wu, M. C., Akahane, T., Lanier, T. C., & Hamann, D. D. (1985). Thermal transitions of
actomyosin and surimi prepared from Atlantic croaker as studied by differential scanning
calorimetry. Journal of Food Science, 50, 10-13.
Wu, M., Youling, L., Xiong, Y. L., Chen, J., Tang, X., Zhou, G. (2009). Rheological and
microstructural properties of porcine myofibrillar protein – lipid emulsion composite
gels. Journal of Food Science, 74(4), e207-e217.
Yongsawatdigul, J., & Park, J. W. (2004). Effects of alkali and acid solubilization on gelation
characteristics of rockfish muscle proteins. Journal of Food Science, 69, 499-505.
Yoon, K., Lee, C. M., & Chung, K. H. (1987, November). Effect of powdered cellulose on the
texture and water binding properties of surimi-based products. 1st Joint Conference of
Tropical and Subtropical Fisheries Technology and Atlantic Fisheries Technology,
Orlando, FL. Retrieved from http://fshn.ifas.ufl.edu/seafood/sst/AnnPdf/12th_516.pdf
Yoon, W. B., Gunasekaran, S., & Park, J. W. (2004). Characterization of thermorheological
behavior of Alaska Pollock and pacific whiting surimi. Journal of Food Science, 69(7),
E338-E343.
Yost, R. A., & Kinsella, J. E. (1992). Microstructre of whey protein isolate gels containing
emulsified butterfat droplets. Journal of Food Science, 57(4), 892-897.
Zhao, G., Etherton, T. D., Martin, K. R., West, S. G., Gillies, P. J., & Kris-Etherton, P. M.
(2004). Dietary α-linolenic acid reduces inflammatory and lipid cardiovascular factors in
hypercholesterolemic men and women. The Journal of Nutrition, 134, 2991-2997.

96
TABLES 1
2
Table 1. Final surimi batter formulations. Batters with different levels of fiber were formulated to contain 78% moisture and equal 3
amount of protein, water, salt, and water-based crab flavor by using inert filler, silicon dioxide (SiO2). Batch size was 1000g . 4
5
6
7
8
9
10
11
12
13
14
15
Fiber (g/1000 g)
Filler – SiO2 (g/1000 g)
Surimi (g/1000 g)
Water (g/1000 g)
Salt (g/1000g)
Crab flavor (g/1000 g)
Batch weight (g)
0.0 (control) 80.0 480.0 400.0 20.0 20.0 1000.0
20.0 60.0 480.0 400.0 20.0 20.0 1000.0
40.0 40.0 480.0 400.0 20.0 20.0 1000.0
60.0 20.0 480.0 400.0 20.0 20.0 1000.0
80.0 0.0 480.0 400.0 20.0 20.0 1000.0
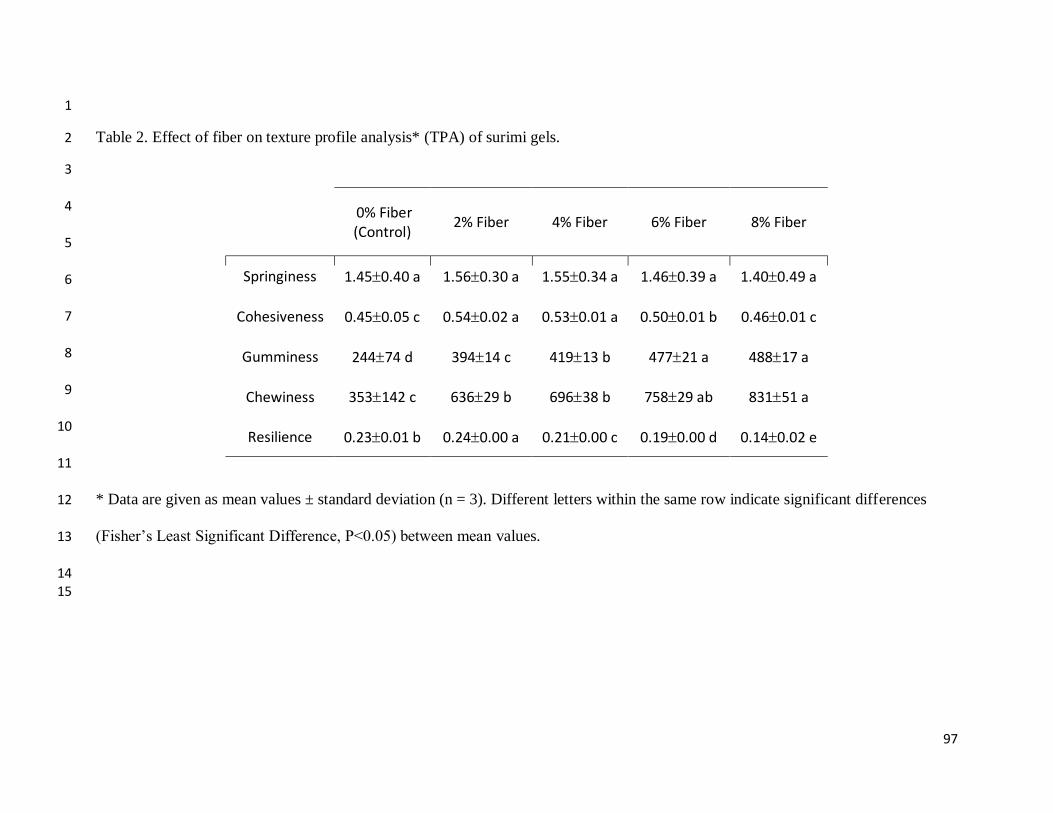
97
1
Table 2. Effect of fiber on texture profile analysis* (TPA) of surimi gels. 2
3
4
5
6
7
8
9
10
11
* Data are given as mean values ± standard deviation (n = 3). Different letters within the same row indicate significant differences 12
(Fisher’s Least Significant Difference, P<0.05) between mean values. 13
14 15
0% Fiber (Control)
2% Fiber 4% Fiber 6% Fiber 8% Fiber
Springiness 1.450.40 a 1.560.30 a 1.550.34 a 1.460.39 a 1.400.49 a
Cohesiveness 0.450.05 c 0.540.02 a 0.530.01 a 0.500.01 b 0.460.01 c
Gumminess 24474 d 39414 c 41913 b 47721 a 48817 a
Chewiness 353142 c 63629 b 69638 b 75829 ab 83151 a
Resilience 0.230.01 b 0.240.00 a 0.210.00 c 0.190.00 d 0.140.02 e

98
1
Table 3. Final surimi batter formulations. Batters were formulated to contain equal amount of protein (i.e., surimi) and salt substitute. 2
Silicon dioxide (SiO2) was used as inert filler in place of fiber. Oil replaced water at 1:1 ratio. Batch size was 1000g. 3
4
5
6
7
8
9
10
11
12
13
Treatment name
Surimi (g/1000 g)
Water (g/1000 g)
Salt substitute (g/1000g)
Fiber (g/1000 g)
Oil (g/1000g)
Filler – SiO2 (g/1000 g)
Batch weight (g)
Control 540.0 372.0 28.0 0.0 0.0 60.0 1000.0
Fiber 540.0 372.0 28.0 60.0 0.0 0.0 1000.0
Oil 540.0 272.0 28.0 0.0 100.0 60.0 1000.0
Fiber + Oil 540.0 272.0 28.0 60.0 100.0 0.0 1000.0

99
1
Table 4. Effect of nutraceutical additives on texture profile analysis* (TPA) of surimi gels. 2
3
Control Fiber Oil Fiber + Oil
Springiness 1.550.34 b 1.260.46 c 2.050.01 a 1.610.23 b
Cohesiveness 0.5650.035 b 0.5430.009 c 0.6180.012 a 0.5470.007 c
Gumminess 38449 c 53046 b 53326 b 62817 a
Chewiness 594142 b 658247 b 109153 a 986149 a
Resilience 0.2940.019 b 0.2160.005 c 0.3390.006 a 0.2230.003 bc
4
* Data are given as mean values ± standard deviation (n = 3). Different letters within the same row indicate significant differences 5
(Fisher’s Least Significant Difference, P<0.05) between mean values. 6
7
8
9

100
FIGURES 1
2 Figure 1. Effect of fiber on whiteness values* (top) and color properties* (bottom) of surimi gels. 3
4
* Data are given as mean values standard deviation (SD, n = 3). Small bars of the top of data 5
bars in the figure (top) indicate SD. Different letters on the top of SD bars indicate significant 6
differences (Fisher’s Least Significant Difference, P < 0.05) between mean values. Different 7
letters within the same row in the table (bottom) indicate significant differences (Fisher’s Least 8
Significant Difference, P<0.05) between mean values. 9
10

101
1
2
Figure 2. Effect of fiber on torsion shear stress and strain* at mechanical fracture of surimi gels (● – shear stress; ○ – shear strain). 3
* Data are given as mean values ± standard deviation (SD, n = 3). Bars on data points indicate SD. Different letters on the top of SD 4
bars indicate significant differences (Fisher’s Least Significant Difference test, P < 0.05). 5

102
1
Figure 3. Effect of fiber on Kramer shear force* (top) and hardness* (bottom) of surimi gels. 2
* Data are given as mean values standard deviation (SD, n = 3). Small bars of the top of data 3
bars indicate SD. Different letters on the top of SD bars indicate significant differences (Fisher’s 4
Least Significant Difference, P < 0.05) between mean values. 5

103
Figure 4. Average (n = 3) elastic moduli (G’, top graph) and differential scanning calorimetry
(DSC) thermograms (bottom graph) of surimi pastes with different levels of added fiber.

104
Figure 5. Effect of nutraceutical additives on whiteness values* (top) and color properties*
(bottom) of surimi gels.
* Data are given as mean values standard deviation (SD, n = 3). Small bars of the top of data
bars in the figure (top) indicate SD. Different letters on the top of SD bars indicate significant
differences (Fisher’s Least Significant Difference, P < 0.05) between mean values. Different
letters within the same row in the table (bottom) indicate significant differences (Fisher’s Least
Significant Difference, P<0.05) between mean values.
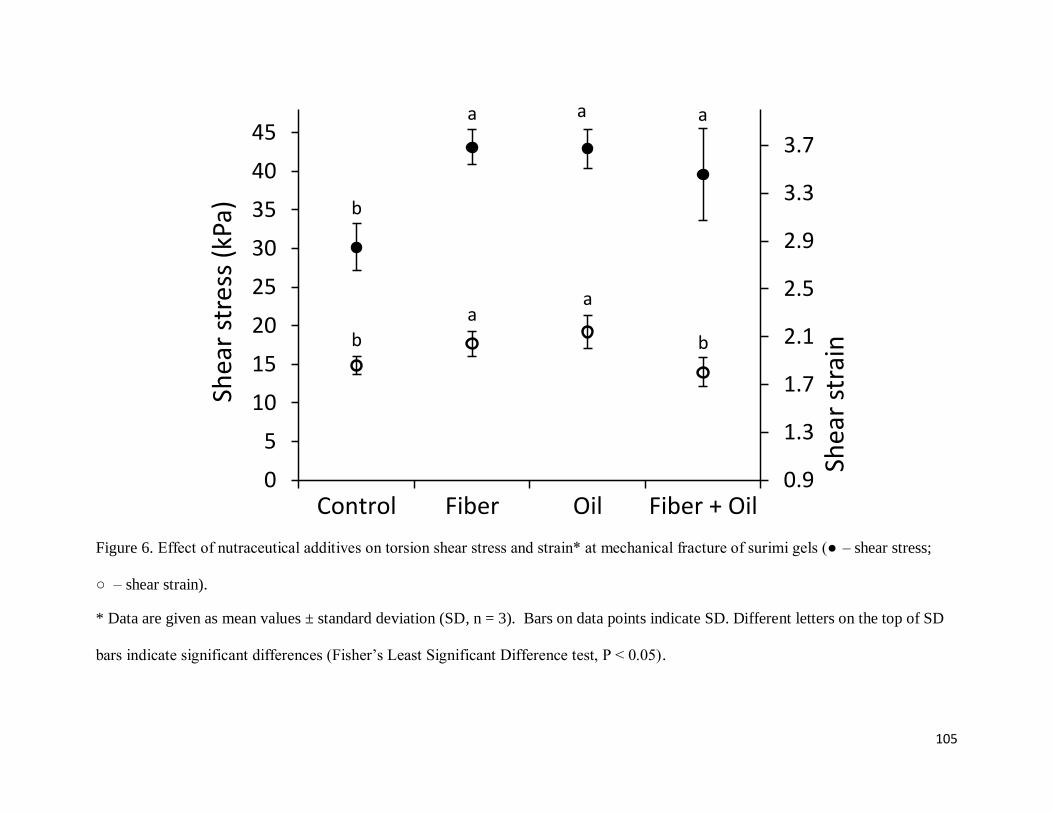
105
b
a a a
b
aa
b
0.9
1.3
1.7
2.1
2.5
2.9
3.3
3.7
0
5
10
15
20
25
30
35
40
45
Control Fiber Oil Fiber + Oil
Shea
r st
rain
Shea
r st
ress
(kP
a)
* Data are given as mean values ± standard deviation (SD, n = 3). Bars on data points indicate SD. Different letters on the top of SD
bars indicate significant differences (Fisher’s Least Significant Difference test, P < 0.05).
Figure 6. Effect of nutraceutical additives on torsion shear stress and strain* at mechanical fracture of surimi gels (● – shear stress;
○ – shear strain).

106
Figure 7. Effect of nutraceutical additives on Kramer shear force* (top) and hardness* (bottom)
of surimi gels.
* Data are given as mean values standard deviation (SD, n = 3). Small bars of the top of data
bars indicate SD. Different letters on the top of SD bars indicate significant differences (Fisher’s
Least Significant Difference, P < 0.05) between mean values.

107
Figure 8. Average (n = 3) differential scanning calorimetry (DSC) thermograms of surimi pastes with added nutraceutical additives.

108
Figure 9. Average (n = 3) elastic moduli (G’) of surimi pastes with added nutraceutical additives.