Physicochemical and Biopharmaceutical Characterisation of ...164113/FULLTEXT01.pdf ·...
62
Physicochemical and Biopharmaceutical Characterisation of Small Drug Molecules by Capillary Electrophoresis BY EIVOR ÖRNSKOV ACTA UNIVERSITATIS UPSALIENSIS UPPSALA 2004 Comprehensive Summaries of Uppsala Dissertations from the Faculty of Science and Technology 947
Transcript of Physicochemical and Biopharmaceutical Characterisation of ...164113/FULLTEXT01.pdf ·...
Physicochemical andBiopharmaceutical Characterisation
of Small Drug Molecules by Capillary Electrophoresis
BY
EIVOR ÖRNSKOV
ACTA UNIVERSITATIS UPSALIENSISUPPSALA 2004
Comprehensive Summaries of Uppsala Dissertationsfrom the Faculty of Science and Technology 947


Till Lars

List of papers
This thesis is based on following papers that are referred to by Roman numerals (I-VI) in the body of this document:
I. Determination of dissociation constants of labile drug compounds by capillary electrophoresis. Eivor Örnskov, Anna Linusson, Staffan Folestad. Journal of Pharmaceutical and Biomedical Analysis, 33, (2003), p. 379-391.
II. Statistical molecular design, parallel synthesis and biological evaluation of a library of thrombin inhibitors. Anna Linusson, Johan Gottfries, Thomas Olsson, Eivor Örnskov, Staffan Folestad, Bengt Nordén, Svante Wold. Journal of Medicinal Chemistry, 44, (2001), p. 3424-3439.
III. Experimental modelling of passive drug absorption by capillary electrophoresis using liposomal, micellar and microemulsion electrolytes. Eivor Örnskov, Johan Gottfries, Magnus Erickson, Staffan Folestad. Submitted to Journal of Pharmacy & Pharmacology.
IV. Method for immobilization of liposomes in capillary electrophoresis by electrostatic interaction with derivatized agarose. Eivor Örnskov, Sara Ullsten, Lennart Söderberg, Karin E. Markides, Staffan Folestad. Electrophoresis, 23, 19 (2002), p. 3381-3384.
V. Immobilised-liposome capillary electrophoresis – online mass spectrometry for biopharmaceutical drug profiling. Sara Ullsten, Eivor Örnskov, Per Sjöberg, Katarina Edwards, Göran Karlsson, Karin E. Markides, Staffan Folestad.Manuscript
VI. Hierarchical multivariate modelling and prediction of MEKC migration using analyte and micellar media molecular descriptors. Eivor Örnskov, Anna Linusson, Erik Johansson, Staffan Folestad.Submitted to Electrophoresis.
Reprints were made with kind permission from the publishers.

Contents
1 Introduction to drug characterisation by capillary electrophoresis.....1
2 Capillary electrophoresis (CE) ...........................................................52.1 Theory and instrumentation .........................................................5
3 Characterisation of drug acid-base properties by CE .......................103.1 Theory for determination of pKa from migration data ...............113.2 Determination of pKa for labile drug compounds ......................15
4 Characterisation of drug lipophilicity properties by CE...................204.1 Stationary and pseudostationary phases .....................................214.2 Theory for determination of lipophilicity from migration data..234.3 Determination of lipophilicity properties by CE........................26
5 Modelling of drug compound passive intestinal absorption using CE data ...................................................................................................31
5.1 Drug absorption..........................................................................315.2 Modelling and prediction by CE using liposomes, vesicles,
micelles and microemulsions .....................................................35
6 Modelling drug-electrolyte interactions in CE using molecular descriptors.........................................................................................37
6.1 Molecular descriptors .................................................................376.2 Chemometric modelling .............................................................396.3 Prediction of migration from molecular descriptors ..................40
7 Concluding remarks and future work ...............................................42
8 Acknowledgements ..........................................................................43
9 Swedish summary.............................................................................44
10 Abbreviations, acronyms and terms .................................................47
11 Symbols ............................................................................................48
12 References ........................................................................................50

1
1 Introduction to drug characterisation by capillary electrophoresis
Development of new medicines is a time-consuming process that can take decades. Figure 1 illustrates main steps from an idea to a drug product include drug discovery, drug development and the product launch and marketing.
Figure 1. The R&D process of a new drug (redrawn with permission from AstraZeneca Sweden). * Investigational new drug application for permission to administer a new drug to humans. ** New drug application, application for permission to market a new drug.
The drug discovery process starts with the identification of a biological target and ends with a selection of one or a few candidate drugs that will be tested on humans. A biological target is usually a protein such as a receptor, an enzyme or an ion channel. During drug discovery, the choice of a biological target naturally depends on the possibility that modulation of the target will lead to a disease treatment. After identification of the biological
Preclinical studies Clinical studies
CHEMISTRY/
PHARMA-
COLOGY
IND* PHASE I PHASE II PHASE III NDA** PHASE IV
Search for
active
substances
Toxicology,
efficacy
studies on
various types
of animals
Regulatory
review
Efficacy
studies on
healthy
volunteers
Clinical
studies on a
limited scale
Comparative
studies on a
large number
of patients
Regulatory
review
Continued
comparative
studies
50–150
persons
100–200
patients500–5,000
patients
Registration,
market
introduction
KNOWLEDGE
LEVEL
KNOWLEDGE
LEVEL
Discovery Development

2
target, drug discovery comprises hit identification, lead identification and lead optimisation; see Figure 2.
Figure 2. Drug discovery.
An identified hit is a molecule that has shown biological activity in an animal or a human or has displayed activity against a biological target in a high throughput-screening (HTS) assay. A lead is a series of hit molecules that have features that can be modified to optimise pharmacological properties of the molecule. Lead molecules can be found by investigating natural products and compounds synthesised in industrial and university laboratories. Lead molecules can also be synthesised using highly automated systems that produce many compounds but a small amount of each compound.
The lead optimisation phase is started when lead molecules demonstrate biological activity and have modifiable structural elements. Often, lead optimisation is a more time-consuming step (about 2.5 years) in contrast to lead identification and hit identification (about 18 months together). During the lead optimisation phase, many new compounds are synthesised. Compared to traditional sequential synthesis, use of highly automated synthesis systems – together with combinatorial chemistry – has enhanced the number of synthesised compounds, while it has decreased the amount of each compound that is synthesised. This phase stops with identification of a selection of one or a few candidate drugs that can be tested on humans.
Successful drug development requires optimisation of the pharmacological activity of the drug compound at the target site and the delivery to that site. Oral administration is usually the preferred administration route for a drug compound because of its ease of use and patient compliance. Opportunities to use oral administration depend on the drug compound bioavailability, that is, the fraction of a given dose that reaches the blood system. Table 1 summarises factors that influence bioavailability.
Hit
Identification
Lead
Identification
Lead
Optimisation
Candidate
drug preno-
mination
DevelopmentTarget
Identification
3
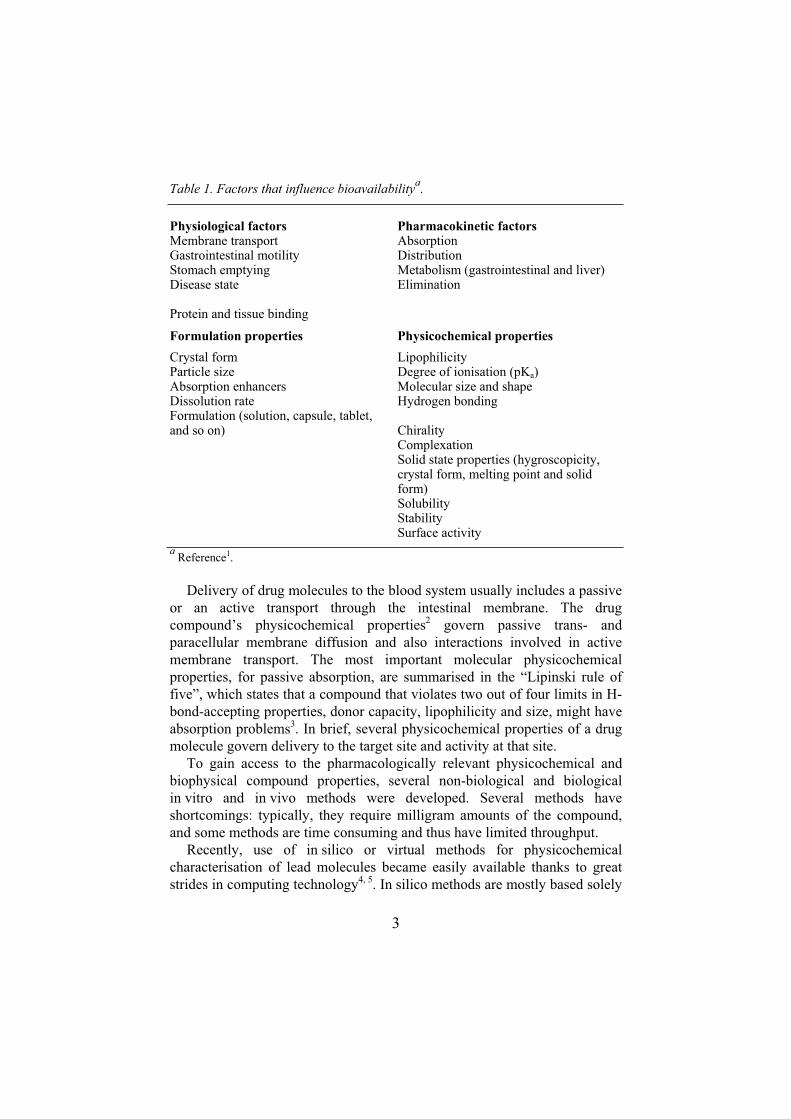
Table 1. Factors that influence bioavailabilitya.
Physiological factors Pharmacokinetic factors Membrane transport Gastrointestinal motility Stomach emptying Disease state
Protein and tissue binding
Absorption DistributionMetabolism (gastrointestinal and liver) Elimination
Formulation properties Physicochemical properties
Crystal form Particle size Absorption enhancers Dissolution rate Formulation (solution, capsule, tablet, and so on)
LipophilicityDegree of ionisation (pKa)Molecular size and shape Hydrogen bonding
ChiralityComplexation Solid state properties (hygroscopicity, crystal form, melting point and solid form) SolubilityStabilitySurface activity
aReference1.
Delivery of drug molecules to the blood system usually includes a passive or an active transport through the intestinal membrane. The drug compound’s physicochemical properties2 govern passive trans- and paracellular membrane diffusion and also interactions involved in active membrane transport. The most important molecular physicochemical properties, for passive absorption, are summarised in the “Lipinski rule of five”, which states that a compound that violates two out of four limits in H-bond-accepting properties, donor capacity, lipophilicity and size, might have absorption problems3. In brief, several physicochemical properties of a drug molecule govern delivery to the target site and activity at that site.
To gain access to the pharmacologically relevant physicochemical and biophysical compound properties, several non-biological and biological in vitro and in vivo methods were developed. Several methods have shortcomings: typically, they require milligram amounts of the compound, and some methods are time consuming and thus have limited throughput.
Recently, use of in silico or virtual methods for physicochemical characterisation of lead molecules became easily available thanks to great strides in computing technology4, 5. In silico methods are mostly based solely

4
on calculations that use theoretical molecular descriptors, which are mathematical representation of the molecules. The main advantage of in silico or virtual methods is that calculations can be done before the compounds have been synthesised, but these methods need experimental data to validate the theoretical models, which is a limitation6.
So there is still a need for development of fast experimental methods for physicochemical screening that uses minute amounts of the compounds and has good capacity, that is, we need methods that are ultimately suited for high throughput screening. In this context, exploration of capillary electrophoresis (CE) is of interest because of its attractive advantages, for example, CE requires only nanogram amounts of the sample, and it yields high precision and accuracy and is a technique that is easily automated. And CE does not require high-purity substances because it enables separation of impurities and decomposition products from the main component. The characterisation mode can easily be adjusted by simply changing the separation media. Separation mechanisms in CE are relatively simple and enable use of CE data, together with theoretical molecular descriptors for in silico modelling. This accentuates CE’s potential as a tool for physicochemical characterisation of small drug compounds. And the CE format enables the introduction of physiological fluids and solutions that simulate different physiological fluids. So CE can also be used as a tool for biopharmaceutical characterisation, i.e., the determination of physicochemical properties and interaction behaviour with different components at physiological conditions.
This study investigated CE as a technique for physicochemical characterisation of active pharmaceutical ingredients. The investigation was limited to small drug molecules. Special emphasis was put on testing the utility of micelles, microemulsions, liposomes and CE as experimental model systems for passive absorption of small drug molecules. For this purpose, modelling and prediction of drug passive absorption with experimental CE data and calculated molecular descriptors was studied. An additional objective was to outline a general strategy for the determination of dissociation constants by CE for labile and partially degraded drug compounds.

5
2 Capillary electrophoresis (CE)
This chapter briefly discusses the general theory and instrumentation of capillary electrophoresis (CE). Many textbooks7, 8, 9 and several review articles10, 11, 12, 13, 14 provide general information on the theory and practical aspects of electrodriven separations using capillaries. Weinberger et al9 and Vesterberg15, 16 describe the history of electrodriven separation techniques. Chapter 3, section 3.1 presents the specific theory for methods used in papers I and II. Chapter 4, section 4.2 presents the specific theory for the methods used in papers II, III, IV, V and VI.
2.1 Theory and instrumentation Electrodriven separation is based on differences in mobilities of sample compounds, through a conducting medium, under the influence of an applied electric field. Differences in mobilities depend on the charge and radius of the sample compound and the viscosity of the conducting media.
When the electrodriven separation is performed in capillaries, the technique is called CE. The capillaries have an inner diameter of 25-150 µm and an outer diameter of 190-365 µm, with a common total length of 20-75 cm; in most cases they are made of synthetic quartz (SiO2) of high purity (fused silica) and have an external layer of polyimide that makes them physically resistant against fractures. Use of capillaries for electrodriven separation permits use of high-field strength, up to 30 kV, which enables fast separations because of effective heat dissipation.
The electroosmotic flow (EOF) is an important phenomenon in CE, i.e., a flow of the separation media through the capillary during analysis. EOF originates from the movement of hydrated cations, that form a viscous electric double layer at the walls of an untreated fused silica capillary when applying an electric field8. Usually, a positive potential is applied to the electrode at the inlet end of the capillary, and the electrode at the other end of the capillary is grounded. So the direction of the EOF in untreated, fused silica capillaries is toward the cathode.
The separation medium is called the background electrolyte (BGE) and usually consists of an aqueous buffer that maintains the buffer pH and

6
provides conductivity. By adding modifiers to the BGE that generate different types of analyte-additive interactions, the separation of sample compounds can be enhanced.
Injection of sample compounds into the capillary is made with hydrodynamic or electrokinetic injection. All common ways of introducing the sample compounds require moving the inlet end of the capillary from the BGE reservoir to a sample solution reservoir during the injection. Hydrodynamic injection is done by applying pressure over a sample reservoir placed at the injection end of the capillary or by applying a vacuum over a sample reservoir that is placed at the other end of the capillary or by a height difference between a sample and a BGE reservoir. The Hagen-Poiseuille equation can be used to calculate the injected volume, Vs
Vs =tot
4
L8
trP Equation 1
where P is the pressure drop over the capillary, r is the internal radius of the capillary, t is the injection time, is the BGE viscosity, and Ltot is the total length of the capillary. Electrokinetic injection is performed by applying a voltage with one capillary end situated in the sample reservoir for a short period.
Many detection modes are available, the most common is on-capillary detection that uses ultraviolet-visible (UV-Vis) absorption. The on-capillary detection window is produced by removing a small length of polyimide film at the outlet end of the capillary. The most common alternative detection modes include: laser-induced fluorescence, indirect absorption, mass spectrometry, electrochemical and conductivity detection.
The observed migration time of the analyte relates to the apparent mobility, µapp, which in practice is a sum of the effective electrophoretic mobilities, µeff, of the analyte and the electrolyte medium, µEOF. The latter is the electroosmotic mobility. The effective electrophoretic mobility is calculated from the experimentally determined migration time for the analyte and the electroosmotic flow
µeff = µapp – µEOF = EOFapp
efftot
t
1
t
1
V
LL Equation 2
where Ltot is the total length of the capillary, Leff is the length of the capillary to the detection window, V is the applied voltage and tapp and tEOF is the migration time of the ionic specie and the marker of the electroosmotic flow, respectively. Electroosmosis is the laminar flow that arises from the movement of hydrated cations and forms a viscous double layer at the walls

7
of an untreated fused silica capillary, when applying an electric field. The mobility of the EOF depends on the charge density of the silica walls and on the ionic strength, dielectric constant and viscosity of the BGE. The effective electrophoretic mobility of an analyte varies – depending on the physicochemical properties of the electrolyte. Properties, such as pH, ionic strength and viscosity, all affect electrophoretic mobility.
Good resolution of analytes is a combination of efficiency and selectivity. A special advantage with CE is that high efficiency can be obtained for small and large molecules. See the references8, 9 that describe theoretical and practical aspects on resolution in more detail.
The basic instrumentation for all CE separation modes is the same. A CE system consists of an injection system, a separation capillary, a high voltage devise, electrodes and a detector.
Figure 3 illustrates a schematic representation of the instrumental set-up for a basic CE system.
Figure 3. Schematic representation of the instrumental set-up for a basic, capillary electrophoresis system; magnified view shows a close-up of the capillary.
Electrodriven separation can also be performed using microfabricated miniaturised devices17. Silica and quartz have often been used as device
POWER SUPPLY
DETECTOR
ELECTRODES
CAPILLARY
INLET
ELECTROLYTE VIAL
OUTLET
ELECTROLYTE VIAL

8
compartments. But more recently, disposable polymer chips have gained increased attention18. Applying an electric field controls the flow (from reservoirs and through the different channels of the BGE) and sample solutions on the chip. The flow of fluids on a chip device usually originates from electrokinetic phenomena and/or electroosmosis. This technique is still in its infancy; only a few commercial instruments are available. A commercial absorbance-based CE instrument with a 96-capillary array has recently been demonstrated for high throughput physicochemical characterisation of drug compounds19
Many different separation CE modes can be used for physicochemical characterisation of drug compounds. The most common modes and those used in papers I-VII are described briefly below. All modes are mainly specified by the composition of the BGE and/or the modifications of the capillary. Sections 3.1 and 4.2 present principles for capillary zone electrophoresis and electrokinetic chromatography in more detail.
Capillary zone electrophoresis Capillary zone electrophoresis (CZE) is the most common mode; here the capillary is filled with a BGE that consists of an aqueous buffer solution. The separation is based on different effective electrophoretic mobilities of the analytes. This mode was used for determination of dissociation constants in papers I and II.
Micellar electrokinetic chromatography Adding a surfactant to a buffer solution at a concentration over the (critical micelle concentration (CMC) causes micelles or aggregates to form. These micelles are a moving pseudostationary phase available for analyte interactions. This mode is called micellar electrokinetic chromatography (MEKC). Separation of analyte compounds, which interact with the pseudostationary phase, is performed with MEKC. This mode is commonly used for determination of retention factors, i.e., hydrophobic properties of the sample compounds; refer to papers II, III and IV. Holland et al20
recently reported a new mode of MEKC that uses bilayered micelles, i.e., bicelles.
Microemulsion electrokinetic chromatography MEKC can be extended to microemulsion electrokinetic chromatography (MEEKC) by adding modifiers, which are immiscible or partly miscible with water, to a buffer solution that contains surfactants. The general separation mechanism is the same as for MEKC. And the same type of properties, such as lipophilicity, can be characterised by using MEEKC. This mode was used in paper III.

9
Vesicle and liposome electrokinetic chromatography It is generally recognised that the molecular geometry of the surfactant governs the shape of the aggregate that is formed. Vesicles may be formed by addition of vesicle-forming surfactant to a buffer solution. These vesicles will act as a pseudostationary phase available for analyte interactions as in MEKC. This mode is called vesicle electrokinetic chromatography. Notably, vesicles consist of bilayers that are attractive for use as model membranes. Phospholipids are surfactants that are typically found in cell membranes of living matter. When added to a buffer solution, certain phospholipids cause lipid vesicles to form. In this thesis, these lipid vesicles are called liposomes. The general separation mechanism is normally the same as for vesicle electrokinetic chromatography. Free liposomes added to a buffer solution were used in paper III, and liposome coated capillaries were used in papers IV and V.

10
3 Characterisation of drug acid-base properties by CE
A drug molecule’s acid-base property is a key parameter for drug development because it governs solubility, partition, absorption, distribution, metabolism and elimination. As a measurement of the acid-base property, the dissociation constant(s) (pKa) is usually determined in aqueous media.
pKa can be predicted using computational methods. These methods have certain advantages, i.e., calculations can be performed on large virtual compound libraries. But erroneous data are often predicted for complex and flexible drug compounds that contain several functional groups. And these calculations are based on parameters in databases that contain experimental data from the literature. So enough data for new types of compounds are probably missing – for providing accurate predictions.
But several fast experimental techniques are available for determination of pKa values. Potentiometric titration is in general use because it is fast and accurate, and automated commercial instruments are available; its shortcomings include the requirements to use: (1) milligram amounts of pure compounds and (2) mixtures of aqueous buffer and an organic solvent for low solubility compounds. Data obtained in mixtures require extrapolation to pure aqueous buffer, which may not always be valid.
An alternative to potentiometric titration is UV-Vis spectrophotometric titration because it can handle compounds with lower solubility and lower sample concentrations. But the compound must contain a UV active chromophore close enough to the site of the acid-base function in the molecule. And the determination is sensitive to impurities in the compounds21.
Both potentiometric titration and UV-Vis spectrophotometric titration can be further miniaturised to consume only a few micrograms of a sample per analysis22.
Techniques that can handle impure compounds are based on analytical separation principles: liquid chromatography (LC), ion-exchange chromatography, gas chromatography, paper chromatography and traditional isotachophoresis (ITP)23. LC is the most frequent technique because of minute compound consumption and because automatic LC systems can be modified to yield high capacity by using a flow injection analysis

11
approaches24. The main disadvantage is the risk of long retention times when using pure aqueous media mobile phases without organic additives for the determination of pKa
25. ITP may well be used because is consumes small amounts of compounds. But it has drawbacks, such as laborious calculations, and its main shortcoming is that the buffer pH choice is limited to pH 3-1126.
The CE technique offers several advantages over traditional techniques for determination of pKa. The experimental set-up is simple, and by using commercial instruments, the procedure is easy to automate. In addition, determinations can be conducted at different temperatures (15-60°C) and in different media. The CE technique is especially useful if the amount of compound is small because only a few nanogram or less is commonly used for analysis. And pKa values may also be determined for compounds, which are impure or relatively unstable in aqueous solutions because impurities and decomposition products can be separated from the main component.
3.1 Theory for determination of pKa from migration data
The mobility of an ionisable analyte is a direct function of the pH of the separation medium, the electrolyte. So the pKa value(s) of the analyte can be obtained through a series of CE experiments with buffers that have different pHs. By plotting the analyte mobility versus buffer pH, a curve analogous to a potentiometric titration curve is obtained from which the pKa value(s) can be determined. In practice, the mobility is calculated from the migration time for the analyte and for the electroosmotic flow. Beckers et al26, Cai et al27,Cleveland et al28 and Ishihama et al29 introduced CE as a technique for determination of dissociation constants. Khaledi’s High Performance Capillary Electrophoresis8 reviews the technique, and section 2.1 briefly summarises the theoretical basis for CE. Basic theories for determination of pKa using CE are also found in the literature27, 28, 30.
Here, a description of the general theory of pKa determination by CE, used in papers I and II, is given.
The basis for determination of dissociation constants by CE is the measurement of the migration time for an analyte, which is separated in a capillary that contains an electrolyte with a specified pH. A charged analyte in a pure water medium migrates with an intrinsic ionic mobility, µion, when an electric field is applied. The ionic mobility depends on the charge, form and size of the ion and the attached solvation shell. If the water contains ionic additives, the ionised analyte migrates at an effective electrophoretic mobility, µeff, also referred to as the electrophoretic mobility.
12
Ions of the opposite sign always surround an ionised analyte in a solution. The electrostatic interaction between the analyte and the ion sphere, which migrates in the opposite direction, will affect the analyte’s mobility, so analyte mobility decreases with increasing ionic strength10.
In this way, the vector sum of the effective electrophoretic mobility of an analyte and the electroosmotic mobility gives the apparent mobility, µapp,also defined by Smith et al31 and Knox32 as the overall mobility.
A weak basic or acidic analyte consists of several ionic or neutral species that are in fast, dynamic equilibrium together. So the analyte migrates as a single analyte. The effective electrophoretic mobility of a partially dissociated analyte is a function of the ionic mobility of the respective specie
µeff =i
ioni µx Equation 3
xi =
ji
i
c
c Equation 4
and ci is the concentration of the individual ionic form of the analyte, jpresent in the solution33. The neutral parts do not contribute to the effective electrophoretic mobility, but the actual magnitude of the molar fraction of the ionic components is affected by a change in pH in the electrolyte. The dependence of the effective electrophoretic mobility of weak acids and bases on pH has a characteristic shape that corresponds to the dissociation curve of weak acids and the protonation curve of weak bases.
The effective electrophoretic mobility is assumed to mainly depend on the effective charge and pH. So the BGEs used in papers I and II were preparedto have the same ionic strength.
The thermodynamic dissociation Kath constant for the equilibrium
HA H+ + A– Equation 5
is defined as
Kath =
HA
HA- .
HA
AH Equation 6
where is the activity coefficients derived from [A-] A- = [A-], A
- is theactivity coefficient of the anionic specie and H
+ is the activity coefficient of the hydrogen ion. So by assuming that the activity coefficient of the undissociated acid HA is 1, Eq.6 can be rewritten as

13
pKath = pH – log A
– – logHA
A Equation 7
The pH value of the experiment is known, and the value of the activity coefficient for the dissociated acid (– log A
-) can be calculated with the Debye-Hückel equation. At a temperature of 25 °C and at an ionic strength below 0.1, the activity can then be calculated from
– log = Ia3281.01
Iz5085.0 2
Equation 8
where a is the hydrated ion size parameter (which is set to 5 Å as in reference 28 because it is unknown) and z is the charge of the ion and I is the ionic strength of the electrolyte. Substituting Eq.8 into Eq.7 gives
pKath = pH – log
HA
A+
Ia3281.01
Iz5085.0 2
Equation 9
This correction gives the thermodynamic pKa value as opposed to a concentration-dependent value or mixed constants. The activity of the ions compensates for (1) the attraction that ions can exert on one another and (2) the incomplete hydration of ions in solutions that are too concentrated. The lower the concentration, the smaller this interaction becomes. At infinite dilution, the pKa concentration becomes numerically equal to the thermodynamic pKa. Thus the main difference between a thermodynamic pKa and the pKa concentration is that the ions’ activities must be accounted for when calculating the thermodynamic pKa
34. To relate pKa to mobility, the [A–]/[HA] part of the equation is expressed in terms of electrophoretic mobility. The electrophoretic mobility is calculated from the experimentally determined migration time for the analyte and the electroosmotic flow. Eq.2 then gives the effective electrophoretic mobility of any ionic specie, µeff. The effective electrophoretic mobility of an anionic specie at different pH is given by
µeff = µa Equation 10
where is the fraction of the solute ionised and µa is the electrophoretic mobility of the fully deprotonated specie (A–). The formula for a cationic specie is analogous, except that µb is used as the electrophoretic mobility of

14
the fully protonated species (BH+). The ratio of deprotonated and protonated anionic species can be written as
effa
eff
µµ
µ
1HA
A Equation 11
Then Eq.9, after substitutions, attains the form that is valid for monoprotic acids, i.e.,
pKath = pH – log
effa
eff
µµ
µ+
Ia1
Iz2
Equation 12
the formula for a base is analogous. A and B are constants that vary with temperature and the electrical properties of the solvent. At 25°C, the constants are A = 0.5085 and B = 0.328128.
The pKath constant is designated pKa from here. For determination of the
thermodynamic pKath values, pH and µapp must be measured under full
temperature control, so the entire length of the capillary and the electrolyte reservoirs must be precisely thermostatted, something that is not fully implemented in currently available commercial CE instruments.
Note: pKa does not correspond to a stoichiometric constant since A- 1. The thermodynamic constant corresponds to the stoichiometric constant only when all activity coefficients are equal to unity. The final equations for calculation of pKa values that relate analyte mobility to electrolyte pH, valid for a weak monoprotic acid (Eq.13) and a weak monoprotic base (Eq.14), then attains the form
µeff =Q)pHpKa(
aQ)pHpKa(
101
µ10 Equation 13
µeff =Q)pH(pKa
bQ)pH(pKa
101
µ10 Equation 14
Here Q is set to (0.5085 z2 I)/(1+ 0.3281 a I). In this way, pKa valuescan be obtained from experimental data through a simple non-linear curve-fitting procedure.
Ishihama et al29 and by Gluck et al30 have presented equations fordetermination of pKa values of multivalent ionic solutes.

15
3.2 Determination of pKa for labile drug compounds Limited attention has been paid to the use of CE for determination of pKa forlabile compounds. To the best of our knowledge, so far, there are only four reports on determination of pKa of labile compounds by CE,35, 36, 37, 38 besides papers I and II. The action taken by Sheng et al35 was preparation of new sample solutions every three hours. But this introduces limitations for automated analyses. Takayanagi et al37 determined acid dissociation constants of phenolphthalein, and Örnskov and Folestad36 determined dissociation constants of omeprazole analogues. Recently, Ishihama et al38
presented pKa values for the labile rabeprazole. The acidic pKa, reported by Ishihama et al, agreed with the values in paper I; the basic pKa was 0.6 pH units higher. Ishihama et al applied pressure during the CE analysis, which allowed completion of one CE analysis in less than one minute. These studies took advantage of the CE separation to resolve the analyte of interest from related compounds, such as degradation products. Despite these reports, a general strategy for labile compounds is only presented in paper I.
The study in paper I: (1) investigated different aspects of the developed methodology, with emphasis on injection and conditioning procedures and the effective length of the separation capillary (2) extended the preliminary study by Örnskov and Folestad36 to a wider range of drug compounds that are labile in aqueous solutions and (3) outlined a general methodology for determination of pKa by CE.
A B
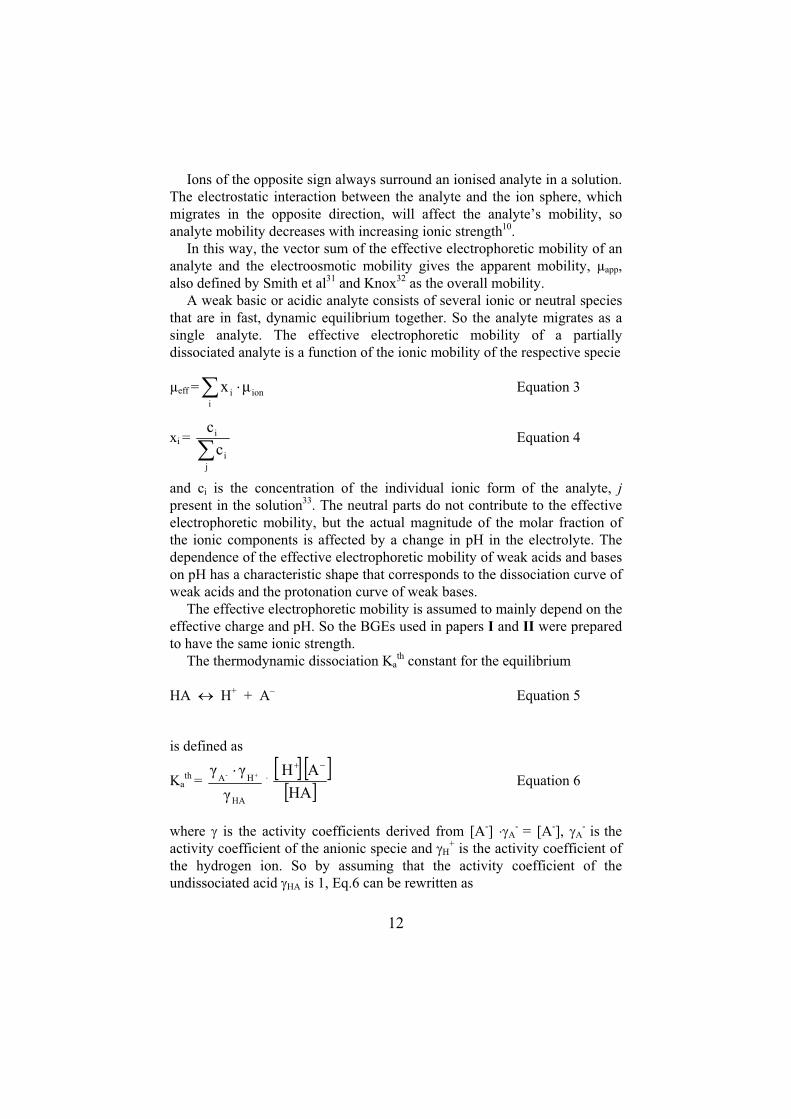
Figure 4 A. General structure of pyridinyl-methyl-sulfinyl-benzimidazoles (PMSBs). B. General structure of benzenesulfonic acid phenethyloxy-phenyl esters (BSAPs). The substituents at the R5 position consist of a primary amine (-CH2NH2) or an amidine (-CHNHNH2), the substituent at R6 consists of a hydroxyl group or a hydrogen.
Pyridinyl-methyl-sulfinyl-benzimidazoles (PMSBs) and benzenesulfonic acid phenethyloxy-phenyl esters (BSAPs) were used as model compounds; see Figure 4. The PMSBs constitute a group of drug compounds that have an acidic pKa at 8-9 and a basic pKa at 3-5 and that are known to degrade under neutral and acidic conditions39. Note that for the PMSBs, the pyridine nitrogen atom can accept a proton and the benzimidazole ring NH group can
N
N
NH
S
R4
R2
R3R1O
O
R5
R6S
O
R4
OO
R1
R3
R2

16
release a proton – thus acting as an acid40. BSAPs represent compounds that are labile at the other end of the pH range, i.e., at high pH; refer to paper II.
Several key steps were evaluated to optimise the overall methodology. These experiments comprised sample matrix and injection, separation time and peak characterisation. PMSBs were selected as a first set of model compounds.
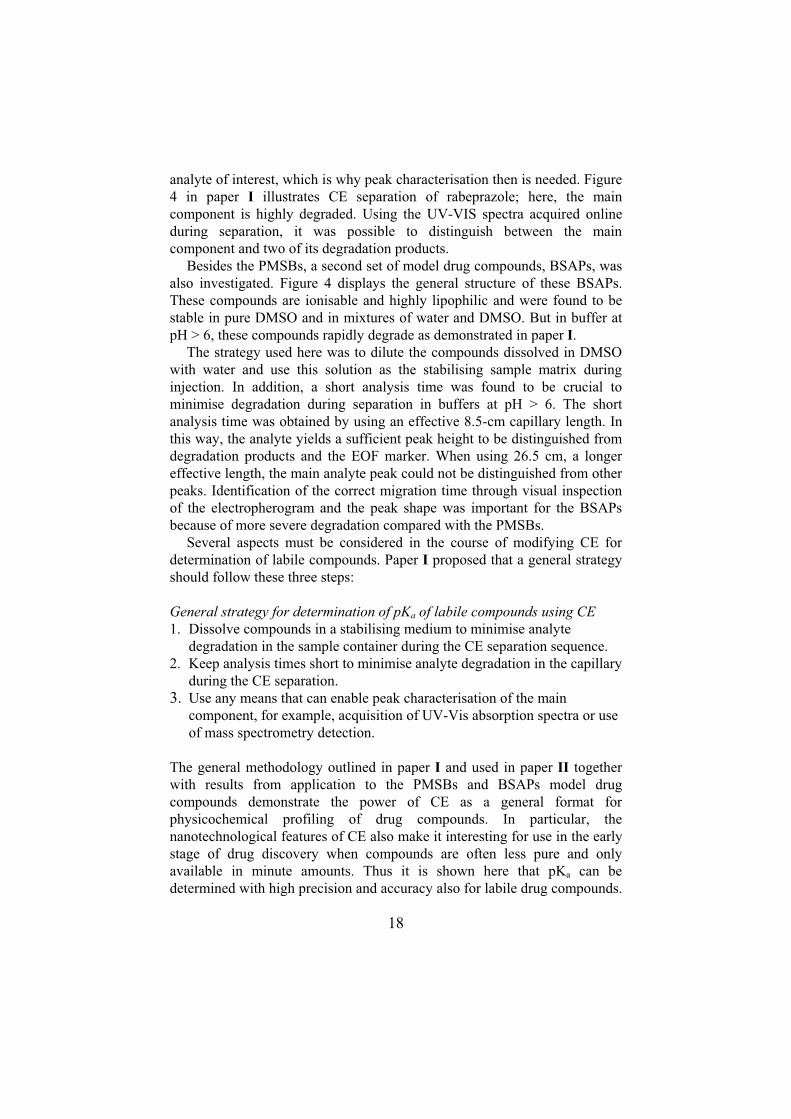
Figure 5 shows typical CE separations at different pH for the rabeprazole compound. From these electropherograms, it is obvious that degradation during CE separation increases at lower pH. And at pH 3.5, the electroosmotic flow is about 4 times lower at pH 10.6. The holding time thus became inevitably longer, which enhances degradation of the labile compounds.
For the PMSB model compounds, an analyte cannot be dissolved in the BGE, as is common in conventional CE, particularly not in separations that use low pH electrolytes. The PMSBs were thus dissolved in a high pH buffer (pH=11) to minimise any analyte degradation in the sample vial during the automated analysis sequence. Typically, a CE complete measurement sequence (conditioning, injections and analysis) could last 30-90 minutes, which is why it was necessary to dissolve the PMSBs in a stabilising diluent. Still, a potential risk using high pH solvent is that a sample diluent may alter the separation conditions by introducing a too-large zone of a different buffer into the separation electrolyte (inside the capillary). No significant differences could be observed, provided that the injection volume is kept small (i.e.< 0.03% of capillary volume). When large injection volumes were tested (i.e. 0.6% of capillary volume), the peak broadening increased with larger injection volumes. The influence on pKa determination from an increase in injection volume (about a factor of 20) using hydrodynamic injection was investigated. A shift is observed toward lower pH in the mobility versus pH plot; refer to paper I.
The next step was to investigate the effect of injection method on determination of pKa. The main advantage with electromigration is that a smaller volume of sample diluent is introduced into the capillary – to avoid altering the electrolyte conditions, i.e., the BGE pH. Although hydrodynamic injection is advantageous in that the sample is injected as a plug, so the analyte is maintained in a stabilising sample matrix until the effective separation starts. A potential advantage with electromigration over hydrodynamic injection is the built-in segregation between analyte and related substances. But in this study, no such advantages could be observed because the major degradation product had a similar mobility as the main drug compound. The effect of injection method, electromigration or hydrodynamic injection, was further investigated during determination of the dissociation constants of lansoprazole, pantoprazole and rabeprazole.

17
Generally, the lower pyridinyl dissociation constants were about 0.1 pKa
units higher when hydrodynamic injection was used. This implies that the pH 11 sample diluent increases the local pH in the capillary and therefore yields a slightly higher dissociation constant. The upper dissociation constant of the PMSBs were the same for hydrodynamic and electromigration injection.
Figure 5. CE separation of rabeprazole that degrade at neutral and acidic pH. Electropherograms from CE separations in electrolytes of different pH. R = rabeprazole, EOF = marker of electroosmotic flow (benzyl alcohol).
To minimise analyte degradation during CE separations, short analysis times were tested through use of a short separation capillary – effective length 8.5 cm compared with 26.5 cm. But no significant effect regarding less degradation of PMSBs was observed – mainly because the sample diluent was the most critical step in the analytical procedure for the PMSBs.
A general problem with severe degradation of analytes during separation is the need for correct identification of peaks in the electropherogram. Typically, peaks from degradation products may overlap with the main
pH 8.5
Time (min)0 1 2 3
pH 3.4
Time (min)0 2 4 6
R
EOF
REOF
pH 10
Time (min)0 1 2 3
pH 5.4
Time (min)0 1 2 3
R
EOF
REOF
18
analyte of interest, which is why peak characterisation then is needed. Figure 4 in paper I illustrates CE separation of rabeprazole; here, the main component is highly degraded. Using the UV-VIS spectra acquired online during separation, it was possible to distinguish between the main component and two of its degradation products.
Besides the PMSBs, a second set of model drug compounds, BSAPs, was also investigated. Figure 4 displays the general structure of these BSAPs. These compounds are ionisable and highly lipophilic and were found to be stable in pure DMSO and in mixtures of water and DMSO. But in buffer at pH > 6, these compounds rapidly degrade as demonstrated in paper I.
The strategy used here was to dilute the compounds dissolved in DMSO with water and use this solution as the stabilising sample matrix during injection. In addition, a short analysis time was found to be crucial to minimise degradation during separation in buffers at pH > 6. The short analysis time was obtained by using an effective 8.5-cm capillary length. In this way, the analyte yields a sufficient peak height to be distinguished from degradation products and the EOF marker. When using 26.5 cm, a longer effective length, the main analyte peak could not be distinguished from other peaks. Identification of the correct migration time through visual inspection of the electropherogram and the peak shape was important for the BSAPs because of more severe degradation compared with the PMSBs.
Several aspects must be considered in the course of modifying CE for determination of labile compounds. Paper I proposed that a general strategy should follow these three steps:
General strategy for determination of pKa of labile compounds using CE 1. Dissolve compounds in a stabilising medium to minimise analyte
degradation in the sample container during the CE separation sequence. 2. Keep analysis times short to minimise analyte degradation in the capillary
during the CE separation.3. Use any means that can enable peak characterisation of the main
component, for example, acquisition of UV-Vis absorption spectra or use of mass spectrometry detection.
The general methodology outlined in paper I and used in paper II together with results from application to the PMSBs and BSAPs model drug compounds demonstrate the power of CE as a general format for physicochemical profiling of drug compounds. In particular, the nanotechnological features of CE also make it interesting for use in the early stage of drug discovery when compounds are often less pure and only available in minute amounts. Thus it is shown here that pKa can be determined with high precision and accuracy also for labile drug compounds.

19
Use of short-end injections to minimise the analysis time, first suggested by Örnskov and Folestad36 and then in paper I, was combined with pressure-assisted CE by Wan et al, which allowed rapid pKa determinations using CE41. And use of mass spectrometry has recently been demonstrated for high throughput determination of pKa using CE42.

20
4 Characterisation of drug lipophilicity properties by CE
Knowing the lipophilicity of a drug compound is especially important when predicting efficient delivery to the active site and when predicting the activity at the target site, metabolism, elimination and many other processes in a living organism.
Traditionally, the lipophilicity of a compound is expressed as the partition coefficient of neutral compounds in 1-octanol/water (log Pow) or as the distribution coefficient log Dow for ionised compounds at a specified pH. Log Pow values can be found in databases for many compounds. Most of these data are determined by the classic shake-flask technique, which is based on measurements in a biphasic system that consists of 1-octanol and water. But determination using this classic technique requires a relatively large amount of pure compounds and is a rather tedious process.
Many theoretical, in silico, and experimental methods were developed for determination of lipophilicity43, 44, 45. Though giving reliable data for uncomplicated compounds, the theoretical methods often fail to account for intramolecular effects of more complex compounds46, as discussed in paper III.
Today, potentiometric techniques are generally used for log Pow
determinations but have the same general limitations as for determination of pKa values, as mentioned in Chapter 3. In addition, this technique cannot always handle non-ionic or too hydrophilic compounds with log Pow smaller than ca –0.543. The determination of lipophilicity parameters that use separation-based techniques has the same advantages as for determination of pKa for example: ease of automatisation, only milligram sample requirements and the ability to handle impure and labile compounds. Use of LC is mostly widespread, but the mechanisms that govern analyte-separation media interactions are complicated, and the correlation to lipophilicity (log Pow) is not straightforward. An alternative separation technique is the analytical micro-volume liquid-liquid flow extraction system, which can easily be automated and requires small amounts of sample47.
During recent years, MEKC48, 49 has become an alternative method for characterisation of lipophilic properties. MEKC is attractive for compounds that span a wide range of hydrophilic to hydrophobic properties and offers

21
high separation efficiency. This was demonstrated in paper III for a set of -blockers, which span a wide range of lipophilic properties; see Figure 8. Notably, there are more pure analyte-separation media interactions in CE than in LC. That means that MEKC is a more straightforward format for modelling lipophilicity. But for highly lipophilic compounds, accurate determination of retention factors may be connected with some difficulties.
Good correlation was demonstrated between MEKC data (log k') and log Pow first by Ong et al50, and later by others8. Furthermore, microemulsions and liposomes as the pseudostationary phase in CE have been shown to generate log k' that correlates with log Pow
, refer to papers III and IV. Other modes of CE, such as vesicle electrokinetic chromatography – bilayer aggregates formed by surfactants – have also been shown to yield data that correlate to log Pow.
The rationale for using CE with liposomal, micellar and microemulsion electrolytes as tools for physicochemical characterisation of drug compounds is that separations are mainly due to solute differences in lipophilicity. And it is possible to adjust the properties of the pseudostationary phase in the electrolyte simply by adjusting the composition of the electrolyte, for example, by changing type of surfactant or lipid.
4.1 Stationary and pseudostationary phases All aggregates used as the pseudostationary phase in papers II-V, consisted of various surface-active molecules added to the buffer solution. For example, liposomes are prepared by using liposome-forming molecules such as water-insoluble phospholipids. Phospholipids (such as 2-oleoyl-1-palmitoyl-sn-glycero-3-phosphocholine, a common component of human membranes) added to buffer solutions at certain concentrations, form stable spherical vesicles composed of curved bilayers with a diameter of typically about 120 nm. Use of liposomes in CE enables detailed studies of physical and physicochemical properties of the bilayer and the structure and dynamics on the molecular level. Figure 7 illustrates the large size difference of liposomes and micelles.
Although dynamic systems show high performance, use of liposomes as a free-flowing pseudostationary phase is incompatible with direct coupling to MS. Immobilisation of liposomes onto the fused-silica surface (in paper V)
enables the capillary electrophoresis system to be coupled online to MS (paper IV).
Micelles are prepared by adding surface-active micelle-forming molecules, such as SDS, to a buffer solution at a concentration over the critical micellar concentration. Many different surfactants are used as the

22
micelles in MEKC; bile acids are among the most frequently used; see Figure 6. In contrast to liposomes, micelles are small (about 3 nm for SDS micelles) and dynamic aggregates with a relatively short lifetime, about 20 milliseconds 51. The number of molecules that form a micelle is higher for micelles made of SDS than for the bile acids, which gives a lower charge density for the latter micelle aggregates.
Figure 6. Chemical structures of the most common bile acids in humans and their glyco and tauro derivates; bile acids are commonly used as micellar aggregates in CE.
Electrolytes that contain microemulsions will form by adding an immiscible or a partially miscible liquid, such as an organic solvent to a micelle solution, and the electrolytes are stabilised by an interfacial film of surfactant. The microemulsions usually have a diameter of 0.01-0.1 µm 52.Until now, microemulsions as the pseudostationary phase in CE (MEEKC) 53
is a relatively seldom-used mode of CE. This is surprising because microemulsion media for CE separations are easy to prepare and are stable for several weeks.
OH
OH
CH3
CH3
OH
CH3
H
H
H
HH
C
O
R
OH
CH3
CH3
OH
CH3
H
H
H
HH
C
O
R
C
OH
CH3
CH3
O
OH
CH3
H
H H
HH
R
O
O-
NH
O-
NHS
OO
O-
Cholic acid Deoxycholic acid
Chenodeoxycholic acid
R:
cholate
Glyco-derivs.
Tauro-derivs.

23
Figure 7. Cryo-transmission electron images of sodium dodecyl (SDS) micelles (left) and (POCP/PS) liposomes (right). Liposomes consisted of 3 mM 80/20 v/v% phosphatidylcholine (POPC) and phosphatidylserine (PS) in sodium phosphate buffer pH = 7.4, I = 0.02. Images prepared by Göran Karlsson at the dept. of Physical Chemistry, Uppsala University, Sweden.
4.2 Theory for determination of lipophilicity from migration data
The basic principle is described below in a condensed form for determination of lipophilicity properties by means of MEKC. Khaledi and co-workers presented a thorough description of these theories54, 55. The distribution of an analyte between the aqueous, i.e., the bulk buffer solution, and the pseudostationary (micellar) phase is governed by K, the distribution coefficient, and the ratio between the volumes of Vps, the pseudostationary phase, and Vaq, the aqueous phase, according to
k = K aq
ps
V
V Equation 15
k = K [(n (Csurf – CMC))/(1–(n (Csurf – CMC)))] =aq
ps
n
n Equation 16

24
where k is the retention factor, n is the partial molar volume of micellar phase, Csurf is the total surfactant concentration, and CMC is the critical micelle concentration. As long as Vps is smaller than Vaq, the denominator (1– (n (Csurf–CMC))) is about equal to 1. In this way, k directly relates to the number of moles of analyte distributed in the pseudostationary phase and the aqueous phase, nps and naq, respectively. For neutral analytes, k values can be determined in a straightforward way by measuring the migration time for the analyte, ts, the aqueous phase, t0, and pseudostationary phase, tps. But for ionised analytes, the observed migration time is also affected by their electrophoretic mobility in the aqueous phase and by any interaction with surfactant monomers. So the analyte migration time must be corrected for these contributions to obtain a measure of the distribution between the aqueous and pseudostationary phase.
To simplify the theoretical treatment of the electrophoretic separation of ionised analytes, when using various electrolytes that contain a pseudostationary phase, it is more direct to describe this in terms of mobilities. For cationic analytes, and anionic analytes, the corrected retention factor (k') is calculated from
k' = effps
0eff
µµ
µµ Equation 17
where µeff is the electrophoretic mobility of the analyte in the electrolyte that contains pseudostationary phases aggregates, µ0 is the electrophoretic mobility of the analyte in the electrolyte in absence of pseudostationary phase aggregates, and µps is the mobility of the pseudostationary phase.
µ0 is simplest to determine using an electrolyte without any surfactant additives. But several assumptions are made in this case, i.e., the negligible influence of micelles on ionic strength, dielectric constant and viscosity. And insignificant binding between the free surfactant or lipid monomers and charge analyte is assumed. If complete ion-pair binding between the charged analytes and surfactants monomers occurs, then µ0 = 0.

25
Figure 8. Separation of model compounds in micellar electrokinetic chromatography. The retention factor scale is given in the electropherogram, with the normal time scale. The upper scale represents the logarithmic distribution ratio (log D) scale. Six -adrenoceptor antagonists (0.4 mg/ml) were injected together with five alkyl phenyl ketones (0.05 mg/ml). M0 = a compound migrating with the EOF (acetonitrile and methanol). M1 = acetophenone, M2 = propiophenone, M3 = butyrophenone, M4 = valerophenone, M5 = hexanophenone. Conditions: Separation media consisted of sodium phosphate buffer pH = 7.4, I = 0.05 and 100 mM sodium deoxy cholate. Untreated fused silica capillary, 35.0 cm (26.5 cm to detector) of 50 µm I.D., 375 µm O.D. UV-Vis detection at 230 nm. Hydrodynamic injection 20 mbar (5 s). Separation at 37 °C and 300 V/cm (about 62µA).
The mobilities needed to calculate k' values can be calculated using experimental migration data. For determination of tEOF, the migration time of the electroosmotic flow, the signal from the analyte diluent, can be used. The migration time of the pseudostationary phase, tps, can be calculated by an iterative procedure56, 57, 58 using the migration data for a homologous series of five alkyl phenyl ketones (alkylphenone), acetophenone, propiophenone, butyrophenone, valerophenone and hexanophenone (HP); see Figure 8.
The calculation procedure of µps starts with assuming that HP, one of the most lipophilic alkylphenone, migrates at the same mobility as the pseudostationary phase aggregates. By using the mobility of HP as a
(min)0 2 4 6 8 10 12
M0
M1
M2M3 M4 M5
Ate
nolo
l
Pra
ctol
ol Pin
dolo
l
Met
opro
lol
Oxp
reno
lol
Alp
reno
lol
-3 -2 -1 0 1
Log D
tmc
Retention factor (k')teof 0 10010 20421 53
26
eofeff
eff
eofeff
eff
eof
eofs
µµ
µ1
µµ
µ
t
tt
substitution of µps, log k' for all five alkylphenones were calculated according to Eq.17. The equation for the linear relationship between log k'and the carbon number of the alkyl group was then calculated. So a temporary log k' for HP was obtained from this equation. Thereafter, a new µps was obtained from Eq.17 using the calculated k' for HP. Then the log k'values of all alkylphenones were recalculated with the new µps and a new equation for the linear relationship between log k' and the carbon number was determined. This procedure was repeated until successive iterations showed no substantial differences in calculated µps.
For CE separations that use stationary lipophilic phases, such as immobilized liposomes (in papers IV and V), the corrected retention factor (k') is calculated from
k' = Equation 18
where ts is the elution time of a specific solute, teof is the elution time of an unretained and uncharged solute, µeff is the electrophoretic mobility of a specific solute, and µeof is the mobility of the electroosmotic flow59.
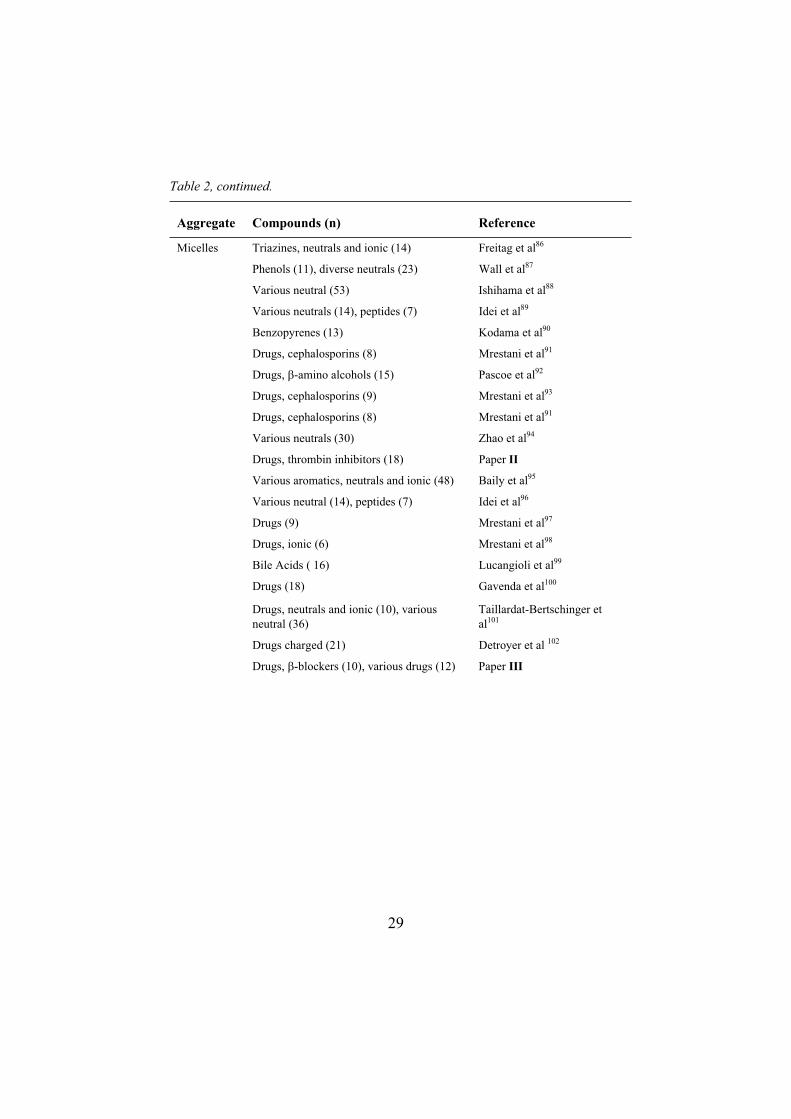
4.3 Determination of lipophilicity properties by CE In many studies, correlation has been successfully demonstrated between CE migration data and log P. This was also demonstrated in papers II, III, V and VI. Table 2 lists studies that report correlation to log P using MEKC, and Table 3 lists studies that correlate MEEKC, liposomes and vesicles data to log P. All this studies elegantly demonstrate the ease with which the experimental CE technique can be varied and used for lipophilicity characterisations.
It should be noted that the most commonly used micellar phases consisted of SDS, which have been shown to give different regression results for various groups of solutes as shown by Khaledi and co-workers 60. The micellar systems studied in paper III included various bile acids, SDS and CTAB. The same regression results were observed for the different model analytes in the SDS micellar systems, which likely emanates from that the model compounds comprised a narrow set of -blockers.
The majority of the reports in Tables 2 and 3 have investigated the direct correlation between CE data and log P data solely. If the objective for

27
determination of lipophilicity indeed is to model cell permeability, the partitioning in the in vitro/CE system and biological systems should be based on the similar analyte-media mechanisms. Dorsey and co-workers demonstrated that water-micelle partitioning in an MEKC system is a better model of biopartitioning with respect to enthalpic and entropic contributions to the free energy transfer than the octanol-water partition model61. Thus because the thermodynamic signature of micelle-water partitioning is similar to biological partitioning, as opposed to octanol-water, it has been proposed that better correlation with in vitro biological parameters might be expected with micellar-based methods62.
Thus, in the future an increasing number of reports demonstrating and discussing the potential of CE for this purpose should be expected63. This implies that use of CE generated lipophilicity data for quantitative structure-activity relationships (QSAR) studies or biopharmaceutical characterisations, is still in its infancy.

28
Table 2. Overview of lipophilicity properties, as correlations to log Pow, determined by CE – using micelles as the pseudostationary phase.
Aggregate Compounds (n) Reference
Micelles
First; Phenols neutral and ionic (11) Ong et al50
Phtalate esters (7) Takeda et al64
Various neutrals (9) Chen et al65
Neutral alkylbenzenes and other neutral compounds (14) Muijselaar et al58
Drugs, neutrals and ionic (26) Schmutz et al66
Various neutrals (32) Greenaway et al67
PAHs (20) Jinno et al68
Various neutrals and ionic (100) Herbert et al69
Various neutrals (53) Ishihama et al70
Various neutrals (11), drugs (3) Smith et al71
Various drugs (16), various neutral and ionic (18) Adlard et al72
PAHs (20) Jinno et al73
Drugs, Dihydropyridines (26) Benito et al74
Various aromatic (60), drugs (9) Yang et al75
Steroids (6) Wiedmer et al76
Drugs, -blockers (10) Lin et al77
Various neutrals and ionic (16) Dinelli et al78
Various neutrals and ionic (67) Woodrow et al61
Review Khaledi et al79
Various, neutrals and ionic (14) Ferguson et al80
Ionic tetracyclines (6) Chen et al81
Neutral, ionic drugs (53) Hanna et al82
Pesticides (neutral) (43) Wu et al83
Drugs, cephalosporins (7) Mrestani et al84
Triazines, neutrals and ionic (13) Lin et al85
29
Table 2, continued.
Aggregate Compounds (n) Reference
Micelles Triazines, neutrals and ionic (14) Freitag et al86
Phenols (11), diverse neutrals (23) Wall et al87
Various neutral (53) Ishihama et al88
Various neutrals (14), peptides (7) Idei et al89
Benzopyrenes (13) Kodama et al90
Drugs, cephalosporins (8) Mrestani et al91
Drugs, -amino alcohols (15) Pascoe et al92
Drugs, cephalosporins (9) Mrestani et al93
Drugs, cephalosporins (8) Mrestani et al91
Various neutrals (30) Zhao et al94
Drugs, thrombin inhibitors (18) Paper II
Various aromatics, neutrals and ionic (48) Baily et al95
Various neutral (14), peptides (7) Idei et al96
Drugs (9) Mrestani et al97
Drugs, ionic (6) Mrestani et al98
Bile Acids ( 16) Lucangioli et al99
Drugs (18) Gavenda et al100
Drugs, neutrals and ionic (10), various neutral (36)
Taillardat-Bertschinger et al101
Drugs charged (21) Detroyer et al 102
Drugs, -blockers (10), various drugs (12) Paper III

30
Table 3. Overview of lipophilicity properties as correlations to log Pow, determined by CE– using microemulsions, liposomes and vesicles as the pseudostationary phases.
Aggregate Compounds (n) Reference
Microemulsion
First; Various neutrals and ionic (9) Watarai et al103
Various neutrals (53) Ishihama et al70
Various neutrals and ionic (28), a few drugs Gluck et al104
Drugs, anionic (10) and cationic (15) Ishihama et al105, 106
Various neutrals (53) Abraham et al107
Drugs, cephalosporins (7) Mrestani et al84
Various ketones, neutral and ionic (8) Watarai et al108
Various neutrals (53) Ishihama et al88
Neutral phenones (8) Altria et al109
Drugs, cephalosporins (8) Mrestani et al91
Drugs, and various neutrals and ionic (86) Poole et al110
Drugs, bases and nucleosides (10) Furumoto et al111
Pesticides (> 80) Klotz et al112
Drugs, -blockers (10), various drugs (12) Paper III
Liposomes
First; Zwitterions (4) Nakamura et al113
Various aromatic neutrals (55) Burns et al114
Various neutrals (29) Burns et al115
Drugs, -blockers (10), various drugs (12) Papers III and V
Vesicles
First; various neutrals (20) Hong et al116
Drugs, -amino alcohols (15) Pascoe et al92
Various aromatic neutrals (41) Agbodjan et al117
Drugs, and various neutrals and ionic (29) Razak et al118
Various neutrals, neutral and ionic pesticides (115) Klotz et al119

31
5 Modelling of drug compound passive intestinal absorption using CE data
The biopharmaceutics discipline within pharmaceutical science focuses on delivery of a drug to its pharmacological target. Typically, biopharmaceutical profiling of a drug includes in vitro and in vivo studies on human dissolution and absorption. Today, vitro methods commonly use artificial or biological membrane systems or constitute assays based on biological cell layers, such as Caco-2 cells. Alternative in vitro artificial methods are separation based63, 120. Several modes of LC, such as immobilized artificial membranes121 and immobilized liposome chromatography122, have been demonstrated.
The rationale for exploring the separation-based CE technique for modelling drug absorption is this: only nanogram amounts of a drug compound are needed for the CE analysis – in contrast to the milligram amounts needed for LC methods. And because the CE technique is solution based, the composition of the electrolytes can be easily adjusted to emulate various interactions encountered in physiological medias.
5.1 Drug absorption If the drug compound is dissolved in the intestinal content, the next barrier is the intestinal cell membrane; see Figure 9.
Figure 9. Overview of the human gastrointestinal tract. The small intestine tract segments are called duodenum (25 cm), jejunum and ileum (260 cm). Ileum empties into the colon (110 cm)123; drawing by Erika Fredriksson, Uppsala, Sweden.

32
Several different mechanisms are involved in drug intestinal absorption124,
125; the most common is passive diffusion that occurs through the epithelial cell plasma membrane or through the intercellular spaces (trans- and paracellularly, respectively); see Figure 10. Note that drug compounds may also cross the intestinal tract cell membranes by mixed transport routes1.Right now, an increasing number of active transport routes are being discovered in the intestinal membranes. Nevertheless, several of the drug compounds must penetrate several membranes to reach the target site, and the drug compound may not have access to the same active transport routes at the target cell or the other cell membranes that must be passed on the way to the target. So at all times, characterisation of the passive, drug-compound, membrane-permeability properties is highly relevant during drug discovery and development. Table 4 and Table 5 show some of the most frequently used in vitro techniques for assessment of human intestinal absorption during drug discovery and development.
Figure 10. Schematic representation of the main routes across the intestinal cell membrane for a drug molecule. A: Passive diffusion via transcellular route, either through the cytoplasmic aqueous phase or along the lipid membranes of the cell124.B: Passive diffusion via paracellular route, in the intestine a potential route for polar molecules with a molecular weight <500 . C: Facilitated and active (energy consuming) transport via carrier systems in the cells. D: Transcytosis, transcellular transport via membrane vesicles. E: Efflux by facilitated and active transport via carrier systems in the cell membranes.
A B C D E
Blood system
Schematic epithelial cells

33
Tab
le 4
. Ove
rvie
w o
f co
mm
on b
iolo
gica
l in
vit
ro t
echn
ique
s fo
r m
odel
ling
hum
an i
ntes
tina
l ab
sorp
tion
of
smal
l dru
g m
olec
ules
.
Tec
hn
iqu
e
Rem
ark
/ap
pli
cati
on
R
efer
ence
s
Bio
logi
cal
mem
bran
es
Usi
ng c
ham
ber,
exc
ised
inte
stin
al s
egm
ents
E
xcis
ed i
ntes
tina
l se
gmen
ts
Ung
ell12
6 b
Eve
rted
int
esti
nal
ring
, sli
ces
or s
acs
Exc
ised
int
esti
nal
segm
ents
T
ukke
r127
b
Cel
l cu
ltur
e m
odel
s
Cac
o-2
cell
mon
olay
ers,
hum
an i
ntes
tina
l m
ucos
al c
ells
C
ultu
red
cell
s, 3
wee
ks g
row
ing
Art
urss
on e
t al
128
b
Mad
in-D
arby
can
ine
kidn
ey c
ell
mon
olay
ers,
(M
DC
K)
C
ultu
red
cell
s, 3
day
s gr
owin
g Ir
vine
et
al12
9 b
Inte
ract
ion
wit
h ce
lls
and
cell
der
ived
ves
icle
s
Isol
ated
int
esti
nal
cell
s In
test
inal
muc
osal
cel
ls
Tuk
ker
127
b
Bru
sh-b
orde
r-m
embr
ane
vesi
cles
P
repa
red
from
cel
l ho
mog
enat
es o
r in
test
inal
scr
apin
gs
Tuk
ker
127
b
Imm
obil
ized
lip
osom
e ch
rom
atog
raph
y V
esic
les
from
red
blo
od c
ells
, red
bl
ood
cell
s/gh
osts
B
eigi
et
al13
0
a Fir
st p
ubli
cati
on
b Rec
ent
revi
ew

34
Tab
le 5
. Ove
rvie
w o
f co
mm
on i
n vi
tro
tech
niqu
es f
or m
odel
ling
hum
an in
test
inal
abs
orpt
ion
of s
mal
l dr
ug m
olec
ules
.
Tec
hn
iqu
e
Rem
ark
/ap
pli
cati
on
R
efer
ence
s
Inte
ract
ion
wit
h li
poso
mes
, ves
icle
s, m
icel
les
and
arti
fici
al m
embr
anes
Nuc
lear
mag
neti
c re
sona
nce
spec
tros
copy
L
ipos
omes
F
rutt
ero
131 b
Sur
face
pla
smon
res
onan
ce
Lip
osom
es
Dan
elia
n et
al13
2 a
Sol
id-s
uppo
rted
lip
id m
embr
anes
(T
RA
NS
IL)
Uni
lam
ella
r li
poso
mal
mem
bran
es
Loi
dl-S
tahl
hofe
n et
al13
3 b
Spe
ctro
scop
ic te
chni
ques
L
ipos
omes
S
anto
s et
al13
4 de
Cas
tro
et a
l135
Equ
ilib
rium
dia
lysi
s L
ipos
omes
(st
anda
rd m
etho
d)
Krä
mer
136
Pot
enti
omet
ric
titr
atio
ns
Lip
osom
es a
nd m
icel
les
Krä
mer
136
b
Ult
rafi
ltra
tion
/ult
race
ntri
fuga
tion
met
hods
L
ipos
omes
K
räm
er13
6 b A
usti
n et
al13
7
Flu
oros
omes
/flu
ores
cenc
e sp
ectr
opho
tom
eter
L
ipos
omes
M
elch
ior13
8
Mic
roca
lori
met
ry
Bil
e ac
id a
ggre
gate
s G
rosv
enor
et
al13
9
Par
alle
l ar
tifi
cial
mem
bran
e pe
rmea
bili
ty a
ssay
M
ixtu
re o
f le
cith
in, o
rgan
ic s
olve
nts
Kan
sy e
t al
140 a
Imm
obil
ised
art
ific
ial
mem
bran
e ch
rom
atog
raph
y
Pho
spho
lipi
d bi
laye
r P
idge
on e
t al
121
a
Imm
obil
ised
lip
osom
e ch
rom
atog
raph
y L
ipos
omes
B
eigi
et
al12
2 a
Mic
ella
r li
quid
chr
omat
ogra
phy
Mic
elle
s M
oler
o-M
onfo
rt e
t al
141
CE
-bas
ed m
etho
ds
Ves
icle
s, l
ipos
omes
, mic
roem
ulsi
ons,
mic
elle
sT
able
3 a
nd 4
, pap
ers
II-V
.a F
irst
pub
lica
tion
b R
ecen
t re
view

35
5.2 Modelling and prediction by CE using liposomes, vesicles, micelles and microemulsions
The ultimate goal of in vitro and in silico methods is to model and predict human drug absorption. Consequently, a complete validation of new in vitro and in silico methods should include direct correlation between in vitro data and human drug absorption data. However, although most in vitro methods and in silico techniques provides high precision data, human absorption data are often significantly more varying. Human drug absorption is a physiological process comprising several mechanisms; see section 5.1. Human drug absorption data reported in the literature are characterised by high variability and low quality and are frequently derived for marketed drugs, which are generally highly absorbed and reasonably well behaved in vivo. It should be realized that new methods may be skewed toward well-behaving drugs. Sigmoidal correlation with human drug absorption data has thus been observed, which complicates prediction of absorption for compounds with very high or low permeability.
Caco-2 cells permeability data are frequently used as a substitute for human drug absorption data during development of in vitro and/or in silico methods142. But most drugs are absorbed in the higher gut, so it is questionable as to how well colon-derived cell lines, such as Caco-2, can model human drug absorption143. Moreover, the junctions of Caco-2 cells are relatively dense, why absorption rates are much slower than in the intestine144.
A benefit from separation techniques, such as CE, is that they model passive transport – without contribution from active transporters or from degrading enzymes that may be found within in vitro cell systems and animals. In addition, the analytical techniques also offer biomimetic conditions such as human body temperature and pH. Moreover, separation techniques are robust, i.e., they generate data with good precision and have high capacity. Comparisons of separation techniques indicate that they generate similar data. For example, it has been reported that the surfactant, used as the lipophilic phase, seem to be more important than the type of the separation technique used to generate the partitioning data102.
The major advantage with the CE technique is that only nanogram amounts of a drug compound are needed, and it is simple to adjust the properties of the electrolyte, for example, by changing the type of surfactant or lipid (papers II, III and IV). Papers IV and V presented a novel method for immobilising liposomes on capillary walls, and immobilised liposome
36
capillaries were used for studies of drug-liposome interactions that use CE-MS (paper V). To further mimic physiological conditions, the applicability of using simulated human intestinal fluid as the electrolyte in CE was investigated, Paper III. In this study, the interactions between components of simulated intestinal fluid, lecithin-cholic acid mixed micelles, and drug molecules were characterized.
There are so far a limited number of studies investigating direct correlation between CE migration data and drug absorption data. Khaledi and co-workers showed high correlation between MEKC log k' for uncharged corticosteroides and intestinal absorption in rat, and between MEKC log k' and protein binding to human serum albumin145. Roses et al have shown correlation between MEKC log k' and narcotic activity towards the tadpole146. However, they reported that MEKC log k' data could not model the rate of skin permeation from water and blood-brain distribution.
Linusson et al showed for eighteen thrombin inhibitors good correlation between MEKC log k' and inhibition of thrombin. In addition, MEKC log k'data for the thrombin inhibitors compounds was also used as an estimate of passive absorption, paper II. Örnskov and co-workers showed good correlation between MEKC log k' for six -blockers to Caco-2 cell permeability, and permeation through intestinal segment of rat ileum and rat colon data147. Recently, Detroyer et al102 also reported good correlation between MEKC log k' and Caco-2 cell permeability data for five -blockers.
Woodrow et al reported for chlorobenzenes that MEEKC data correlated better with water-fish lipid partitioning data than log Poct data61. In addition, Ishihama et al have shown good correlation between MEEKC log k' and toxicity for phenols70, and between MEEKC log k' and human skin permeability for acidic non-steroidal anti-inflammatory drugs105.
In paper III CE migration data for nine -blockers and a set of various drug compounds, obtained at 37 °C using micelles, microemulsions and liposomes, were shown to give high correlations to both Caco-2 cell permeability, permeation through intestinal segment of rat ileum, rat colon data and human absorption data. Interestingly, slightly better correlation to intestinal absorption was found for the tested liposomal systems. In paper VCE migration data for -blockers and a set of various drug compounds, using immobilized liposomes, were shown to correlate to both Caco-2 cell permeability and human absorption data.
In all, there is no doubt that CE is a promising tool for experimental modeling of passive absorption and this application of the CE technique is likely to be further developed.

37
6 Modelling drug-electrolyte interactions in CE using molecular descriptors
Computer-generated models of CE separations may be used in different contexts: fundamental research, method development, and education. For method development, an ultimate goal of computer-generated models is to provide the analytical chemist with a means to simulate and quantitatively predict the migration of new compounds.
The MEKC mode of CE enables fundamental mechanism studies of analyte/drug-electrolyte/micelle interactions because MEKC is a solution-based technique148. Several computer- generated MEKC modelling strategies have been proposed, as recently reviewed by Sentellas et al149.
Many diverse molecular descriptors have been developed for predicting drug molecular permeability, for example, in the human intestinal tract and through the blood brain barrier. But note that molecular properties, such as hydrophobicity, hydrogen bonding, molecular size and dipolar properties, govern passive absorption of drug molecules in the intestinal tract2.Normally, these properties also govern migration of compounds in MEKC separations. So these descriptors could also provide a basis for modelling and predicting interactions between analytes and micellar media in MEKC.
6.1 Molecular descriptors A molecular descriptor is the final result of a mathematical procedure that transforms chemical information encoded within a symbolic representation of a molecule into a useful number150; see Table 6. Constitutional descriptors can be calculated from a 1-dimensional representation of the molecule. Typically, they describe the molecular weight and number of atoms. From a 2-dimensional representation of the molecule, the atom types and functional groups can be used to calculate physicochemical properties, such as hydrogen-bonding capacity, lipophilicity and charge. And topological indexes can be calculated from the 2-dimensional representation of the molecule. The calculations for some descriptors, such as log P, use group contribution that is based on experimentally determined data for certain reference compounds. By using the 3-dimensional structure of a molecule,

38
different spatial arrangement can be famed, and the 3-dimensional structure of a molecule depends on the environment of the molecule. Descriptors generated from the 3-dimensional structure are unique for a particular molecular conformation and are considered to better reflect intramolecular interactions. A single 3-dimensional conformation is usually calculated in a fraction of a second on a computer. But a full search of the entire conformational space for one molecule can require up to several weeks of computer time when using molecular mechanics or molecular dynamics simulations. An accurate description of the electron distribution and the valence properties of the molecule can be obtained by representing the molecule by a wave function. Wave functions are generated by quantum mechanics calculations, which are very time consuming even if only one conformation of the molecular structure is considered. Typical quantum-chemical descriptors are energy-based descriptors, molecular orbital energies and polarisabilities150.
Sophisticated molecular descriptors account for dynamic behaviour and electronic properties of the structure, which may better facilitate understanding of the interaction mechanism. But the lower dimension molecular descriptors are simpler to interpret from a chemical viewpoint. A more extensive review of descriptors and calculation methods can be found elsewhere44, 151, 152, 153.
Four diverse software packages were used to calculate molecular descriptors based on simple and more sophisticated structure representations (paper VI). All these generated descriptors are commonly used for quantitative structure-activity relationships (QSAR) studies. Molecular descriptors based on simple structure representations were also used in papers II and III for QSAR studies.

39
Table 6. A schematic overview of molecular descriptors
Representation Example of molecular descriptors
Generated by calculation procedure / software
References
1D structure C14H22N2O3
Molecular weight Number of atoms Number of bonds
CountsSaSA
154
2D structure Flexibility Rigidity Hydrogen bond acceptorsHydrogen bond donatorsLog P
Connectivity, element and fragment parameters SaSA
154
3D structure Surface properties Molecular shape LipophilicityIntegy moment
Force field and semi empirical Volsurf
155
Polarizability Log P HardnessOrbital energies
Semi empirical Spartan
156
Surface properties
PolarizabilityHydrogen bond propertiesAcid-base properties Orbital energies
Ab initio Molsurf
157
aSemi empirical molecular orbital calculations
6.2 Chemometric modelling Chemometrics involves experimental design and multivariate analysis methods, i.e., mathematical and statistical methods for modelling and data evaluation.
O
R3
OH
NHR2
R1

40
The data structure can be represented in 1- and 2-dimensional plots by using multivariate analysis methods, such as principal component analysis (PCA)158, partial least-squares projections to latent structures (PLS)159, and hierarchical analysis160. A formal description of these methods can be found elsewhere. For hierarchical analysis, see Eriksson et al and references therein161 and for PCA and PLS, see Martens162 and Brereton163.
Statistical design of experiments, developed by Fisher in 1926164, is a methodology that provides efficient experimentation. In paper II, a set (library) of thrombin inhibitor compounds was synthesised according to a design based on three building blocks connected to the same scaffold. These compounds were then analysed using QSAR with respect to inhibition of thrombin and bioavailability.
6.3 Prediction of migration from molecular descriptors In paper VI, analyte migration in MEKC was predicted using molecular descriptors for both analyte model compounds and separation media. Investigated micellar media comprised sodium dodecyl sulphate, bile acids and the positively charged surfactant cetyltrimethylammonium bromide. Five uncharged alkyl phenyl ketones and nineteen charged -blockers were used as model analytes. Various molecular descriptors for the analytes and the media surfactants, based on simple and more sophisticated structure representations, were calculated. PCA and PLS were used for multivariate analysis modelling and prediction of analyte migration.
Introduction of micellar media molecular descriptors enables calculation of one single global model that is valid for several micellar media. Prediction of MEKC migration by the global model was equal to or even better than by any local model. So the approach of using a combination of analyte and micellar media descriptors better models MEKC migration. But note that molecular descriptors for separation media, in paper VI, were delimited to representation of the surfactant monomers and not the entire micellar aggregates.
Use of hierarchical multivariate PLS modelling highly simplified interpretation of parameters that govern the separation. The analysis of the models revealed that media descriptors, such as critical packing, were important in the models based on -blocker analytes. The descriptors generated by the Volsurf calculation procedure were found to best model MEKC separation. And the hierarchical multivariate analysis enabled simple comparison of many molecular descriptors.
The molecular descriptors used in paper VI are commonly used for prediction of gastrointestinal absorption properties of small drug compounds

41
but were also shown to be highly useful for modelling and prediction of MEKC migration. Paper VI proposed that MEKC separations could also be used to validate the representativeness of such molecular descriptors for molecular behaviour in complex liquid media, e.g., physiological systems. Further exploration of the presented approach should comprise experimentally designed sets of extended analyte diversity and a wider range of electrolyte conditions.

42
7 Concluding remarks and future work
The studies conducted within this thesis emphasise the potential of CE for physicochemical and biopharmaceutical characterisation of drug molecules. A main feature of CE is that only nanogram amount of drug compound is required for analysis. Determination of acid-base properties by CE is today in routine use. A general CE methodology was here developed that enabled determination of pKa for labile compounds, which was missing. The CE methodology for characterisation of lipophilic properties of drug compounds is also well developed today. Still, new applications may be further explored such as enantioselective lipophilic characterisation of drug molecules.
In spite of this, the use of CE for biopharmaceutical characterisation is still in its infancy. The utility of CE for experimental modelling of passive intestinal absorption was evaluated in this thesis - for microemulsion, micellar and liposomal electrolytes. Interestingly, slightly better correlation to intestinal absorption was found for liposomal systems. This should be further investigated by testing various liposome compositions and wider sets of model drug compounds.
Immobilization of liposomes extends the utility of CE for estimating passive intestinal absorption. This novel approach developed here enabled direct on-line coupling of liposome CE to high sensitivity mass spectrometry. Further exploration of liposome CE for biopharmaceutical profiling of drug compounds should include extending the immobilized liposomes to incorporate cell membrane proteins. This would enable characterisation of interactions between drug molecules and proteins in the CE-MS format.
Utilising molecular descriptors, commonly applied to in silico prediction of passive intestinal membrane permeability, migration of analytes in MEKC could be well predicted. This novel approach was based on hierarchical multivariate analytics and use of molecular descriptors for both analytes and micellar media surfactants. Future work may include using analyte and media molecular descriptors also for more complex systems such as liposome CE. Besides, modelling separation in CE systems should be based on using experimentally designed sets of model compounds and separation conditions.
43
8 Acknowledgements
Many persons helped me realise this project. I especially thank: My supervisors: Staffan Folestad, for many inspirational discussions,
patient guidance in scientific methodology and for always delivering fantastic quick-witted formulations at the last minute. Karin Markides, for encouraging, constructive criticism of my oral presentations and for making me feel at home at the department of Analytical Chemistry in Uppsala.
AstraZeneca represented in an interesting, generous way by: Magnus Erickson, Anna-Maria Tivert and Walter Lindberg.
My co-authors, Anna Linusson, Erik Johansson and Johan Gottfries for guidance in the multivariate scientific world, Sara Ullsten for productive collaboration, and Katarina Edwards and Göran Karlsson for generously sharing your knowledge about liposomes.
Anna Tivesten for valuable advice and friendship. All friends and colleagues at Substance Analysis in Mölndal, and all
current and former PhD students at Analytical Chemistry in Uppsala! Yudong Wang, Jonas Sjöblom and Jörgen Månendahl for Excel macros. Jan-Erik Löfroth, Anna-Lena Ungell, Katrin Palm and Ismael Zamora for
generous lending of literature and interesting discussions, and Jan-Erik for taking the time to measure the size of the liposomes!
Edmund Kostewicz and Cornelia Krumkühler for synthetic intestinal media. Hanna Larsson and Erik Wernersson for pleasant collaboration.
Judy Petersen for copyediting and useful advice about scientific writing. Marit Andersson, Eva Heldin, Rolf Pettersson, Jean Pettersson and Leif
Nyholm at Analytical Chemistry in Uppsala for patiently answering millions of questions during the years I educated the Uppsala students!
Barbro Nelson, Yngve Öst, Erik Forsman and Bo Fredriksson at Analytical Chemistry in Uppsala, for administrational and practical support. Marie Dahlström, Eva Lindh and Marita Nelin at AstraZeneca Mölndal for help with travel arrangements. Agneta Svantesson, Lars Svensson, Leif Hallnéus (specially for battery supply), Bert Lindén and Bengt Lagerholm at AstraZeneca in Mölndal for handy technical support.
My parents, brothers and sister with families and all old and new friends! My husband Lars for full support and love and my lovely daughter Vilma
for being the sunshine in my life!

44
9 Swedish summary
Fysikalkemisk och biofarmaceutisk karakterisering av läkemedelsmolekyler med kapillärelektrofores
Att utveckla nya läkemedel har historiskt sett tagit lång tid. Det finns exempel på att det kan ta tio till tjugo år från idé till dess att den färdiga produkten blir tillgänglig för patienten. En av utmaningarna vid läkemedelsutveckling är att kunna designa den aktiva substansen så att den utöver god effekt även absorberas väl genom tarmväggen. Detta för att läkemedlet ska ge optimal terapeutisk effekt. De sista tio åren har ett antal experimentella och teoretiska tekniker utvecklats med syftet att bättre kunna karakterisera de aktiva substansernas absorptionsegenskaper på ett tidigt stadium. Utvecklingen av de nya experimentella teknikerna har i hög grad styrts av att nya tekniker för syntetisering av aktiv substans genererar ett mycket stort antal substanser men samtidigt små mängder av varje substans. En fördel med teoretiska metoder är att prediktion av absorptionsegenskaper kan utföras utan att ens molekylen behöver syntetiseras. Traditionellt behöver de teoretiska metoderna fortfarande stöd av experimentella data för att prediktionerna av absorptionsegenskaper ska bli tillräckligt bra. Sålunda finns det behov av nya experimentella metoder som använder så små mängder substans som möjligt och dessutom har god analyskapacitet (stort antal prover per tidsenhet). Här erbjuder tekniken kapillärelektrofores (CE) flera fördelar: mycket små mängder substans behövs för analys (nanogram) samt att tekniken ger data med hög precision och riktighet. Dessutom är CE lätt att automatisera och det finns idag kommersiella CE-instrument med hög analyskapacitet.
Arbetet i denna avhandling har innefattat en granskning av fördelar och nackdelar med att använda analystekniken CE för fysikalkemisk och biofarmaceutisk karakterisering av läkemedelsmolekyler. Karakteriseringen baserades på CE-studier av läkemedelmolekylernas migrationsbeteende i olika elektrolytsystem. Här studerades elektrolyter innehållande enbart buffert, samt elektrolyter innehållande buffert och mikroemulsioner, miceller eller liposomer.
En första delstudie innefattade hur pKa (syrakonstaten) kan bestämmas med hjälp av CE även för instabila och delvis nedbrutna substanser. Detta
45
arbete resulterade i en generell metodik som baseras på; stabil provmatris, injektion med elektromigration, minimerad analystid genom att använda en mycket kort del av separationskapillärens totala längd, samt identifiering av molekylerna med spektrofotometrisk detektion. Den föreslagna metodiken tillämpades med framgång för två set av läkemedelssubstanser som var instabila vid lågt respektive högt pH.
Nästa delstudie innefattade modellering och prediktering av passiv läkemedelsabsorption från experimentella CE-data. Migrationsbeteendet för läkemedelsmolekyler studerades i elektrolyter innehållande miceller, mikroemulsioner och liposomer. Migrationsdata korrelerades mot humana absorptionsdata, och estimat av human absorption såsom Caco-2-cellsdata. Caco-2-data genereras genom att mäta hur väl läkemedelsmolekyler penetrerar Caco-2-celler. Dessa celler kommer ursprungligen från människans tarmvägg. Korrelationsstudierna visade att CE-data korrelerar bra till humana absorptionsdata och Caco-2-cellsdata.
De migrationsdata som var baserade på användandet av liposomer i CE korrelerade något bättre till Caco-2-cellsdata. Detta indikerar att molekylers fördelning till liposomer kan vara en extra intressant modell för humana cellmembran. Genom att belägga CE-kapillärens innersida med liposomer utökas möjligheterna att använda CE för att prediktera absorptions egenskaper. Metoden för att belägga CE kapillärens innersida med liposomer är baserat på ett helt nytt koncept som här visas för första gången. Metoden är baserad på elektrostatisk immobilisering av liposomer på en underliggande laddad agarosyta. Kapillärer belagda med liposomer möjliggör direktkoppling av CE till masspektrometrisk detektion, vilket ger högre känslighet och ökad selektivitet.
Det yttersta målet med utveckling av nya in vitro- och in silico-metoder är att kunna förutsäga absorptionsegenskaper hos nya läkemedelsmolekyler. En komplett validering av nya metoder bör därför utföras mot humana absorptionsdata. Ett problem är emellertid att humana absorptionsdata ofta har stor spridning, medan flertalet in vitro tekniker ger hög precision i data. Därför används ofta så kallade Caco-2-data som ett substitut för humana absorptionsdata.
En avslutande delstudie bestod av kemometrisk modellering av CE-migrering i micellelektrolyt med hjälp av molekylära deskriptorer både för analyterna och för surfaktanterna i micelllektrolyten. Användning av molekylära deskriptorer även för micellelektrolyten vid modellering av analysseparationer visades här för första gången. Generellt styrs human absorption av molekylens lipofilicitet, vätebindningsförmåga, storlek och polaritet vilket även är de parametrar som styr fördelning till miceller i en CE-separation. För att kunna nyttja och utvärdera ett mycket stort antal molekylära deskriptorer, användes multivariat statistisk hierarkisk

46
modellering. De molekylära deskriptorerna som användes är vanliga vid teoretiska modelleringar och predikteringar av human absorption. Studien innefattade här prediktering av CE-migrationsdata för laddade och oladdade substanser i olika micellelektrolyter. Därför föreslås i avhandlingen att CE skulle kunna användas för att utvärdera hur representativa avancerade molekylära deskriptorer är för att beskriva en molekyls beteende i mer komplexa media, såsom fysiologiska system.

47
10 Abbreviations, acronyms and terms
AP acetophenone
BSAP benzenesulfonic acid phenethyloxy-phenyl esters
BP butyrophenone
CE capillary electrophoresis
CZE capillary zone electrophoresis
EOF electroosmotic flow
HP hexanophenone
HTS high throughput screening
in silico techniques using computer (virtual) chemistry
in vitro techniques using biological-derived material
in vivo techniques using intact organisms or parts of the organisms
log D logarithm of distribution coefficient
log k' logarithm of corrected retention factor
log Pow logarithm of partition coefficient (octanol/water)
MEEKC microemulsion electrokinetic chromatography
MEKC micellar electrokinetic chromatography
pH negative logarithm of hydrogen concentration
PMSB pyridinyl-methyl-sulfinyl-benzimidazoles
PP propiophenone
UV-Vis ultraviolet-visible absorption
VP valerophenone

48
11 Symbols
A hydrated ion size parameter
fraction of the solute ionised
A Debye-Hückel constant
A- fully deprotonated acid specie
B neutral base specie
B Debye-Hückel constant
BH+ fully protonated base specie
C degree of Celsius
Csurf total surfactant concentration
CMC critical micelle concentration
ci concentration
HA protonated acid specie
H hydrogen ion activity
H+ hydrogen
I ionic strength
j analyte present in the solution
K distribution coefficient
k' corrected retention factor
Kath thermodynamic dissociation constant
activity coefficients
HA activity coefficient of the undissociated acid
A- activity coefficient of the anionic specie
H+ activity coefficient of the hydrogen ion
Ltot total length of the capillary
Leff length of the capillary to the detection window

49
background electrolyte viscosity
P pressure drop over the capillary
pKath negative logarithm of thermodynamic dissociation constant
pKa negative logarithm of concentration dissociation constant
Q
constant corresponding to
(0.5085 z2 I)/(1 + 0.3281 a I)
r internal radius of the capillary
t injection time
tapp migration time of the ionic specie
tEOF migration time of a compound migrating with the electroosmotic flow
µapp apparent mobility
µeff effective electrophoretic mobility
µEOF
effective electrophoretic mobility of electrolyte medium/electroosmotic mobility
µmc mobility of the micellar phase
µion ionic mobility
µb electrophoretic mobility of the fully protonated species BH+
µa electrophoretic mobility of the fully deprotonated species A-
partial molar volume of micellar phase
V applied voltage
Vmc volumes of the micellar phase
Vaq volumes of aqueous phase
Vs injected volume
xi molar fraction
Z charge of the ion

50
12 References
1. Shargel, L., Yu, A., Applied biopharmaceutics & Pharmacokinetics. Mehalik, C. L.,
Ed. Fourth ed., Appleton & Lange, New York, (1999).
2. Dressman, J. B., Lennernäs, H., in Drugs and the Pharmaceutical Sciences
Swarbrick, J., Ed. Marcel Dekker, New York, (2000), vol. 106, pp. 330.
3. Lipinski, C. A., Lombardo, F., Dominy, B. W., Feeney, P. J., Adv. Drug Deliv. Revi.
23, 3-25 (1997).
4. Ekins, S., Waller, C. L., Swaan, P. W., Cruciani, G., Wrighton, S. A., Wikel, J. H.,
J. Pharmacol. Toxicol. Methods 44, 251-272 (2000).
5. Stenberg, P., Luthman, K., Artursson, P., J. Controlled Release 65, 231-243 (2000).
6. Terstappen, G. C., Reggiani, A., Trends Pharmacol. Sci. 22, 23-26 (2001).
7. Altria, K. D., Ed., Capillary Electrophoresis Guidebook, vol. 52 Humana Press,
New Jersey, (1996).
8. Winefordner, J. D., Ed., Chemical analysis a series of monographs on analytical
chemistry and its applications., vol. 146 John Wiley & Sons, New York, (1998).
9. Weinberger, R., Practical Capillary Electrophoresis Second ed., ACADEMIC
Press, London, (2000).
10. Kleparnik, K., Bocek, P., J. Chromatogr. B 569, 3-42 (1991).
11. Copper, C. L., J. Chem. Educ. 75, 343-347 (1998).
12. Tagliaro, F., Manetto, G., Crivellente, F., Smith, F. P., Forensic Sci. Int. 92, 75-88
(1998).
13. Altria, K. D., J. Chromatogr. 856, 443-463 (1999).
14. Manetto, G., Crivellente, F., Tagliaro, F., Ther. Drug Monit. 22, 84-88 (2000).
15. Vesterberg, O., J. Chromatogr. 480, 3-19 (1989).
16. Vesterberg, O., Electrophoresis 14, 1243-9 (1993).
17. Huikko, K., Kostiainena, R., Kotiaho, T., Eur. J. Pharm. Sci. 20, 149-171 (2003).
18. Xu, W., Uchiyama, K., Shimosaka, T., Hobo, T., J. Chromatogr. 907, 279-289
(2001).
19. Wong, K.-S., Kenseth, J., To be submitted.
20. Holland, L. A., Leigh, A. M., Electrophoresis 24, 2935-2939 (2003).
21. Albert, A., Serjeant, E. P., in The Determination of Ionization Constants. Chapman
and Hall, New York, (1984) pp. 141-154.
22. Morgan, M. E., Liu, K., Anderson, B. D., J. Pharm. Sci. 87, 238-245 (1998).
23. Hardcastle, J. E., Jano, I., J. Chromatogr. B 717, 39-56 (1998).
24. Ando, H. Y., Heimbach, T., J. Pharm. Biomed. Anal 16, 31-37 (1997).

51
25. Barbosa, J., Barron, D., Cano, J., Jimenez-Lozano, E., Sanz-Nebot, V., Toro, I., J.
Pharm. Biomed. Anal. 24, 1087-1098 (2001).
26. Beckers, J. L., Everaerts, F. M., Ackermans, M. T., J. Chromatogr. 537, 407-428
(1991).
27. Cai, J., Smith, J. T., Rassi, Z. E., J. High Resolut. Chromatogr. 15, 30-32 (1992).
28. Cleveland, J. A., Jr., Benko, M. H., Gluck, S. J., Walbroehl, Y. M., J. Chromatogr.
652, 301-8 (1993).
29. Ishihama, Y., Oda, Y., Asakawa, N., J. Pharm. Sci. 83, 1500-7 (1994).
30. Gluck, S. J., Steele, K. P., Benko, M. H., J. Chromatogr. 745, 117-125 (1996).
31. Smith, S. C., Khaledi, M. G., Anal. Chem. 65, 193-8 (1993).
32. Knox, J. H., J. Chromatogr. 680, 3-13 (1994).
33. Pospichal, J., Gebauer, P., Bocek, P., Chemical Reviews 89, 419-430 (1989).
34. Albert, A., Serjeant, E. P., in The Determination of Ionization Constants. Chapman
and Hall, New York, (1984) pp. 26-53.
35. Sheng, C. L., Zhou, X., Jin, S., Chromatographia 46, 555-559 (1997).
36. Örnskov, E., Folestad, S., in Symposium on High Performance Liquid Phase Micro
Separations Abstracts of Posters. Swedish Academy of Pharmaceutical Sciences,
Lund, Sweden, (1998) pp. 16.
37. Takayanagi, T., Motomizu, S., Chem. Lett 1, 14-15 (2001).
38. Ishihama, Y., Nakamura, M., Miwa, T., Kajima, T., Asakawa, N., J. Pharm. Sci. 91,
933-942 (2002).
39. Brändstrom, A., Lindberg, P., Bergman, N. A., Alminger, T., Ankner, K., Junggren,
U., Lamm, B., Nordberg, P., Erickson, M., et al., Acta Chemica Scandinavica 43,
536-548 (1989).
40. Brändström, A., Bergman, Å., Grundevik, I., Johansson, S., Tekenbergs-Hjelte, L.,
Ohlson, K., Acta Chem. Scand. 43, 569-576 (1989).
41. Wan, H., Holmén, A., Någård, M., Lindberg, W., J. Chromatogr. A 979, 369-377
(2002).
42. Wan, H., Holmen, A. G., Wang, Y., Lindberg, W., Englund, M., Någård, M. B.,
Thompson, R. A., Rapid Commun. Mass Spectrom. 17, 1-10 (2003).
43. Pliška, V., Testa, B., van de Waterbeemd, H., Ed., Lipophilicity in drug action and
toxicology, vol. 4 1 ed., VCH, Weinheim, (1996).
44. Testa, B., van de Waterbeemd, H., Folkers, G., Guy, R., Ed., Pharmacokinetic
optimization in drug research: biological, physicochemical, and computational
strategies Wiley-VCH, Weinheim, (2001).
45. Nasal, A., Siluk, D., Kaliszan, R., Curr. Med. Chem. 10, 381-426 (2003).
46. Caron, G., Reymond, F., Carrupt, P.-A., Girault, H. H., Testa, B., Pharm Sci
Technol Today 2, 327-335 (1999).
47. Carlsson, K., Karlberg, B., Anal. Chim. Acta 423, 137-144 (2000).
48. Terabe, S., Otsuka, K., Ichikawa, K., Tsuchiya, A., Ando, T., Anal. Chem. 56, 111-
113 (1984).
49. Terabe, S., Otsuka, K., Ando, T., Anal. Chem. 57, 834-841 (1985).

52
50. Ong, C. P., Ng, C. L., Chong, N. C., Lee, H. K., Li, S. F. Y., J. Chromatogr. 516,
263-270 (1990).
51. Evans, D. F., Wennerström, H., Bilayers show rich variation with respect to local
chemical structure and global folding. Evans, D. F., Wennerström, H., Ed., The
Colloidal Domain Where Physics, Chemistry, Biology and Technology Meet VCH
Publishers, , New York, (1994).
52. Shaw, D. J., Introduction to colloid and surface chemistry Third ed., Butterworth &
Co., London, (1980).
53. Watarai, H., Chem. Lett. 231, 391-394 (1991).
54. Khaledi, M. G., Smith, S. C., Strasters, J. K., Anal. Chem. 63, 1820-30 (1991).
55. Strasters, J. K., Khaledi, M. G., Anal. Chem. 63, 2503-8 (1991).
56. Bushey, M. M., Jorgenson, J. W., Anal. Chem. 61, 491-493 (1989).
57. Bushey, M. M., Jorgenson, J. W., J. Microcolumn Sep. 1, 125-130 (1989).
58. Muijselaar, P., Claessens, H. A., Cramers, C. A., Anal. Chem. 66, 635-644 (1994).
59. Dittmann, M. M., Masuch, K., Rozing, G. P., J. Chromatogr. A.. 887, 209-221
(2000).
60. Trone, M. D., Leonard, M. S., Khaledi, M. G., Anal. Chem. 72, 1228-1235 (2000).
61. Woodrow, B. N., Dorsey, J. G., Environ. Sci. Technol. 31, 2812-2820 (1997).
62. Detroyer, A., Vander Heyden, Y., Carda-Broch, S., Garcia-Alvarez-Coque, M. C.,
Massart, D. L., J. Chromatogr. A 912, 211-221 (2001).
63. Kaliszan, R., Trac-Trends Anal. Chem 18, 400-410 (1999).
64. Takeda, S., Wakida, S., Yamane, M., Kawahara, A., Higashi, K., Anal. Chem. 65,
2489-2492 (1993).
65. Chen, N., Zhang, Y., Terabe, S., Nakagawa, T., J. Chromatogr. A 678, 327-332
(1994).
66. Schmutz, A., Thormann, W., Electrophoresis 15, 1295-303 (1994).
67. Greenaway, M., Okafo, G., Manallack, D., Camilleri, P., Electrophoresis 15, 1284-
1289 (1994).
68. Jinno, K., Sawada, Y., J. Capillary Electrophor. 1, 106-111 (1994).
69. Herbert, B. J., Dorsey, J. G., Anal. Chem. 67, 744-749 (1995).
70. Ishihama, Y., Oda, Y., Uchikawa, K., Asakawa, N., Anal. Chem. 67, 1588-1595
(1995).
71. Smith, J. T., Vinjamoori, D. V., J. Chromatogr. B 669, 59-66 (1995).
72. Adlard, M., Okafo, G., Meenan, E., Camilleri, P., J. Chem. Soc. Chem. Com., 2241-
2243 (1995).
73. Jinno, K., Sawada, Y., J. Liq. Chromatogr. 18, 3719-3727 (1995).
74. Benito, I., Garcia, M., Diezmasa, J., Marina, M., Journal of Microcolumn
Separations 9, 87-95 (1997).
75. Yang, S., Bumgarner, J. G., Kruk, L. F., Khaledi, M. G., J. Chromatogr. A 721, 323-
35 (1996).
76. Wiedmer, S. K., Riekkola, M. L., Nyden, M., Soderman, O., Anal. Chem. 69, 1577-
1584 (1997).

53
77. Lin, C. E., Chen, Y. C., Chang, C. C., Wang, D. Z., J. Chromatogr. 775, 349-357
(1997).
78. Dinelli, G., Mallegni, R., Vicari, A., Electrophoresis 18, 214-219 (1997).
79. Winefordner, J. D., Ed., Chemical Analysis A Series of Monographs on Analytical
Chemistry and Its Applications, vol. 146 John Wiley & Sons, New York, (1998).
80. Ferguson, P. D. G., D. M.; Loran, J. S., Anal. Chem. 70, 4054-4062 (1998).
81. Chen, Y.-C., Lin, C.-E., J. Chromatogr. A 802, 95-105 (1998).
82. Hanna, M., Debiasi, V., Bond, B., Salter, C., Hutt, A. J., Camilleri, P., Anal. Chem.
70, 2092-2099 (1998).
83. Wu, Y. S., Lee, H. K., Li, S. F. Y., Electrophoresis 19, 1719-1727 (1998).
84. Mrestani, Y., ElMokdad, N., Ruttinger, H. H., Neubert, R., Electrophoresis 19,
2895-2899 (1998).
85. Lin, C.-E., Hsueh, C.-C., Wang, T.-Z., Chiu, T.-C., Chen, Y.-C., J. Chromatogr. A
835, 197-207 (1999).
86. Freitag, D., Schmitt-Kopplin, P., Simon, R., Kaune, A., Kettrup, A., Electrophoresis
20, 1568-1577 (1999).
87. Wall, W. E., Allen, D. J., Denson, K. D., Love, G. I., Smith, J. T., Electrophoresis
20, 2390-2399 (1999).
88. Ishihama, Y., Asakawa, N., J. Pharm. Sci. 88, 1305-1312 (1999).
89. Idei, M., Gyorffy, E., Kiss, E., Orfi, L., Seprodi, J., Tamas, B., Hollosy, F.,
Meszaros, G., Keri, G., Electrophoresis 20, 1561-1567 (1999).
90. Kodama, S., Yamamoto, A., Matsunaga, A., Toriba, A., Hayakawa, K., Analyst 125,
1555-1559 (2000).
91. Mrestani, Y., Neubert, R., J. Chromatogr. 871, 439-448 (2000).
92. Pascoe, R. J., Peterson, A. G., Foley, J. P., Electrophoresis 21, 2033-2042 (2000).
93. Mrestani, Y., Janich, M., Ruttinger, H. H., Neubert, R. H. H., J. Chromatogr. 873,
237-246 (2000).
94. Zhao, R., Shan, Y., Liu, Z., Zou, H., Zhang, Y., Am. Lab. 32, 13-14 (2000).
95. Bailey, D. J., Dorsey, J. G., J. Chromatogr. 919, 181-194 (2001).
96. Idei, M., Kiss, E., Hollosy, F., Tamas, B., Orfi, L., Seprodi, J., Meszaros, G., Keri,
G., J. Liq. Chrom. & Rel. Technol. 24, 303-315 (2001).
97. Mrestani, Y., Marestani, Z., Neubert, R. H. H., Electrophoresis 22, 3573-3577
(2001).
98. Mrestani, Y., Marestani, Z., Neubert, R. H. H., J. Pharm. Biomed. Anal. 26, 883-889
(2001).
99. Lucangioli, S. E., Carducci, C. N., Tripodi, V. P., Kenndler, E., J. Chromatogr. B
765, 113-120 (2001).
100. Gavenda, A., Bednar, P., Bartak, P., Adamovsky, P., Sevcik, J., Tzoumas, P.,
Ulrichova, J., J. Sep. Sci 15, 225-234 (2002).
101. Taillardat-Bertschinger, A., Carrupt, P.-A., Testa, B., Eur. J. Pharm. Sci. 15, 225-
234 (2002).
54
102. Detroyer, A., Heyden, Y., Cambre, I., Massart, D., J. Chromatogr. A 986, 227-238
(2003).
103. Watarai, H., Ogawa, K., Abe, M., Monta, T., Takahashi, I., Anal. Sci. 7 (1991).
104. Gluck, S. J., Benko, M. H., Hallberg, R. K., Steele, K. P., J. Chromatogr. 744, 141-
146 (1996).
105. Ishihama, Y., Oda, Y., Asakawa, N., Anal. Chem. 68, 1028-1032 (1996).
106. Ishihama, Y., Oda, Y., Asakawa, N., Anal. Chem. 68, 4281-4284 (1996).
107. Abraham, M. H., Treiner, C., Roses, M., Rafols, C., Ishihama, Y., J. Chromatogr.
752, 243-249 (1996).
108. Watarai, H., Takahashi, I., Anal. Comm. 35, 289-292 (1998).
109. Altria, K. D., J. Chromatogr. 892, 171-186 (2000).
110. Poole, S. K., Durham, D., Kibbey, C., J. Chromatogr. B 745, 117-126 (2000).
111. Furumoto, T., Fukumoto, T., Sekiguchi, M., Sugiyama, T., Watarai, H.,
Electrophoresis 22, 3438-3443 (2001).
112. Klotz, W. L., Schure, M. R., Foley, J. P., J. Chromatogr. 930, 145-154 (2001).
113. Nakamura, H., Sugiyama, I., Sano, A., Anal. Sci. 12, 973-975 (1996).
114. Burns, S. T., Khaledi, M. G., J. Pharm. Sci. 91, 1601-1612 (2002).
115. Burns, S. T., Agbodjan, A. A., Khaledi, M. G., J. Chromatogr. A 973, 167-176
(2002).
116. Hong, M., Weekley, B. S., Grieb, S. J., Foley, J. P., Anal. Chem. 70, 1394-1403
(1998).
117. Agbodjan, A. A., Bui, H., Khaledi, M. G., Langmuir 17, 2893-2899 (2001).
118. Razak, J. L., Cutak, B. J., Larive, C. K., Lunte, C. E., Pharm. Res. 18, 104-111
(2001).
119. Klotz, W. L., Schure, M. R., Foley, J. P., J. Chromatogr. Volume 962, 207-219
(2002).
120. Lee, T. H., Aguilar, M. L., Adv. Chromatogr. 41, 175-201 (2001).
121. Pidgeon, C., Ong, S., Liu, H., Qiu, X., Pidgeon, M., Dantzig, A. H., Munroe, J.,
Hornback, W. J., Kasher, J. S., Glunz, L., et al., J. Med. Chem. 38, 590-4 (1995).
122. Beigi, F., Yang, Q., Lundahl, P., J. Chromatogr. A 704, 315-21 (1995).
123. Ganong, W. F., Review of Medical Physiology fifteenth ed., Prentice-Hall
International Connecticut, (1991).
124. Krämer, S. D., Pharm Sci Technol Today 2, 373-380 (1999).
125. Rang, H. P., Ritter, J. M., Dale, M. M., Pharmacology Fourth ed., Churchill
Livingstone, New York, (1999).
126. Ungell, A. L., Drug Dev. Ind. Pharm. 23, 879-892 (1997).
127. Tukker, J. J., in Oral Drug Absorption: Prediction and Assessment Dressman, J. B.,
Lennernäs, H., Eds. Marcel Dekker, , New York, (2000), vol. 106, pp. 51-72.
128. Artursson, P., Palm, K., Luthman, K., Adv. Drug Deliv. Revi. 46, 27-43 (2001).
129. Irvine, J. D., Takahashi, L., Lockhart, K., Cheong, J., Tolan, J. W., Selick, H. E.,
Grove, J. R., J. Pharm. Sci. 88, 28-33 (1999).
55
130. Beigi, F., Gottschalk, I., Hagglund, C. L., Haneskog, L., Brekkan, E., Zhang, Y. X.,
Österberg, T., Lundahl, P., Int. J. Pharm. 164, 129-137 (1998).
131. Fruttero, R., in Pharmacokinetic optimization in drug research: biological,
physicochemical, and computational strategies Testa, B., van de Waterbeemd, H.,
Folkers, G., Guy, R., Eds. Wiley-VCH, Weinheim, (2001) pp. 465-482.
132. Danelian, E., Karlen, A., Karlsson, R., Winiwarter, S., Hansson, A., Lofas, S.,
Lennernäs, H., Hamalainen, M. D., J. Med. Chem. 43, 2083-2086 (2000).
133. Loidl-Stahlhofen, A., Hartmann, T., Schottner, M., Rohring, C., Brodowsky, H.,
Schmitt, J., Keldenich, J., Pharm. Res. 18, 1782-1788 (2001).
134. Santos, N. C., Prieto, M., Castanho, M., Biochim. Biophys. Acta-Biomembr 1612,
123-135 (2003).
135. de Castro, B., Gameiro, P., Lima, J., Matos, C., Reis, S., Lipids 36, 89-96 (2001).
136. Krämer, S. D., in Pharmacokinetic optimization in drug research: biological,
physicochemical, and computational strategies Testa, B., van de Waterbeemd, H.,
Folkers, G., Guy, R., Eds. Wiley-VCH, Weinheim, (2001) pp. 401-428.
137. Austin, R. P., Barton, P., Davis, A. M., Manners, C. N., Stansfield, M. C., J. Pharm.
Sci. 87, 599-607 (1998).
138. Melchior, D., J Pharm Sci. 91, 1075-1079 (2002).
139. Grosvenor, M. P., Löfroth, J. E., Pharm. Res. 12, 682-6 (1995).
140. Kansy, M., Senner, F., Gubernator, K., J. Med. Chem. 41, 1007-1010 (1998).
141. Molero-Monfort, M., Escuder-Gilabert, L., Villaneuva-Camanas, R. M., Sagrado, S.,
Medina-Hernandez, M. J., J. Chromatogr. B 753, 225-236 (2001).
142. Borchardt, R. T., in Pharmacokinetic optimization in drug research: biological,
physicochemical, and computational strategies Testa, B., van de Waterbeemd, H.,
Folkers, G., Guy, R., Eds. Wiley-VCH, Weinheim, (2001) pp. 117-126.
143. Coleman, R. A., Bowen, W. P., Baines, I. A., Woodrooffe, A. J., Brown, A. M.,
Drug Discov.Today 6, 1116-1126 (2001).
144. Barthe, L., Woodley, J., Houin, G., Fundam. Clin. Pharmacol. 13, 154-168 (1999).
145. Yang, S. Y., Bumgarner, J. G., Kruk, L. F. R., Khaledi, M. G., J. Chromatogr. 721,
323-335 (1996).
146. Roses, M., Rafols, C., Bosch, E., Martinez, A. M., Abraham, M. H., J. Chromatogr.
845, 217-226 (1999).
147. Örnskov, E., Gottfries, J., Markides, K., Folestad, S., Correlation of drug absorption
with migration data from capillary electrophoresis using micellar electrolytes, 21ST
International Symposium on Capillary Chromatography & Electrophoresis, Park
City, Utah, USA (1999).
148. Kelly, K. A., Burns, S. T., Khaledi, M. G., Anal. Chem. 73, 6057 -6062 (2001).
149. Sentellas, S., Saurina, J., J. Sep. Sci 26, 875-885 (2003).
150. Todeschini, R., Consonni, V., Handbook of molecular descriptors. Mannhold, R.,
Kubinyi, H., Timmerman, H., Ed., Methods and principles in medicinal chemistry
Wiley-VCH, Toronto, (2000), vol. 11.

56
151. Lipkowitz, K. B., Boyd, D. B., Ed., Reviews in Computational Chemistry VCH
Publishers, Indianapolis, (1995-2000).
152. von Ragué Schleyer, P., Ed., Encyclopedia of Computational Chemistry John Wiley
& Sons, Chichester, (1998).
153. Hansch, C., Leo, A., Exploring QSAR Fundamentals and Applications in Chemistry
and Biology. Heller, S. R., Ed., ACS Professional Reference Book 1 ed., American
Society, Washington, (1995).
154. Olsson, T., Shcherbukhin, V. AstraZeneca R&D Mölndal, Sweden, Mölndal, (1997-
2000).
155. Crivori, P., Cruciani, G., Carrupt, P. A., Testa, B., J. Med. Chem. 43, 2204-2216
(2000).
156. Stewart, J. J. P., in Reviews in computational chemistry Lipkowitz, K. B., Boyd, D.
B., Eds. VCH Publishers New York, (1990), vol. I, pp. 45-81.
157. Norinder, U., Svensson, P., J. Comput. Chem. 19, 51-59 (1998).
158. Jackson, J. E., A user's guide to principal components John Wiley, New York,
(1991).
159. Höskuldsson, A., J. Chemom. 2, 211-228 (1988).
160. Wold, S., Kettaneh, N., Tjessem, K., J. Chemom. 10, 463-482 (1996).
161. Eriksson, L., Johansson, E., Lindgren, F., Sjöström, M., Wold, S., J. Comput. Aided
Mol. Des. 16, 711-726 (2002).
162. Martens, H., Naes, T., Multivariate Calibration John Wiley & Sons, Guilford,
(1989).
163. Brereton, R. G., Analyst 125, 2125-2154 (2000).
164. Bennet, J. H., Ed., Statistical methods, experimental design, and scientific inference,
A re-issue Oxford University Press, Oxford, England, (1990).

Acta Universitatis UpsaliensisComprehensive Summaries of Uppsala Dissertations
from the Faculty of Science and Technology
Editor: The Dean of the Faculty of Science and Technology
Distribution:Uppsala University Library
Box 510, SE-751 20 Uppsala, Swedenwww.uu.se, [email protected]
ISSN 1104-232XISBN 91-554-5881-5
A doctoral dissertation from the Faculty of Science and Technology, UppsalaUniversity, is usually a summary of a number of papers. A few copies of thecomplete dissertation are kept at major Swedish research libraries, while thesummary alone is distributed internationally through the series Comprehensive
Summaries of Uppsala Dissertations from the Faculty of Science and Technology.(Prior to October, 1993, the series was published under the title “ComprehensiveSummaries of Uppsala Dissertations from the Faculty of Science”.)