Physicochemical and antioxidative properties of black ... · Physicochemical and antioxidative...
8
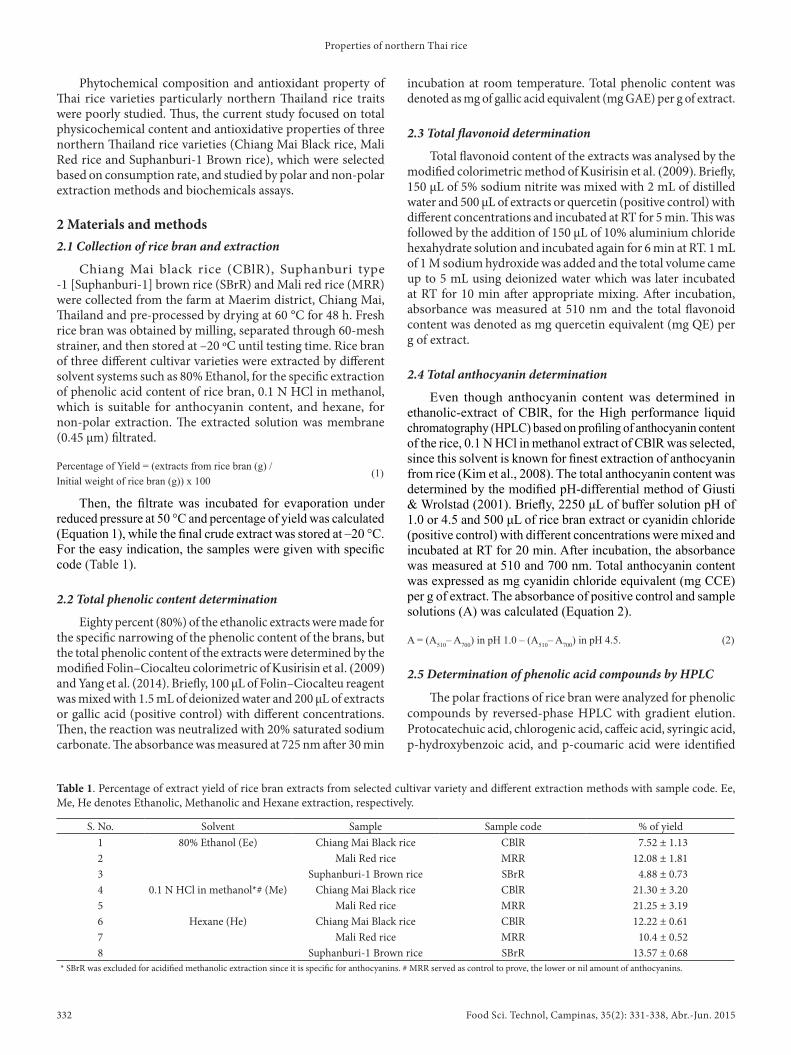
Food Sci. Technol, Campinas, 35(2): 331-338, Abr.-Jun. 2015 331 Food Science and Technology ISSN 0101-2061 DI: D http://dx.doi.org/10.1590/1678-457X.6573 1 Introduction Rice is the foremost cereal food crop in many developing countries. About half of the world population consumes rice as their major source of carbohydrate. Almost 95% of the rice production is recorded in Asian countries (Bhattacharjee et al., 2002). In addition to common white-rice varieties, there are some speciality rices such as the colored ones (black, also known as purple, brown and red). Colors in the rices are due to the deposition of large amounts of anthocyanin pigment in the rice coat (Chaudhary, 2003). Black rice (BlR) is especially rich in anthocyanin pigments, phytochemicals, protein and vitamins. China cultivates the most BlR followed by Sri Lanka, Indonesia, India, Philippines etc. ailand occupies the ninth position when it comes to BlR cultivation. BlR is known for its antioxidant properties (Ichikawa et al., 2011; Sompong et al., 2011). e antioxidants are crucial for memory enhancement and strengthening of the immune system. Choi et al. (2007a) reported that the pigments of colored rice bran inhibit allergic reactions in vitro. e prevention of cancer-cell invasion property of peonidin, peonidin 3-glucoside, cyanidin 3-glucoside, and other major anthocyanins of black rice has been reported by (Chen et al., 2006). Ichikawa et al. (2001) also reported that BlR are efficient, and two fold stronger, with respect to antioxidant activities of blueberries. Aſter BlR, Brown rice (BrR), and Red rice (RR) are the reservoir for the next largest amount of phytochemicals. us, demand is escalating for BrR in Brazil because of its rich nutritional values. e difference in mineral contents of BrR is basically caused by the milling process and the cultivar (Heinemann et al., 2005). About, 50 g of BrR provides about 35% of the recommended dietary allowance of Se, Cu, Zn and Mn per day. Phytochemical content of the various rice types were divided into several groups such as carotenoids, phenolics, alkaloids, nitrogen and organosulfur containing compounds. Phenolic compounds were sub-grouped as phenolic acids, flavonoids, coumarins and tannins. Similarly, anthocyanidins are one of such flavonoid compounds. Choi et al. (2007b) and Shen et al. (2009) also reported the variations in phenolics content, flavonoid and antioxidant properties among the cereal grains with special emphasis on black rice, brown rice, red sorghum, and white rice. Anthocyanins (cyanidin-3-D-β-glucoside and peonidin-3-D-β-glucoside) and tocols were identified in BlRs which proved that they have aldose reductase inhibitory activity (Yawadio et al., 2007). Sompong et al. (2011) revealed no significant difference among the rice cultivars of ailand, China and Sri Lanka especially in composition and antioxidant properties. Physicochemical and antioxidative properties of black, brown and red rice varieties of northern ailand Noppawat PENGKUMSRI 1 , Chaiyavat CHAIYASUT 1 , Chalermpong SAENJUM 1 , Sasithorn SIRILUN 1 , Sartjin PEERAJAN 2 , Prasit SUWANNALERT 3 , Sophon SIRISATTHA 4 , Bhagavathi Sundaram SIVAMARUTHI 1 * a Received 22 Dec., 2014 Accepted 11 Mar., 2015 1 Department of Pharmaceutical Sciences, Faculty of Pharmacy, Chiang Mai University, Chiang Mai, ailand 2 Health Innovation Institute, Chiang Mai, ailand 3 Department of Pathobiology, Faculty of Science, Mahidol University, Bangkok, ailand 4 ailand Institute of Scientific and Technological Research, Pathum ani, ailand *Corresponding author: [email protected] Abstract Rice, the seed of Oryza species, is the major cereal crop in most of the developing countries. Nearly 95% of global rice production is done in Asian countries, and about half of the world’s population consumes it. Some speciality rices are not commonly consumed. Colored rice is one of such variety. In these varieties, high amounts of anthocyanin pigment are deposited in the rice coat to form its black (also known as purple), brown and red colors. Minimum studies are there to explain the properties of these rice varieties of ailand. us, the current study was aimed to assess the physicochemical and antioxidative properties of three rice varieties (Chiang Mai Black rice, Mali Red rice and Suphanburi-1 Brown rice) of different cultivars of northern ailand. Rice bran extracts of these three cultivars were prepared with different solvents (polar and non-polar) for the evaluation of total phytochemical content and anti-oxidant free-radical-scavenging properties. Chiang Mai Black rice contained higher concentration of phenolic acid, flavonoids, and anthocyanins (Cyanidin 3-glucoside, peonidin 3-glucoside, cyanidin chloride). Chiang Mai Black rice is richer in free-radical-scavenging compounds and activities than the other tested varieties. Polar extractions of rice bran are high in anti-oxidative compounds and activities than non-polar extractions. Keywords: anti-oxidant; phytochemicals; colored rice variety; polar and non-polar extraction. Practical Application: Nutrient rich rice cultivar has been identified for further characterization of bioactive compounds of rice.
Transcript of Physicochemical and antioxidative properties of black ... · Physicochemical and antioxidative...
Food Sci. Technol, Campinas, 35(2): 331-338, Abr.-Jun. 2015 331
Food Science and Technology ISSN 0101-2061
DI:D http://dx.doi.org/10.1590/1678-457X.6573
1 IntroductionRice is the foremost cereal food crop in many developing
countries. About half of the world population consumes rice as their major source of carbohydrate. Almost 95% of the rice production is recorded in Asian countries (Bhattacharjee et al., 2002). In addition to common white-rice varieties, there are some speciality rices such as the colored ones (black, also known as purple, brown and red). Colors in the rices are due to the deposition of large amounts of anthocyanin pigment in the rice coat (Chaudhary, 2003).
Black rice (BlR) is especially rich in anthocyanin pigments, phytochemicals, protein and vitamins. China cultivates the most BlR followed by Sri Lanka, Indonesia, India, Philippines etc. Thailand occupies the ninth position when it comes to BlR cultivation. BlR is known for its antioxidant properties (Ichikawa et al., 2011; Sompong et al., 2011). The antioxidants are crucial for memory enhancement and strengthening of the immune system. Choi et al. (2007a) reported that the pigments of colored rice bran inhibit allergic reactions in vitro. The prevention of cancer-cell invasion property of peonidin, peonidin 3-glucoside, cyanidin 3-glucoside, and other major anthocyanins of black rice has been reported by (Chen et al., 2006). Ichikawa et al. (2001) also reported that BlR are efficient, and two fold stronger, with respect to antioxidant activities of blueberries.
After BlR, Brown rice (BrR), and Red rice (RR) are the reservoir for the next largest amount of phytochemicals. Thus, demand is escalating for BrR in Brazil because of its rich nutritional values. The difference in mineral contents of BrR is basically caused by the milling process and the cultivar (Heinemann et al., 2005). About, 50 g of BrR provides about 35% of the recommended dietary allowance of Se, Cu, Zn and Mn per day.
Phytochemical content of the various rice types were divided into several groups such as carotenoids, phenolics, alkaloids, nitrogen and organosulfur containing compounds. Phenolic compounds were sub-grouped as phenolic acids, flavonoids, coumarins and tannins. Similarly, anthocyanidins are one of such flavonoid compounds. Choi et al. (2007b) and Shen et al. (2009) also reported the variations in phenolics content, flavonoid and antioxidant properties among the cereal grains with special emphasis on black rice, brown rice, red sorghum, and white rice. Anthocyanins (cyanidin-3-D-β-glucoside and peonidin-3-D-β-glucoside) and tocols were identified in BlRs which proved that they have aldose reductase inhibitory activity (Yawadio et al., 2007). Sompong et al. (2011) revealed no significant difference among the rice cultivars of Thailand, China and Sri Lanka especially in composition and antioxidant properties.
Physicochemical and antioxidative properties of black, brown and red rice varieties of northern Thailand
Noppawat PENGKUMSRI1, Chaiyavat CHAIYASUT1, Chalermpong SAENJUM1, Sasithorn SIRILUN1, Sartjin PEERAJAN2, Prasit SUWANNALERT3, Sophon SIRISATTHA4, Bhagavathi Sundaram SIVAMARUTHI1*
a
Received 22 Dec., 2014 Accepted 11 Mar., 20151Department of Pharmaceutical Sciences, Faculty of Pharmacy, Chiang Mai University, Chiang Mai, Thailand2Health Innovation Institute, Chiang Mai, Thailand3Department of Pathobiology, Faculty of Science, Mahidol University, Bangkok, Thailand4Thailand Institute of Scientific and Technological Research, Pathum Thani, Thailand*Corresponding author: [email protected]
AbstractRice, the seed of Oryza species, is the major cereal crop in most of the developing countries. Nearly 95% of global rice production is done in Asian countries, and about half of the world’s population consumes it. Some speciality rices are not commonly consumed. Colored rice is one of such variety. In these varieties, high amounts of anthocyanin pigment are deposited in the rice coat to form its black (also known as purple), brown and red colors. Minimum studies are there to explain the properties of these rice varieties of Thailand. Thus, the current study was aimed to assess the physicochemical and antioxidative properties of three rice varieties (Chiang Mai Black rice, Mali Red rice and Suphanburi-1 Brown rice) of different cultivars of northern Thailand. Rice bran extracts of these three cultivars were prepared with different solvents (polar and non-polar) for the evaluation of total phytochemical content and anti-oxidant free-radical-scavenging properties. Chiang Mai Black rice contained higher concentration of phenolic acid, flavonoids, and anthocyanins (Cyanidin 3-glucoside, peonidin 3-glucoside, cyanidin chloride). Chiang Mai Black rice is richer in free-radical-scavenging compounds and activities than the other tested varieties. Polar extractions of rice bran are high in anti-oxidative compounds and activities than non-polar extractions.
Keywords: anti-oxidant; phytochemicals; colored rice variety; polar and non-polar extraction.
Practical Application: Nutrient rich rice cultivar has been identified for further characterization of bioactive compounds of rice.
Properties of northern Thai rice
Food Sci. Technol, Campinas, 35(2): 331-338, Abr.-Jun. 2015332
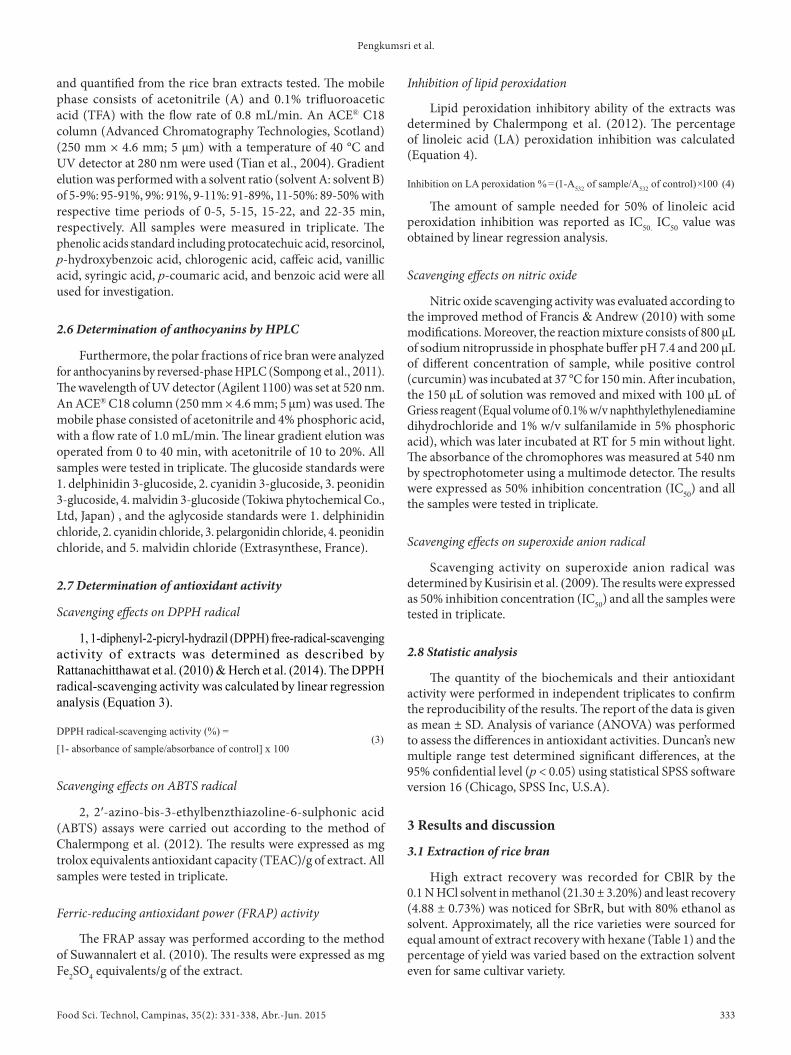
Phytochemical composition and antioxidant property of Thai rice varieties particularly northern Thailand rice traits were poorly studied. Thus, the current study focused on total physicochemical content and antioxidative properties of three northern Thailand rice varieties (Chiang Mai Black rice, Mali Red rice and Suphanburi-1 Brown rice), which were selected based on consumption rate, and studied by polar and non-polar extraction methods and biochemicals assays.
2 Materials and methods2.1 Collection of rice bran and extraction
Chiang Mai black rice (CBlR), Suphanburi type -1 [Suphanburi-1] brown rice (SBrR) and Mali red rice (MRR) were collected from the farm at Maerim district, Chiang Mai, Thailand and pre-processed by drying at 60 °C for 48 h. Fresh rice bran was obtained by milling, separated through 60-mesh strainer, and then stored at –20 ºC until testing time. Rice bran of three different cultivar varieties were extracted by different solvent systems such as 80% Ethanol, for the specific extraction of phenolic acid content of rice bran, 0.1 N HCl in methanol, which is suitable for anthocyanin content, and hexane, for non-polar extraction. The extracted solution was membrane (0.45 μm) filtrated.
Percentage of Yield = (extracts from rice bran (g) /Initial weight of rice bran (g)) x 100
(1)
Then, the filtrate was incubated for evaporation under reduced pressure at 50 °C and percentage of yield was calculated (Equation 1), while the final crude extract was stored at –20 °C. For the easy indication, the samples were given with specific code (Table 1).
2.2 Total phenolic content determination
Eighty percent (80%) of the ethanolic extracts were made for the specific narrowing of the phenolic content of the brans, but the total phenolic content of the extracts were determined by the modified Folin–Ciocalteu colorimetric of Kusirisin et al. (2009) and Yang et al. (2014). Briefly, 100 μL of Folin–Ciocalteu reagent was mixed with 1.5 mL of deionized water and 200 μL of extracts or gallic acid (positive control) with different concentrations. Then, the reaction was neutralized with 20% saturated sodium carbonate. The absorbance was measured at 725 nm after 30 min
incubation at room temperature. Total phenolic content was denoted as mg of gallic acid equivalent (mg GAE) per g of extract.
2.3 Total flavonoid determination
Total flavonoid content of the extracts was analysed by the modified colorimetric method of Kusirisin et al. (2009). Briefly, 150 μL of 5% sodium nitrite was mixed with 2 mL of distilled water and 500 μL of extracts or quercetin (positive control) with different concentrations and incubated at RT for 5 min. This was followed by the addition of 150 μL of 10% aluminium chloride hexahydrate solution and incubated again for 6 min at RT. 1 mL of 1 M sodium hydroxide was added and the total volume came up to 5 mL using deionized water which was later incubated at RT for 10 min after appropriate mixing. After incubation, absorbance was measured at 510 nm and the total flavonoid content was denoted as mg quercetin equivalent (mg QE) per g of extract.
2.4 Total anthocyanin determination
Even though anthocyanin content was determined in ethanolic-extract of CBlR, for the High performance liquid chromatography (HPLC) based on profiling of anthocyanin content of the rice, 0.1 N HCl in methanol extract of CBlR was selected, since this solvent is known for finest extraction of anthocyanin from rice (Kim et al., 2008). The total anthocyanin content was determined by the modified pH-differential method of Giusti & Wrolstad (2001). Briefly, 2250 μL of buffer solution pH of 1.0 or 4.5 and 500 μL of rice bran extract or cyanidin chloride (positive control) with different concentrations were mixed and incubated at RT for 20 min. After incubation, the absorbance was measured at 510 and 700 nm. Total anthocyanin content was expressed as mg cyanidin chloride equivalent (mg CCE) per g of extract. The absorbance of positive control and sample solutions (A) was calculated (Equation 2).
A = (A510– A700) in pH 1.0 – (A510– A700) in pH 4.5. (2)
2.5 Determination of phenolic acid compounds by HPLC
The polar fractions of rice bran were analyzed for phenolic compounds by reversed-phase HPLC with gradient elution. Protocatechuic acid, chlorogenic acid, caffeic acid, syringic acid, p-hydroxybenzoic acid, and p-coumaric acid were identified
Table 1. Percentage of extract yield of rice bran extracts from selected cultivar variety and different extraction methods with sample code. Ee, Me, He denotes Ethanolic, Methanolic and Hexane extraction, respectively.
S. No. Solvent Sample Sample code % of yield1 80% Ethanol (Ee) Chiang Mai Black rice CBlR 7.52 ± 1.132 Mali Red rice MRR 12.08 ± 1.813 Suphanburi-1 Brown rice SBrR 4.88 ± 0.734 0.1 N HCl in methanol*# (Me) Chiang Mai Black rice CBlR 21.30 ± 3.205 Mali Red rice MRR 21.25 ± 3.196 Hexane (He) Chiang Mai Black rice CBlR 12.22 ± 0.617 Mali Red rice MRR 10.4 ± 0.528 Suphanburi-1 Brown rice SBrR 13.57 ± 0.68
* SBrR was excluded for acidified methanolic extraction since it is specific for anthocyanins. # MRR served as control to prove, the lower or nil amount of anthocyanins.
Pengkumsri et al.
Food Sci. Technol, Campinas, 35(2): 331-338, Abr.-Jun. 2015 333
and quantified from the rice bran extracts tested. The mobile phase consists of acetonitrile (A) and 0.1% trifluoroacetic acid (TFA) with the flow rate of 0.8 mL/min. An ACE® C18 column (Advanced Chromatography Technologies, Scotland) (250 mm × 4.6 mm; 5 μm) with a temperature of 40 °C and UV detector at 280 nm were used (Tian et al., 2004). Gradient elution was performed with a solvent ratio (solvent A: solvent B) of 5-9%: 95-91%, 9%: 91%, 9-11%: 91-89%, 11-50%: 89-50% with respective time periods of 0-5, 5-15, 15-22, and 22-35 min, respectively. All samples were measured in triplicate. The phenolic acids standard including protocatechuic acid, resorcinol, p-hydroxybenzoic acid, chlorogenic acid, caffeic acid, vanillic acid, syringic acid, p-coumaric acid, and benzoic acid were all used for investigation.
2.6 Determination of anthocyanins by HPLC
Furthermore, the polar fractions of rice bran were analyzed for anthocyanins by reversed-phase HPLC (Sompong et al., 2011). The wavelength of UV detector (Agilent 1100) was set at 520 nm. An ACE® C18 column (250 mm × 4.6 mm; 5 μm) was used. The mobile phase consisted of acetonitrile and 4% phosphoric acid, with a flow rate of 1.0 mL/min. The linear gradient elution was operated from 0 to 40 min, with acetonitrile of 10 to 20%. All samples were tested in triplicate. The glucoside standards were 1. delphinidin 3-glucoside, 2. cyanidin 3-glucoside, 3. peonidin 3-glucoside, 4. malvidin 3-glucoside (Tokiwa phytochemical Co., Ltd, Japan) , and the aglycoside standards were 1. delphinidin chloride, 2. cyanidin chloride, 3. pelargonidin chloride, 4. peonidin chloride, and 5. malvidin chloride (Extrasynthese, France).
2.7 Determination of antioxidant activity
Scavenging effects on DPPH radical
1, 1-diphenyl-2-picryl-hydrazil (DPPH) free-radical-scavenging activity of extracts was determined as described by Rattanachitthawat et al. (2010) & Herch et al. (2014). The DPPH radical-scavenging activity was calculated by linear regression analysis (Equation 3).
DPPH radical-scavenging activity (%) =
[1- absorbance of sample/absorbance of control] x 100 (3)
Scavenging effects on ABTS radical
2, 2′-azino-bis-3-ethylbenzthiazoline-6-sulphonic acid (ABTS) assays were carried out according to the method of Chalermpong et al. (2012). The results were expressed as mg trolox equivalents antioxidant capacity (TEAC)/g of extract. All samples were tested in triplicate.
Ferric-reducing antioxidant power (FRAP) activity
The FRAP assay was performed according to the method of Suwannalert et al. (2010). The results were expressed as mg Fe2SD4 equivalents/g of the extract.
Inhibition of lipid peroxidation
Lipid peroxidation inhibitory ability of the extracts was determined by Chalermpong et al. (2012). The percentage of linoleic acid (LA) peroxidation inhibition was calculated (Equation 4).
Inhibition on LA peroxidation % = (1-A532 of sample/A532 of control) × 100 (4)
The amount of sample needed for 50% of linoleic acid peroxidation inhibition was reported as IC50. IC50 value was obtained by linear regression analysis.
Scavenging effects on nitric oxide
Nitric oxide scavenging activity was evaluated according to the improved method of Francis & Andrew (2010) with some modifications. Moreover, the reaction mixture consists of 800 μL of sodium nitroprusside in phosphate buffer pH 7.4 and 200 μL of different concentration of sample, while positive control (curcumin) was incubated at 37 °C for 150 min. After incubation, the 150 μL of solution was removed and mixed with 100 μL of Griess reagent (Equal volume of 0.1% w/v naphthylethylenediamine dihydrochloride and 1% w/v sulfanilamide in 5% phosphoric acid), which was later incubated at RT for 5 min without light. The absorbance of the chromophores was measured at 540 nm by spectrophotometer using a multimode detector. The results were expressed as 50% inhibition concentration (IC50) and all the samples were tested in triplicate.
Scavenging effects on superoxide anion radical
Scavenging activity on superoxide anion radical was determined by Kusirisin et al. (2009). The results were expressed as 50% inhibition concentration (IC50) and all the samples were tested in triplicate.
2.8 Statistic analysis
The quantity of the biochemicals and their antioxidant activity were performed in independent triplicates to confirm the reproducibility of the results. The report of the data is given as mean ± SD. Analysis of variance (ANDVA) was performed to assess the differences in antioxidant activities. Duncan’s new multiple range test determined significant differences, at the 95% confidential level (p < 0.05) using statistical SPSS software version 16 (Chicago, SPSS Inc, U.S.A).
3 Results and discussion
3.1 Extraction of rice bran
High extract recovery was recorded for CBlR by the 0.1 N HCl solvent in methanol (21.30 ± 3.20%) and least recovery (4.88 ± 0.73%) was noticed for SBrR, but with 80% ethanol as solvent. Approximately, all the rice varieties were sourced for equal amount of extract recovery with hexane (Table 1) and the percentage of yield was varied based on the extraction solvent even for same cultivar variety.

Properties of northern Thai rice
Food Sci. Technol, Campinas, 35(2): 331-338, Abr.-Jun. 2015334
3.2 Phenolic content of rice bran extracts
Total phenolic content, total flavonoid content, and total anthocyanin content was assessed in the extracts. CBlR contained higher the concentration of phenolic acid (305.30 ± 6.15 mg of gallic acid equivalent/ g of extract), flavonoids (1.93 ± 0.03 mg of quercetin equivalent/ g of extract) and anthocyanin (487.25 ± 24.36 mg of cyaniding equivalent/ g of extract). Practically, MRR and SBrR had lower yields (Supplementary Table 1). There was no anthocyanin content observed in MRR and SBrR varieties, since anthocyanin pigments are rich in intensely pigmented rice (black/ purple rice). Further HPLC analysis was carried out to refine the phenolic acid contents.
CBlR contains protocatechuic acid (0.87 ± 0.04 mg/ g of extract), caffeic acid (1.02 ± 0.05 mg/ g of extract), syringic acid (0.20 ± 0.01 mg/ g of extract), and p-coumaric acid (11.40 ± 0.57 mg/ g of extract), but there was no detectable level of p-hydroxybenzoic acid and chlorogenic acid (Supplementary Table 2). Whereas, p-hydroxybenzoic acid (0.34 ± 0.02 mg/ g of extract) was recorded in MRR, however, chlorogenic acid, caffeic acid and p-coumaric acid were not detected in this sample. In the case of SBrR, protocatechuic acid (0.02 ± 0 mg/ g of extract), chlorogenic acid (0.10 ± 0 mg/ g of extract), and syringic acid (0.06 ± 0 mg/ g of extract) were noted but not others (Supplementary Table 2). These results indicated that the composition of phenolic acid varied among the samples tested and each variety has its phenolic acid profile.
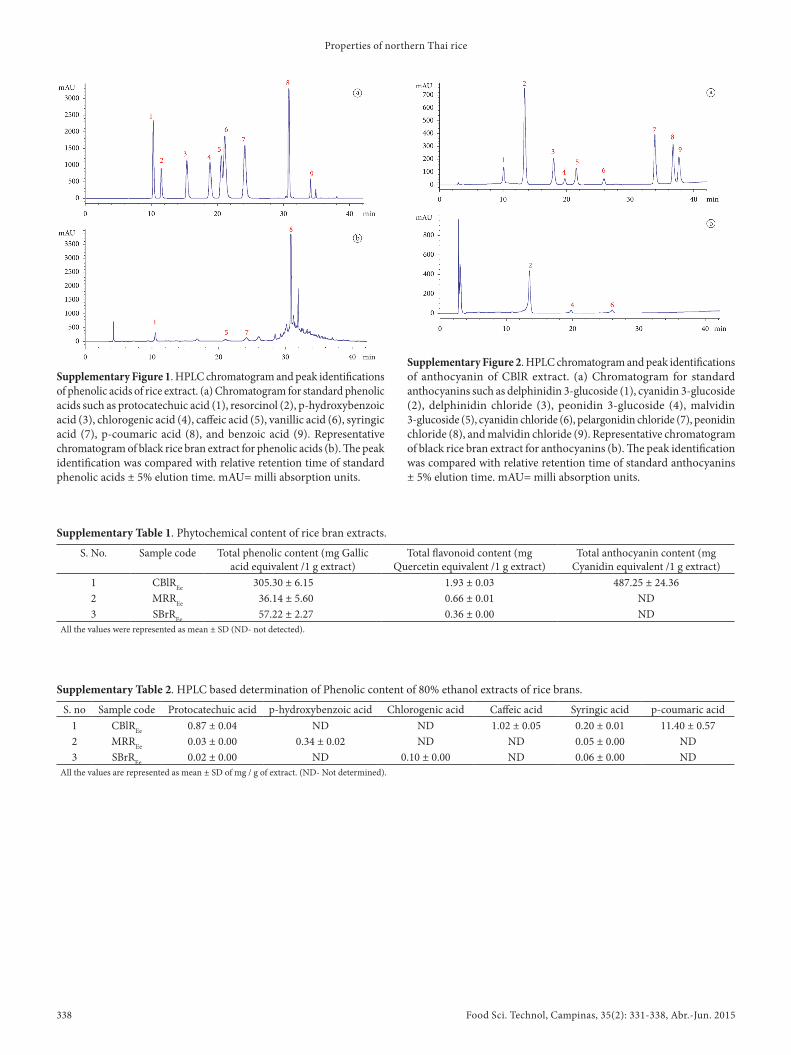
HPLC study also indicated that CBlR consist of rich amount of phenolics than other samples. Protocatechuic acid, caffeic acid, syringic acid, and p-coumaric acid were found in HPLC analysis for phenolic acid of CBlR. Representative HPLC chromatograms of standard phenolic acids and rice extract sample were shown in Supplementary Figure 1. A previous study by Sompong et al. (2011) detailed the contents of phenolic acid of red Thai rice varieties (1.4 to 3.4 mg/100 g) and Chinese black rice varieties (7.4–10.5 mg/100 g). Ferulic acid and protocatechuic acid are the major constituents in red rice, whereas in the black rice, which was found as rich in protocatechuic and vanillic acid varied from 2.7 to 4.5 and 2.9-3.9 mg/100 g, respectively (Sompong et al., 2011).
The results of this present study suggested that CBlR contains a higher amount of phenolic content with the following richness order: p-coumaric acid > caffeic acid > protocatechuic acid > syringic acid. In all of these processes, no p-hydroxybenzoic acid and chlorogenic acid was detected. This result differed from the previous report (Sompong et al., 2011) which claimed no significant differences in biochemical composition between the two rices. In the present study, MRR and SBrR varieties showed the different composition of phenolics. Thus, communally, the results revealed that the phenolic content of the rice significantly varied with respect to the cultivar varieties and color among the samples tested.
3.3 Anthocyanin content of CBlR
Cyanidin 3-glucoside (5.69 ± 0.28 mg/ g of extract), peonidin 3-glucoside (11.46 ± 0.57 mg/ g of extract), and cyanidin chloride (12.60 ± 0.63 mg/ g of extract) were identified and measured in CBlR (Figure 1, Supplementary Figure 1).
The previous studies on anthocyanin content of different rice varieties revealed that Thai red rices Niaw Dam Pleuak Khao and Niaw Dam Pleuak Dam followed by China black rice are superior quality with respect to anthocyanin content. More specifically, cyanidin 3-glucoside, and peonidin 3-glucoside are present in highest level among the red and black rices (Sompong et al., 2011). The present study demonstrated that there is a high content of cyanidin 3-glucoside, and peonidin 3-glucoside among black rice variety, but there is no notable amount of anthocyanin detected in red rice variety which was tested in the current study (Supplementary Figure 2).
3.4 Evaluation of anti-oxidant property of extracts
Furthermore, the explanation of the total anti-oxidant properties of the tested rice varieties is necessary to portray the medicinal value or the free radical scavenging ability of the same. Both polar and non-polar extracts of the rice bran samples were studied for their anti-oxidant ability, but the non-polar extraction was made with the help of hexane which served as solvent for all the three cultivars. The anti-oxidant properties have been assessed through different in vitro biochemical assays such as ABTS, DPPH, FRAP, lipidperoxidation, superoxide anion, and nitric oxide assay.
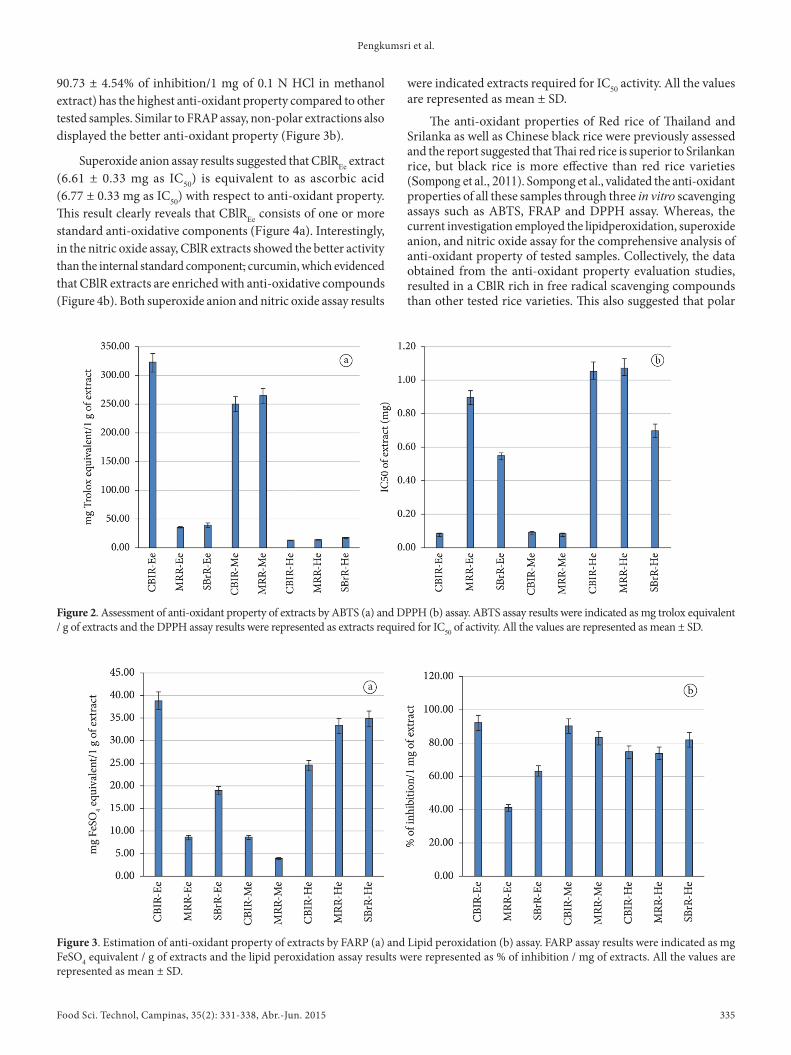
CBlREe sample showed the highest trolox equivalent (323.21 ± 16.16 mg of Trolox equivalent /1 g of extract) in ABTS assay than other samples. Next to this, MRRMe showed a higher trolox equivalent. CBlR with 0.1 N HCl in methanol extract displayed a slight lower ability in ABTS assay. The non -polar extractions of all the rice samples were noticed because of the reduced ability of the anti-oxidant in this assay (Figure 2a). Both CBlREe (0.08 ± 0.01 g as IC50) and MRRMe (0.08 ± 0.01 g as IC50) showed the highest anti-oxidant activity in DPPH assay (Figure 2b).
In FRAP assay, non-polar extracts of MRR and SBrR also showed the highest FeSD4 equivalents after the CBlREe sample (38.99 ± 1.94 mg of FeSD4 equivalent/1 g of extract) (Figure 3a). Lipidperoxidation assay results indicated that CBlR (92.46 ± 4.62% of inhibition/1 mg of ethanol extract and
Figure 1. Quantity of anthocyanins present in the rice bran extracts assessed by HPLC. *** Not detected.
Pengkumsri et al.
Food Sci. Technol, Campinas, 35(2): 331-338, Abr.-Jun. 2015 335
90.73 ± 4.54% of inhibition/1 mg of 0.1 N HCl in methanol extract) has the highest anti-oxidant property compared to other tested samples. Similar to FRAP assay, non-polar extractions also displayed the better anti-oxidant property (Figure 3b).
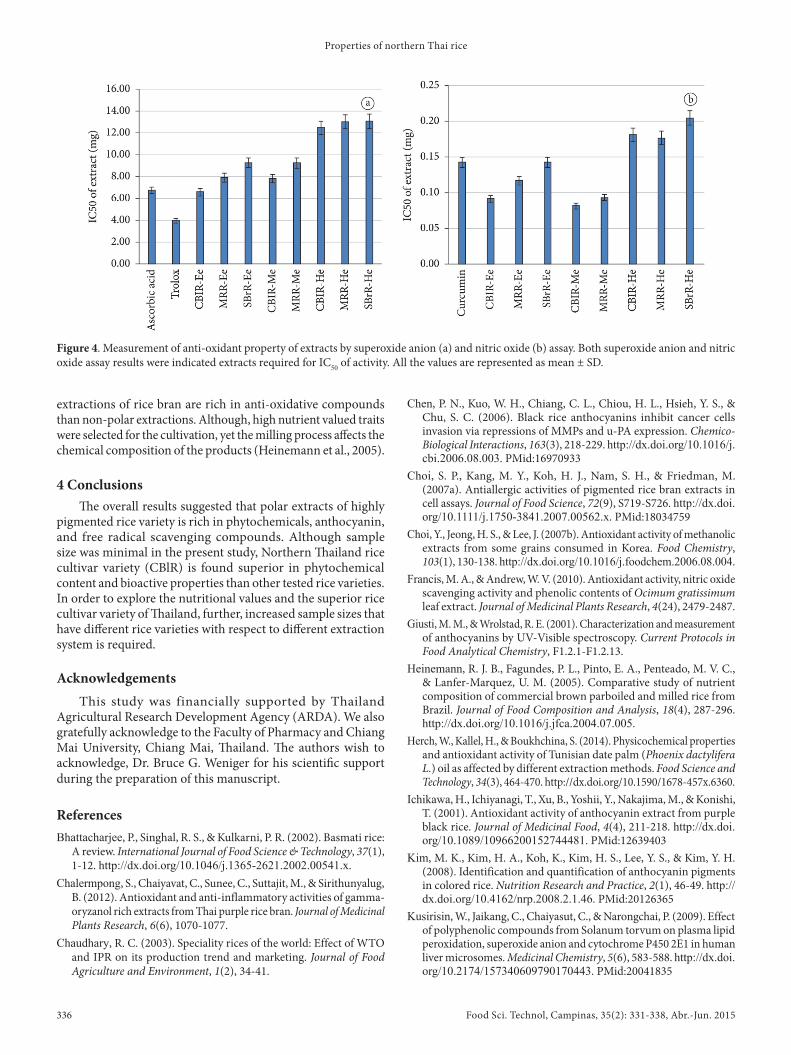
Superoxide anion assay results suggested that CBlREe extract (6.61 ± 0.33 mg as IC50) is equivalent to as ascorbic acid (6.77 ± 0.33 mg as IC50) with respect to anti-oxidant property. This result clearly reveals that CBlREe consists of one or more standard anti-oxidative components (Figure 4a). Interestingly, in the nitric oxide assay, CBlR extracts showed the better activity than the internal standard component, curcumin, which evidenced that CBlR extracts are enriched with anti-oxidative compounds (Figure 4b). Both superoxide anion and nitric oxide assay results
Figure 2. Assessment of anti-oxidant property of extracts by ABTS (a) and DPPH (b) assay. ABTS assay results were indicated as mg trolox equivalent / g of extracts and the DPPH assay results were represented as extracts required for IC50 of activity. All the values are represented as mean ± SD.
Figure 3. Estimation of anti-oxidant property of extracts by FARP (a) and Lipid peroxidation (b) assay. FARP assay results were indicated as mg FeSD4 equivalent / g of extracts and the lipid peroxidation assay results were represented as % of inhibition / mg of extracts. All the values are represented as mean ± SD.
were indicated extracts required for IC50 activity. All the values are represented as mean ± SD.
The anti-oxidant properties of Red rice of Thailand and Srilanka as well as Chinese black rice were previously assessed and the report suggested that Thai red rice is superior to Srilankan rice, but black rice is more effective than red rice varieties (Sompong et al., 2011). Sompong et al., validated the anti-oxidant properties of all these samples through three in vitro scavenging assays such as ABTS, FRAP and DPPH assay. Whereas, the current investigation employed the lipidperoxidation, superoxide anion, and nitric oxide assay for the comprehensive analysis of anti-oxidant property of tested samples. Collectively, the data obtained from the anti-oxidant property evaluation studies, resulted in a CBlR rich in free radical scavenging compounds than other tested rice varieties. This also suggested that polar
Properties of northern Thai rice
Food Sci. Technol, Campinas, 35(2): 331-338, Abr.-Jun. 2015336
extractions of rice bran are rich in anti-oxidative compounds than non-polar extractions. Although, high nutrient valued traits were selected for the cultivation, yet the milling process affects the chemical composition of the products (Heinemann et al., 2005).
4 ConclusionsThe overall results suggested that polar extracts of highly
pigmented rice variety is rich in phytochemicals, anthocyanin, and free radical scavenging compounds. Although sample size was minimal in the present study, Northern Thailand rice cultivar variety (CBlR) is found superior in phytochemical content and bioactive properties than other tested rice varieties. In order to explore the nutritional values and the superior rice cultivar variety of Thailand, further, increased sample sizes that have different rice varieties with respect to different extraction system is required.
AcknowledgementsThis study was financially supported by Thailand
Agricultural Research Development Agency (ARDA). We also gratefully acknowledge to the Faculty of Pharmacy and Chiang Mai University, Chiang Mai, Thailand. The authors wish to acknowledge, Dr. Bruce G. Weniger for his scientific support during the preparation of this manuscript.
ReferencesBhattacharjee, P., Singhal, R. S., & Kulkarni, P. R. (2002). Basmati rice:
A review. International Journal of Food Science & Technology, 37(1), 1-12. http://dx.doi.org/10.1046/j.1365-2621.2002.00541.x.
Chalermpong, S., Chaiyavat, C., Sunee, C., Suttajit, M., & Sirithunyalug, B. (2012). Antioxidant and anti-inflammatory activities of gamma-oryzanol rich extracts from Thai purple rice bran. Journal of Medicinal Plants Research, 6(6), 1070-1077.
Chaudhary, R. C. (2003). Speciality rices of the world: Effect of WTD and IPR on its production trend and marketing. Journal of Food Agriculture and Environment, 1(2), 34-41.
Chen, P. N., Kuo, W. H., Chiang, C. L., Chiou, H. L., Hsieh, Y. S., & Chu, S. C. (2006). Black rice anthocyanins inhibit cancer cells invasion via repressions of MMPs and u-PA expression. Chemico-Biological Interactions, 163(3), 218-229. http://dx.doi.org/10.1016/j.cbi.2006.08.003. PMid:16970933
Choi, S. P., Kang, M. Y., Koh, H. J., Nam, S. H., & Friedman, M. (2007a). Antiallergic activities of pigmented rice bran extracts in cell assays. Journal of Food Science, 72(9), S719-S726. http://dx.doi.org/10.1111/j.1750-3841.2007.00562.x. PMid:18034759
Choi, Y., Jeong, H. S., & Lee, J. (2007b). Antioxidant activity of methanolic extracts from some grains consumed in Korea. Food Chemistry, 103(1), 130-138. http://dx.doi.org/10.1016/j.foodchem.2006.08.004.
Francis, M. A., & Andrew, W. V. (2010). Antioxidant activity, nitric oxide scavenging activity and phenolic contents of Ocimum gratissimum leaf extract. Journal of Medicinal Plants Research, 4(24), 2479-2487.
Giusti, M. M., & Wrolstad, R. E. (2001). Characterization and measurement of anthocyanins by UV-Visible spectroscopy. Current Protocols in Food Analytical Chemistry, F1.2.1-F1.2.13.
Heinemann, R. J. B., Fagundes, P. L., Pinto, E. A., Penteado, M. V. C., & Lanfer-Marquez, U. M. (2005). Comparative study of nutrient composition of commercial brown parboiled and milled rice from Brazil. Journal of Food Composition and Analysis, 18(4), 287-296. http://dx.doi.org/10.1016/j.jfca.2004.07.005.
Herch, W., Kallel, H., & Boukhchina, S. (2014). Physicochemical properties and antioxidant activity of Tunisian date palm (Phoenix dactylifera L.) oil as affected by different extraction methods. Food Science and Technology, 34(3), 464-470. http://dx.doi.org/10.1590/1678-457x.6360.
Ichikawa, H., Ichiyanagi, T., Xu, B., Yoshii, Y., Nakajima, M., & Konishi, T. (2001). Antioxidant activity of anthocyanin extract from purple black rice. Journal of Medicinal Food, 4(4), 211-218. http://dx.doi.org/10.1089/10966200152744481. PMid:12639403
Kim, M. K., Kim, H. A., Koh, K., Kim, H. S., Lee, Y. S., & Kim, Y. H. (2008). Identification and quantification of anthocyanin pigments in colored rice. Nutrition Research and Practice, 2(1), 46-49. http://dx.doi.org/10.4162/nrp.2008.2.1.46. PMid:20126365
Kusirisin, W., Jaikang, C., Chaiyasut, C., & Narongchai, P. (2009). Effect of polyphenolic compounds from Solanum torvum on plasma lipid peroxidation, superoxide anion and cytochrome P450 2E1 in human liver microsomes. Medicinal Chemistry, 5(6), 583-588. http://dx.doi.org/10.2174/157340609790170443. PMid:20041835
Figure 4. Measurement of anti-oxidant property of extracts by superoxide anion (a) and nitric oxide (b) assay. Both superoxide anion and nitric oxide assay results were indicated extracts required for IC50 of activity. All the values are represented as mean ± SD.
Pengkumsri et al.
Food Sci. Technol, Campinas, 35(2): 331-338, Abr.-Jun. 2015 337
Rattanachitthawat, S., Suwannalert, P., Riengrojpitak, S., Chaiyasut, C., & Pantuwatana, S. (2010). Phenolic content and antioxidant activities in red unpolished Thai rice prevents oxidative stress in rats. Journal of Medicinal Plants Research, 4(9), 796-801.
Shen, Y., Jin, L., Xiao, P., Lu, Y., & Bao, J. (2009). Total phenolics, flavonoids, antioxidant capacity in rice grain and their relations to grain color, size and weight. Journal of Cereal Science, 49(1), 106-111. http://dx.doi.org/10.1016/j.jcs.2008.07.010.
Sompong, R., Siebenhandl-Ehn, S., Linsberger-Martin, G., & Berghofer, E. (2011). Physicochemical and antioxidative properties of red and black rice varieties from Thailand, China and Sri Lanka. Food Chemistry, 124(1), 132-140. http://dx.doi.org/10.1016/j.foodchem.2010.05.115.
Suwannalert, P., Rattanachitthawat, S., Chaiyasut, C., & Riengrojpitak, S. (2010). High levels of 25-hydroxyvitamin D3 [25(DH) D3] and
α-tocopherol prevent oxidative stress in rats that consume Thai brown rice. Journal of Medicinal Plants Research, 4(2), 120-124.
Tian, S., Nakamura, K., & Kayahara, H. (2004). Analysis of phenolic compounds in white rice, brown rice, and germinated brown rice. Journal of Agricultural and Food Chemistry, 52(15), 4808-4813. http://dx.doi.org/10.1021/jf049446f. PMid:15264919
Yang, X., Yan, F., Huang, S., & Fu, C. (2014). Antioxidant activities of fractions from longan pericarps. Food Science and Technology, 34(2), 341-345. http://dx.doi.org/10.1590/S0101-20612014005000034.
Yawadio, R., Tanimori, S., & Morita, N. (2007). Identification of phenolic compounds isolated from pigmented rices and their aldose reductase inhibitory activities. Food Chemistry, 101(4), 1616-1625.
Properties of northern Thai rice
Food Sci. Technol, Campinas, 35(2): 331-338, Abr.-Jun. 2015338
Supplementary Table 1. Phytochemical content of rice bran extracts.
S. No. Sample code Total phenolic content (mg Gallic acid equivalent /1 g extract)
Total flavonoid content (mg Quercetin equivalent /1 g extract)
Total anthocyanin content (mg Cyanidin equivalent /1 g extract)
1 CBlREe 305.30 ± 6.15 1.93 ± 0.03 487.25 ± 24.362 MRREe 36.14 ± 5.60 0.66 ± 0.01 ND3 SBrREe 57.22 ± 2.27 0.36 ± 0.00 ND
All the values were represented as mean ± SD (ND- not detected).
Supplementary Table 2. HPLC based determination of Phenolic content of 80% ethanol extracts of rice brans.
S. no Sample code Protocatechuic acid p-hydroxybenzoic acid Chlorogenic acid Caffeic acid Syringic acid p-coumaric acid1 CBlREe 0.87 ± 0.04 ND ND 1.02 ± 0.05 0.20 ± 0.01 11.40 ± 0.572 MRREe 0.03 ± 0.00 0.34 ± 0.02 ND ND 0.05 ± 0.00 ND3 SBrREe 0.02 ± 0.00 ND 0.10 ± 0.00 ND 0.06 ± 0.00 ND
All the values are represented as mean ± SD of mg / g of extract. (ND- Not determined).
Supplementary Figure 1. HPLC chromatogram and peak identifications of phenolic acids of rice extract. (a) Chromatogram for standard phenolic acids such as protocatechuic acid (1), resorcinol (2), p-hydroxybenzoic acid (3), chlorogenic acid (4), caffeic acid (5), vanillic acid (6), syringic acid (7), p-coumaric acid (8), and benzoic acid (9). Representative chromatogram of black rice bran extract for phenolic acids (b). The peak identification was compared with relative retention time of standard phenolic acids ± 5% elution time. mAU= milli absorption units.
Supplementary Figure 2. HPLC chromatogram and peak identifications of anthocyanin of CBlR extract. (a) Chromatogram for standard anthocyanins such as delphinidin 3-glucoside (1), cyanidin 3-glucoside (2), delphinidin chloride (3), peonidin 3-glucoside (4), malvidin 3-glucoside (5), cyanidin chloride (6), pelargonidin chloride (7), peonidin chloride (8), and malvidin chloride (9). Representative chromatogram of black rice bran extract for anthocyanins (b). The peak identification was compared with relative retention time of standard anthocyanins ± 5% elution time. mAU= milli absorption units.