Physico-Chemical Test and Diversity of Macroinvertebrates
18
Project Title : PHYSICO-CHEMICAL TEST AND DIVERSITY OF MACROINVERTEBRATES IN LOWER LOBOC, OROQUIETA CITY Researcher : Sheilane J. Gangoso Project Location : Oroquieta City Duration Date Started : February, 2013 Date Ended : May, 2013 ABSTRACT
-
Upload
earl-peter-gangoso -
Category
Science
-
view
78 -
download
0
description
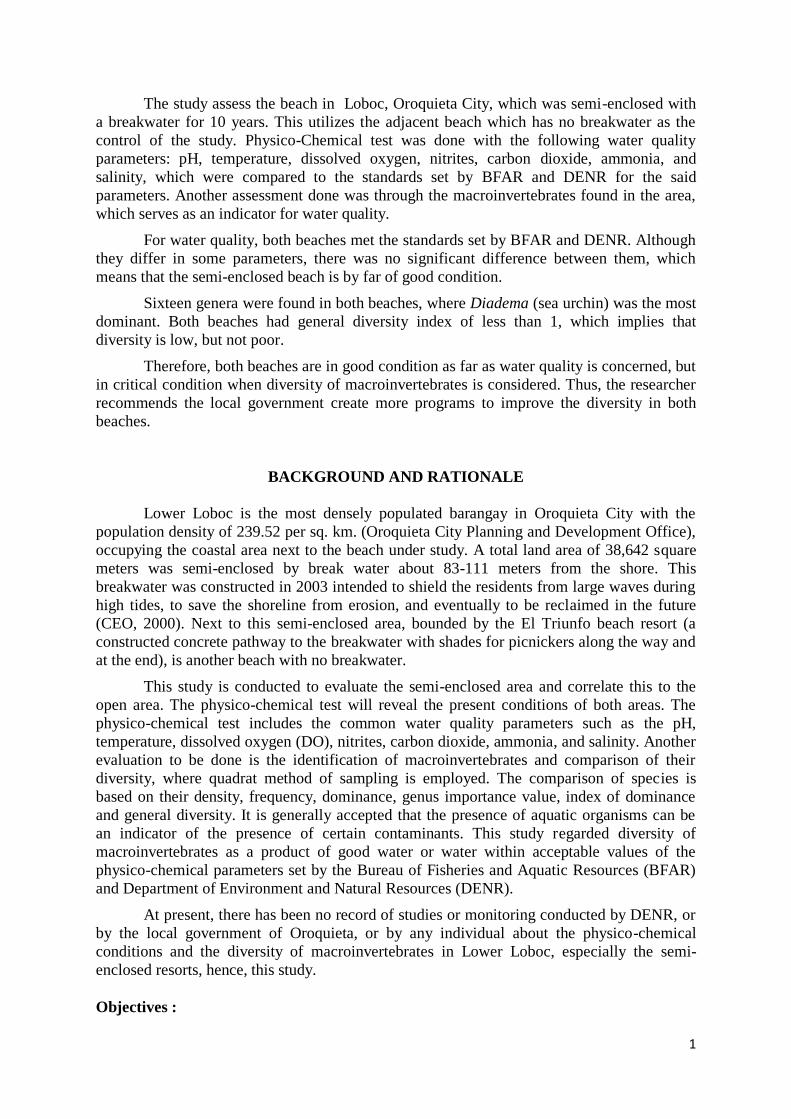
The study assess the beach in Loboc, Oroquieta City, which was semi-enclosed with a breakwater for 10 years. This utilizes the adjacent beach which has no breakwater as the control of the study. Physico-Chemical test was done with the following water quality parameters: pH, temperature, dissolved oxygen, nitrites, carbon dioxide, ammonia, and salinity, which were compared to the standards set by BFAR and DENR for the said parameters. Another assessment done was through the macroinvertebrates found in the area, which serves as an indicator for water quality. For water quality, both beaches met the standards set by BFAR and DENR. Although they differ in some parameters, there was no significant difference between them, which means that the semi-enclosed beach is by far of good condition. Sixteen genera were found in both beaches, where Diadema (sea urchin) was the most dominant. Both beaches had general diversity index of less than 1, which implies that diversity is low, but not poor. Therefore, both beaches are in good condition as far as water quality is concerned, but in critical condition when diversity of macroinvertebrates is considered. Thus, the researcher recommends the local government create more programs to improve the diversity in both beaches.
Transcript of Physico-Chemical Test and Diversity of Macroinvertebrates
Project Title : PHYSICO-CHEMICAL TEST AND DIVERSITY OF
MACROINVERTEBRATES IN LOWER LOBOC, OROQUIETA CITY
Researcher : Sheilane J. Gangoso
Project Location : Oroquieta City
Duration
Date Started : February, 2013
Date Ended : May, 2013
ABSTRACT
1
The study assess the beach in Loboc, Oroquieta City, which was semi-enclosed with
a breakwater for 10 years. This utilizes the adjacent beach which has no breakwater as the
control of the study. Physico-Chemical test was done with the following water quality
parameters: pH, temperature, dissolved oxygen, nitrites, carbon dioxide, ammonia, and
salinity, which were compared to the standards set by BFAR and DENR for the said
parameters. Another assessment done was through the macroinvertebrates found in the area,
which serves as an indicator for water quality.
For water quality, both beaches met the standards set by BFAR and DENR. Although
they differ in some parameters, there was no significant difference between them, which
means that the semi-enclosed beach is by far of good condition.
Sixteen genera were found in both beaches, where Diadema (sea urchin) was the most
dominant. Both beaches had general diversity index of less than 1, which implies that
diversity is low, but not poor.
Therefore, both beaches are in good condition as far as water quality is concerned, but
in critical condition when diversity of macroinvertebrates is considered. Thus, the researcher
recommends the local government create more programs to improve the diversity in both
beaches.
BACKGROUND AND RATIONALE
Lower Loboc is the most densely populated barangay in Oroquieta City with the
population density of 239.52 per sq. km. (Oroquieta City Planning and Development Office),
occupying the coastal area next to the beach under study. A total land area of 38,642 square
meters was semi-enclosed by break water about 83-111 meters from the shore. This
breakwater was constructed in 2003 intended to shield the residents from large waves during
high tides, to save the shoreline from erosion, and eventually to be reclaimed in the future
(CEO, 2000). Next to this semi-enclosed area, bounded by the El Triunfo beach resort (a
constructed concrete pathway to the breakwater with shades for picnickers along the way and
at the end), is another beach with no breakwater.
This study is conducted to evaluate the semi-enclosed area and correlate this to the
open area. The physico-chemical test will reveal the present conditions of both areas. The
physico-chemical test includes the common water quality parameters such as the pH,
temperature, dissolved oxygen (DO), nitrites, carbon dioxide, ammonia, and salinity. Another
evaluation to be done is the identification of macroinvertebrates and comparison of their
diversity, where quadrat method of sampling is employed. The comparison of species is
based on their density, frequency, dominance, genus importance value, index of dominance
and general diversity. It is generally accepted that the presence of aquatic organisms can be
an indicator of the presence of certain contaminants. This study regarded diversity of
macroinvertebrates as a product of good water or water within acceptable values of the
physico-chemical parameters set by the Bureau of Fisheries and Aquatic Resources (BFAR)
and Department of Environment and Natural Resources (DENR).
At present, there has been no record of studies or monitoring conducted by DENR, or
by the local government of Oroquieta, or by any individual about the physico-chemical
conditions and the diversity of macroinvertebrates in Lower Loboc, especially the semi-
enclosed resorts, hence, this study.
Objectives :
2
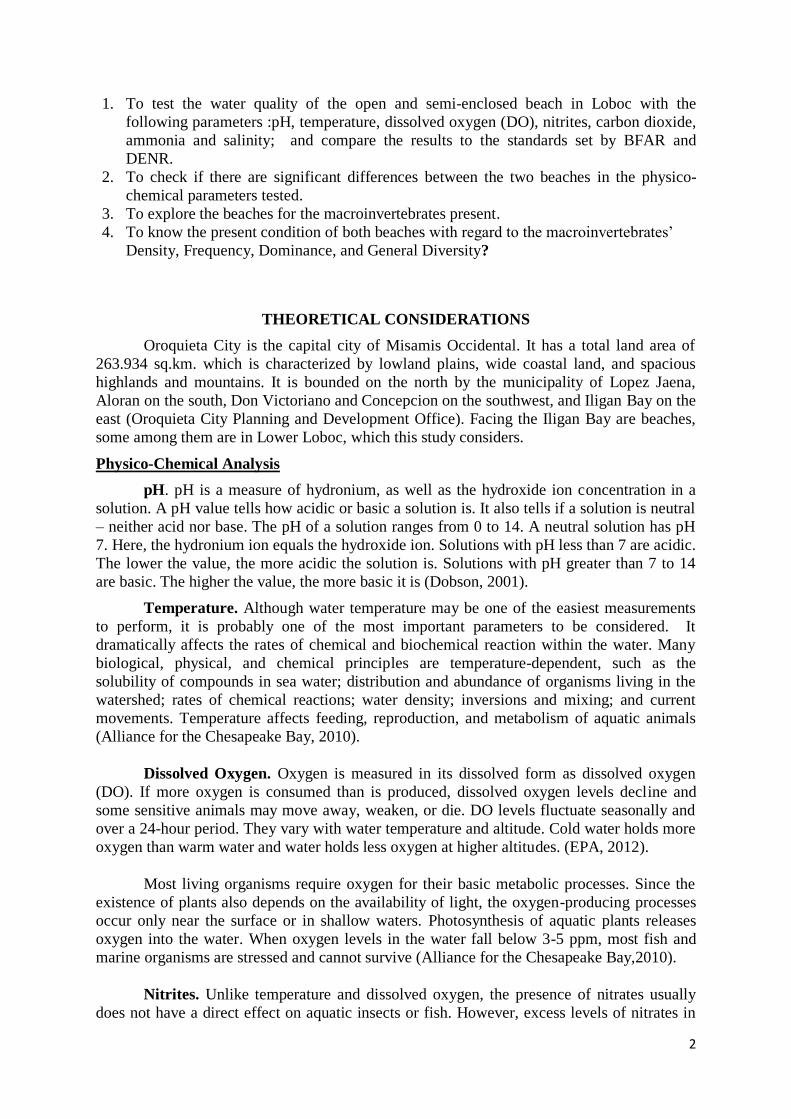
1. To test the water quality of the open and semi-enclosed beach in Loboc with the
following parameters :pH, temperature, dissolved oxygen (DO), nitrites, carbon dioxide,
ammonia and salinity; and compare the results to the standards set by BFAR and
DENR.
2. To check if there are significant differences between the two beaches in the physico-
chemical parameters tested.
3. To explore the beaches for the macroinvertebrates present.
4. To know the present condition of both beaches with regard to the macroinvertebrates’
Density, Frequency, Dominance, and General Diversity?
THEORETICAL CONSIDERATIONS
Oroquieta City is the capital city of Misamis Occidental. It has a total land area of
263.934 sq.km. which is characterized by lowland plains, wide coastal land, and spacious
highlands and mountains. It is bounded on the north by the municipality of Lopez Jaena,
Aloran on the south, Don Victoriano and Concepcion on the southwest, and Iligan Bay on the
east (Oroquieta City Planning and Development Office). Facing the Iligan Bay are beaches,
some among them are in Lower Loboc, which this study considers.
Physico-Chemical Analysis
pH. pH is a measure of hydronium, as well as the hydroxide ion concentration in a
solution. A pH value tells how acidic or basic a solution is. It also tells if a solution is neutral
– neither acid nor base. The pH of a solution ranges from 0 to 14. A neutral solution has pH
7. Here, the hydronium ion equals the hydroxide ion. Solutions with pH less than 7 are acidic.
The lower the value, the more acidic the solution is. Solutions with pH greater than 7 to 14
are basic. The higher the value, the more basic it is (Dobson, 2001).
Temperature. Although water temperature may be one of the easiest measurements
to perform, it is probably one of the most important parameters to be considered. It
dramatically affects the rates of chemical and biochemical reaction within the water. Many
biological, physical, and chemical principles are temperature-dependent, such as the
solubility of compounds in sea water; distribution and abundance of organisms living in the
watershed; rates of chemical reactions; water density; inversions and mixing; and current
movements. Temperature affects feeding, reproduction, and metabolism of aquatic animals
(Alliance for the Chesapeake Bay, 2010).
Dissolved Oxygen. Oxygen is measured in its dissolved form as dissolved oxygen
(DO). If more oxygen is consumed than is produced, dissolved oxygen levels decline and
some sensitive animals may move away, weaken, or die. DO levels fluctuate seasonally and
over a 24-hour period. They vary with water temperature and altitude. Cold water holds more
oxygen than warm water and water holds less oxygen at higher altitudes. (EPA, 2012).
Most living organisms require oxygen for their basic metabolic processes. Since the
existence of plants also depends on the availability of light, the oxygen-producing processes
occur only near the surface or in shallow waters. Photosynthesis of aquatic plants releases
oxygen into the water. When oxygen levels in the water fall below 3-5 ppm, most fish and
marine organisms are stressed and cannot survive (Alliance for the Chesapeake Bay,2010).
Nitrites. Unlike temperature and dissolved oxygen, the presence of nitrates usually
does not have a direct effect on aquatic insects or fish. However, excess levels of nitrates in
3
water can create conditions that make it difficult for aquatic insects or fish to survive. Algae
and other plants use nitrates as a source of food. If algae have an unlimited source of nitrates,
their growth is unchecked. Large amounts of algae can cause extreme fluctuations in
dissolved oxygen. Photosynthesis by algae and other plants can generate oxygen during the
day. However, at night, dissolved oxygen may decrease to very low levels as a result of large
numbers of oxygen consuming bacteria feeding on dead or decaying algae and other plants
(PEER Curriculum).
Carbon Dioxide. It has been proposed that emission of anthropogenic carbon dioxide
to the atmosphere will lead to increased concentrations of CO2 in sea water corresponding to
a decrease of pH of several tenths of pH units. The effects of increased sea water
concentrations of CO2 on shell growth of the blue mussel Mytilus edulis showed a strong
and statistically significant decrease in growth at the lowest pH values, with virtually no
growth at pH = 6.7 and reduced growth at pH = 7.1. Normal growth occurs at pH 8.1(Berge,
2013).
Ammonia. Ammonia is highly soluble in water. In natural waters where
decomposition of organic matter takes place ammonia level will be high. Ammonia increase
is often concomitant with decrease in DO and increase in CO2. The level of ammonia will
also depend on the activity of the nitrifying and denitrifying bacteria. Ammonia is important
as the predominant excretory product of aquatic animals and in high density culture high
ammonia levels can develop, through NH3 excreted directly and also by degradation of fecal
matter and uneaten feed (FAO Corporate Document Repository, 1987).
Salinity. Salinity is the total amount of dissolved material in grams in one kilogram of
sea water. Thus salinity is a dimensionless quantity. It has no units. The variability of
dissolved salt is very small. The range of salinity for most of the ocean's water is from 34.60
to 34.80 parts per thousand, which is 200 parts per million. The variability in the deep North
Pacific is even smaller, about 20 parts per million. If water is to be classified with different
salinity, instruments to be used must be accurate to about one part per million (Stewart,
2005).
Macroinvertebrates
Marine biome or ocean biome covers about 70% of the Earth. Organisms that live in
this biome have adaptations that allow them to survive in salt water. Other factors that affect
ocean organism are sunlight, temperature, water pressure and water movement. Most marine
organisms live near the surface or near the shore. Animals that live near the shore are
alternately covered into the sand while others attach themselves to rocks to keep them from
being washed out to sea (Maton, 1999).
Invertebrates are animals without backbones. Invertebrates which can be found in the
sea can be sponges, cnidarians, worms, mollusks, arthropods and echinoderms.
Most, if not all pollution (air, land and freshwater) ultimately enters the sea. Marine
biodiversity is thus most exposed to and critically influences the fate of pollutants in the
world. Yet marine species are probably least resistant to toxicants. The spread of pollutants in
marine food chains and therefore the quality of marine food is uncontrollable by humans
(Heip, 2007).
By defining the increase in concentration of a material above the normal level, water
quality monitoring impart an image not only of the extent of degradation but also how the
contamination level can be controlled (Dulay, 2005).
4
For the people to brand Oroquieta City as “The City of Good Life” as it is at present,
environmental monitoring is a must for it keeps the local ecosystem balanced or, at least, at
its possible best. It is to this concern that leads to the evaluation of Loboc beach resorts. The
evaluation of water quality provides an objective source of information for a wise
management of vital water resources (Intergovernment Task Force on Monitoring Water
Quality, 1995). This water quality assessment is very helpful to protect human health as well
as conserve or rehabilitate present ecological condition that strengthens our economy.
METHODOLOGY
This research which aimed to evaluate the beaches in Lower Loboc, Oroquieta City
was conducted in the manner illustrated in the following:
Water Analysis
Sampling Scheme. Composite sampling was employed. Three different sites were
chosen, one from each side (about 10 meters from the sea wall and 40 meters from the shore)
and one from the center. For each site, 1 liter was collected from the surface, from the middle
and from the bottom. These were mixed thoroughly making it 3 liters. The 3 liters from each
site were likewise mixed thoroughly. Parallel measurements and procedures were done on the
open beach to get the sample.
In the determination of pH, DO, nitrites, carbon dioxide, ammonia and salinity, Hach
kit was used. Before the test, the apparatus was first standardized using distilled water to
ensure the accuracy of the result.
pH. 5 mL of the sample was placed in a viewing bottle. 9 drops of wide range pH
indicator was added. Then, the bottle was swirled to mix them thoroughly. Through a color
comparator disc, the pH value of the sample was determined.
Temperature. Temperature of the water was determined with the use of an alcohol
thermometer. The end of the thermometer was dipped in the water for 5 minutes and readings
were recorded. Three trials were done and the average was taken. Atmospheric temperature
was taken by letting the end of the thermometer be suspended in the atmosphere for about 5
minutes. Reading was recorded.
Dissolved Oxygen. 60 mL of water sample was placed in a glass stoppered BOD
bottle. DO 1 (Manganous Sulfate) and then DO 2 (Sodium Azide, Lithium Hydroxide,
Potassium Iodide) reagents were added to the sample. It was covered with a glass stopper
making sure there is no air trapped. The bottle was inverted several times, adding excess
sample, if necessary to prevent air trapped. A brownish orange floc precipitated at the
bottom. It was set aside for some time until about half of the solution is clear. It was inverted
again and allowed to settle until half of the solution is clear. DO 3 (Sulfamic acid) reagent
was then added and the bottle is inverted again several times. At these times, the floc is
dissolved if DO is present. 50 ml of the sample was poured off while the remaining solution
is titrated using a digital titrator, with 0.0250 N Sodium Thiosulfate until the solution turned
pale yellow. 2 drops of starch indicator was added into the solution and was swirled until blue
color occurred. It was titrated again with 0.0250 N Sodium Thiosulfate until the solution
turned colorless. The digital counter was read and reading was divided by 40 to obtain the
dissolved oxygen in mg/L.
5
Nitrites. 5 mL of sample was placed in a viewing bottle. One nitriver reagent was
added to the sample. It was shaken for a minute and allowed to stand for 10 minutes . If
nitrites is present, the solution will turn red. The presence of nitrites was determined through
a color comparator disc.
Carbon dioxide. 100 ml of sample was placed in an Erlenmeyer flask.
Phenolphthalein powder was then added to the sample and mixed by gently swirling the
flask. It was then titrated with 0.3636 N Sodium Hydroxide until light pink persisted for 30
seconds. Reading is divided by 5 to get the CO2 in mg/L.
Ammonia. 5 ml of sample was placed in a viewing bottle. Ammonia Salicylate
reagent powder was added to the bottle and was shaken until completely dissolved. It was
allowed to stand for 3 minutes. Ammonia Cyanurate reagent powder was then added and the
bottle was shaken. It was again allowed to stand for 15 minutes. Ammonia content was
determined through a reading in a color comparator disc.
Salinity. Salinity was determined using a refractometer. About 2 drops of the sample
was placed on refractometer and salinity was determined by the reading.
The above procedures were repeated 3 times and the means were solved for the 2
beaches.
Diversity of Macroinvertebrates
Sampling. Quadrat method of sampling was used in picking the sampling site.
Quadrants were formed by drawing 2 lines, 10 m apart, from one wall to the other wall. This
is parallel to the shore. Quadrants were 10 meters apart from each other. A total of 5
quadrants were formed measuring about 10m. x 450m. These were the sampling sites for the
study, where the macroinvertebrates in it were photographed, identified and counted. The
frequency of occurrence was also noted. From the data gathered, density, frequency,
dominance and general diversity were solved using the following formula:
1. Density (D) = the number of individuals in each quadrant.
𝐷 =𝑁𝑢𝑚𝑏𝑒𝑟𝑜𝑓𝐼𝑛𝑑𝑖𝑣𝑖𝑑𝑢𝑎𝑙𝐺𝑒𝑛𝑢𝑠𝑁
𝐴𝑟𝑒𝑎𝑠𝑎𝑚𝑝𝑙𝑒𝑑𝐴
2. Relative Density (RD) = the proportion of the density of the genus to the total
density of all genera.
𝑅𝐷 =𝐷𝑜𝑓𝐺𝑒𝑛𝑢𝑠𝐼
𝑇𝑜𝑡𝑎𝑙𝐷𝑜𝑓𝑎𝑙𝑙𝑔𝑒𝑛𝑒𝑟𝑎𝑥 100
3. Frequency (F) = the proportion of the number of quadrants in which the genus I
occurs to the total number of quadrants examined.
𝐹 =𝑁𝑢𝑚𝑏𝑒𝑟𝑜𝑓𝑝𝑙𝑜𝑡𝑠𝑖𝑛𝑤ℎ𝑖𝑐ℎ𝑔𝑒𝑛𝑢𝑠𝐼𝑜𝑐𝑐𝑢𝑟
𝑇𝑜𝑡𝑎𝑙𝑛𝑢𝑚𝑏𝑒𝑟𝑜𝑓𝑞𝑢𝑎𝑑𝑟𝑎𝑛𝑡𝑠𝑒𝑥𝑎𝑚𝑖𝑛𝑒𝑑
4. Relative Frequency (RF) = the proportion of the frequency of the genus to the
total
frequency of all genera.
𝑅𝐹 =𝐹𝑣𝑎𝑙𝑢𝑒𝑜𝑓𝑔𝑒𝑛𝑢𝑠𝐼
𝑇𝑜𝑡𝑎𝑙𝐹𝑣𝑎𝑙𝑢𝑒𝑜𝑓𝑎𝑙𝑙𝑔𝑒𝑛𝑒𝑟𝑎𝑥 100
5. Dominance (Dom)(Cover) = the area covered by genus I in each quadrant.
6
𝐷𝑜𝑚 =𝑎𝑟𝑒𝑎𝑐𝑜𝑣𝑒𝑟𝑒𝑑𝑏𝑦𝑔𝑒𝑛𝑢𝑠𝐼
𝐴𝑟𝑒𝑎𝑆𝑎𝑚𝑝𝑙𝑒𝑑
6. Relative Dominance (RDom) = the proportion of the dominance of the genus to
the
total dominance of a genera.
𝑅𝐷𝑜𝑚 =𝐷𝑜𝑚𝑖𝑛𝑎𝑛𝑐𝑒𝑜𝑓𝑔𝑒𝑛𝑢𝑠𝐼
𝑇𝑜𝑡𝑎𝑙𝑑𝑜𝑚𝑖𝑛𝑎𝑛𝑐𝑒𝑜𝑓𝑎𝑙𝑙𝑔𝑒𝑛𝑒𝑟𝑎𝑥 100
7. Genus Importance Value (GIV) = RD + RF + RDom
8. Index of Dominance
𝐶 = ∑(𝑛𝑖
𝑁)2
where ∶ ni = importance of value of species A N = total of importance value of all species
9. Index of General Diversity (H) = a modified version of Shannon’s index of
diversity which is applied only on the species level.
𝐻 = ∑ (𝑛𝑖
𝑁) log (
𝑛𝑖
𝑁)
where: ni = the GIV of genus I
N = the total GIV of all genera If H> I ; diversity is high
H<I ; diversity is low
All these procedure, from the water analysis to the identification of the
macroinvertebrates, were done in the open and semi-enclosed beach.
Data Analysis
In analyzing the data, the following statistical tools are employed:
Descriptive Statistics. The mean values of the data from every test were obtained to
describe the water quality of the beaches.
T-test.T-test was used to compare the mean values of each water quality parameter of
the 2 beaches under study.
FINDINGS AND DISCUSSIONS
The following were the results obtained from water analyses done on April 11, 2013,
and exploration of the beach for macroinvertebrates present done on March 27-28, 2013.
Physico-Chemical Test
Water quality analyses were performed on site using Hach Kit method. The following
were the results obtained:
Test for pH.
For hard-shelled marine organisms (like clams, corals, and hermit crabs), water with a
pH of about 8.2 is ideal. This chemistry makes it easy to assemble external skeletons from
bicarbonate ions, the main form of carbon dissolved in the ocean. But the increase in carbon
7
dioxide is decreasing the ocean's pH. This change is hampering the development of these
creatures, leaving them more vulnerable to environmental stressors (Hofmann, 2009).
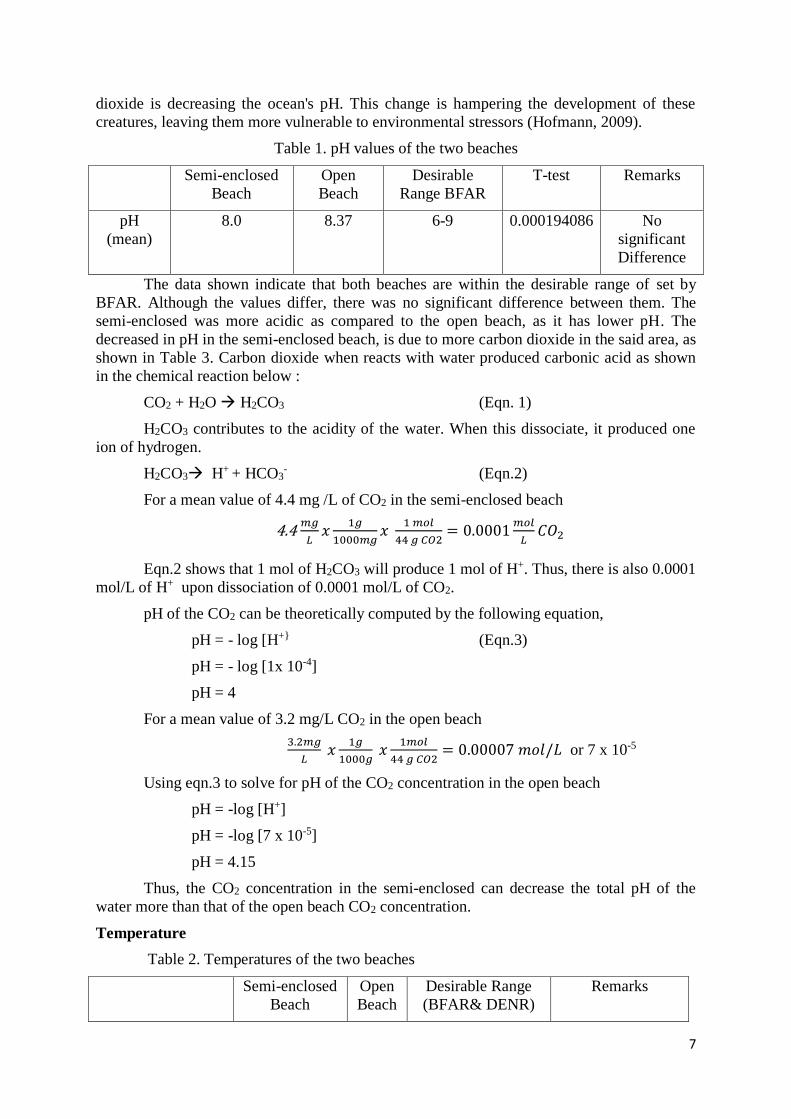
Table 1. pH values of the two beaches
Semi-enclosed
Beach
Open
Beach
Desirable
Range BFAR
T-test Remarks
pH
(mean)
8.0 8.37 6-9 0.000194086 No
significant
Difference
The data shown indicate that both beaches are within the desirable range of set by
BFAR. Although the values differ, there was no significant difference between them. The
semi-enclosed was more acidic as compared to the open beach, as it has lower pH. The
decreased in pH in the semi-enclosed beach, is due to more carbon dioxide in the said area, as
shown in Table 3. Carbon dioxide when reacts with water produced carbonic acid as shown
in the chemical reaction below :
CO2 + H2O H2CO3 (Eqn. 1)
H2CO3 contributes to the acidity of the water. When this dissociate, it produced one
ion of hydrogen.
H2CO3 H+ + HCO3- (Eqn.2)
For a mean value of 4.4 mg /L of CO2 in the semi-enclosed beach
4.4 𝑚𝑔
𝐿𝑥
1𝑔
1000𝑚𝑔𝑥
1 𝑚𝑜𝑙
44 𝑔 𝐶𝑂2= 0.0001
𝑚𝑜𝑙
𝐿𝐶𝑂2
Eqn.2 shows that 1 mol of H2CO3 will produce 1 mol of H+. Thus, there is also 0.0001
mol/L of H+ upon dissociation of 0.0001 mol/L of CO2.
pH of the CO2 can be theoretically computed by the following equation,
pH = - log [H+} (Eqn.3)
pH = - log [1x 10⁻⁴]
pH = 4
For a mean value of 3.2 mg/L CO2 in the open beach
3.2𝑚𝑔
𝐿 𝑥
1𝑔
1000𝑔 𝑥
1𝑚𝑜𝑙
44 𝑔 𝐶𝑂2= 0.00007 𝑚𝑜𝑙/𝐿 or 7 x 10⁻⁵
Using eqn.3 to solve for pH of the CO2 concentration in the open beach
pH = -log [H+]
pH = -log [7 x 10⁻⁵]
pH = 4.15
Thus, the CO2 concentration in the semi-enclosed can decrease the total pH of the
water more than that of the open beach CO2 concentration.
Temperature
Table 2. Temperatures of the two beaches
Semi-enclosed
Beach
Open
Beach
Desirable Range
(BFAR& DENR)
Remarks
8
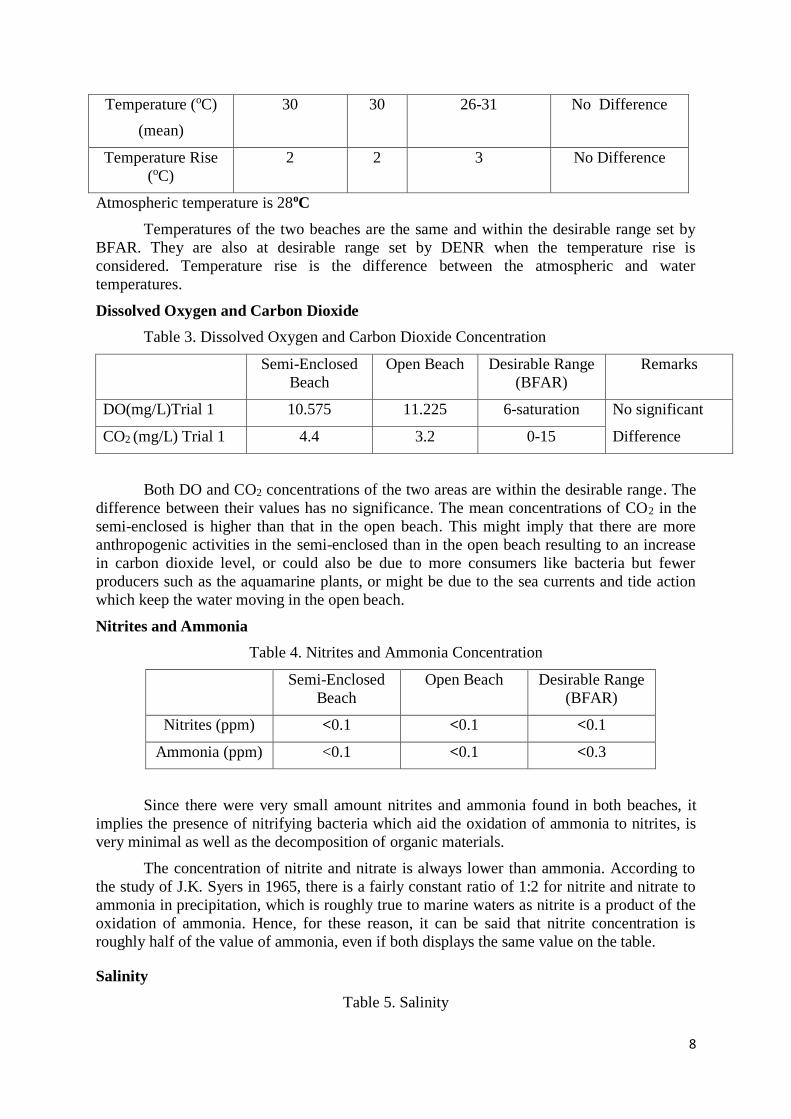
Temperature (oC)
(mean)
30 30 26-31 No Difference
Temperature Rise
(oC)
2 2 3 No Difference
Atmospheric temperature is 28oC
Temperatures of the two beaches are the same and within the desirable range set by
BFAR. They are also at desirable range set by DENR when the temperature rise is
considered. Temperature rise is the difference between the atmospheric and water
temperatures.
Dissolved Oxygen and Carbon Dioxide
Table 3. Dissolved Oxygen and Carbon Dioxide Concentration
Semi-Enclosed
Beach
Open Beach Desirable Range
(BFAR)
Remarks
DO(mg/L)Trial 1 10.575 11.225 6-saturation No significant
CO2 (mg/L) Trial 1 4.4 3.2 0-15 Difference
Both DO and CO2 concentrations of the two areas are within the desirable range. The
difference between their values has no significance. The mean concentrations of CO2 in the
semi-enclosed is higher than that in the open beach. This might imply that there are more
anthropogenic activities in the semi-enclosed than in the open beach resulting to an increase
in carbon dioxide level, or could also be due to more consumers like bacteria but fewer
producers such as the aquamarine plants, or might be due to the sea currents and tide action
which keep the water moving in the open beach.
Nitrites and Ammonia
Table 4. Nitrites and Ammonia Concentration
Semi-Enclosed
Beach
Open Beach Desirable Range
(BFAR)
Nitrites (ppm) <0.1 <0.1 <0.1
Ammonia (ppm) <0.1 <0.1 <0.3
Since there were very small amount nitrites and ammonia found in both beaches, it
implies the presence of nitrifying bacteria which aid the oxidation of ammonia to nitrites, is
very minimal as well as the decomposition of organic materials.
The concentration of nitrite and nitrate is always lower than ammonia. According to
the study of J.K. Syers in 1965, there is a fairly constant ratio of 1:2 for nitrite and nitrate to
ammonia in precipitation, which is roughly true to marine waters as nitrite is a product of the
oxidation of ammonia. Hence, for these reason, it can be said that nitrite concentration is
roughly half of the value of ammonia, even if both displays the same value on the table.
Salinity
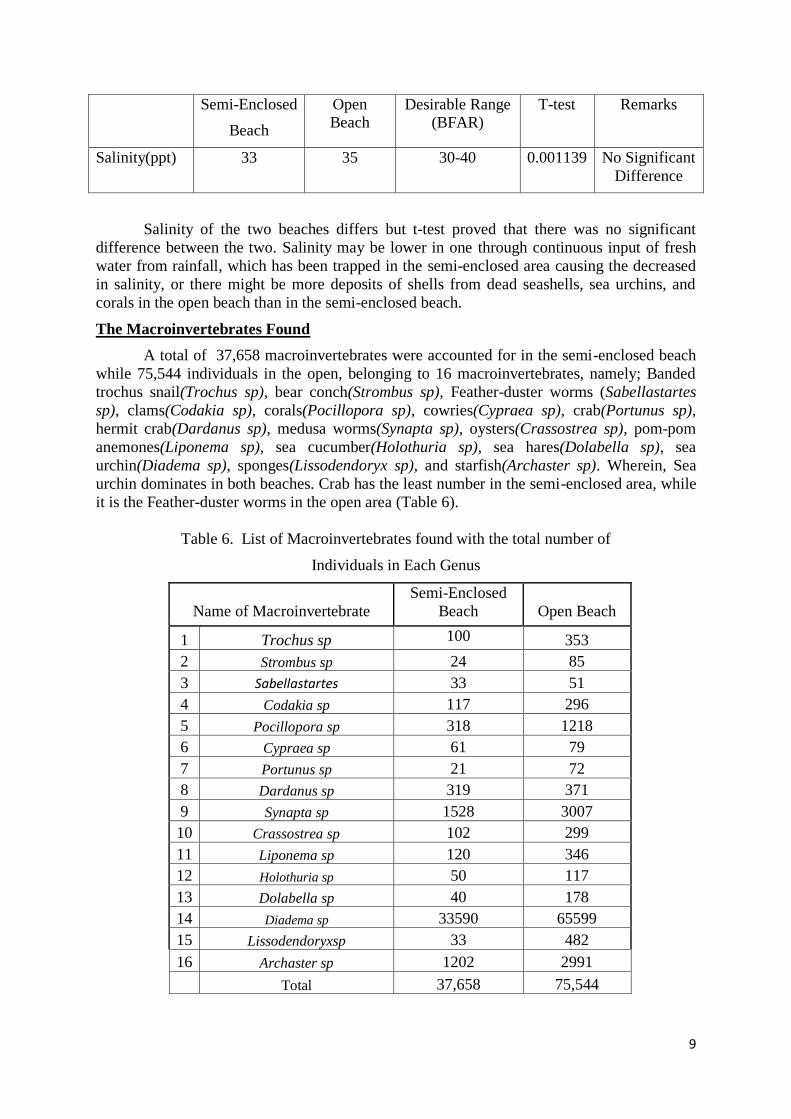
Table 5. Salinity
9
Semi-Enclosed
Beach
Open Beach
Desirable Range (BFAR)
T-test Remarks
Salinity(ppt) 33 35 30-40 0.001139 No Significant
Difference
Salinity of the two beaches differs but t-test proved that there was no significant
difference between the two. Salinity may be lower in one through continuous input of fresh
water from rainfall, which has been trapped in the semi-enclosed area causing the decreased
in salinity, or there might be more deposits of shells from dead seashells, sea urchins, and
corals in the open beach than in the semi-enclosed beach.
The Macroinvertebrates Found
A total of 37,658 macroinvertebrates were accounted for in the semi-enclosed beach
while 75,544 individuals in the open, belonging to 16 macroinvertebrates, namely; Banded
trochus snail(Trochus sp), bear conch(Strombus sp), Feather-duster worms (Sabellastartes
sp), clams(Codakia sp), corals(Pocillopora sp), cowries(Cypraea sp), crab(Portunus sp),
hermit crab(Dardanus sp), medusa worms(Synapta sp), oysters(Crassostrea sp), pom-pom
anemones(Liponema sp), sea cucumber(Holothuria sp), sea hares(Dolabella sp), sea
urchin(Diadema sp), sponges(Lissodendoryx sp), and starfish(Archaster sp). Wherein, Sea
urchin dominates in both beaches. Crab has the least number in the semi-enclosed area, while
it is the Feather-duster worms in the open area (Table 6).
Table 6. List of Macroinvertebrates found with the total number of
Individuals in Each Genus
Name of Macroinvertebrate
Semi-Enclosed
Beach Open Beach
1 Trochus sp 100
100
353
2 Strombus sp 24 85
3 Sabellastartes 33 51
4 Codakia sp 117 296
5 Pocillopora sp 318 1218
6 Cypraea sp 61 79
7 Portunus sp 21 72
8 Dardanus sp 319 371
9 Synapta sp 1528 3007
10 Crassostrea sp 102 299
11 Liponema sp 120 346
12 Holothuria sp 50 117
13 Dolabella sp 40 178
14 Diadema sp 33590 65599
15 Lissodendoryxsp 33 482
16 Archaster sp 1202 2991
Total 37,658 75,544
10
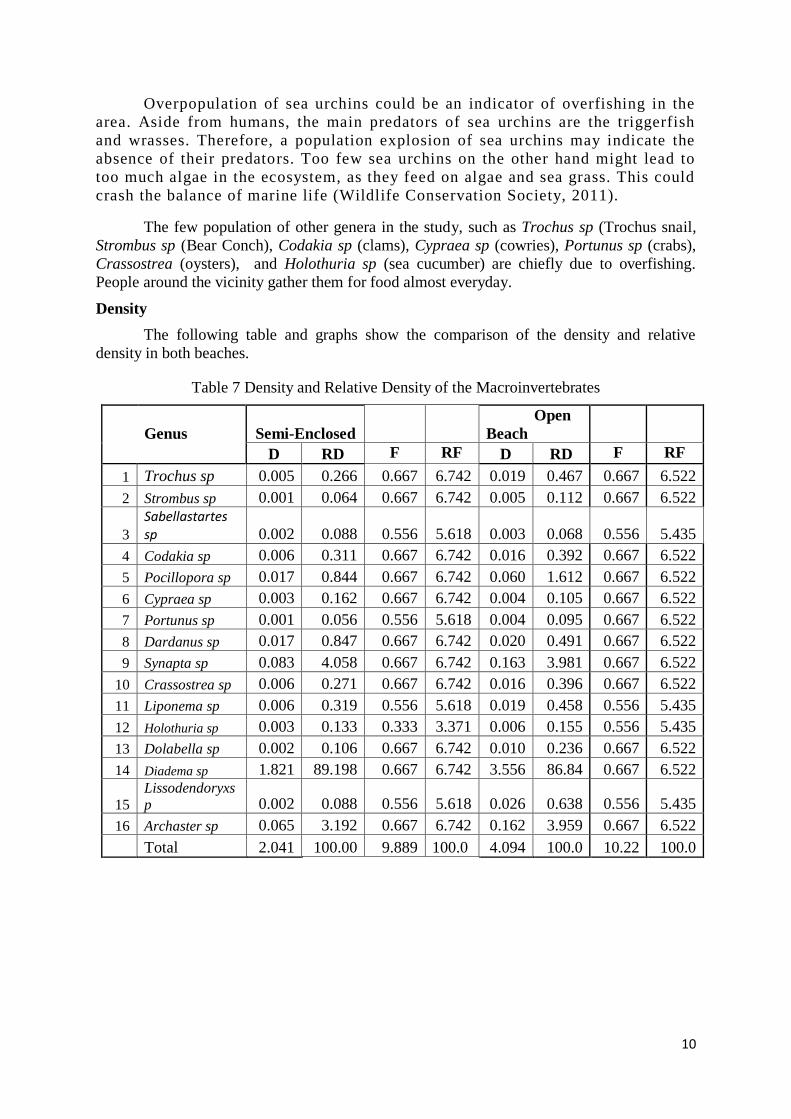
Overpopulation of sea urchins could be an indicator of overfishing in the
area. Aside from humans, the main predators of sea urchins are the triggerfish
and wrasses. Therefore, a population explosion of sea urchins may indicate the
absence of their predators. Too few sea urchins on the other hand might lead to
too much algae in the ecosystem, as they feed on algae and sea grass. This could
crash the balance of marine life (Wildlife Conservation Society, 2011).
The few population of other genera in the study, such as Trochus sp (Trochus snail,
Strombus sp (Bear Conch), Codakia sp (clams), Cypraea sp (cowries), Portunus sp (crabs),
Crassostrea (oysters), and Holothuria sp (sea cucumber) are chiefly due to overfishing.
People around the vicinity gather them for food almost everyday.
Density
The following table and graphs show the comparison of the density and relative
density in both beaches.
Table 7 Density and Relative Density of the Macroinvertebrates
Genus Semi-Enclosed
Open
Beach
D RD F RF D RD F RF
1 Trochus sp 0.005 0.266 0.667 6.742 0.019 0.467 0.667 6.522
2 Strombus sp 0.001 0.064 0.667 6.742 0.005 0.112 0.667 6.522
3
Sabellastartes sp 0.002 0.088 0.556 5.618 0.003 0.068 0.556 5.435
4 Codakia sp 0.006 0.311 0.667 6.742 0.016 0.392 0.667 6.522
5 Pocillopora sp 0.017 0.844 0.667 6.742 0.060 1.612 0.667 6.522
6 Cypraea sp 0.003 0.162 0.667 6.742 0.004 0.105 0.667 6.522
7 Portunus sp 0.001 0.056 0.556 5.618 0.004 0.095 0.667 6.522
8 Dardanus sp 0.017 0.847 0.667 6.742 0.020 0.491 0.667 6.522
9 Synapta sp 0.083 4.058 0.667 6.742 0.163 3.981 0.667 6.522
10 Crassostrea sp 0.006 0.271 0.667 6.742 0.016 0.396 0.667 6.522
11 Liponema sp 0.006 0.319 0.556 5.618 0.019 0.458 0.556 5.435
12 Holothuria sp 0.003 0.133 0.333 3.371 0.006 0.155 0.556 5.435
13 Dolabella sp 0.002 0.106 0.667 6.742 0.010 0.236 0.667 6.522
14 Diadema sp 1.821 89.198 0.667 6.742 3.556 86.84 0.667 6.522
15
Lissodendoryxs
p 0.002 0.088 0.556 5.618 0.026 0.638 0.556 5.435
16 Archaster sp 0.065 3.192 0.667 6.742 0.162 3.959 0.667 6.522
Total 2.041 100.00 9.889 100.0 4.094 100.0 10.22 100.0
11
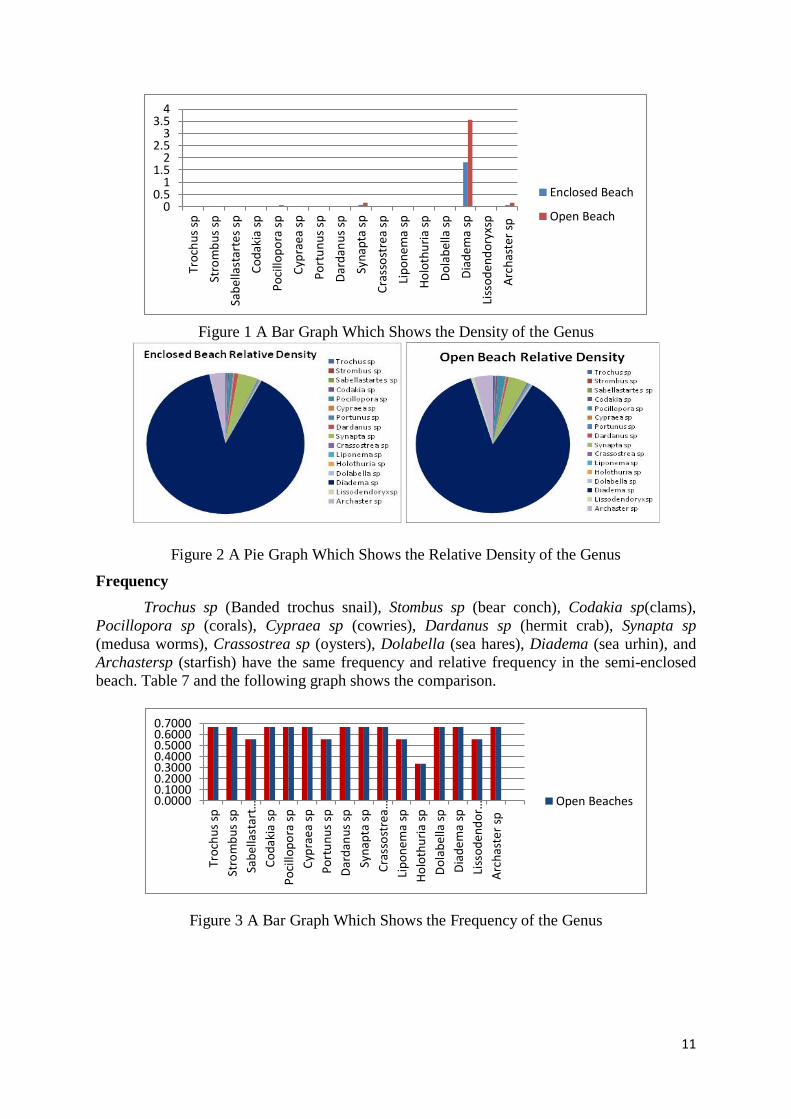
Figure 1 A Bar Graph Which Shows the Density of the Genus
Figure 2 A Pie Graph Which Shows the Relative Density of the Genus
Frequency
Trochus sp (Banded trochus snail), Stombus sp (bear conch), Codakia sp(clams),
Pocillopora sp (corals), Cypraea sp (cowries), Dardanus sp (hermit crab), Synapta sp
(medusa worms), Crassostrea sp (oysters), Dolabella (sea hares), Diadema (sea urhin), and
Archastersp (starfish) have the same frequency and relative frequency in the semi-enclosed
beach. Table 7 and the following graph shows the comparison.
Figure 3 A Bar Graph Which Shows the Frequency of the Genus
00.5
11.5
22.5
33.5
4
Tro
chu
s sp
Stro
mb
us
sp
Sab
ella
star
tes
sp
Co
dak
ia s
p
Po
cillo
po
ra s
p
Cyp
raea
sp
Po
rtu
nu
s sp
Dar
dan
us
sp
Syn
apta
sp
Cra
sso
stre
a sp
Lip
on
ema
sp
Ho
loth
uri
a sp
Do
lab
ella
sp
Dia
dem
a sp
Liss
od
end
ory
xsp
Arc
has
ter
sp
Enclosed Beach
Open Beach
0.00000.10000.20000.30000.40000.50000.60000.7000
Tro
chu
s sp
Stro
mb
us
sp
Sabellastart…
Co
dak
ia s
p
Po
cillo
po
ra s
p
Cyp
raea
sp
Po
rtu
nu
s sp
Dar
dan
us
sp
Syn
apta
sp
Crassostrea…
Lip
on
ema
sp
Ho
loth
uri
a sp
Do
lab
ella
sp
Dia
dem
a sp
Lissoden
dor…
Arc
has
ter
sp
Open Beaches

12
Figure 4 A Pie Graph Which Shows the Relative Frequency of the Genus
Dominance
Table 8 Dominance and Relative Dominance of the Macroinvertebrates
Macroinvertebrates Semi-Enclosed Beach Open Beach
Dom RDom Dom RDom
1 Trochus sp 3.230E-06 5.752E-02 1.140E-05 8.737E-02
2 Strombus sp 1.277E-06 2.274E-02 4.523E-06 3.466E-02
3 Sabellastartes sp 8.780E-07 1.563E-02 1.357E-06 1.040E-02
4 Codakia sp 7.559E-06 1.346E-01 1.912E-05 1.465E-01
5 Pocillopora sp 5.415E-04 9.642E+00 2.074E-03 1.589E+01
6 Cypraea sp 1.971E-06 3.509E-02 2.552E-06 1.955E-02
7 Portunus sp 1.490E-06 2.653E-02 5.108E-06 3.914E-02
8 Dardanus sp 1.030E-05 1.835E-01 1.198E-05 9.183E-02
9 Synapta sp 8.017E-04 1.428E+01 1.578E-03 1.209E+01
10 Crassostrea sp 3.295E-06 5.867E-02 9.659E-06 7.401E-02
11 Liponema sp 1.277E-05 2.274E-01 3.682E-05 2.821E-01
12 Holothuria sp 7.870E-05 1.401E+00 1.842E-04 1.411E+00
13 Dolabella sp 8.514E-06 1.516E-01 3.789E-05 2.903E-01
14 Diadema sp 3.575E-03 6.366E+01 6.981E-03 5.349E+01
15 Lissodendoryxsp 5.619E-05 1.001E+00 8.207E-04 6.288E+00
16 Archaster sp 5.117E-04 9.111E+00 1.273E-03 9.756E+00
Total 5.616E-03 1.000E+02 1.305E-02 1.000E+02
Figure 5 A Bar Graph Which Shows the Dominance of the Genus
0.000E+00
2.000E-03
4.000E-03
6.000E-03
8.000E-03
Tro
chu
s sp
Stro
mb
us
spSabellastart…
Co
dak
ia s
pPocillo
pora…
Cyp
raea
sp
Po
rtu
nu
s sp
Dar
dan
us
spSy
nap
ta s
pCrassostrea…
Lip
on
ema
spH
olo
thu
ria
spD
ola
bel
la s
pD
iad
ema
spLissoden
do…
Arc
has
ter
sp
Enclosed Beach
Open Beach
13
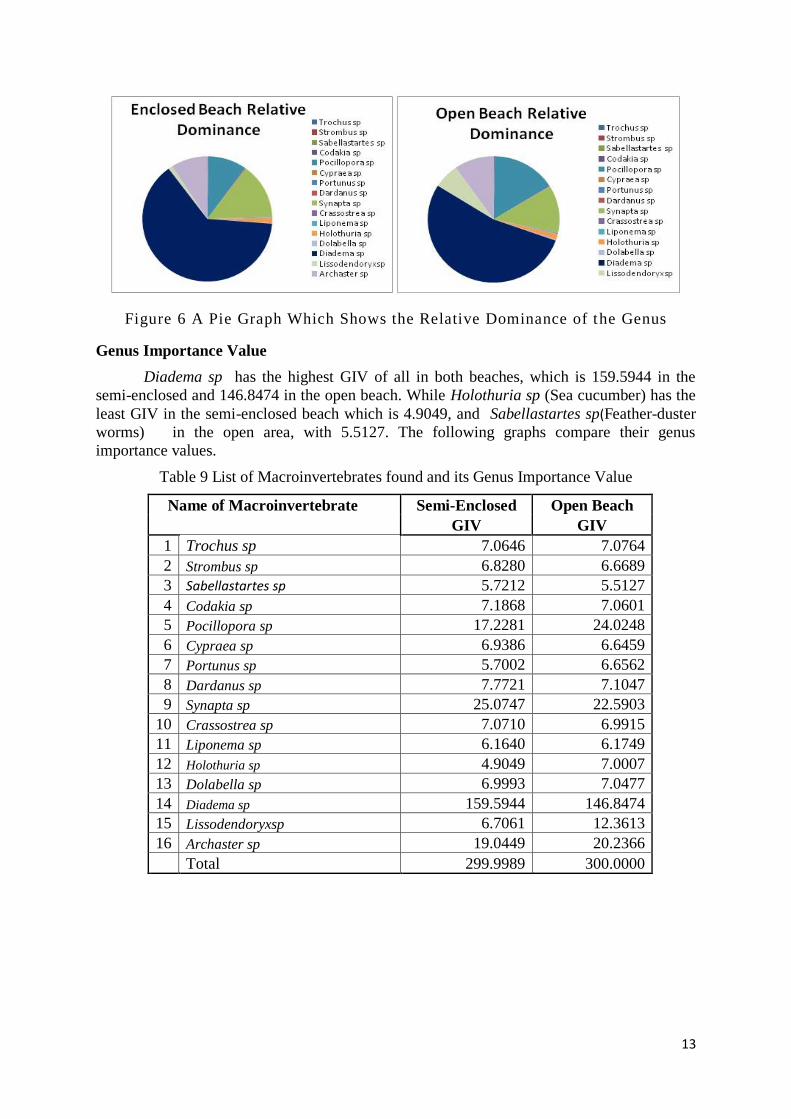
Figure 6 A Pie Graph Which Shows the Relative Dominance of the Genus
Genus Importance Value
Diadema sp has the highest GIV of all in both beaches, which is 159.5944 in the
semi-enclosed and 146.8474 in the open beach. While Holothuria sp (Sea cucumber) has the
least GIV in the semi-enclosed beach which is 4.9049, and Sabellastartes sp(Feather-duster
worms) in the open area, with 5.5127. The following graphs compare their genus
importance values.
Table 9 List of Macroinvertebrates found and its Genus Importance Value
Name of Macroinvertebrate Semi-Enclosed Open Beach
GIV GIV
1 Trochus sp 7.0646 7.0764
2 Strombus sp 6.8280 6.6689
3 Sabellastartes sp 5.7212 5.5127
4 Codakia sp 7.1868 7.0601
5 Pocillopora sp 17.2281 24.0248
6 Cypraea sp 6.9386 6.6459
7 Portunus sp 5.7002 6.6562
8 Dardanus sp 7.7721 7.1047
9 Synapta sp 25.0747 22.5903
10 Crassostrea sp 7.0710 6.9915
11 Liponema sp 6.1640 6.1749
12 Holothuria sp 4.9049 7.0007
13 Dolabella sp 6.9993 7.0477
14 Diadema sp 159.5944 146.8474
15 Lissodendoryxsp 6.7061 12.3613
16 Archaster sp 19.0449 20.2366
Total 299.9989 300.0000
14
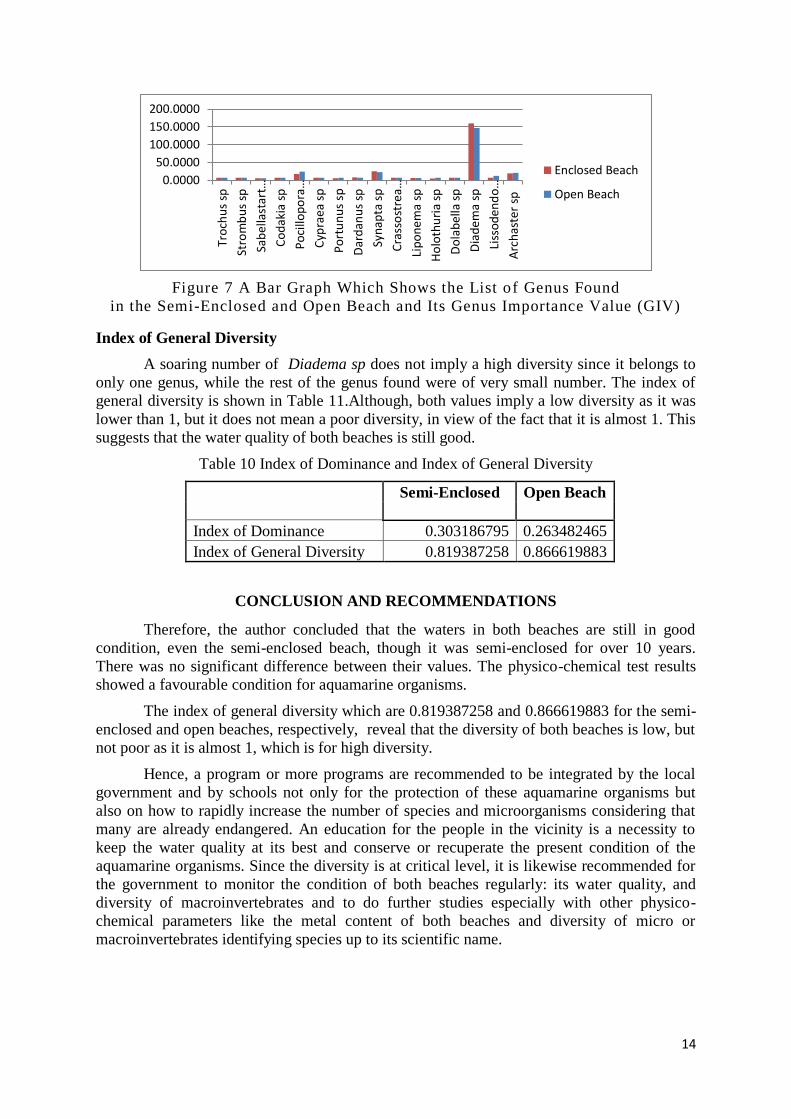
Figure 7 A Bar Graph Which Shows the List of Genus Found
in the Semi-Enclosed and Open Beach and Its Genus Importance Value (GIV)
Index of General Diversity
A soaring number of Diadema sp does not imply a high diversity since it belongs to
only one genus, while the rest of the genus found were of very small number. The index of
general diversity is shown in Table 11.Although, both values imply a low diversity as it was
lower than 1, but it does not mean a poor diversity, in view of the fact that it is almost 1. This
suggests that the water quality of both beaches is still good.
Table 10 Index of Dominance and Index of General Diversity
Semi-Enclosed Open Beach
Index of Dominance 0.303186795 0.263482465
Index of General Diversity 0.819387258 0.866619883
CONCLUSION AND RECOMMENDATIONS
Therefore, the author concluded that the waters in both beaches are still in good
condition, even the semi-enclosed beach, though it was semi-enclosed for over 10 years.
There was no significant difference between their values. The physico-chemical test results
showed a favourable condition for aquamarine organisms.
The index of general diversity which are 0.819387258 and 0.866619883 for the semi-
enclosed and open beaches, respectively, reveal that the diversity of both beaches is low, but
not poor as it is almost 1, which is for high diversity.
Hence, a program or more programs are recommended to be integrated by the local
government and by schools not only for the protection of these aquamarine organisms but
also on how to rapidly increase the number of species and microorganisms considering that
many are already endangered. An education for the people in the vicinity is a necessity to
keep the water quality at its best and conserve or recuperate the present condition of the
aquamarine organisms. Since the diversity is at critical level, it is likewise recommended for
the government to monitor the condition of both beaches regularly: its water quality, and
diversity of macroinvertebrates and to do further studies especially with other physico-
chemical parameters like the metal content of both beaches and diversity of micro or
macroinvertebrates identifying species up to its scientific name.
0.0000
50.0000
100.0000
150.0000
200.0000
Tro
chu
s sp
Stro
mb
us
sp
Sabellastart…
Co
dak
ia s
p
Pocillo
pora…
Cyp
raea
sp
Po
rtu
nu
s sp
Dar
dan
us
sp
Syn
apta
sp
Crassostrea…
Lip
on
ema
sp
Ho
loth
uri
a sp
Do
lab
ella
sp
Dia
dem
a sp
Lissoden
do…
Arc
has
ter
sp
Enclosed Beach
Open Beach
15
BIBLIOGRAPHY/REFERENCES
Alliances for the Chesapeake Bay (2010). River Trends Manual. Retreived April9, 2013
American Public Health Association (1999).Standard Methods for the Examination of Water
and Wastewater.Retreived March 7, 2013
Arp, Daniel J.(2009). Nitrification. John Wiley & Sons Inc. Retreived April 8, 2013
Berge, John Arthur, et al. (2006). Effects of Increased Seawater Concentrations of CO on
Growth of the Bivalves Mytilus Edulis L. Mendeley. Retreived April 8, 2013
Brewer and Peltzer (2009).Limits to Marine Life. Science 2009, V. 324.
Biggs, et.al.(1998). Biology The Dynamics of Life. The McGraw-Hill Companies Inc. U.S.A.
City Engineer’s Office (2000). Plan Of Land (Reclamation Project). Oroquieta City
Dela Cruz, Lessie Mae L. (2005). Diversity of Corals in Sugod, Sultan Naga Dimaporo,
Lanao del Norte. Undergraduate Thesis. MSU Marawi City
DENR Administrative Order No. 34 Series of 1996 – Revised Water Usage and
Classification. Retreived March 3, 2013
DENR Administrative Order No. 35 Series of 1996 – Revised Effluent Regulations of 1990 .
Dobson, et al (2001).Holt The Science Spectrum. Holt, Rinehart and Winston. U.S.A.
Dulay (2005).How Investment in Water, Wastewater, and Irrigation Infrastructure Has
Affected the Mexico-Texas Border. Austin, Texas.
Environmental Management Bureau-DENR (2005). DENR Administrative Order No. 2005-
10 Implementing Rules and Regulations of the Philippines Clean Water Act of 2004.
Environmental Protection Agency (EPA). Basic Information About Regulated
Drinking Water Contaminants. May 21, 2012.
Environmental Protection Agency (EPA). Water : Monitoring and Assessment. May 21,
2012. Environmental Protection Agency (1989). Ambient Water QualityCriteria for
Ammonia(Saltwater). Retreived April 7, 2013
FAO Corporate Document Repository (1987). Site Selection for Aquaculture:Chemical
Features of Water.
Farley, Randy Holmes (2008). Ammonia and the Reef Aquarium. Reefkeeping Magazine.
Gomez, Alven L.(2012). Physico-Chemical Characteristics and Plankton Composition of
Water in Cugman and Bigaan Rivers, Cagayan de Oro City. A Master’s Thesis
Mindanao University of Science and Technology, Cagayan de Oro City
Heip, Carlo(2007). Marine Biodiversity. Encyclopedia of Earth. Retreived March 7, 2013
Hofmann, Gretchen (2009). The Effects of Ocean Acidification on Tiny Marine Creatures.
University of California at Santa Barbara.
Kalthoff, Klaus, 2001. Analysis of Biological Development. The McGraw-Hill
Companies, Inc. U.S.A.
16
Kaskel, Hummer Jr. (1992) Biology An Everyday Experience. Glencoe Division of
McMillan/ McGraw-Hill Publishing Company U.S.A.
NASA Science Earth (March 10, 2013). Salinity. Retreived April 9, 2013
Oroquieta City Planning and Development Office. The Comprehensive Land Use Plan of
Oroquieta City Year 2010-2020.
Partner for Environmental Education and Rural Health (PEER). Water Quality Modules.
Texas. Retreived April 6, 2013.
Patil, G.P. (2002). Composite Sampling.Enclycopedia of Environmetrics. John Wiley & Sons,
Ltd. Chichester. Retreived March 7, 2013
PubMed (1996).Nitrification and ammonification in aquatic systems. Retreived April 9, 2013
Raven & Johnson (2002).Biology. 6th ed..McGraw-Hill Companies Inc. New York.
Redmore, Fred (1980). Fundamentals of Chemistry. Prentice-Hall, Inc. New Jersey.
Stewart, Robert H. (2005). Introduction to Physical Oceanography. Department of
Oceanography, Texas A & M University.
Syers, J. K. (1965).The Relationship Between the concentration of Nitrite- and Ammonia-
Nitrogen in Precipitation. Department of Soil Science, Lincoln College, University of
Canterbury, New Zealand
Tayo, Gilma et. al.(2004). Fundamentals of Environmental Science. Trinitus Publishing Inc.
Philippines
Thomas, R. H. (1977). An Introduction to Quadrat Analysis.Catmog 12.
Thatheyus, Joseph A. (2011). Textbook of Environmental Studies. Alpha Science
International Ltd. India
Tobin and Dusheck (1998).Asking About Life.Saunders College Publishing. U.S.A.
University of Toronto(2002).Censusing Populations in Algonquin Park.
Ultsch, Gordon (1971). The Relationship of Dissolved Carbon Dioxide and Oxygen to
Microhabitat Selection in Pseudobranchus Striatus. American Society of
Ichthyologists and Herpetologists..
Wildlife Conservation Society (January 11, 2011). Coral Reefs and Scourge of Sea Urchins.

17