Renewable Diesel from Algal Lipis: An Integrated Baseline ...

PHYSICIAN INTEGRATED NETWORK BASELINE EVALUATION: Linking Electronic Medical Records and Administrative DataAugust 2010
Manitoba Centre for Health Policy
Department of Community Health SciencesFaculty of Medicine, University of Manitoba
Authors: Alan Katz, MBChB, MSc, CCFP, FCFP Bogdan Bogdanovic, BComm, BA (Econ) Ruth-Ann Soodeen, MSc

This report is produced and published by the Manitoba Centre for Health Policy (MCHP). It is also available in PDF format on our website at:http://mchp-appserv.cpe.umanitoba.ca/deliverablesList.html
Information concerning this report or any other report produced by MCHP can be obtained by contacting:
Manitoba Centre for Health PolicyDept. of Community Health SciencesFaculty of Medicine, University of Manitoba4th Floor, Room 408727 McDermot AvenueWinnipeg, Manitoba, CanadaR3E 3P5
Email: [email protected]: (204) 789-3819Fax: (204) 789-3910
How to cite this report:
Katz A, Bogdanovic B, Soodeen R. Physician Integrated Network Baseline Evaluation: Linking Electronic Medical Records and Administrative Data. Winnipeg, MB: Manitoba Centre for Health Policy, August 2010.
Legal Deposit:
Manitoba Legislative LibraryNational Library of Canada
ISBN 978-1-896489-54-4
©Manitoba HealthThis report may be reproduced, in whole or in part, provided the source is cited.
1st printing (August 2010)
Th is work was supported through funding provided by the Department of Health of the Province of Manitoba to the University of Manitoba. Th e results and conclusions are those of the authors and no offi cial endorsement by Manitoba Health was intended or should be inferred. Data used in this study are from the Population Health Research Data Repository housed at the Manitoba Centre for Health Policy, University of Manitoba.

PHYSICIAN INTEGRATED NETWORK BASELINE EVALUATION: Linking Electronic Medical Records and Administrative DataAugust 2010
Manitoba Centre for Health Policy
Department of Community Health SciencesFaculty of Medicine, University of Manitoba
Authors: Alan Katz, MBChB, MSc, CCFP, FCFP Bogdan Bogdanovic, BComm, BA (Econ) Ruth-Ann Soodeen, MSc

II | University of Manitoba

III
About the Manitoba
Centre For Health Policy
The Manitoba Centre for Health Policy (MCHP) is located within the Department of Community Health Sciences, Faculty of Medicine, University of Manitoba. The mission of MCHP is to provide accurate and timely information to health care decision-makers, analysts and providers, so they can off er services which are eff ective and effi cient in maintaining and improving the health of Manitobans. Our researchers rely upon the unique Population Health Research Data Repository (Repository) to describe and explain patterns of care and profi les of illness, and to explore other factors that infl uence health, including income, education, employment and social status. This Repository is unique in terms of its comprehensiveness, degree of integration, and orientation around an anonymized population registry.
Members of MCHP consult extensively with government offi cials, health care administrators, and clinicians to develop a research agenda that is topical and relevant. This strength, along with its rigorous academic standards, enables MCHP to contribute to the health policy process. MCHP undertakes several major research projects, such as this one, every year under contract to Manitoba Health (MB Health). In addition, our researchers secure external funding by competing for research grants. We are widely published and internationally recognized. Further, our researchers collaborate with a number of highly respected scientists from Canada, the United States, Europe and Australia.
We thank the University of Manitoba, Faculty of Medicine, Health Research Ethics Board for their review of this project. MCHP complies with all legislative acts and regulations governing the protection and use of sensitive information. We implement strict policies and procedures to protect the privacy and security of anonymized data used to produce this report and we keep the provincial Health Information Privacy Committee informed of all work undertaken for MB Health.

IV
Acknowledgements
The principal author, Alan Katz, thanks all members of the research team whose knowledge, skills and expertise were essential to the generation of this report. It has been a privilege to work with this committed group. In particular, Bogdan Bogdanovic for his programming, creative approach to problem solving, and insight into the data repository, and Ruth-Ann Soodeen for keeping us on track and her signifi cant contribution to the fi nal report. This report forms part of Phase 1 of the PIN Evaluation. As such the PIN team, and, in particular, Jeannette Edwards played a huge role in shaping the research questions and how they were answered. The Evaluation Committee of PIN served as our Advisory Group providing real world feedback and insight into our fi ndings: Jide Babalola, Louis Barre, Lorraine Decombe Dewer, Mark Duerksen, Tom Fogg, Jeanette Edwards, Carol Holmes, Sarah Kredentser, Brian Rumbolt, Caroline Sztaba, Cornnelius Woelk, and Anna Ziomek.
There are also many others whose contribution is also greatly appreciated:
Colleagues at MCHP who provided valuable input with the methodology and general guidance throughout the process as well as invaluable feedback on earlier drafts of this report including, amongst others, Pat Martens, Randy Fransoo, Malcolm Doupe, Greg Finlayson, Dan Chateau, Marni Brownell and Mariette Chartier.
The fi nal report is the product of the combined eff orts of many staff at MCHP including Leanne Rajotte, Angela Bailly, Jessica Jarmasz and Eleanor Van Delden.
The external academic reviews provided by Patricia Sullivan-Taylor and Brian Hutchison were thoughtful, insightful and constructively critical.
We acknowledge the fi nancial support of the Department of Health of the Province of Manitoba. The results and conclusions are those of the authors and no offi cial endorsement by Manitoba Health was intended or should be inferred. This report was prepared at the request of Manitoba Health, as part of the contract between the University of Manitoba and Manitoba Health.

V
Table of Contents
Executive Summary ........................................................................................................................................................................................ XI
Chapter 1: Introduction .................................................................................................................................................................................. 1
Background ........................................................................................................................................................................................ 1
Evaluation Framework ........................................................................................................................................................................... 2
Purpose of this Report ........................................................................................................................................................................... 3
Chapter 2: PIN Clinic Profi les ......................................................................................................................................................................... 5
Chapter 3: Methods ........................................................................................................................................................................................ 13
Data Sources and Data Period ............................................................................................................................................................ 13
Data Linkage........... ................................................................................................................................................................................... 14
Exclusions ............. ..................................................................................................................................................................................... 14
Patient Allocation .................................................................................................................................................................................... 16
Virtual Practices ....................................................................................................................................................................................... 18
Measuring the Indicators ...................................................................................................................................................................... 18
Statistical Analyses .................................................................................................................................................................................. 18
Chapter 4: Results ........................................................................................................................................................................................ 21
Comparison of Patient Age and Sex Characteristics between Data Sources .................................................................. 21
How the Indicator Results are Presented ....................................................................................................................................... 27
Preventive Care ........................................................................................................................................................................................ 28
Cervical Cancer Screening ...................................................................................................................................................... 28
Childhood Immunizations ...................................................................................................................................................... 30
Infl uenza Vaccination (fl u shots) for Patients Aged 65 years and Older ............................................................... 32
Breast Cancer Screening .......................................................................................................................................................... 34
Acute and Chronic Disease Care ........................................................................................................................................................ 36
Antibiotic Prescription Rates .................................................................................................................................................. 36
Antidepressant Prescription Follow–Up ........................................................................................................................... 38
Depression Prevalence .................................................................................................................................................. 38
Antidepressant Follow–Up Care (Outcome) .......................................................................................................... 40
Asthma Care ................................................................................................................................................................................. 42
Asthma Prevalence ........................................................................................................................................................... 42
Asthma Treatment (Outcome) ..................................................................................................................................... 44
Benzodiazepine Prescribing for Community–Dwelling Adults Aged 75 and Older ...................................... 46

VI
Congestive Heart Failure (CHF): Treatment with an Angiotensin Converting Enzyme Inhibitor (ACEI) or an Angiotensin II Receptor Blocker (ARB) ................................................................................................................... 48
CHF Prevalence .................................................................................................................................................................. 48
CHF—Initiation of Treatment (Outcome) .............................................................................................................. 50
CHF—Persistent Use of Treatment (Outcome) .................................................................................................... 52
Diabetes Care ............................................................................................................................................................................... 54
Diabetes Prevalence ........................................................................................................................................................ 54
Diabetes Treatment .......................................................................................................................................................... 56
Post–Myocardial Infarction (MI) Care: Treatment with Beta–Blockers .................................................................. 58
Prevalence of Myocardial Infarction .......................................................................................................................... 58
Post–MI—Initiation of Beta–Blocker Treatment (Outcome) ........................................................................... 60
Post–MI—Persistent Use of Beta–Blocker Treatment (Outcome) ................................................................ 62
Post–Myocardial Infarction (MI) Care: Treatment with Cholesterol–Lowering Drugs .................................... 64
Prevalence of Myocardial Infarction .......................................................................................................................... 64
Post–MI—Initiation of Cholesterol–Lowering Treatment (Outcome) ......................................................... 66
Post–MI—Persistent Use of Cholesterol–Lowering Treatment (Outcome) .............................................. 68
Chapter 5: Discussion ...................................................................................................................................................................................... 71
Future Research ........................................................................................................................................................................................ 72
Glossary............................ ..................................................................................................................................................................................... 74
Reference List.............. ........................................................................................................................................................................................ 80
Appendix...................... ........................................................................................................................................................................................ 81
Recent MCHP Publications ............................................................................................................................................................................ 83

VII
List of Tables
Table 3.1: Final Study Cohort Development ............................................................................................................................... 15
Table 3.2: Patients Attending Multiple Clinics ............................................................................................................................ 16
Table 3.3: Patient Allocation ............................................................................................................................................................... 17
Table 3.4: Indicators of Quality Primary Care .............................................................................................................................. 19
Table 4.1: Female Patients Aged 16–60 ......................................................................................................................................... 28
Table 4.2: Female Patients Aged 16–60 Screened for Cervical Cancer ............................................................................ 28
Table 4.3: Children Who Turned Two Years in the Study Period ......................................................................................... 30
Table 4.4: Two–Year–Olds with Complete Immunizations .................................................................................................... 30
Table 4.5: Patients Aged 65 and Older ........................................................................................................................................... 32
Table 4.6: Patients Aged 65 and Older Who Had At Least One Flu Vaccination .......................................................... 32
Table 4.7: Female Patients Aged 50–69 ........................................................................................................................................ 34
Table 4.8: Female Patients Aged 50–69 Who Had At Least One Mammogram ............................................................ 34
Table 4.9: All Patients Who Had At Least One Clinic Visit in the Study Period .............................................................. 36
Table 4.10: Patients with At Least One Antibiotic Prescription .............................................................................................. 36
Table 4.11: Patients Newly Diagnosed with Depression .......................................................................................................... 38
Table 4.12: Patients with Depression Who Had Three Follow–Up Ambulatory Physician Visits within Four Months of Filling a Prescription for an Antidepressant ............................................................................ 70
Table 4.13: Patients with Asthma ....................................................................................................................................................... 42
Table 4.14: Asthmatic Patients Who Had At Least One Prescription for Long–Term Control of Asthma .............. 44
Table 4.15: Community–Dwelling Patients Aged 75 and Older ............................................................................................ 46
Table 4.16: Community-Dwelling Patients Aged 75 and Older Who Filled Prescriptions for more than a 30-day Supply of Benzodiazepines or a Prescription for more than two Benzodiazepines ............ 46
Table 4.17: Patients with Congestive Heart Failure ..................................................................................................................... 48
Table 4.18: Patients Newly Diagnosed with Congestive Heart Failure Who Filled a Prescription for Either ACEI or ARB within Three Months of Diagnosis ..................................................................................................... 50
Table 4.19: Patients with Congestive Heart Failure Who Were Persistent Users of Either ACEI or ARB .................. 52
Table 4.20: Patients Aged 20–79 with Diabetes ........................................................................................................................... 54
Table 4.21: Diabetic Patients Who Had an Eye Exam .................................................................................................................. 56
Table 4.22: Patients Newly Diagnosed with Myocardial Infarction ...................................................................................... 58
Table 4.23: Patients Newly Diagnosed with Myocardial Infarction Who Filled At Least One Beta–Blocker Prescription within Four Months of Hospital Discharge ................................................................................... 60
Table 4.24: Patients with Myocardial Infarction Who Were Persistent Users of Beta–Blockers ............................... 62

VIII
Table 4.25: Patients Newly Diagnosed with Myocardial Infarction (Eligible for Cholesterol–Lowering Drug Prescriptions) ....................................................................................................................................................................... 64
Table 4.26: Patients Newly Diagnosed with Myocardial Infarction Who Filled At Least One Cholesterol–Lowering Drug Prescription within Four Months of Hospital Discharge .................................................... 66
Table 4.27: Patients with Myocardial Infarction Who Were Persistent Users of Cholesterol–Lowering Drugs ... 68
Table A1.1: Codes Used to Defi ne the Indicators ......................................................................................................................... 81
Table A1.2: Manitoba’s Routine Childhood Immunization Schedule (as of January 2001) ......................................... 82

IX
List of Figures
Figure 3.1: PIN Data Extractions Timeline ........................................................................................................................................14
Figure 4.1: Agassiz Medical Centre—Distribution by Age for Males: 2005/06–2007/08 .............................................22
Figure 4.2: Agassiz Medical Centre—Distribution by Age for Females: 2005/06–2007/08 ........................................22
Figure 4.3: Assiniboine Medical Clinic—Distribution by Age for Males: 2005/06–2007/08 .......................................23
Figure 4.4: Assiniboine Medical Clinic—Distribution by Age for Females: 2005/06–2007/08 ..................................23
Figure 4.5: Dr. C.W. Wiebe Medical Centre—Distribution by Age for Males: 2005/06–2007/08 ...............................24
Figure 4.6: Dr. C.W. Wiebe Medical Centre—Distribution by Age for Females: 2005/06–2007/08 .........................24
Figure 4.7: Steinbach Family Medical Center—Distribution by Age for Males: 2005/06–2007/08 .........................25
Figure 4.8: Steinbach Family Medical Center—Distribution by Age for Females: 2005/06–2007/08 ....................25
Figure 4.9: Female Patients Aged 16–60 Screened for Cervical Cancer: 2005/06–2007/08 .....................................29
Figure 4.10: Two–Year–Olds with Complete Immunizations: 2005/06–2007/08 .............................................................31
Figure 4.11: Patients Aged 65 and Older Who Had At Least One Flu Vaccination: 2005/06–2007/08 .....................33
Figure 4.12: Female Patients Aged 50–69 Who Had At Least One Mammogram: 2005/06–2007/08 ......................35
Figure 4.13: Patients with At Least One Antibiotic Prescription: 2005/06–2007/08 ........................................................37
Figure 4.14: Patients Newly Diagnosed with Depression Who Filled a Prescription for an Antidepressant within Two Weeks of Diagnosis: 2005/06–2007/08 ..............................................................................................39
Figure 4.15: Patients with Depression Who Had Three Follow–Up Ambulatory Physician Visits within Four Months of Filling a Prescription for an Antidepressant: 2005/06–2007/08 .....................................41
Figure 4.16: Patients with Asthma: 2005/06–2007/08 ..................................................................................................................43
Figure 4.17: Asthmatic Patients Who Had At Least One Prescription for Long–Term Control of Asthma: 2005/06–2007/08 ................................................................................................................................................................45
Figure 4.18: Community–Dwelling Patients Aged 75 and Older Who Filled Prescriptions for more than a 30–day Supply of Benzodiazepines or a Prescription for more than two Benzodiazepines: 2005/06–2007/08 ................................................................................................................................................................47
Figure 4.19: Patients with Congestive Heart Failure: 2005/06–2007/08 .............................................................................49
Figure 4.20: Patients Newly Diagnosed with Congestive Heart Failure Who Filled a Prescription for Either ACEI or ARB within Three Months of Diagnosis: 2005/06–2007/08 ...............................................................51
Figure 4.21: Patients with Congestive Heart Failure Who Were Persistent Users of Either ACEI or ARB: 2005/06–2007/08 ................................................................................................................................................................53
Figure 4.22: Patients with Diabetes: 2005/06–2007/08................................................................................................................55
Figure 4.23: Diabetic Patients Who Had an Eye Exam: 2005/06–2007/08 ............................................................................57
Figure 4.24: Patients Newly Diagnosed with Myocardial Infarction (Eligible for Beta–Blocker Prescriptions): 2005/06–2007/08 ...............................................................................................................................................................59

X
Figure 4.25: Patients Newly Diagnosed with Myocardial Infarction Who Filled At Least One Beta–Blocker Prescription within Four Months of Hospital Discharge: 2005/06–2007/08 .............................................61
Figure 4.26: Patients with Myocardial Infarction Who Were Persistent Users of Beta–Blockers: 2005/06–2007/08 ..............................................................................................................................................................63
Figure 4.27: Patients Newly Diagnosed with Myocardial Infarction (Eligible for Cholesterol–Lowering Drug Prescriptions): 2005/06–2007/08..................................................................................................................................65
Figure 4.28: Patients Newly Diagnosed with Myocardial Infarction Who Filled At Least One Cholesterol–Lowering Drug Prescription within Four Months of Hospital Discharge: 2005/06–2007/08 .............67
Figure 4.29: Patients with Myocardial Infarction Who Were Persistent Users of Cholesterol–Lowering Drugs: 2005/06–2007/08 ...............................................................................................................................................................69

Manitoba Centre for Health Policy | XI
Executive Summary
This report is one part of the evaluation of Phase 1 of the Physician Integrated Network (PIN), a primary care renewal initiative developed by Manitoba Health. At the outset of this initiative, a robust evaluation was designed including the extraction of clinical data from the Electronic Medical Records (EMRs) of the participating clinics. This deliverable, a part of the evaluation, compares the extracted data from the EMRs of participating clinics with the data from the Population Health Research Data Repository (Repository) housed at the Manitoba Centre for Health Policy (MCHP). This provides a unique opportunity to combine and compare the primary data collected for clinical purposes with the secondary data collected for administrative purposes.
Four clinics, with over sixty physicians, were enrolled in Phase 1 of PIN. They were all using EMRs for clinical note recording. The Assiniboine Clinic and Agassiz Medical Centre use the CLINICARE™ EMR and the other two clinics (Steinbach Family Medical Center and Dr C.W. Wiebe Clinic) use the JonokeMed™ EMR. Each of the clinics is unique in a variety of diff erent ways which posed some challenges in our analysis of the data.
The four key objectives of PIN are:
1. to improve access to primary care
2. to improve primary care providers’ access to and use of information
3. to improve the working environment for all primary care providers
4. to demonstrate high quality primary care with a specifi c focus on chronic disease management
This evaluation addressed only the fourth objective.
Quality Based Incentive Funding (QBIF) has been one of the key mechanisms for engaging physicians in PIN. PIN is using QBIF as part of a blended funding approach: fee–for–service (FFS) combined with incentive–based funding for meeting targets. The participating physicians continue to bill Manitoba Health for all services provided to their patients according to the same fee schedule used by other physicians and in the same way they did this prior to becoming part of PIN. The QBIF funding is provided to the clinic in addition to the usual physician funding mechanism. The clinic chooses how to use the QBIF funding to best serve its patients and meet the PIN objectives. This may include hiring non–medical staff to improve clinic access or other health professionals such as nurses or dietitians to provide patient care.
Another key component of the PIN funding is the funding that facilitates the changes necessary for the extraction of data from the EMR. In order to measure the outcomes for the quality indicators, it was necessary to work with the EMR vendors to develop the capacity to extract the relevant data from the clinic EMRs. The time taken to implement this process varied for the two vendors and even between clinics, which impacted on the data that was available for this study.
Research QuestionsThis report presents the lessons learned from the analyses comparing the EMR and administrative data sources. The two key research questions addressed in this study are:
1. How comparable are the EMR and administrative data for data fi elds that are common to both data sources?
To answer this question, we present age and sex distributions of the total clinic population as determined by the two data sources for each clinic.
XII | University of Manitoba
2. What indicators are feasible to track using administrative data?
The results for each of the indicators are presented for the patients included in the clinic EMR core patients and for patients with physician billings in the administrative data but who were not identifi ed as core clinic patients in the EMR.
In addition, this report demonstrates some of the challenges involved in measuring practice–level clinical performance and comparing performance across settings.
MethodsWe compared the data from the clinic EMR chart extracts to the data available in the Repository. There were a number of challenges in combining the data from the four clinics with the Repository data. First, we were faced with the reality of not having an exact overlap in the period during which the data were collected from the two sources. The Repository data were only available up to the end of the 2007 fi scal year; thus, we had no administrative data after March 31, 2008. The clinics, however, were in the midst of PIN at that time, with Phase 1 ending on August 31, 2008. Because of challenges in extracting data from one of the EMRs, there was no overlap between two of the four clinics and the Repository data.
Second, the clinics did not use a standardized approach to identifying the patients to be included in the data extract. Each of the clinics had a diff erent approach to identifying which patients to include in the indicator analysis. For example, some clinics provide services for walk–in patients but do not regard them as core clinic patients because the physicians do not take responsibility for their long term ongoing care. In contrast, MCHP has established standardized algorithms to allocate primary care patients to the most responsible physician. This resulted in diff erences in how some patients were allocated (clinic patient or not) between the data sources.
Third, we identifi ed approximately 4,000 patients who were identifi ed by more than one clinic as being a patient for whom that clinic took responsibility. We developed an approach to allocating those patients to a single clinic for our analyses.
The patients included in the analyses thus fell into a number of categories. Some were allocated to a clinic by both the MCHP algorithm and the clinic EMR. Others were identifi ed by the EMR, but allocated to another clinic by the MCHP algorithm; some were allocated to the clinic by the MCHP algorithm but not identifi ed by the EMR extract as a clinic patient. Once patients were allocated to a category, we included them in that category for all of the analyses.
We also created “virtual practices” of patients with the same demographics as the clinic patients to compare with the results received for the real clinic populations. This comparison is believed to be fairer than other comparisons in that it compares groups of similar patients. Comparing patients between real clinics with their diff erent populations or to the Manitoba average rates could be an unfair assessment.
We looked at 15 care provision process indicators that are measurable with both the EMR extracts for PIN and the Repository data. The defi nitions for the PIN indicators initially followed the Canadian Institutes for Health Information (CIHI) Primary Care Indicators defi nitions. Some of these, however, were changed as they were implemented and problems with the CIHI defi nitions arose. The PIN Evaluation Committee, which had representation from all the participating clinics and Manitoba Health, decided on the changes to the EMR indicator defi nitions. The defi nitions used

Manitoba Centre for Health Policy | XIII
for the administrative data analyses were those previously used at MCHP. All indicators could only be measured using the Repository data. Each individual clinic focused only on a small group of indicators for Phase 1 of PIN. Therefore, the majority of indicators were not available from all clinics.
ResultsSome clear diff erences emerge when comparing the patient age and sex characteristics between the patients allocated to the clinics by the EMRs and those allocated to the clinics by the Repository.
The mean ages of the patients in the Repository were consistently older for the Assiniboine and Dr. C.W. Wiebe clinics but not for the other two clinics. Children (under 15 years of age) represented a considerably smaller percentage of patients at the Assiniboine Clinic than they did in the Manitoba population overall. In contrast, the percentage of patients who were younger than fi ve years was much higher for the Dr. C.W. Wiebe Clinic than for the Manitoba population. Many of these young patients were never seen for ambulatory visits in–clinic; they were probably visited in hospital as newborns by physicians of the clinic.
According to the Repository, the Assiniboine Clinic appeared to provide care to a higher than expected percentage of older patients although many of these were not included in the EMR extracts.
The full report has details on the fi fteen indicators that we analyzed:
A. Preventive Care
1. Cervical cancer screening2. Childhood immunizations3. Infl uenza vaccination (fl u shots) for adults aged 65 and older4. Breast cancer screening
B. Chronic and Acute Disease Care
5. Antibiotic prescribing6. Antidepressant prescription follow–up7. Asthma care8. Benzodiazepine prescribing for community–dwelling adults aged 75 and older 9. Congestive heart failure (CHF): Treatment with an angiotensin converting enzyme inhibitor
(ACEI) or an angiotensin II receptor blocker (ARB)a. Initiation of treatmentb. Persistent use
10. Diabetes care11. Post–Myocardial infarction care: Beta–Blocker prescribing
a. Initiation of treatmentb. Persistent use
12. Post–Myocardial infarction care: Cholesterol–Lowering drug prescribinga. Initiation of treatmentb. Persistent use
We compared the rates for each of the clinic populations (EMR extracts, repository, and total clinic population) with the expected rates and the Manitoba rates. We did not fi nd consistent patterns between clinics or across indicators, but we did demonstrate diff erent patterns for each indicator.

XIV | University of Manitoba
DiscussionThere are a number of lessons to be learned from this study. Firstly, there are clearly limitations in both the data extracted from clinic EMRs and the administrative data held in the Repository. One of the potential advantages of the study is to learn how to best use the two data sources together. Unfortunately, the time lag resulting from the single annual data download from Manitoba Health to the Repository prevents a more current analysis of the Repository data.
Secondly, the EMR extracts are limited by their dependence on the appropriate fi elds being both available in the EMR and routinely used by the clinicians. Relevant data that are not entered into the correct fi eld are not captured in the data extract. At the initiation of PIN, there was no provincial qualifi cation process to guide EMR vendors as to which EMR fi elds would be required to measure quality of care. Because the QBIF funding is intended to reward quality, it is important to be able to separate changes in the provision of quality care from the documentation of quality care. The use of the EMR to keep track of the indicator outcomes works best when this process fi ts with the normal care process.
For PIN to achieve its goals, a number of changes need to take place. This study has focused on two components of the required changes that are supported by PIN. First, the study provides context and insight into the measurement of some of the quality indicators (less than half of the indicators can be measured using the Repository data); and second, it highlights the extent and type of EMR use by clinicians. All EMRs off er the potential to use the information entered into the patient record in a variety of creative ways. Whether it is creating a longitudinal graphic comparison of the patients’ blood pressure results or developing evidence–based automatic reminders to prompt care plans, for the EMR to provide an advantage over the use of a paper medical chart the clinician must be actively engaged. This study has shown huge variability in how the participating physicians used their EMRs at the start of the study. This variability made it diffi cult to separate true changes in clinical practice facilitated by PIN from changes in charting practice using the EMR. Real time administrative claims data analysis could potentially provide this insight but it is not currently available at MCHP.
While the results for each indicator are interesting, it is of greater interest to note that there are diff erences between the EMR–allocated patients compared to the ones identifi ed from the Repository for many of the indicators. This fi nding should lead to an exploration of why these diff erences exist and, subsequently, an attempt to determine ways to ensure that the best possible information is being used to measure the success of PIN. As the PIN Evaluation Committee works to establish a standardized clinic–based defi nition for patients to include in the EMR abstract, it can use the fi ndings of this study to compare how each of the current defi nitions has resulted in diff erences. This does not imply that the MCHP algorithm is the gold standard to which the clinic EMR patient allocation should aspire, but rather that the comparison between the two approaches provides an opportunity to explore their diff erences and learn from the comparison.
While this discussion refl ects the research and quality measure consequences of determining which patients to include in these indicators, the ultimate concern is the acceptance of accountability for patient care by the physician. It is clear that this relationship is best determined in conjunction with the patient. Formal patient enrolment in practices, which involves a mutual commitment by both the patient and provider, has been widely implemented in Ontario and Quebec. In Ontario, more than 70% of the population has enrolled with a primary care physician (Kantarevic, Kralj, & Weinkauf, 2010). Implementation of some form of patient enrolment in Manitoba would address the concerns raised above.

Manitoba Centre for Health Policy | XV
There is often value in comparing results across diff erent studies, either to validate the results of a new study or to explore the reasons for diff erences. We, however, encourage readers to focus on the internal comparisons in this study rather than looking for external comparisons. Most of the indicator defi nitions used in this study have not been used with clinical data before despite their origins as CIHI defi nitions. Operationalizing those defi nitions frequently resulted in refi nements that could have signifi cant impact on the indicator rates. Perhaps, more importantly, it is well known that patient characteristics such as age, sex, and socioeconomic status have a profound impact on their health status and health behaviors. Comparisons between diff erent populations are fraught with built–in errors when these characteristics are not taken into account. This creates a challenge to meaningful indicator comparisons. To address it, we created “virtual practices” (matched on age and sex distributions of each clinic) in order to provide comparable populations.
The provincial rates for our indicators are generally consistent with previous studies using the Repository. Diff erences arise from diff erent time periods and slight variations in indicator defi nitions due to the diff ering study purposes. For example, atlases often use consistent defi nitions over time to facilitate comparisons with previous atlases despite refi nements in these defi nitions that may have developed.
The lack of any consistent pattern between clinics (i.e., no one clinic seems to provide consistently better or worse care than the others) and across indicators suggests widespread room for improvement amongst the PIN clinics. Because we have shown that the PIN clinics are not consistently worse than either the provincial rates or the expected rates for each clinic, we can conclude this room for improvement is to be found across the province. PIN has the potential to facilitate improved care for many Manitobans as the number of physicians participating in Phase 2 increases.
Future ResearchWhile the comparisons within clinics provides useful information within the context of the organization of the PIN initiative, use of the Repository data has a potentially larger role to play in measuring two important outcomes. Firstly, one of the goals of PIN is to improve patient access to the primary care clinic with which the patient is associated. Improved access should lead to better continuity of care, which has been shown to lead to better health outcomes. (Katz, De Coster, Bogdanovic, Soodeen, & Chateau, 2004; Martens et al., 2008). Because the data contained in the EMR extracts are specifi c to the participating clinics, this provides no data on the use of other primary care clinics by patients identifi ed by the PIN clinics as their patients. This information, while not an indication of the timeliness or appropriateness of access to care, is however available from the Repository and should be used in future evaluations as an indicator of access.
Secondly, the results of this study should be seen as baseline data for further research in determining whether PIN has led to improvement in patient care. While the initial hope was for the fi rst phase to demonstrate these changes, inconsistencies in the charting practices within the EMR of many participating physicians prior to PIN and in its early implementation, has limited our ability to demonstrate that changes in the EMR extracts are indeed changes in clinical practice, rather than changes in use of the EMR. By allowing the initial period to be included as a baseline where charting practices were standardized, we will be able to measure future changes in practice using both the EMR and Repository. The Repository can then be used to validate the EMR changes over time for those indicators that can be measured by both data sources.

XVI | University of Manitoba

Manitoba Centre for Health Policy | 1
Physician Integrated Network Baseline Evaluation
Chapter 1: Introduction
The study described in this report is one component of the broader Physician Integrated Network
(PIN)1 initiative, a multi–phase, ongoing primary care renewal initiative of Manitoba Health. The goal of PIN is to facilitate systemic improvements in the delivery of primary care among fee–for–service (FFS)
physician groups (PIN website: http://www.gov.mb.ca/health/phc/pin/index.html).
Background PIN evolved under the guidance of an advisory committee comprising representatives from the University of Manitoba, the Colleges of Registered Nurses and Physicians & Surgeons of Manitoba, the Manitoba Medical Association, the Winnipeg and Assiniboine Regional Health Authorities, and other primary care stakeholders.
The four key objectives of PIN are:
• to improve access to primary care
• to improve primary care providers’ access to and use of information
• to improve the working life for all primary care providers
• to demonstrate high quality primary care with a specifi c focus on chronic disease management
Quality Based Incentive Funding (QBIF) is one mechanism of engaging physicians in PIN. It provides funding to clinics for meeting quality targets on selected clinical process indicators. PIN is using QBIF as part of a blended funding approach (fee–for–service combined with QBIF). The participating physicians continue to bill Manitoba Health for all services provided to their patients according to the same fee schedule used by other physicians and in the same way they did this prior to becoming part of PIN. The QBIF funding is provided to the clinic in addition to the usual physician funding mechanism. The clinic chooses how to use the QBIF funding to best serve its patients and meet the PIN objectives. For example, a clinic may hire non–medical staff to improve clinic access or other health professionals such as nurses or dietitians to provide patient care.
Another key component of the PIN funding is the change management funding which facilitates the extraction of data from the EMR. In order to measure the outcomes for the quality indicators, it was necessary to work with the EMR vendors to develop the capacity to extract the relevant data from the clinic EMRs. The time taken to implement this process varied for the two vendors and even between clinics and aff ected the data that were available for this study. A more detailed description of the PIN indicators is provided in the Evaluation Framework section of this report.
Phase 1 of PIN began in 2006 with a process of engaging physicians in the project. At the time of implementation in August 2007, there were four participating sites. One year after the initiation of the implementation phase these four clinics entered Phase 2. Phase 2 was launched in September of 2008 and includes an evolution of the implementation of the QBIF, as well as increasing the number of sites from the original four sites to thirteen sites.
1 Throughout this report, terms in bold typeface, and acronyms are defi ned in the glossary located at the end of the report.

2 | University of Manitoba
Chapter 1: Introduction to PIN and the Evaluation Framework
In early June 2006, in response to a request for applications of interest from group practices interested in actively participating in the development and implementation of PIN, four practices joined Phase 1 of PIN: Agassiz Medical Centre in Morden, Dr. C.W. Wiebe Medical Centre in Winkler, and Assiniboine Clinic in Winnipeg as full participants and the Steinbach Family Medical Center as the control site. The Steinbach clinic was thus not eligible to receive the additional QBIF available to the other three clinics. Further details about each of these clinics are provided in Chapter 2. Additional clinics have since joined PIN as Phase 2 has been implemented.
Evaluation FrameworkTo evaluate the impact of the PIN initiative on patient care and physician satisfaction and to establish an ongoing evaluation process, an evaluation framework was developed. The evaluation framework is based on the above–mentioned objectives and comprises four components: 1) process measures (or indicators) from patient electronic medical records (EMRs); 2) patient and provider surveys; 3) qualitative interviews with managers, providers, and patients; and 4) analysis of administrative data.
The indicators for the fi rst component were derived from two sources. The main source is the Pan–Canadian Primary Health Care Indicator Development Project completed by the Canadian Institute for Health Information (CIHI) in March 2006 (Canadian Institute for Health Information, 2010). This project developed indicators to measure primary care reform as defi ned by the primary healthcare transition fund. The CIHI project identifi ed over 150 indicators. Some were relevant for clinics and others relevant only at a regional or systemic level; therefore, only the former type was selected for PIN. These indicators were supplemented by indicators developed at the Manitoba Centre for Health Policy (MCHP) in previous research, including the report Profi ling Primary Care Practice in Manitoba (Frohlich et al., 2006).
The indicators used in PIN can be categorized as follows:
• Health risk behaviors (e.g., tobacco use and physical inactivity) for all clinic patients
• Preventive care (e.g., fecal occult blood test and annual blood sugar) for all eligible clinic patients (generally age/gender–based)
• Acute and chronic disease management (diabetes, hypertension, coronary artery disease, congestive heart failure, asthma, and depression) for all eligible clinic patients
Some of the data needed to measure the indicators are available only through the clinics’ electronic medical records, some are available only from the administrative data housed in the Population
Health Research Data Repository (Repository) at MCHP, and others are found in both sources.
Qualitative interviews were also included in the broader evaluation plan. Since indicators are by defi nition quantitative and ‘measurable’, evaluations often include qualitative components, such as interviews to refl ect aspects of a project that do not lend themselves well to linear measurements. This report refl ects one component of the PIN evaluation: measuring and comparing indicators using data from the EMRs and the Repository. The methods section (Chapter 3) provides more details on these indicators and the data sources.

Manitoba Centre for Health Policy | 3
Physician Integrated Network Baseline Evaluation
A fundamental step required for the evaluation was the need to defi ne the PIN practice patients. This was done separately for the EMR and the administrative data sources.
a. EMR data—For each site, patients for whom a physician at that clinic was considered to be the most responsible provider were identifi ed by the clinic based on the clinic EMR.
b. Administrative data—Algorithms that were previously developed at MCHP were used to allocate patients to physicians (and therefore to the clinic) based on which physician provided the majority of the patient’s outpatient visits (Katz et al., 2004).
More details on the process and results of patient allocation are provided in Chapter 3.
Purpose of this ReportThis report presents the lessons learned from the analyses comparing the EMR and administrative data sources. The two key research questions addressed in this study are:
1. How comparable are the EMR and administrative data for data fi elds that are common to both data sources?
To answer this question we present age and sex distributions of the total clinic population as determined by the two data sources for each clinic.
2. What indicators are feasible to track using administrative data?
The results for each of the indicators are presented for the patients included in the clinic EMR core patients and for patients with physician billings in the administrative data but who were not identifi ed as core clinic patients in the EMR.
Additionally, this report demonstrates some of the challenges involved in measuring practice–level clinical performance and comparing performance across settings.

4 | University of Manitoba
Chapter 1: Introduction to PIN and the Evaluation Framework

Manitoba Centre for Health Policy | 5
Physician Integrated Network Baseline Evaluation
Chapter 2: PIN Clinic Profi les
The participating clinics vary across a range of characteristics including their community setting, relationship with local hospitals, clinic staff (physicians and others), governance structure, availability of walk–in services, and use of EMRs. To provide readers with an understanding of the diff erent clinics, each clinic was asked to provide information about these characteristics. These profi les, as provided by the clinics, are presented in this chapter.
Both the specifi c type of EMR being used by the clinics and the way physicians at the clinics used the EMR has signifi cant infl uence on the data available from the EMRs for use in analyses. For example, the data was required to be available in specifi c fi elds in the EMR in order for it to be extracted for use in analyses. There were diff erences in how physicians used the fi elds available to them as they charted clinical encounters with patients; there were also diff erences between EMR systems in how accessible these specifi c fi elds were to the physicians.

6 | University of Manitoba
Chapter 2: PIN Clinic Profiles
Detailed Profi leClinic location and community: Located in Morden (population: 7,500) with an additional outlying rural population.
Association with hospital and other healthcare facilities: Most physicians have hospital privileges at Boundary Trails Health Centre, the hospital located between the communities of Morden and Winkler. Physicians cover many responsibilities at the hospital including ER, anesthesia, ambulatory care clinic, surgery, surgery assist, and obstetrics. They provide family practice, walk–in, and consults at the clinic, as well as, coverage for the personal care home.
Clinic staff : 18 physicians, a nursing department, nurse practitioners, a dietitian, a clinic manager, and 25 support staff .
Walk–in: available 5:00pm–8:00pm Monday–Thursday. Some physicians have walk–in spots available daily.
Governance structure: Community–owned and operated by a volunteer board of directors made up of community members as well as physician and clinic administrative representatives; the board meets monthly. All equipment located within the clinic is community–owned. The clinic manager has decision–making authority in specifi c areas and reports to the clinic shareholders, which consists of members of the Agassiz Medical Physicians Corporation. Shareholders meet once a month for decision making, policy and procedure creation and review, and fi nancial review, decision making, and forecasting.
EMR and identifying core patients: Agassiz Medical has used CLINICARE™ since 1999. At the beginning of the PIN project, physicians were given lists of patients to review and the physicians determined which patients would be registered to each disease cluster. Presenting a challenge at the onset of the PIN project was the release of a management staff person with a lengthy vacancy of that position. In the initial stages of using CLINICARE™, they had not used the “usual doctor” fi eld, which caused diffi culties identifying their core patients for PIN. They also discovered that they had entered data into fi elds that were not extractable (required for PIN). Therefore, they had to move and re–enter a lot of data which made their extracts inaccurate as some data was not easily captured. The export feature did not work well and required a lot of extra staff time to work through the process of achieving a successful extract.
Agassiz Medical Centre
Morden, Manitoba
Location and community: Town of Morden (population: 7,500) with an additional outlying rural population.
Clinic staff: 18 physicians, a nursing dept, nurse practitioners, dietitian, clinic manager, and 25 support staff.
Hours of operation: Clinic: Mon–Fri: 9:00am–6:00pm Walk–in: Mon–Thurs: 5:00pm–8:00pm
Data extract availability: April 2008

Manitoba Centre for Health Policy | 7
Physician Integrated Network Baseline Evaluation
Detailed Profi leClinic location and community: Located in Winnipeg. It primarily serves the St. James, Charleswood, Tuxedo, and River Heights areas.
Association with hospital and other healthcare facilities: The clinic is adjacent to the Grace Hospital. A large number of family physicians assist in surgeries. The family physicians do not have admitting privileges at any Winnipeg Regional Health Authority facility. In addition to providing ambulatory care at Assiniboine, the family physicians provide care in a number of settings such as nursing homes, penal institutions, a menopause clinic, PRIME (high needs geriatric day hospital care), and private companies.
Clinic staff : The clinic currently has 17 family physicians, three general surgeons, two urologists, one internist, one gastroenterologist, and one neurologist. Other healthcare professionals delivering care at Assiniboine are a dietitian, a diabetes nurse educator, a foot care nurse, a mental health counselor, dentists, and a psychologist.
Walk–in: Six days of the week (not open on Fridays).
Governance structure: The physician group meets on a monthly basis. Three physicians elected by the physician group form a management committee. This committee meets on a weekly basis with the administrator of the clinic to deal with the day to day management of the clinic.
EMR and identifying core patients: Assiniboine has been using CLINICARE™ as its electronics medical records vendor since 2001.
For PIN, Assiniboine had to transition from an MS–DOS version of CLINICARE™ to a Windows version of CLINICARE™. Subsequent to this transition, Assiniboine developed fl ow sheets to capture the relevant information for the chronic diseases it had chosen to focus on.
These two transitions required a substantial amount of time from the administrator and network manager of the clinic. Physicians and staff had to be trained on the Windows version of CLINICARE™ and the fl ow sheets.
The core patients were identifi ed by searching through billing tariff s. The billing tariff s were the only “smart fi elds” available when Assiniboine started its PIN journey. For example, if a physician had billed using a diabetes tariff , the patient was determined to have diabetes. These lists were compiled using CLINICARE™ and provided to the physicians. The physicians would then confi rm whether this patient merited being identifi ed as being both diabetic and a core patient.
Assiniboine Medical Clinic
Winnipeg, Manitoba
Location and community: City of Winnipeg. Primarily serving St. James, Charleswood, Tuxedo, and River Heights areas.
Clinic staff: 17 family physicians, three general surgeons, two urologists, one internist, one gastroenterologist, and one neurologist. Other healthcare professionals are a dietitian, diabetes nurse educator, foot care nurse, mental health counselor, dentists, and a psychologist. Hours of operation: Walk–in clinic: Mon–Thurs
Data extract availability: July 2008

8 | University of Manitoba
Chapter 2: PIN Clinic Profiles
Detailed Profi leClinic location and community: Located in Winkler, a small city with an urban population of approximately 10,000 and serving a patient population of approximately 25,000. The community and area have been one of the fastest growing areas in the province for the past number of years. In large part, this had been fuelled by a signifi cant infl ux of German/Russian immigrants and a signifi cant number relocating to the area from Mexico, Paraguay, and Bolivia. The community is largely of Mennonite background. All physicians providing medical services in Winkler are part of this clinic.
Association with hospital: Nearly all physicians have hospital privileges at Boundary Trails Hospital and are involved in all aspects of hospital care including: emergency room (ER) coverage, surgical assisting in the operating room, anesthesia, obstetrics, and a variety of other hospital based care programs and services.
Clinic staff : Currently: 23 family physicians, two orthopedic surgeons, one general surgeon, and one obstetrician/gynecologist. Other staff includes a full–time administrator and 45 support staff (approximately 30 full–time equivalent employees).
Walk–in: An Urgent Care Centre for same–day visits sees approximately 25,000 visits per year. This facility is open from 8:00 am – 8:00 pm Monday – Friday, and 9:00 am – 1:00 pm on Saturdays. Most physicians provide service on a rotation basis.
Governance structure: The clinic is supported by a non–profi t community organization called the Winkler and District Health Care Board. This board provides the facility and all equipment to the Clinic on a rental agreement basis. Nearly all physicians are shareholders and directors on an equal basis in the corporation. Shareholder/director meetings are held monthly to address both business operation and medical service agendas. Directors are also involved in working committees that meet regularly to report and make recommendations to the group. These include committees such as recruitment, fi nance, clinic standards, information technology, facility development, and others.
The Winkler and District Health Care board also meets on a monthly basis; the clinic corporation has two representatives on this board (one physician and the administrator).
Dr. C.W. Wiebe Clinic
Winkler, Manitoba
Location and community: Only medical clinic in the city of Winkler (pop. ~10,000). Serves a patient population of approximately 25,000.
Clinic staff: 23 family physicians, two orthopedic surgeons, one general surgeon, and one obstetrician/gynecologist. Other staff: full–time administrator and 45 support staff (approximately 30 full–time equivalent employees). Hours of operation: Clinic: Mon–Fri: 8:00am–6:00pm
Urgent Care Centre (walk–in): Mon–Fri: 8:00am–8:00pm; Sat: 9:00am–1:00pm
Data extract availability: September 2007, December 2007, March 2008

Manitoba Centre for Health Policy | 9
Physician Integrated Network Baseline Evaluation
EMR: The Dr C. W. Wiebe clinic has used the JonokeMed™ electronic medical record since 1999. All patients are encouraged to attend their family physician for their regular care; they may only book appointments with this physician. Every patient’s record lists their family physician. Any patient may attend the walk–in clinic.
Core patients for this project were defi ned as those who had a family physician from this clinic listed as their family physician and who had been seen in the 18 months prior to the start of PIN. The clinic continued to include new core patients as they were added to a physician’s practice.

10 | University of Manitoba
Chapter 2: PIN Clinic Profiles
Detailed Profi leClinic location and community: Situated in the city of Steinbach within the South Eastman Regional Health Authority (RHA). Steinbach has a population of 11,066 (2006 census; 19% growth over the fi ve–year census period (i.e., 2001–2006) and is surrounded by the Hanover municipality with a further population of 11,871. The South Eastman RHA provides services to approximately 65,000 Manitobans.
Association with hospital and other healthcare facilities: Physicians at Steinbach Family are involved in a variety of other medical areas including admitting and attending patients at the Bethesda Hospital in Steinbach, working in the emergency department, obstetrics, assisting in surgery, performing anesthesia, attending four personal care homes in the region, and doing administrative work (e.g., VP –Medical Services for the RHA, Chief of Staff and Executive of the hospital, other RHA committees, and Palliative Care Medical Director). They are also involved in the Family Medicine Residency training program and the teaching of Med IV students. Steinbach Family participated in the Manitoba Health sponsored Advanced Access program run by Mark Murray and Associates in 2008. Steinbach Family’s physician group meets monthly to communicate on common clinic issues.
Clinic staff : Steinbach Family employs 28 full–time and part–time staff including administrative staff , billing personnel, nurses, receptionists, and physician assistants.
There are 16 family physicians and two general surgeons. During the study period, fi ve physicians left Steinbach Family to practice in various other locations. At the end of 2008, one new physician joined Steinbach Family; at the beginning of 2009 a further three physicians joined the clinic, which was followed by the last one joining as a part–time physician in July 2009. The loss of four physicians in 2008 aff ected over 25% of the patients and, consequently, data extracts.
Walk–in: same day service; open 1:30 pm–8:00 pm Monday to Thursday, 1:30 pm–4:00 pm Friday and 8:30 am–1:00 pm on Saturday. Physicians of Steinbach Family rotate staffi ng of this clinic.
Governance structure: The Steinbach Family physician group meets monthly to communicate on common clinic issues.
Steinbach Family Medical Center
Steinbach, MB
Location and community: City of Steinbach. Serves approximately 65,000 people.
Clinic staff: 28 full–time and part–time staff including administrative staff, billing personnel, nurses, receptionists, and physician assistants. Also, 16 family physicians and two general surgeons. Hours of operation: Walk–in: Mon–Thurs: 1:30–8:00pm; Fri: 1:30–4:00pm; Sat: 8:30am–1:00pm
Data extract availability: September 2007, December 2007, March 2008

Manitoba Centre for Health Policy | 11
Physician Integrated Network Baseline Evaluation
EMR and identifying core patients: Steinbach Family has used the JonokeMed™ electronic medical record since 1999. All patients are encouraged to attend their family physician for their regular care and each patient has a family physician listed in their chart demographics and can only book appointments with their own physician. Any patient may attend the walk–in clinic. Approximately 20,000 patients have physicians at Steinbach Family listed as their family physician (the number has varied with the variation in physician number) for the sake of the PIN data, patients whose physicians left the clinic were not removed from the 2009 clinic data.
Core patients for this project were defi ned as those who had a Steinbach Family physician listed as their family physician and who had been seen in the previous 18 months from the start of PIN. The clinic continued to include new core patients as they were added to a physician’s practice.
In 2008, Steinbach Family participated as a “control site” clinic in PIN, which involved working with the EMR vendor to: establish core patients within the clinic, set up indicator workfl ows within the EMR for data extraction, prepare data extracts, be involved with PIN committees and PIN days, and educate physicians and staff within the clinic regarding PIN objectives and goals. Steinbach Family has also had ongoing discussions with its RHA regarding its PIN involvement. As a control site, Steinbach Family was not funded to meet any indicator targets.
Because of prior work in defi ning core patients, Steinbach Family had a well–established core patient group at the start of PIN. Challenges in 2008 revolved around shifting indicator defi nitions, education of physicians and staff regarding EMR workfl ows and PIN indicators, and the establishment of meaningful and physician–individualized data extracts. All of these tasks were “works in progress” during 2008. This led to some data fl uctuations that were either a refl ection of changed workfl ow processes within the EMR or changed physician practice.

12 | University of Manitoba
Chapter 2: PIN Clinic Profiles

Manitoba Centre for Health Policy | 13
Physician Integrated Network Baseline Evaluation
Chapter 3: Methods
Data Sources and Data PeriodThis study used data from the EMRs at each of the participating clinics along with fi les from the Repository housed at MCHP. The Repository is a comprehensive set of databases that contains records for all Manitobans’ contacts with physicians, hospitals, home care, personal care homes and pharmaceutical prescriptions dispensed in retail pharmacies. The Repository records are anonymous; prior to data transfer, Manitoba Health processes the records to encrypt all personal identifi ers and remove all names and addresses. In this study, we used physician claims, hospital discharge
abstracts, Manitoba Immunization Monitoring System records, and pharmaceutical claims (from the Drug Programs Information Network (DPIN)).
Information technology development was a critical component of PIN. The four participating clinics use one of two proprietary EMR systems. In order to be able to report on the indicators identifi ed for the Quality Based Incentive Funding (QBIF), one of the key components of PIN, the EMR vendors worked with the clinics’ leadership to ensure that the appropriate fi elds were available in the medical record in a user–friendly format and that the data could be extracted for the quarterly reports. As a result of the unique circumstances of each of the clinics (described in Chapter 2), the data extracts varied in quality and content.
Furthermore, early on in the PIN initiative, it was realized that the changes in the data extracts do not necessarily refl ect changes in clinical practice, but more often result from changes in how the data were entered into the electronic chart. As clinicians became more aware of the need to enter the information in specifi c fi elds in order for it to be reported as part of the data extract, information refl ecting care provided was more likely to be included. It was thus clear that the “baseline” data (the fi rst data extract) was not a valid indication of clinical practice prior to PIN, but a combination of the clinical and charting practices at the time. As the information required to report on the indicators was more consistently recorded in the appropriate EMR fi elds, the data quality improved.
The analyses in this study were conducted with the EMR data extracts indicated in the timeline (Figure 3.1). We also used the most recent administrative data available: 2005/06–2007/08. These data only partially overlap with the data extract from the EMRs because the Repository’s administrative data fi les are updated annually after the end of the fi scal year. In fact there is no overlap between the MCHP data and the data extract periods for the Assiniboine and Agassiz clinics because technical problems prevented them from providing a data extract prior to March 31, 2008.
All data management, programming, and analyses were performed using SAS® statistical analysis software, version 9.1.3 and 9.2.

14 | University of Manitoba
Chapter 3: Methods
Data LinkageThe data from the EMRs were linked to the Repository data using processes that are well established at MCHP. The EMR data fi les were fi rst sent to the Health Information Management division at Manitoba Health. Data quality was assessed and the Personal Health Information Numbers (PHIN) of the patients included in the data extract fi les were “scrambled” using the same approach used with the administrative data. These scrambled PHINs made it possible to link the EMR fi les with the Repository fi les.
ExclusionsThe fi rst step in preparing the data for analysis was to determine which records from the Repository would be included. Every patient included could have any number of encounters with the system; each one generates a separate record. Thus, we started with the EMR extracts as the basis for the analyses. Some records from the EMR were excluded because they did not occur during the overlap period between the PIN EMR data extraction period and the 2007/08 administrative data (the most recent available), while other records had no valid PHIN. Table 3.1 provides details of the exclusions prior to the initiation of the analyses. There is a clear diff erence in the percentage of records eliminated between the two diff erent EMR systems. This is due to the later implementation in the clinics using CLINICARE™.
Figure 3.1: PIN Data Extractions Timeline
MCHP DataData extracts used in study Agassiz Medical Centre WMC Dr. C.W. Wiebe Medical CentreData overlap AsMC Assiniboine Medical Clinic SFMC Steinbach Family Medical Center
Source: Manitoba Centre for Health Policy, 2010
*
Sep 08Jun 08Apr 05 Mar 08Sep 07 Dec 07
AMC
*AMC #1
AMC #2 AMC #3
*AsMC #1
SFMC #4WMC #4
*SFMC #3SFMC #2SFMC #1WMC #1

Manitoba Centre for Health Policy | 15
Physician Integrated Network Baseline Evaluation
Ta
ble
3.1
:
Fin
al
Stu
dy
Co
ho
rt D
ev
elo
pm
en
t
Ag
assiz
Med
ical
Cen
tre
Assin
ibo
ine
Med
ical C
lin
ic
Dr.
C.W
. W
ieb
e
Med
ical C
en
tre
Ste
inb
ach
Fam
ily
Med
ical C
en
ter
To
tal
Nu
mb
er
of
EM
R r
eco
rds r
eceiv
ed
59,7
62
66,5
00
76,7
38
103,0
31
306,0
31
(33,
570
patie
nts)
(13,
229
patie
nts)
(22,
010
patie
nts)
(1
7,53
6 pa
tient
s)(8
6,3
45
pa
tie
nts
)
Nu
mb
er
of
EM
R r
eco
rds d
ele
ted
du
e t
o:
Inva
lid o
r m
issi
ng P
HIN
865
742
2712
31,7
57
No
reco
rds
in m
edic
al f
ile in
stu
dy p
erio
d50
322
945
430
71,4
93
Dat
ed p
rior
to 2
005/
060
051
118
169
Dat
ed a
fter
200
7/08
25,1
5539
,879
16,5
6520
,662
102,2
61
No
date
rec
orde
d 29
--18
1057
Inco
mpl
ete
or m
issi
ng d
ata
295
(109
pat
ient
s)22
3 (1
30 p
atie
nts)
636
(187
pat
ient
s)71
3 (1
99 p
atie
nts)
1,8
67
(6
25
pa
tie
nts
)
*N
um
ber
of
reco
rds f
or
an
aly
sis
(%
of
EM
R r
eco
rds r
eceiv
ed
)27,6
07 (
46%
)25,3
22 (
38%
)59,5
99 (
78%
)80,8
37 (
78%
)193,3
65 (
63%
)
*N
um
ber
of
pati
en
ts f
or
an
aly
sis
(%
of
pati
en
ts w
ith
EM
R r
eco
rds r
eceiv
ed
)9,2
07 (
70%
)15,3
00 (
46%
)15,2
72 (
87%
)20,8
08 (
95%
)60,5
87 (
70%
)
Sou
rce:
Man
itoba
Cen
tre
for
Hea
lth P
olic
y, 2
010
* N
ote:
The
num
bers
of r
ecor
ds a
nd p
atie
nts
do n
ot re
flect
a s
impl
e ar
ithm
atic
sum
of t
he n
umbe
rs a
bove

16 | University of Manitoba
Chapter 3: Methods
As indicated in Table 3.2, a number of patients had visited more than one of the participating clinics during the study period and their data was present in the EMR abstract from more than one clinic. We allocated these patients to a clinic based on MCHP’s plurality approach to allocation (described in the next section) except in cases where the patient’s most recent visits were consistently to one clinic indicating that they had switched to this clinic for their ongoing care.
Table 3.2: Patients Attending Multiple Clinics
Number of
Patients
Agassiz
Medical Centre
Assiniboine
Medical Clinic
Dr. C.W. Wiebe
Medical Centre
Steinbach Family
Medical Center
33,483 x
11,514 x
21,832 x
15,861 x
31 x x
36 x x
16 x x
79 x x
1,595 x x
55 x x
s x x x
s x x x
s x x x
s x x x x
Attended only that clinic 33,483 11,514 21,832 15,861Attended multiple clinics 87 1,715 178 1,675Total Patients 33,570 13,229 22,010 17,536 86,345
s - suppressed due to numbers less than 10 Source: Manitoba Centre for Health Policy, 2010
Patient AllocationThe analyses for this deliverable, while focusing on patients who have been identifi ed as “core” patients by the clinics, includes comparisons to others who may have attended the clinics, and to other Manitoba residents, for illustrative purposes. In an environment where patients are free to receive care at a clinic of their choice and where there is no formal identifi cation of who the core clinic patients are, there is a lack of clarity as to the appropriate classifi cation of patients for the analyses. The presence of a chart at a clinic is not enough to indicate that someone is a clinic patient because visits to a walk–in service at the clinic and receiving delivery of hospital–based care by a physician from that clinic both result in the presence of a chart in the clinic’s EMR. It would also not be appropriate to include patients who were last seen at the clinic some years prior. The EMR data we received for this study included only patients for whom the physicians at the clinics have identifi ed themselves as the primary care physician most responsible for the patient’s care (referred to as EMR core patients).
Although the fi nal defi nition of core patients for PIN at the clinic level is still being determined, a process was agreed upon for the Phase 1 analyses. Clinics identifi ed the patients they considered to be core patients based on their own criteria. For some clinics, this was a matter of confi rming an already present and frequently updated fi eld in the EMR; while for others, a review of individual charts was necessary.

Manitoba Centre for Health Policy | 17
Physician Integrated Network Baseline Evaluation
We used the plurality approach to patient allocation for patients who visited more than one of the participating clinics during the study period and based it on the patients’ receipt of services from any of the physicians working at the clinic. We used the following algorithm that was developed and validated in previous research at MCHP (Katz et al., 2004): patients were allocated to the most responsible physician (i.e., the one who provided the majority of the patient’s care) over a three–year period (2005/06–2007/08). We only considered ambulatory care visits for primary care physicians. Where there was a tie between diff erent physicians, the one with the services amounting to greater fee value was determined to be the most responsible.
Using the diff erent methods of within–clinic patient allocation for the two data sources likely resulted in some discrepancies in those identifi ed by MCHP versus the clinics. However, this was somewhat off set by a potential to identify patterns where patients may have been systematically excluded by a clinic due to patient characteristics such as age. The time lag between the Repository and EMR data mentioned earlier likely also resulted in some diff erences in the rosters of core patients. Thus, we have patients falling into diff erent categories as presented in Table 3.3.
Table 3.3: Patient Allocation
EMR
Total
MCHP
Total
Agassiz 9,207 10,486 6,513 3,973 2,694
Assiniboine 15,300 29,298 11,109 18,189 4,191
Dr. C.W. Wiebe 15,272 20,835 14,529 6,306 743
Steinbach Family 20,808 28,487 19,464 9,023 1,344
MCHP Core
only
EMR Core
only
MCHP & EMR
Core Overlap
Source: Manitoba Centre for Health Policy, 2010
There are clear diff erences in the distribution of patients at the Assiniboine clinic compared to the other three clinics. The percentage of patients who were allocated to the Assiniboine clinic according to the MCHP algorithm (but who were not included in the EMR extract) is twice as high as for the other clinics. In addition, the percentage of core patients identifi ed by both the algorithm and in the EMR is considerably lower than that of the other clinics. The chief reason for these diff erences is likely due to the fact that the Assiniboine clinic had considerable practical diffi culties in performing their EMR extracts; therefore, their fi rst data extract was used in the study rather than the third or fourth extract as was the case for the other clinics. As the data from each EMR extract became available, the clinics responded to the analyses by refi ning and improving their patient identifi cation and indicator outcome documentation. Thus, the results for the indicator for the Assiniboine clinic need to be interpreted with caution. It should also be noted that the Assiniboine clinic is an urban clinic while the other three PIN sites are rural. Diff erences that may exist in clinical practice due to the rural/urban setting may contribute to diffi culties in making comparisons. Also, as noted in Chapter 2, this clinic had diff erent EMR usage patterns before PIN and possibly even after the project’s initiation.
Compared to the other clinics, the Agassiz Medical Centre had a higher percentage of patients identifi ed in the EMR who had no ambulatory visits recorded in the Repository. These patients likely received services at the local hospital (e.g., via the emergency or outpatient departments) but were not actually seen at the clinic. For these patients, charts were established in the clinic EMR for billing purposes.

18 | University of Manitoba
Chapter 3: Methods
Virtual Practices As established in previous MCHP work, there is value in determining the expected rates of services for a given patient group (e.g., a physician practice) based on their personal and demographic characteristics and comparing them to the actual rates (Frohlich et al., 2006). In the present study, we did this for the patients from each clinic’s extract by creating comparable fi ctitious (or ‘virtual’) practices. These virtual practices established norms for a group of patients who were identical to those in each practice of interest in terms of age, sex, urban/rural status, and socioeconomic status. By randomly matching patients from each clinic with people in the same demographic category but who were not part of the participating clinics, we created four virtual practices of patients who received their care from a variety of diff erent physicians. We used the care received by this virtual practice to calculate “expected” rates for the practice of interest. This group served as a comparison group for the PIN sites.
Measuring the IndicatorsFor this report, 15 indicators of preventive care and chronic disease management were analyzed. Table 3.4 presents the defi nitions used in this study. They are also provided in Chapter 4 (Results) at the beginning of each indicator. All indicators could only be measured using the Repository data. Since each individual clinic focused only on a small group of indicators for Phase 1 of PIN, the majority of indicators were not available from all clinics.
The patients included in these analyses were identifi ed from the EMRs and the Repository data. Patient identifi cation using the Repository was based on physician billings; each billing claim includes a code that is associated with the physician’s clinic. Patients with codes associated with each of the participating clinics during the study period were then compared to those identifi ed in the EMR extracts (i.e., the EMR core patients). This resulted in three patient groupings for each clinic: 1) EMR (those identifi ed in the EMR extract and from the Repository); 2) MCHP Only (those found in the Repository, but were not in the EMR extract); and 3) Clinic Total (combination of the two previous groups). Specifi c codes used in defi ning indicators can be found in Appendix Table A.1.1.
Statistical AnalysesWhile the results in Chapter 4 are presented for all four clinics, this study is focused on within–clinic results. Comparing the data from the Repository to each clinic’s data provides an opportunity to explore the impact of patient allocation on the outcomes. The virtual practices provide an additional comparison with the real clinic patient outcome rates.
We used a negative binomial regression to make three sets of comparisons. First, we compared the rate calculated for the virtual practice (called Expected in the indicator graphs) to the average rate for all Manitoba residents (Manitoba in the graphs). We also compared each of the three clinic populations (EMR, MCHP Only, and Clinic Total) to the Expected rate. Finally, we compared EMR to the MCHP Only population. We used age– and sex–adjusted rates for all comparisons.

Manitoba Centre for Health Policy | 19
Physician Integrated Network Baseline Evaluation
Table 3.4: Indicators of Quality Primary Care
Indicator Definition
1. Cervical cancer screening Eligibility: Women aged 16-60 who have not had a hysterectomy.Outcome: A least one pap test during the study period.
2. Childhood immunizations Eligibility: Children who turned two during the study period.Outcome: Received their complete primary course of immunization by aged 24 months. See the immunization schedule in the Appendix.
3. Influenza vaccination for adults aged 65 and older
Eligibility: Adults aged 65 or older.Outcome: At least one influenza vaccination during the study period.
4. Breast cancer screening Eligibility: Female patients aged 50-69Outcome: At least one mammogram during the study period
5. Antibiotic prescription management Eligibility: All patients with at least one visit during the study period.Outcome: At least one antibiotic prescription at a Manitoba retail pharmacy during the study period.
6. Antidepressant follow-up Eligibility: Newly diagnosed during the study period (no diagnosis in the year prior to the start of the study period) and who filled a new prescription for an antidepressant within two weeks of the diagnosis.Outcome: Three subsequent ambulatory visits within four months of the prescription being filled (any diagnosis, any physician).
7. Asthma care Eligibility: Patients with a diagnosis of asthma in either one or more hospital separations or in two or more medical claims, OR two or more prescriptions for asthma drugs during the study period. Outcome: Patients who received three or more prescriptions for bronchodilators (reliever drug) in a year who also received at least one prescription for a inhaled corticosteroid or leukotriene antagonist (preventer drug).
8. Benzodiazepine prescribing for community-dwelling adults aged 75 and older
Eligibility: Community-dwelling patients aged 75 and older.Outcome: Filled prescriptions for greater than a 30-day supply of one benzodiazepine OR a prescription for more than two different benzodiazepines.
9. Congestive heart failure (CHF): treatment with an Angiotensin Converting Enzyme Inhibitor (ACEI) or an Angiotensin II Receptor Blockers (ARB)
Eligibility: At least one diagnosis for CHF in either a hospital discharge abstract or a physician billing claim during the study period.Outcome (New use): Newly diagnosed patients (i.e. no diagnosis of CHF in the year prior to the study period) who filled a prescription for either an ACEI or an ARB within three months of the diagnosis.Outcome (Persistent use): Filled prescription for a drug supply for 80% of the study period.
10. Diabetes care Eligibility: Patients aged 20-79, with one or more hospital visits OR two or more physician claims OR one or more prescriptions for treatment of diabetes during the study period.Outcome: At least one visit to either an optometrist or ophthalmologist in the study period.
11. Post-myocardial infarction care: beta- blocker prescribing
Eligibility: Patients discharged alive from hospital after a myocardial infarction during the study period or the three years before the study period; excludes those with a diagnosis of either chronic obstructive pulmonary disease, asthma, or peripheral vascular disease.Outcome (New use): One prescription filled within four months of hospital discharge.Outcome (Persistent use): Prescriptions filled for a minimum of 80% of the days between the hospital discharge and the end of the study period.
12. Post-myocardial infarction care: cholesterol lowering drug prescribing
Eligibility: Patients discharged alive from hospital after a myocardial infarction in the three years preceding the start of the study period.Outcome (New use): One prescription filled within four months of hospital discharge.Outcome (Persistent use): Prescriptions filled for a minimum of 80% of the days between the hospital discharge and the end of the study period.
Preventive Care
Acute and Chronic Disease Management
Source: Manitoba Centre for Health Policy, 2010

20 | University of Manitoba
Chapter 3: Methods

Manitoba Centre for Health Policy | 21
Physician Integrated Network Baseline Evaluation
Chapter 4: Results
Comparison of Patient Age and Sex Characteristics between Data SourcesTo answer Research Question 1 “How comparable are the EMR and administrative data for data fi elds that are common to both data sources?” we divided each clinic’s patients identifi ed by physician billings in the Repository, into two groups:
• EMR – those who were also identifi ed in the EMR extract as core patients
• No EMR – those who were not part of the EMR extract
The mean ages of the patients in the Repository, but not in the EMR, are consistently older for the Assiniboine and Dr. C.W. Wiebe clinics but not the other two clinics. The age–sex distributions for each clinic are presented in Figures 4.1–4.8.
Some clear patterns emerge. Children (under 15 years of age) represent a considerably smaller percentage of patients at the Assiniboine clinic than they do in the other clinics or in the Manitoba population overall. In contrast, the percentage of patients who are less than fi ve years old is much higher for the Dr. C.W. Wiebe clinic than for the provincial average or at the other three clinics. Many of these young patients were never seen for ambulatory visits in clinic; they were probably visited in hospital.
The Assiniboine clinic does appear to provide care to a higher than expected percentage of older patients even though many of these were not included in the EMR extract.

22 | University of Manitoba
Chapter 4: Results
Figure 4.2: Agassiz Medical Centre—Distribution by Age for Females: 2005/06–2007/08
Figure 4.1: Agassiz Medical Centre—Distribution by Age for Males: 2005/06–2007/08
0%
2%
4%
6%
8%
10%
12%
14%
16%
18%
0-5 6-10 11-15 16-20 21-25 26-30 31-35 36-40 41-45 46-50 51-55 56-60 61-65 66-70 71-75 76-80 81-85 86-100Age Groups
Manitoba
EMR
NO EMR
Source: Manitoba Centre for Health Policy, 2010
% o
f P
ati
en
ts
0%
2%
4%
6%
8%
10%
12%
14%
16%
18%
0-5 6-10 11-15 16-20 21-25 26-30 31-35 36-40 41-45 46-50 51-55 56-60 61-65 66-70 71-75 76-80 81-85 86-100Age Groups
Manitoba
EMR
NO EMR
Source: Manitoba Centre for Health Policy, 2010
% o
f P
ati
en
ts

Manitoba Centre for Health Policy | 23
Physician Integrated Network Baseline Evaluation
Figure 4.4: Assiniboine Medical Clinic—Distribution by Age for Females: 2005/06–2007/08
Figure 4.3: Assiniboine Medical Clinic—Distribution by Age for Males: 2005/06–2007/08
0%
2%
4%
6%
8%
10%
12%
14%
16%
18%
0-5 6-10 11-15 16-20 21-25 26-30 31-35 36-40 41-45 46-50 51-55 56-60 61-65 66-70 71-75 76-80 81-85 86-100Age Groups
Manitoba
EMR
NO EMR
Source: Manitoba Centre for Health Policy, 2010
% o
f P
ati
en
ts
0%
2%
4%
6%
8%
10%
12%
14%
16%
18%
0-5 6-10 11-15 16-20 21-25 26-30 31-35 36-40 41-45 46-50 51-55 56-60 61-65 66-70 71-75 76-80 81-85 86-100Age Groups
Manitoba
EMR
NO EMR
Source: Manitoba Centre for Health Policy, 2010
% o
f P
ati
en
ts

24 | University of Manitoba
Chapter 4: Results
Figure 4.6: Dr. C.W. Wiebe Medical Centre—Distribution by Age for Females: 2005/06–2007/08
Figure 4.5: Dr. C.W. Wiebe Medical Centre—Distribution by Age for Males: 2005/06–2007/08
0%
2%
4%
6%
8%
10%
12%
14%
16%
18%
0-5 6-10 11-15 16-20 21-25 26-30 31-35 36-40 41-45 46-50 51-55 56-60 61-65 66-70 71-75 76-80 81-85 86-100Age Groups
Manitoba
EMR
NO EMR
Source: Manitoba Centre for Health Policy, 2010
% o
f P
ati
en
ts
0%
2%
4%
6%
8%
10%
12%
14%
16%
18%
0-5 6-10 11-15 16-20 21-25 26-30 31-35 36-40 41-45 46-50 51-55 56-60 61-65 66-70 71-75 76-80 81-85 86-100Age Groups
Manitoba
EMR
NO EMR
Source: Manitoba Centre for Health Policy, 2010
% o
f P
ati
en
ts

Manitoba Centre for Health Policy | 25
Physician Integrated Network Baseline Evaluation
Figure 4.8: Steinbach Family Medical Center—Distribution by Age for Females: 2005/06–2007/08
Figure 4.7: Steinbach Family Medical Center—Distribution by Age for Males: 2005/06–2007/08
0%
2%
4%
6%
8%
10%
12%
14%
16%
18%
0-5 6-10 11-15 16-20 21-25 26-30 31-35 36-40 41-45 46-50 51-55 56-60 61-65 66-70 71-75 76-80 81-85 86-100Age Groups
Manitoba
EMR
NO EMR
Source: Manitoba Centre for Health Policy, 2010
% o
f P
ati
en
ts
0%
2%
4%
6%
8%
10%
12%
14%
16%
18%
0-5 6-10 11-15 16-20 21-25 26-30 31-35 36-40 41-45 46-50 51-55 56-60 61-65 66-70 71-75 76-80 81-85 86-100Age Groups
Manitoba
EMR
NO EMR
Source: Manitoba Centre for Health Policy, 2010
% o
f P
ati
en
ts

26 | University of Manitoba
Chapter 4: Results
Manitoba Centre for Health Policy | 27
Physician Integrated Network Baseline Evaluation
How the Indicator Results are PresentedThe remainder of this chapter presents the results of the analyses for Research Question 2—“What indicators are feasible to track using administrative data?”—by indicator. For each one, the following is presented:
• Defi nition of the indicator. This is a short description of how the indicator was measured using the Repository data. The Acute and Chronic Disease Management indicators (except Antibiotic Prescribing) have separate defi nitions for the eligibility criteria and the outcome.
• Eligible population. This is either based on patient age and/or sex (e.g., childhood immunizations) or on having a particular condition (e.g., congestive heart failure). It is presented in table format for the Preventive Care indicators. Each Acute and Chronic Disease Management indicator includes a table and a graph of the condition’s prevalence.
• Outcome rates (graph) and corresponding counts (table).
In the prevalence and outcome graphs, four bars are presented for each clinic:
1. the expected rate for that clinic—the rate calculated for the randomly selected virtual practices (Expected)
2. the patients found in the MCHP Repository with billings from that clinic and also found in the EMR (EMR)
3. clinic patients identifi ed by the MCHP algorithm but not found in the EMR (MCHP Only)
4. all patients who attended the clinic over a three–year period using the MCHP data (i.e., the combination of 2 and 3 above) (Clinic Total)
In the prevalence and outcome graphs, bars are presented for each of the patient groupings and for the Expected rate as described in Chapter 3: Measuring the Indicators. The horizontal line represents the Manitoba average rate.
Our primary interest in interpreting these results is not the comparison between the clinics, but rather the within–clinic comparison between the Expected rate for that clinic and the diff erent clinic populations (EMR and MCHP Only).

28 | University of Manitoba
Chapter 4: Results
Preventive Care Cervical Cancer ScreeningDefi nition: Female patients aged 16–60 who have not had a hysterectomy and who have had at least one Papanicolaou (“Pap”) test during the study period.
Table 4.1: Female Patients Aged 16–60
Table 4.2: Female Patients Aged 16–60 Screened for Cervical Cancer
Clinic Total
Agassiz 4,607 2,197 2,410
Assiniboine 11,321 4,007 7,314
Dr. C.W. Wiebe 6,265 2,939 3,326
Steinbach 7,383 4,553 2,830
Manitoba: 221,799
MCHP OnlyEMR
Source: Manitoba Centre for Health Policy, 2010
Clinic Total
Agassiz 6,685 3,020 3,665
Assiniboine 14,490 5,047 9,443
Dr. C.W. Wiebe 10,037 4,700 5,337
Steinbach 11,906 7,074 4,832
Manitoba: 366,682
EMR MCHP Only
Source: Manitoba Centre for Health Policy, 2010

Manitoba Centre for Health Policy | 29
Physician Integrated Network Baseline Evaluation
The rates for the Assiniboine and Agassiz clinics (see Figure 4.9 and corresponding Table 4.2) of patient counts are signifi cantly higher than the Expected rate and the provincial rate. Agassiz clinic’s patients in the EMR have higher rates than those not allocated to a clinic physician in the EMR (MCHP Only). Thus, the Agassiz clinic patients who have a relationship with a clinic physician are receiving Pap tests more often than those without a relationship. All the rates for the Dr. C.W. Wiebe Clinic are similar to the Expected rates.
Figure 4.9: Female Patients Aged 16–60 Screened for Cervical Cancer: 2005/06–2007/08 Age-adjusted
0%
10%
20%
30%
40%
50%
60%
70%
80%
90%
100%ExpectedClinic TotalEMRMCHP OnlyManitoba
Agassiz Medical Centre
Steinbach FamilyMedical Center
Dr. C.W. Wiebe Medical Centre
Source: Manitoba Centre for Health Policy, 2010
Assiniboine Medical Clinic
*
† ‡ †
*
†
† *
*
† †
† †
* significantly different from Manitoba (p<.05)† significantly different from Expected (p<.05)‡ significantly different from MCHP only (p<.05)
‡

30 | University of Manitoba
Chapter 4: Results
Childhood ImmunizationsDefi nition: Children who turned two during the study period and received their complete primary course of immunization by age 24 months.
The immunization schedule used in this study can be found in Appendix (Table A1.1).
Table 4.3: Children Who Turned Two Years in the Study Period
Clinic Total
Agassiz 1,062 363 699
Assiniboine 467 125 342
Dr. C.W. Wiebe 1,788 1,038 750
Steinbach 1,992 1,054 938
Manitoba: 42,758
EMR MCHP Only
Source: Manitoba Centre for Health Policy, 2010
Table 4.4: Two–Year–Olds with Complete Immunizations
Clinic Total
Agassiz 719 256 463
Assiniboine 364 94 270
Dr. C.W. Wiebe 1,142 681 461
Steinbach 1,356 765 591
Manitoba: 28,669
MCHP OnlyEMR
Source: Manitoba Centre for Health Policy, 2010

Manitoba Centre for Health Policy | 31
Physician Integrated Network Baseline Evaluation
Even though the rates at the Assiniboine clinic appear to be higher than Expected (Figure 4.10), these diff erences are not statistically signifi cant due to the small numbers of patients included in these analyses. The Expected rates at all four clinics are, however, higher than the provincial rate. Though the rates for Agassiz and Steinbach are very similar to their Expected rates, the rates for the Dr. C.W. Wiebe clinic (except for the EMR patients) are signifi cantly lower than Expected. The rate for EMR children is higher than the MCHP Only rate at both C.W. Wiebe and Steinbach.
Note: Childhood immunizations are generally provided by physicians in Winnipeg while in rural areas both public health nurses and family physicians provide this service; both are included in the analyses.
Figure 4.10: Two–Year–Olds with Complete Immunizations: 2005/06–2007/08 Age– and sex–adjusted
0%
10%
20%
30%
40%
50%
60%
70%
80%
90%
100%ExpectedClinic TotalEMRMCHP OnlyManitoba
Agassiz Medical Centre
Steinbach FamilyMedical Center
Dr. C.W. Wiebe Medical Centre
Source: Manitoba Centre for Health Policy, 2010
Assiniboine Medical Clinic
**
* *
†††
* significantly different from Manitoba (p<.05)† significantly different from Expected (p<.05)‡ significantly different from MCHP only (p<.05)
‡
‡

32 | University of Manitoba
Chapter 4: Results
Infl uenza Vaccination (fl u shots) for Patients Aged 65 years and OlderDefi nition: Patients aged 65 years and older who received at least one infl uenza vaccination during the study period.
Table 4.5: Patients Aged 65 and Older
Clinic Total
Agassiz 3,762 1,681 2,081
Assiniboine 13,325 2,791 10,534
Dr. C.W. Wiebe 6,281 1,877 4,404
Steinbach 5,028 2,955 2,073
Manitoba: 180,883
EMR MCHP Only
Source: Manitoba Centre for Health Policy, 2010
Table 4.6: Patients Aged 65 and Older Who Had At Least One Flu Vaccination
Clinic Total
Agassiz 2,650 1,217 1,433
Assiniboine 10,955 2,213 8,742
Dr. C.W. Wiebe 4,290 1,126 3,164
Steinbach 3,189 1,816 1,373
Manitoba: 130,836
MCHP Only
Source: Manitoba Centre for Health Policy, 2010
EMR

Manitoba Centre for Health Policy | 33
Physician Integrated Network Baseline Evaluation
The rates for Assiniboine (Figure 4.11) are statistically better than the Expected rate. The rates for both Steinbach and the Dr. C.W. Wiebe Clinic are lower than the Expected rates, which are lower than the provincial rate. Agassiz’s Expected rate is lower than the provincial rate, but the clinic’s rates are similar to the Expected rate. The within–clinic comparisons show that the EMR patients have lower rates of vaccination than the MCHP Only patients for Steinbach.
Figure 4.11: Patients Aged 65 and Older Who Had At Least One Flu Vaccination: 2005/06–2007/08 Age– and sex–adjusted
0%
10%
20%
30%
40%
50%
60%
70%
80%
90%
100%ExpectedClinic TotalEMRMCHP OnlyManitoba
Agassiz Medical Centre
Steinbach FamilyMedical Center
Dr. C.W. Wiebe Medical Centre
Source: Manitoba Centre for Health Policy, 2010
Assiniboine Medical Clinic
* *
*
*
††
†
† ‡
†
†
†
†
* significantly different from Manitoba (p<.05)† significantly different from Expected (p<.05)‡ significantly different from MCHP only (p<.05)

34 | University of Manitoba
Chapter 4: Results
Breast Cancer ScreeningDefi nition: Female patients aged 50–69 with at least one mammogram during the study period.
Table 4.7: Female Patients Aged 50–69
Clinic Total
Agassiz 2,444 1,270 1,174
Assiniboine 8,577 2,191 6,386
Dr. C.W. Wiebe 3,865 1,465 2,400
Steinbach 3,905 2,375 1,530
Manitoba: 144,956
EMR MCHP Only
Source: Manitoba Centre for Health Policy, 2010
Table 4.8: Female Patients Aged 50–69 Who Had At Least One Mammogram
Clinic Total
Agassiz 1,288 695 593
Assiniboine 6,331 1,565 4,766
Dr. C.W. Wiebe 2,050 768 1,282
Steinbach 2,101 1,311 790
Manitoba: 86,310
MCHP Only
Source: Manitoba Centre for Health Policy, 2010
EMR

Manitoba Centre for Health Policy | 35
Physician Integrated Network Baseline Evaluation
Figure 4.12 shows a striking pattern in the consistency between the three rural clinics with all the clinic patients (regardless of allocation) as below the Expected mammography rate. In contrast, the Expected rates for all four clinics are above the provincial rate. The clinic rates for Assiniboine are higher than the Expected rate. The only statistically signifi cant within–clinic diff erences are at Dr. C.W. Wiebe and Steinbach Family, where MCHP Only is higher than EMR.
Figure 4.12: Female Patients Aged 50–69 Who Had At Least One Mammogram: 2005/06–2007/08 Age–adjusted
0%
10%
20%
30%
40%
50%
60%
70%
80%
90%
100%ExpectedClinic TotalEMRMCHP OnlyManitoba
Agassiz Medical Centre
Steinbach FamilyMedical Center
Dr. C.W. Wiebe Medical Centre
Source: Manitoba Centre for Health Policy, 2010
Assiniboine Medical Clinic
†
†
†
† ‡ † †
† ‡†
†
†
††
* * * *
* significantly different from Manitoba (p<.05)† significantly different from Expected (p<.05)‡ significantly different from MCHP only (p<.05)

36 | University of Manitoba
Chapter 4: Results
Table 4.10: Patients with At Least One Antibiotic Prescription
Clinic Total
Agassiz 13,575 5,659 7,916
Assiniboine 32,526 9,689 22,837
Dr. C.W. Wiebe 22,428 9,339 13,089
Steinbach 26,156 13,911 12,245
Manitoba: 748,796
Source: Manitoba Centre for Health Policy, 2010
MCHP OnlyEMR
Clinic Total
Agassiz 21,185 9,207 11,978
Assiniboine 48,224 15,300 32,924
Dr. C.W. Wiebe 35,840 15,272 20,568
Steinbach 39,982 20,808 19,174
Manitoba: 1,260,172
EMR MCHP Only
Source: Manitoba Centre for Health Policy, 2010
Table 4.9: All Patients Who Had At Least One Clinic Visit in the Study Period
Acute and Chronic Disease CareAntibiotic Prescription RatesDefi nition: All patients with at least one visit during the study period who fi lled one or more prescriptions for an antibiotic at a Manitoba retail pharmacy during the study period.

Manitoba Centre for Health Policy | 37
Physician Integrated Network Baseline Evaluation
Figure 4.13: Patients with At Least One Antibiotic Prescription: 2005/06–2007/08 Age– and sex–adjusted
0%
10%
20%
30%
40%
50%
60%
70%
80%
90%
100%ExpectedClinic TotalEMRMCHP OnlyManitoba
Agassiz Medical Centre
Steinbach FamilyMedical Center
Dr. C.W. Wiebe Medical Centre
Source: Manitoba Centre for Health Policy, 2010
Assiniboine Medical Clinic
†
†
†
†
* significantly different from Manitoba (p<.05)† significantly different from Expected (p<.05)‡ significantly different from MCHP only (p<.05)
‡* ***
† ‡
Compared to the provincial average, more patients in the Expected group at all clinics fi lled at least one antibiotic prescription (Figure 4.13); more patients in the Assiniboine Clinic’s (Clinic Total) group fi lled an antibiotic prescription than the Expected group, while the opposite was true at C.W. Wiebe. At the Agassiz and Assiniboine clinics, the EMR rates were lower than the MCHP Only rates.

38 | University of Manitoba
Chapter 4: Results
Antidepressant Prescription Follow–Up
Depression Prevalence Defi nition: Patients newly diagnosed with depression (i.e., ICD–9 billing code for depression) during the study period (no diagnosis in the year prior to the start of the study period) and who fi lled a new prescription for an antidepressant within two weeks of the diagnosis.
Table 4.11: Patients Newly Diagnosed with Depression
Clinic Total
Agassiz 618 242 376
Assiniboine 1,769 517 1,252
Dr. C.W. Wiebe 890 362 528
Steinbach 1,208 728 480
Manitoba: 29,171
MCHP Only
Source: Manitoba Centre for Health Policy, 2010
EMR

Manitoba Centre for Health Policy | 39
Physician Integrated Network Baseline Evaluation
Figure 4.14: Patients Newly Diagnosed with Depression Who Filled a Prescription for an
Antidepressant within Two Weeks of Diagnosis: 2005/06–2007/08 Age– and sex–adjusted
0.0%
0.5%
1.0%
1.5%
2.0%
2.5%
3.0%
3.5%
4.0%
ExpectedClinic TotalEMRMCHP OnlyManitoba
Agassiz Medical Centre
Steinbach FamilyMedical Center
Dr. C.W. Wiebe Medical Centre
Source: Manitoba Centre for Health Policy, 2010
Assiniboine Medical Clinic
*
†
†
†
† ‡
* *
†
† †
* significantly different from Manitoba (p<.05)† significantly different from Expected (p<.05)‡ significantly different from MCHP only (p<.05)
‡
The prevalence of depression varies considerably between the various groups. For the Assiniboine clinic, the Expected rate is higher than the provincial rate. Agassiz’s Expected rate is also higher than the provincial rate; the EMR rate is similar to the Expected rate. Both the Clinic Total and the EMR rates for Steinbach are considerably higher than the Expected rate, which is actually similar to the provincial rate. All the rates at the Dr. C.W. Wiebe Clinic are similar (only the Expected rate is signifi cant).

40 | University of Manitoba
Chapter 4: Results
Table 4.12: Patients with Depression Who Had Three Follow–Up Ambulatory Physician Visits within
Four Months of Filling a Prescription for an Antidepressant
Clinic Total
Agassiz 266 98 168
Assiniboine 822 207 615
Dr. C.W. Wiebe 409 157 252
Steinbach 534 292 242
Manitoba: 13,303
MCHP Only
Source: Manitoba Centre for Health Policy, 2010
EMR
Antidepressant Follow–Up Care (Outcome)Defi nition: Patients diagnosed with depression who made three subsequent ambulatory visits within four months of the prescription being fi lled (any diagnosis, any physician) during the study period.

Manitoba Centre for Health Policy | 41
Physician Integrated Network Baseline Evaluation
Figure 4.15: Patients with Depression Who Had Three Follow–Up Ambulatory Physician Visits within
Four Months of Filling a Prescription for an Antidepressant: 2005/06–2007/08 Age– and sex–adjusted
0%
10%
20%
30%
40%
50%
60%ExpectedClinic TotalEMRMCHP OnlyManitoba
Agassiz Medical Centre
Steinbach FamilyMedical Center
Dr. C.W. Wiebe Medical Centre
Source: Manitoba Centre for Health Policy, 2010
Assiniboine Medical Clinic
†
* significantly different from Manitoba (p<.05)† significantly different from Expected (p<.05)‡ significantly different from MCHP only (p<.05)
‡‡
The MCHP Only rates are higher than the EMR rates at the Assiniboine and Steinbach clinics but are similar at the other clinics. At Steinbach, the MCHP Only is also signifi cantly diff erent from the Expected rate.

42 | University of Manitoba
Chapter 4: Results
Asthma Care
Asthma PrevalenceDefi nition: Patients with a diagnosis of asthma in either one or more hospital separations or in two or more medical claims, OR two or more prescriptions for asthma drugs during the study period; excludes chronic obstructive pulmonary disease.
Table 4.13: Patients with Asthma
Clinic Total
Agassiz 1,966 828 1,138
Assiniboine 5,973 1,704 4,269
Dr. C.W. Wiebe 2,848 991 1,857
Steinbach 4,052 2,113 1,939
MCHP OnlyEMR
Manitoba: 126,675
Source: Manitoba Centre for Health Policy, 2010

Manitoba Centre for Health Policy | 43
Physician Integrated Network Baseline Evaluation
Figure 4.16: Patients with Asthma: 2005/06–2007/08 Age– and sex–adjusted
0%
2%
4%
6%
8%
10%
12%
14%
ExpectedClinic TotalEMRMCHP OnlyManitoba
Agassiz Medical Centre
Steinbach FamilyMedical Center
Dr. C.W. Wiebe Medical Centre
Source: Manitoba Centre for Health Policy, 2010
Assiniboine Medical Clinic
†
†
†
† ‡
†
* significantly different from Manitoba (p<.05)† significantly different from Expected (p<.05)‡ significantly different from MCHP only (p<.05)
The prevalence of asthma is statistically diff erent in both the Assiniboine (higher than both the provincial and Expected rates) and Dr. C.W. Wiebe clinics (lower than the Expected rate). The within–clinic comparisons are not diff erent for Agassiz and Steinbach, while the asthma prevalence for the EMR populations is lower at C.W. Wiebe.

44 | University of Manitoba
Chapter 4: Results
Asthma Treatment (Outcome)Defi nition: Patients with asthma who received three or more prescriptions for bronchodilators (reliever drug) in a year and received at least one prescription for an inhaled corticosteroid or leukotriene antagonist (preventer drug).
Table 4.14: Asthmatic Patients Who Had At Least One Prescription for Long–Term Control of Asthma
Clinic Total EMR
Agassiz 1,437 619 818
Assiniboine 4,272 1,164 3,108
Dr. C.W. Wiebe 2,045 687 1,358
Steinbach 3,080 1,629 1,451
MCHP Only
Manitoba: 87,050
Source: Manitoba Centre for Health Policy, 2010

Manitoba Centre for Health Policy | 45
Physician Integrated Network Baseline Evaluation
Figure 4.17: Asthmatic Patients Who Had At Least One Prescription for Long–Term Control of
Asthma: 2005/06–2007/08 Age– and sex–adjusted
0%
10%
20%
30%
40%
50%
60%
70%
80%
90%
100%ExpectedClinic TotalEMRMCHP OnlyManitoba
Agassiz Medical Centre
Steinbach FamilyMedical Center
Dr. C.W. Wiebe Medical Centre
Source: Manitoba Centre for Health Policy, 2010
Assiniboine Medical Clinic
†
† ‡
†
† †
* * * *
* significantly different from Manitoba (p<.05)† significantly different from Expected (p<.05)‡ significantly different from MCHP only (p<.05)
The rates for the asthma prescription outcome are statistically diff erent for both the Assiniboine and Steinbach clinics. At Assiniboine, the Expected rate is below the provincial rate. For Steinbach, the Expected rate is at the provincial average.

46 | University of Manitoba
Chapter 4: Results
Table 4.16: Community-Dwelling Patients Aged 75 and Older Who Filled Prescriptions for more than a
30-day Supply of Benzodiazepines or a Prescription for more than two Benzodiazepines
Clinic Total
Agassiz 379 157 222
Assiniboine 1,190 213 977
Dr. C.W. Wiebe 614 151 463
Steinbach 493 258 235
Source: Manitoba Centre for Health Policy, 2010
EMR MCHP Only
Manitoba: 17,026
Benzodiazepine Prescribing for Community–Dwelling Adults Aged 75 and Older
Defi nition: Community–dwelling patients aged 75 and older who fi lled prescriptions for greater than a 30–day supply of one benzodiazepine or a prescription for more than two diff erent benzodiazepines.
Table 4.15: Community–Dwelling Patients Aged 75 and Older
Clinic Total
Agassiz 2,246 961 1,285
Assiniboine 7,004 1,437 5,567
Dr. C.W. Wiebe 3,680 1,025 2,655
Steinbach 2,615 1,532 1,083
EMR MCHP Only
Manitoba: 96,212Source: Manitoba Centre for Health Policy, 2010

Manitoba Centre for Health Policy | 47
Physician Integrated Network Baseline Evaluation
Figure 4.18: Community–Dwelling Patients Aged 75 and Older Who Filled Prescriptions for
more than a 30–day Supply of Benzodiazepines or a Prescription for more than two
Benzodiazepines: 2005/06–2007/08 Age– and sex–adjusted
0%
5%
10%
15%
20%
25%ExpectedClinic TotalEMRMCHP OnlyManitoba
Agassiz Medical Centre
Steinbach FamilyMedical Center
Dr. C.W. Wiebe Medical Centre
Source: Manitoba Centre for Health Policy, 2010
Assiniboine Medical Clinic
†
†† ‡
* significantly different from Manitoba (p<.05)† significantly different from Expected (p<.05)‡ significantly different from MCHP only (p<.05)
‡
Small numbers of community–dwelling seniors fi ll prescriptions for benzodiazepines, so few of the apparent diff erences in Figure 4.18 reach statistical signifi cance. The EMR rate is below the MCHP Only and Expected rates for the Assiniboine clinic. The EMR rate is lower than Expected at the C.W. Wiebe clinic. The EMR rate is lower than the MCHP Only rate at the Steinbach clinic while the MCHP Only rate is higher than the Expected rate.

48 | University of Manitoba
Chapter 4: Results
Table 4.17: Patients with Congestive Heart Failure
Clinic Total
Agassiz 648 226 422
Assiniboine 1,448 284 1,164
Dr. C.W. Wiebe 1,042 269 773
Steinbach 733 362 371
Manitoba: 22,940
MCHP OnlyEMR
Source: Manitoba Centre for Health Policy, 2010
Congestive Heart Failure (CHF): Treatment with an Angiotensin Converting Enzyme Inhibitor (ACEI) or an Angiotensin II Receptor Blocker (ARB)
CHF PrevalenceDefi nition: Patients with at least one diagnosis for CHF in either a hospital abstract or a physician billing claim during the study period.

Manitoba Centre for Health Policy | 49
Physician Integrated Network Baseline Evaluation
Figure 4.19: Patients with Congestive Heart Failure: 2005/06–2007/08 Age– and sex–adjusted
0.0%
0.5%
1.0%
1.5%
2.0%
2.5%
3.0%
3.5%
4.0%
ExpectedClinic TotalEMRMCHP OnlyManitoba
Agassiz Medical Centre
Steinbach FamilyMedical Center
Dr. C.W. Wiebe Medical Centre
Source: Manitoba Centre for Health Policy, 2010
Assiniboine Medical Clinic
† ††
†
†
† ‡
* * *
*
* significantly different from Manitoba (p<.05)† significantly different from Expected (p<.05)‡ significantly different from MCHP only (p<.05)
‡
‡
‡
The prevalence of CHF for the three Assiniboine clinic groupings is similar to the Expected prevalence, which is, however, lower than the provincial rate. The three rural clinics have higher Expected prevalence than Manitoba’s rate. The rate for the patients in the MCHP Only group is higher than for the EMR group at both the Agassiz and C.W. Wiebe clinics. At Steinbach, the EMR rate is lower than the MCHP Only rate and the Expected rate.

50 | University of Manitoba
Chapter 4: Results
Table 4.18: Patients Newly Diagnosed with Congestive Heart Failure Who Filled a Prescription for
Either ACEI or ARB within Three Months of Diagnosis
Clinic Total
Agassiz 448 143 305
Assiniboine 941 171 770
Dr. C.W. Wiebe 721 216 505
Steinbach 541 258 283
Manitoba: 14,853
Source: Manitoba Centre for Health Policy, 2010
MCHP OnlyEMR
CHF—Initiation of Treatment (Outcome) Defi nition: Newly diagnosed patients (i.e., no diagnosis of CHF in the year prior to the study period) who fi lled a prescription for either an Angiotensin Converting Enzyme Inhibitor (ACEI) or an Angiotensin II
Receptor Blocker (ARB) within three months of the diagnosis.

Manitoba Centre for Health Policy | 51
Physician Integrated Network Baseline Evaluation
Figure 4.20: Patients Newly Diagnosed with Congestive Heart Failure Who Filled a Prescription for
Either ACEI or ARB within Three Months of Diagnosis: 2005/06–2007/08 Age– and sex–adjusted
0%
10%
20%
30%
40%
50%
60%
70%
80%
90%
100%ExpectedClinic TotalEMRMCHP OnlyManitoba
Agassiz Medical Centre
Steinbach FamilyMedical Center
Dr. C.W. Wiebe Medical Centre
Source: Manitoba Centre for Health Policy, 2010
Assiniboine Medical Clinic
†
*
†
†
* *
* significantly different from Manitoba (p<.05)† significantly different from Expected (p<.05)‡ significantly different from MCHP only (p<.05)
The outcome rate for EMR patients in the Dr. C.W. Wiebe Clinic is signifi cantly better than the Expected rate, which is better than the provincial rate. There are diff erences between the within–clinic rates for the Steinbach clinic. At the Agassiz Clinic, the only signifi cant fi nding is that the Expected rate is higher than the provincial rate, but the clinic rates are similar to the Expected rate, as they are for Assiniboine. In Steinbach, the Expected rate is higher than the provincial rate and the total clinic rate is higher than the Expected rate.

52 | University of Manitoba
Chapter 4: Results
Table 4.19: Patients with Congestive Heart Failure Who Were Persistent Users of Either ACEI or ARB
Clinic Total
Agassiz 343 110 233Assiniboine 696 112 584Dr. C.W. Wiebe 547 171 376Steinbach 408 187 221
Manitoba: 748,796
MCHP Only
Source: Manitoba Centre for Health Policy, 2010
EMR
CHF—Persistent Use of Treatment (Outcome) Defi nition: Patients who fi lled prescriptions for a drug supply for at least 80% of the study period (Caetano, Lam, & Morgan, 2006).

Manitoba Centre for Health Policy | 53
Physician Integrated Network Baseline Evaluation
Figure 4.21: Patients with Congestive Heart Failure Who Were Persistent Users of
Either ACEI or ARB: 2005/06–2007/08 Age– and sex–adjusted
0%
10%
20%
30%
40%
50%
60%
70%ExpectedClinic TotalEMRMCHP OnlyManitoba
Agassiz Medical Centre
Steinbach FamilyMedical Center
Dr. C.W. Wiebe Medical Centre
Source: Manitoba Centre for Health Policy, 2010
Assiniboine Medical Clinic
* *
†
*
* significantly different from Manitoba (p<.05)† significantly different from Expected (p<.05)‡ significantly different from MCHP only (p<.05)
‡
The EMR rate at Dr. C.W. Wiebe Clinic is higher than the Expected rate, which is higher than the provincial rate. The Expected rates for the other two rural clinics are above the provincial rate, but the clinic rates are similar to each other. The EMR is signifi cantly lower than MCHP Only rates for Assiniboine.

54 | University of Manitoba
Chapter 4: Results
Diabetes Care
Diabetes PrevalenceDefi nition: Patients aged 20–79 with one or more hospital visits OR two or more physician claims OR one or more prescriptions for treatment of diabetes during the study period.
Table 4.20: Patients Aged 20–79 with Diabetes
Clinic Total
Agassiz 1,012 452 560
Assiniboine 3,661 706 2,955
Dr. C.W. Wiebe 1,619 537 1,082
Steinbach 1,598 896 702
Manitoba: 66,681
MCHP Only
Source: Manitoba Centre for Health Policy, 2010
EMR

Manitoba Centre for Health Policy | 55
Physician Integrated Network Baseline Evaluation
Figure 4.22: Patients with Diabetes: 2005/06–2007/08 Age– and sex–adjusted
0%
1%
2%
3%
4%
5%
6%
7%
8%
9%
10%ExpectedClinic TotalEMRMCHP OnlyManitoba
Agassiz Medical Centre
Steinbach FamilyMedical Center
Dr. C.W. Wiebe Medical Centre
Source: Manitoba Centre for Health Policy, 2010
Assiniboine Medical Clinic
*
†
†
† ‡
**
† † † ‡
†
* significantly different from Manitoba (p<.05)† significantly different from Expected (p<.05)‡ significantly different from MCHP only (p<.05)
There are no within–clinic statistically signifi cant diff erences at the Agassiz clinic. At the Assiniboine Clinic, the rate for the EMR patients is considerably lower than Expected and the rate for the MCHP Only patients is above the Expected rate. Most of the rates for both the Steinbach and Dr. C.W. Wiebe clinics are signifi cantly below the Expected rates.

56 | University of Manitoba
Chapter 4: Results
Table 4.21: Diabetic Patients Who Had an Eye Exam
Clinic Total
Agassiz 699 315 384
Assiniboine 2,197 377 1,820
Dr. C.W. Wiebe 1,109 363 746
Steinbach 996 582 414
Manitoba: 38,281
MCHP Only
Source: Manitoba Centre for Health Policy, 2010
EMR
Diabetes TreatmentDefi nition: Patients with diabetes aged 20–79 who saw either an optometrist or ophthalmologist at least once during the study period.

Manitoba Centre for Health Policy | 57
Physician Integrated Network Baseline Evaluation
Figure 4.23: Diabetic Patients Who Had an Eye Exam: 2005/06–2007/08 Age– and sex–adjusted
0%
10%
20%
30%
40%
50%
60%
70%
80%
90%
100%ExpectedClinic TotalEMRMCHP OnlyManitoba
Agassiz Medical Centre
Steinbach FamilyMedical Center
Dr. C.W. Wiebe Medical Centre
Source: Manitoba Centre for Health Policy, 2010
Assiniboine Medical Clinic
† † †
* **
‡
* significantly different from Manitoba (p<.05)† significantly different from Expected (p<.05)‡ significantly different from MCHP only (p<.05)
The outcome rates for the Assiniboine and Steinbach clinics are similar to the Expected rates and have no within–clinic diff erences between populations. The Clinic Total rates for the other two clinics are higher than the Expected rates. At C.W. Wiebe, the EMR rate is lower than the MCHP Only rate.

58 | University of Manitoba
Chapter 4: Results
Post–Myocardial Infarction (MI) Care: Treatment with Beta–Blockers
Prevalence of Myocardial InfarctionDefi nition: Patients discharged alive from hospital after a myocardial infarction during the study period or the three years before the study period; excludes those with a diagnosis of chronic obstructive pulmonary disease, asthma, or peripheral vascular disease.
Table 4.22: Patients Newly Diagnosed with Myocardial Infarction
(Eligible for Beta–Blocker Prescriptions)
Clinic Total
Agassiz 141 44 97
Assiniboine 384 69 315
Dr. C.W. Wiebe 237 71 166
Steinbach 222 109 113
Source: Manitoba Centre for Health Policy, 2010
Manitoba: 5,946
MCHP OnlyEMR

Manitoba Centre for Health Policy | 59
Physician Integrated Network Baseline Evaluation
Figure 4.24: Patients Newly Diagnosed with Myocardial Infarction (Eligible for Beta–Blocker
Prescriptions): 2005/06–2007/08 Age– and sex–adjusted
0.00%
0.20%
0.40%
0.60%
0.80%
1.00%ExpectedClinic TotalEMRMCHP OnlyManitoba
Agassiz Medical Centre
Steinbach FamilyMedical Center
Dr. C.W. Wiebe Medical Centre
Source: Manitoba Centre for Health Policy, 2010
Assiniboine Medical Clinic
†
†
† ‡
†
†
††
* significantly different from Manitoba (p<.05)† significantly different from Expected (p<.05)‡ significantly different from MCHP only (p<.05)
‡
‡‡
The rates for EMR patients are lower than the MCHP Only patients for all four clinics. The total clinic rates are higher than Expected for all three rural clinics. The EMR rate for Assiniboine is lower than the Expected rate.

60 | University of Manitoba
Chapter 4: Results
Table 4.23: Patients Newly Diagnosed with Myocardial Infarction Who Filled At Least One
Beta–Blocker Prescription within Four Months of Hospital Discharge
Clinic Total
Agassiz 114 36 78
Assiniboine 314 51 263
Dr. C.W. Wiebe 189 58 131
Steinbach 175 88 87
Manitoba: 4,839
MCHP Only
Source: Manitoba Centre for Health Policy, 2010
EMR
Post–MI—Initiation of Beta–Blocker Treatment (Outcome)Defi nition: MI patients with at least one prescription for beta–blocker fi lled within four months of hospital
discharge following an admission for an MI.

Manitoba Centre for Health Policy | 61
Physician Integrated Network Baseline Evaluation
Figure 4.25: Patients Newly Diagnosed with Myocardial Infarction Who Filled At Least One Beta–
Blocker Prescription within Four Months of Hospital Discharge: 2005/06–2007/08 Age– and sex–adjusted
0%
10%
20%
30%
40%
50%
60%
70%
80%
90%
100%ExpectedClinic TotalEMRMCHP OnlyManitoba
Agassiz Medical Centre
Steinbach FamilyMedical Center
Dr. C.W. Wiebe Medical Centre
Source: Manitoba Centre for Health Policy, 2010
Assiniboine Medical Clinic
* significantly different from Manitoba (p<.05)† significantly different from Expected (p<.05)‡ significantly different from MCHP only (p<.05)
The results do not indicate signifi cant diff erences between the Expected rates or any of the within–clinic patient allocation groups.

62 | University of Manitoba
Chapter 4: Results
Table 4.24: Patients with Myocardial Infarction Who Were Persistent Users of Beta–Blockers
Clinic Total
Agassiz 104 35 69
Assiniboine 302 47 255
Dr. C.W. Wiebe 175 52 123
Steinbach 164 86 78
Manitoba: 4,506
MCHP OnlyEMR
Source: Manitoba Centre for Health Policy, 2010
Post–MI—Persistent Use of Beta–Blocker Treatment (Outcome) Defi nition: MI patients with prescriptions for beta–blockers after hospitalization for an MI that were fi lled for a minimum of 80% of the days between the hospital discharge and the end of the study period.

Manitoba Centre for Health Policy | 63
Physician Integrated Network Baseline Evaluation
Figure 4.26: Patients with Myocardial Infarction Who Were Persistent Users of Beta–Blockers:
2005/06–2007/08 Age– and sex–adjusted
0%
10%
20%
30%
40%
50%
60%
70%
80%
90%
100%ExpectedClinic TotalEMRMCHP OnlyManitoba
Agassiz Medical Centre
Steinbach FamilyMedical Center
Dr. C.W. Wiebe Medical Centre
Source: Manitoba Centre for Health Policy, 2010
Assiniboine Medical Clinic
* significantly different from Manitoba (p<.05)† significantly different from Expected (p<.05)‡ significantly different from MCHP only (p<.05)
Once again, due to the small sample size, there are no statistically signifi cant diff erences between the clinic populations and the provincial or Expected rates.

64 | University of Manitoba
Chapter 4: Results
Table 4.25: Patients Newly Diagnosed with Myocardial Infarction (Eligible for Cholesterol–Lowering
Drug Prescriptions)
Clinic Total
Agassiz 178 63 115
Assiniboine 462 82 380
Dr. C.W. Wiebe 292 82 210
Steinbach 247 125 122
Manitoba: 7,142
MCHP Only
Source: Manitoba Centre for Health Policy, 2010
EMR
Post–Myocardial Infarction (MI) Care: Treatment with Cholesterol–Lowering Drugs
Prevalence of Myocardial InfarctionDefi nition: Patients discharged alive from hospital after an MI in the three years preceding the start of the study period.

Manitoba Centre for Health Policy | 65
Physician Integrated Network Baseline Evaluation
Figure 4.27: Patients Newly Diagnosed with Myocardial Infarction (Eligible for Cholesterol–Lowering
Drug Prescriptions): 2005/06–2007/08 Age– and sex–adjusted
0.0%
0.1%
0.2%
0.3%
0.4%
0.5%
0.6%
0.7%
0.8%
0.9%
1.0%ExpectedClinic TotalEMRMCHP OnlyManitoba
Agassiz Medical Centre
Steinbach FamilyMedical Center
Dr. C.W. Wiebe Medical Centre
Source: Manitoba Centre for Health Policy, 2010
Assiniboine Medical Clinic
†
†
† ‡
†
†
†
†
* significantly different from Manitoba (p<.05)† significantly different from Expected (p<.05)‡ significantly different from MCHP only (p<.05)
‡‡
‡
The Expected MI prevalence for all four clinics are similar to the provincial rates. The MCHP Only rates are higher than Expected for all four clinics; the EMR rate is lower than Expected at Assiniboine. The Clinic Total rates are higher than Expected for the three rural clinics. The MCHP Only rate is higher than the EMR rate for all four clinics.

66 | University of Manitoba
Chapter 4: Results
Table 4.26: Patients Newly Diagnosed with Myocardial Infarction Who Filled At Least One
Cholesterol–Lowering Drug Prescription within Four Months of Hospital Discharge
Clinic Total
Agassiz 101 33 68
Assiniboine 274 38 236
Dr. C.W. Wiebe 170 47 123
Steinbach 141 73 68
Manitoba: 4,190
MCHP Only
Source: Manitoba Centre for Health Policy, 2010
EMR
Post–MI—Initiation of Cholesterol–Lowering Treatment (Outcome)Defi nition: MI patients with a new prescription for a cholesterol–lowering drug fi lled within four months of hospital discharge after an admission for an MI.
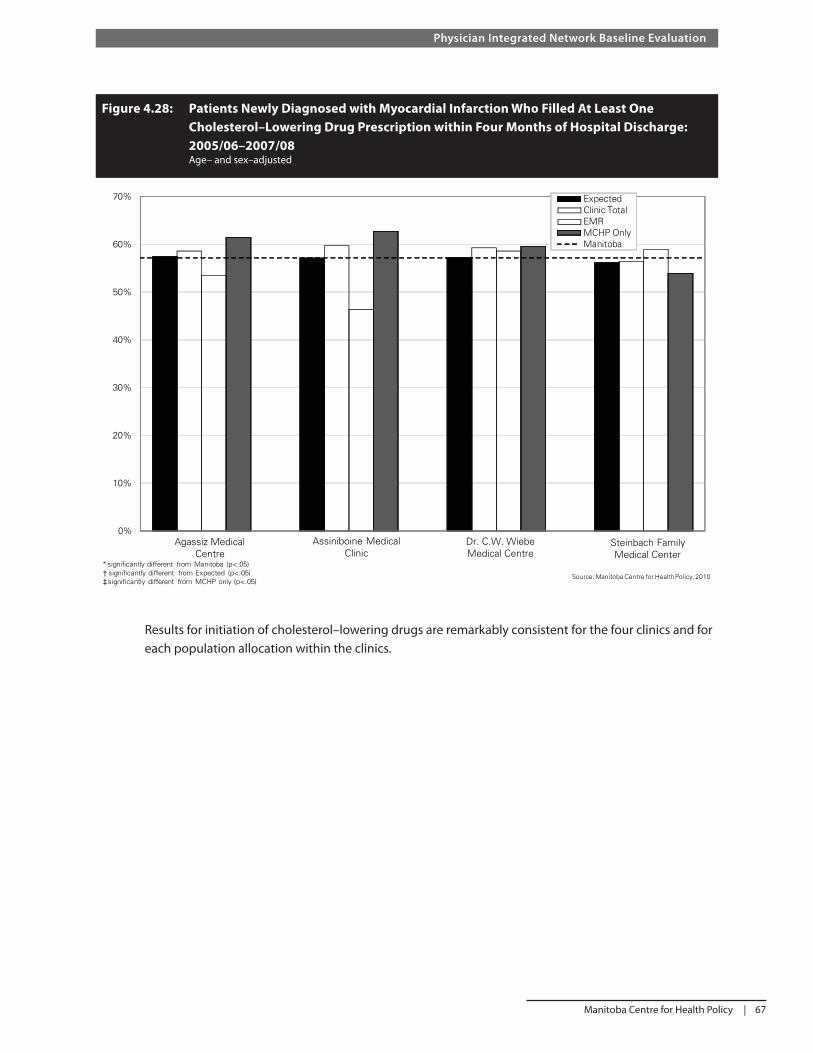
Manitoba Centre for Health Policy | 67
Physician Integrated Network Baseline Evaluation
Figure 4.28: Patients Newly Diagnosed with Myocardial Infarction Who Filled At Least One
Cholesterol–Lowering Drug Prescription within Four Months of Hospital Discharge:
2005/06–2007/08 Age– and sex–adjusted
Results for initiation of cholesterol–lowering drugs are remarkably consistent for the four clinics and for each population allocation within the clinics.
0%
10%
20%
30%
40%
50%
60%
70% ExpectedClinic TotalEMRMCHP OnlyManitoba
Agassiz Medical Centre
Steinbach FamilyMedical Center
Dr. C.W. Wiebe Medical Centre
Source: Manitoba Centre for Health Policy, 2010
Assiniboine Medical Clinic
* significantly different from Manitoba (p<.05)† significantly different from Expected (p<.05)‡significantly different from MCHP only (p<.05)

68 | University of Manitoba
Chapter 4: Results
Table 4.27: Patients with Myocardial Infarction Who Were Persistent Users of Cholesterol–
Lowering Drugs
Clinic Total
Agassiz 43 14 29
Assiniboine 142 18 124
Dr. C.W. Wiebe 81 22 59
Steinbach Family 71 40 31
Manitoba: 2,118
MCHP Only
Source: Manitoba Centre for Health Policy, 2010
EMR
Post–MI—Persistent Use of Cholesterol–Lowering Treatment (Outcome) Defi nition: MI patients with prescriptions for cholesterol–lowering medication after hospitalization for an MI that were fi lled for a minimum of 80% of the days between the hospital discharge and the end of the study period.

Manitoba Centre for Health Policy | 69
Physician Integrated Network Baseline Evaluation
0%
5%
10%
15%
20%
25%
30%
35%
40%
ExpectedClinic TotalEMRMCHP OnlyManitoba
Agassiz Medical Centre
Steinbach FamilyMedical Center
Dr. C.W. Wiebe Medical Centre
Source: Manitoba Centre for Health Policy, 2010
Assiniboine Medical Clinic
* significantly different from Manitoba (p<.05)† significantly different from Expected (p<.05)‡ significantly different from MCHP only (p<.05)
Figure 4.29: Patients with Myocardial Infarction Who Were Persistent Users of Cholesterol–
Lowering Drugs: 2005/06–2007/08 Age– and sex–adjusted
Likely due to the small sample sizes, the results for persistent use are not statistically diff erent despite looking diff erent for the clinic populations at Assiniboine, Steinbach, and Agassiz in Figure 4.29.

70 | University of Manitoba
Chapter 4: Results

Manitoba Centre for Health Policy | 71
Physician Integrated Network Baseline Evaluation
Chapter 5: Discussion
A number of lessons can be learned from this study. Firstly, there are clearly limitations in both the data extracted from clinic EMRs and the administrative data held in the Repository. One of the potential advantages of the study is to learn how to best use the two data sources together. Unfortunately, the time lag resulting from the single annual data download from Manitoba Health to the Repository prevents a more current analysis of the Repository data.
The EMR extracts are limited in their dependence on the appropriate fi elds both being available in the EMR and being routinely used by the clinicians. Relevant data that are not entered into the fi eld are not captured in the data extract. Because the QBIF funding is intended to reward quality, it is important to be able to separate changes in the provision of quality care from the documentation of quality care. The use of the EMR to keep track of the indicator outcomes works best when this process fi ts with the normal care process and data capture is more complete.
For PIN to achieve its goals, a number of changes need to take place. This study focused on two components of the changes that are supported by PIN. Firstly, the study provides context and insight into the measurement of some of the quality indicators (less than half of the indicators used in the broader evaluation can be measured using the Repository data); and secondly, the extent and type of EMR use by clinicians. All EMRs off er the potential to use the information entered into the patient record in a variety of creative ways. Whether it is creating a longitudinal graphical comparison of the patients’ blood pressure results or developing evidence–based automatic reminders to prompt care plans, the EMR can provide an advantage over the use of a paper medical chart, but the clinicians must be engaged. This study has shown the extent of the variability in how physicians used their EMRs at the start of the study. Therefore it was diffi cult to separate true changes in clinical practice facilitated by PIN from changes in EMR charting practice alone. Analysis of real time administrative claims data could potentially provide this insight, but it is not currently available at MCHP.
Changes in the use of the EMRs were apparent (even when not captured in the study data due to the time lag) to the investigators because physicians from all the participating clinics were involved in the regular Advisory Group meetings. They were also part of the ongoing engagement with Manitoba Health throughout the study period. In addition, a new EMR qualifi cation process was introduced by Manitoba Health whereby EMR vendors must meet predetermined standards, such as always including certain EMR fi elds and having the capacity to extract the data from those fi elds.
While the results for each indicator are interesting, it is of greater interest to note that there are diff erences between the EMR–allocated patients compared to the ones identifi ed from the Repository. This was true for many of the indicators. This fi nding should lead to an exploration of why these diff erences exist and an attempt to determine ways to ensure that the best possible information is being used to measure the success of PIN. As the PIN Evaluation Committee works to establish a standardized clinic–based defi nition for patients to include in the EMR abstract, it can use the fi ndings of this study to compare how each of the current defi nitions have resulted in diff erences to the MCHP algorithm. This does not imply that the MCHP algorithm is the gold standard to which the clinic EMR patient allocation should aspire, but rather that the comparison between the two approaches provides an opportunity to explore their diff erences and learn from the comparison.

72 | University of Manitoba
Chapter 5: Discussion
While this discussion refl ects the research and quality measure consequences of determining which patients to include in these indicators, the ultimate concern is the physician’s acceptance of accountability for patient care. Clearly, this relationship is best determined in conjunction with the patient. Formal patient enrolment in practices, which involves a mutual commitment by both the patient and provider, has been widely implemented in Ontario and Quebec. In Ontario, more than 70% of the population has enrolled with a primary care physician (Kantarevic et al., 2010). Implementation of some form of patient enrolment in Manitoba would address the concerns raised above as well as promote continuity of care, which has been shown to support quality of care.
There is often value in comparing results across diff erent studies either to validate the results of a new study or to explore the reasons for the diff erences. We, however, encourage readers to focus on the value of the internal comparisons rather than looking for external comparisons. Most of the EMR defi nitions used in this study have not been used with clinical data despite their origins in the CIHI published defi nitions. Operationalizing those defi nitions frequently resulted in refi nements that could have signifi cant impact on the indicator rates and comparisons with external data. Perhaps more importantly, it is well known that patient characteristics such as age, sex, and socioeconomic status have a profound impact on their health status and health behaviors. Comparisons between diff erent populations are thus fraught with built–in errors when these characteristics are not taken into account. We used virtual practices to provide comparable populations for meaningful indicator comparisons to address this challenge.
The provincial rates for our indictors are generally consistent with previous studies using the Repository. Diff erences are due to diff erent time periods and slight variations in indicator defi nitions (according to the specifi c purposes of the studies). For example, atlases often use consistent defi nitions over time to facilitate comparisons with previous atlases despite refi nements in these defi nitions that other studies have developed.
The lack of any consistent pattern both between clinics (no one clinic seems to provide consistently better or worse care than the others) and across indicators suggests widespread room for improvement amongst the PIN clinics. Because we have shown that the PIN clinics are not consistently worse than the provincial rates or the expected rates for each clinic, we can conclude this room for improvement is to be found across the province. PIN, thus, has the potential to facilitate improved care for many Manitobans as the number of physicians participating in Phase 2 increases. Introducing a system of quality measurement beyond the realm of PIN across all direct service sites would, based on the experience with this study, facilitate this improvement.
Future ResearchWhile the comparisons within clinics provides useful information within the context of the organization of the PIN initiative, use of the Repository data has a potentially larger role to play in measuring two important outcomes. Firstly, one of the goals of PIN is to improve patient access to the primary care clinic with which the patient is associated. Improved access should lead to better continuity of care which has been shown to lead to better health outcomes (Katz et al., 2004; Martens et al., 2008). Because the data contained in the EMR extracts is limited to the participating clinics, it provides limited data on the use of other primary care clinics by people identifi ed by the PIN clinics as core patients. This information is, however, available from the Repository and should be used in future evaluations as an indicator of access and continuity of care.

Manitoba Centre for Health Policy | 73
Physician Integrated Network Baseline Evaluation
The results of this study should be seen as baseline data for further research in determining whether PIN has lead to improvement in patient care. While the initial hope was for Phase 1 to demonstrate these changes, inconsistencies in the charting practices of many of the participating physicians prior to PIN and in its early implementation, has limited our ability to demonstrate that changes in the EMR extracts are indeed changes in clinical practice, rather than changes in use of the EMR. By allowing the initial period to be included as a baseline where charting practices were standardized, we will be able to measure future changes in practice using both the EMR and Repository. The Repository can then be used to validate the EMR changes over time for those indicators that can be measured by both data sources.

74 | University of Manitoba
Glossary
Glossary
Acronyms
ACEI – Angiotensin converting enzyme inhibitor
ARB – Angiotensin II receptor blockers
CHF – Congestive heart failure
CIHI – Canadian Institutes for Health Information
DPIN – Drug Programs Information Network
EMR – Electronic medical record
FFS – Fee-for-service
MCHP – Manitoba Centre for Health Policy
MI – Myocardial infarction
PHIN – Personal health information number
PIN – Physician Integrated Network
RHA – Regional health authority
QBIF – Quality based incentive funding
SAS® – Statistical Analysis Software
Administrative Data
Information collected “usually by government, for some administrative purpose (e.g., keeping track of the population eligible for certain benefi ts, paying doctors or hospitals), but not primarily for research or surveillance purposes” (Spasoff , 1999). MCHP’s research uses administrative data from hospital discharge summaries, physician billing claims, claims for prescription drugs, and other health related data. Using these data, researchers can study the utilization of health resources over time and the variations in rates within and across the provinces.
Ambulatory Visits (Physician)
Any contact between a patient and physician at one of the following locations: physician’s offi ce, outpatient or emergency department, clinics, personal care home, the patient’s home, or northern/remote nursing stations. Contacts with patients while they are in hospital are not included.
Angiotensin Converting Enzyme Inhibitor (ACEI) and Angiotensin II Receptor Blockers (ARB)
A therapeutic class of drugs commonly used to treat hypertension and other cardiovascular risks.

Manitoba Centre for Health Policy | 75
Physician Integrated Network Baseline Evaluation
Antidepressant
Medicines that are used to help people who have depression. Most antidepressants are believed to work by slowing the removal of certain chemicals from the brain. These chemicals are called neurotransmitters and are needed for normal brain function. Antidepressants help people with depression by making these natural chemicals more available to the brain (Fransoo et al., 2009). See Table A1.2 for the codes used to identify this medication.
Asthma
A disease in which infl ammation of the airways causes airfl ow into and out of the lungs to be restricted. See Table A1.2 for the codes used to identify this condition.
Benzodiazepines
Benzodiazepines belong to the group of medicines called central nervous system (CNS) depressants. They are used to slow down the nervous system. See Table A1.2 for the codes used to identify this medication.
Beta-Blocker
Beta-blockers, properly known as beta-adrenergic blocking drugs, have been shown to lower the risk of subsequent heart attacks. See Table A1.2 for the codes used to identify this medication.
Childhood Immunization
An intervention to initiate or increase resistance against infectious disease. See Table A1.2 for the codes used to identify this procedure.
Congestive Heart Failure (CHF)
Also called congestive cardiac failure (CCF) or just heart failure, it is the inability of the heart to pump a suffi cient amount of blood throughout the body, or requiring elevated fi lling pressures in order to pump eff ectively. CHF is an abnormal cardiac condition that refl ects impaired cardiac pumping and blood fl ow. The pooling of blood leads to congestion in body tissue. See Table A1.2 for the codes used to identify this condition.
Diabetes
A chronic condition in which the pancreas no longer produces enough insulin (Type I Diabetes) or when cells stop responding to the insulin that is produced (Type II Diabetes), so that glucose in the blood cannot be absorbed into the cells of the body. See Table A1.2 for the codes used to identify this condition.

76 | University of Manitoba
Glossary
Drug Programs Information Network (DPIN) Database
A database containing prescription drug claims from DPIN, an electronic, on-line, point-of-sale prescription drug database. Initiated in 1994, it connects Manitoba Health and all pharmacies in Manitoba to a central database maintained by Manitoba Health. Information about pharmaceutical dispensations is captured in real time for all Manitoba residents (including Registered First Nations), regardless of insurance coverage or fi nal payer. DPIN facilitates payment administration for eligible drug costs, incorporating functions such as real-time adjudication, and collects high-quality data on all prescriptions issued to Manitobans, such as drug, dosage, and prescription date. Note that the prescription’s indication (the physician’s prescribing intent) is not collected and must be inferred from other data.
Electronic Medical Records (EMRs)
A computerized legal medical record created to allow physicians and other health care providers to easily look through or chart their patients’ health information (adopted from Government of Nova Scotia website, http://www.gov.ns.ca/health/eResults/default.asp. Accessed February 18, 2010)
Family Physician
A generalist physician who provides and coordinates personal, continuing, and comprehensive primary care to individuals and families. Such physicians are identifi ed by a code in MCHP’s physician data.
Fee-for-Service (FFS)
A method of payment whereby physicians bill for each service rendered, according to a pre-arranged schedule of fees and services. Physicians who are paid on a FFS basis fi le a claim for each service rendered and are responsible for their operating costs. Other physicians are compensated under an alternate payment plan.
Fiscal Year
For most Canadian government agencies and health care institutions, the fi scal year is defi ned as starting April 1 and ending the following year at March 31. For example, the 2005/06 fi scal year would be April 1, 2005 to March 31, 2006, inclusive. In this report, for simplicity we have only used the year (i.e., 2005).
Hospital Discharge
A discharge from hospital occurs anytime a patient leaves because of death, discharge, sign-out against medical advice, or transfer.
Hospital Discharge Abstract
A form/computerized record fi lled out upon a patient’s discharge (separation) from an acute care hospital. The abstract contains information from the patient’s medical record based on their stay in hospital, such as: gender, residence (postal code), diagnoses and procedure codes, admission and discharge dates, length of stay, and service type (inpatient, day surgery, outpatient).

Manitoba Centre for Health Policy | 77
Physician Integrated Network Baseline Evaluation
Manitoba Immunization Monitoring System
MIMS is a population-based monitoring system that provides monitoring and reminders to help achieve high levels of immunization. Immunization status is monitored by comparing the system record and the recommended schedule.
Mammography
A procedure to determine if a woman has breast cancer or a breast tumor; it is commonly used for breast cancer screening. Mammograms can show most breast cancer two to three years before it can be detected through self-exams. See Table A1.2 for the codes used to identify this procedure.
Myocardial Infarction (MI)
A heart attack (myocardial infarction) occurs when an area of heart muscle dies or is permanently damaged because of an inadequate supply of oxygen to that area. See Table A1.2 for the codes used to identify this condition.
Negative Binomial Distribution
A discrete probability distribution appropriate for analyzing count data when an event is relatively rare, but is highly variable over the entire population.
Negative Binomial Regression
Regression analyses for count data that follows a negative binomial distribution, which occurs when an event is relatively rare, but is highly variable over the entire population.
Ophthalmologist
A medical doctor who has undergone specialty training to diagnose and treat disorders of the eye. An ophthalmologist is qualifi ed to prescribe medication, prescribe and adjust eyeglasses and contact lenses. and is qualifi ed to perform laser treatment and surgery.
Optometrist
Although not a doctor of medicine, an optometrist is specifi cally trained to diagnose eye abnormalities and prescribe, supply, and adjust eyeglasses and contact lenses.
Papanicolaou (Pap) test
Used primarily for cervical cancer screening, this test is based on the examination of cells collected from the cervix to reveal pre-malignant (before cancer) and malignant (cancer) changes, as well as, changes due to non-cancerous conditions such as infl ammation from infections. See Table A3.1 for the codes used to identify this procedure.

78 | University of Manitoba
Glossary
Patient Allocation
The process of allocating all patients who have seen a physician to the one most responsible for their care during the study period. This is necessary in order to defi ne the physician’s practice population. In this study, we used the plurality approach.
Physician Integrated Network (PIN)
“PIN is a Manitoba Health primary care renewal initiative that focuses on fee-for-service (FFS) physician groups. Its goal is to facilitate systemic improvements in the delivery of primary care” (PIN website: http://www.gov.mb.ca/health/phc/pin/index.html. Accessed June 7, 2010).
Physician Claims
Claims (billings) that are submitted to the provincial government by individual physicians for services they provide. Fee-for-service physicians receive payment based on these claims, while those submitted by physicians on alternate payment plans are for administrative purposes only. The physician claims data fi le is part of the Population Health Research Data Repository.
Plurality Approach to Patient Allocation
A method that assigns patients exclusively to their most responsible health care provider. In one method, the most responsible physician was the one who provided more of their visits than any other physician. When more than one physician provided equal numbers of visits, the patient was assigned to the physician with the greatest visit costs; and in the case of a second tie, total costs were used. Calculation of total cost included direct care (i.e., visits) and indirect care (i.e., referrals for other services and consults).
Population Health Research Data Repository (Repository)
A comprehensive collection of administrative, registry, survey, and other databases primarily comprised of residents of Manitoba. This Repository is housed at the Manitoba Centre for Health Policy (MCHP). It was developed to describe and explain patterns of health care and profi les of health and illness, facilitating inter-sectoral research in areas such as health care, education, and social services. The administrative health database, for example, holds records for virtually all contacts with the provincial health care system—the Manitoba Health Services Insurance Plan (including physicians, hospitals, personal care homes, home care, and pharmaceutical prescriptions) of all registered individuals. MCHP acts as a steward of the information in the Repository for agencies such as Manitoba Health.
Preventive Care
Medical services delivered by physicians that are directed at prevention or early detection of disease.
Primary Care
“In Manitoba, one of the core services provided by the Primary Health Care system. It includes assessment, diagnosis, and treatment of common illnesses generally provided by family physicians and nurses” (Manitoba Health, 2006).

Manitoba Centre for Health Policy | 79
Physician Integrated Network Baseline Evaluation
Primary Care Physicians
Family physicians/general practitioners who serve as a patient’s fi rst contact.
Quality Based Incentive Funding (QBIF)
Funding provided to clinics for meeting quality targets on selected clinical process indicators (Manitoba Health website: http://www.gov.mb.ca/health/phc/pin/fund.html. Accessed on February 18, 2010).
Tariff
The fee schedule for each service provided by a physician.

80 | University of Manitoba
Reference List
Caetano PA, Lam JM, Morgan SG. Toward a standard defi nition and measurement of persistence with drug therapy: examples from research on statin and antihypertensive utilization. Clin Ther. 2006;28(9):1411-1424.
Canadian Institute for Health Information. Pan-Canadian Primary Health Care Indicator Development Project. http://secure.cihi.ca/cihiweb/dispPage.jsp?cw_page=GR_1489_E. Accessed January 13, 2010.
Fransoo R, Martens P, Burland E, The Need to Know Team, Prior H, Burchill C. Manitoba RHA Indicators Atlas 2009. Manitoba Centre for Health Policy. 2009. http://mchp-appserv.cpe.umanitoba.ca/reference/RHA_Atlas_Report.pdf. Accessed January 13, 2010. Last edited January 8, 2010.
Frohlich N, Katz A, De Coster C, Dik N, Soodeen R, Watson D, Bogandanovic, B. Profi ling Primary Care Physician Practice in Manitoba. Manitoba Centre for Health Policy. 2006. http://mchp-appserv.cpe.umanitoba.ca/reference/primary.profi ling.pdf. Accessed January 13, 2010.
Kantarevic J, Kralj B, Weinkauf D. Enhanced fee-for-service model and access to physician services: evidence from family health groups in Ontario. Germany: The Institute for the Study of Labor (IZA); 2010.
Katz A, De Coster C, Bogdanovic B, Soodeen R, Chateau D. Using Administrative Data to Develop Indicators of Quality in Family Practice. Manitoba Centre for Health Policy. 2004. http://mchp-appserv.cpe.umanitoba.ca/reference/quality_wo.pdf. Accessed January 13, 2010.
Martens P, Fransoo R, The Need to Know Team, Burland E, Prior H, Burchill C, Romphf L, Chateau D, Bailly A, Ouelette C. What Works? A First Look at Evaluating Manitoba’s Regional Health Programs and Policies at the population level. Manitoba Centre for Health Policy. 2008. http://mchp-appserv.cpe.umanitoba.ca/reference/What%20Works.pdf. Accessed June 9, 2010.
Manitoba Health. Manitoba Healthy Living. Chronic Disease Prevention. Government of Manitoba. 2006. http://www.gov.mb.ca/healthyliving/chronic.html. Accessed January 13, 2010.
Spasoff RA. Epidemiologic Methods for Health Policy. New York, NY: Oxford University Press; 1999.

Manitoba Centre for Health Policy | 81
Physician Integrated Network Baseline Evaluation
Appendix
Table A1.1: Codes Used to Defi ne the Indicators
Indicator Codes
1. Cervical cancer screening Tariffs 9795, 8498, 8470, 8495, 8496Hysterectomy: ICD 9-CM 68.3 - 68.9; ICD-10 CA 1RM87, 1RM89, 1RM91
2. Childhood immunizations DPT (x4), HiB (x4), Polio (x3):
Tariffs: 8802, 8804, 8806, 8807 MMR (x1) Tariffs 8670, 8621
3. Influenza vaccination for adults aged 65 and older
Tariffs 8791, 8792,8799
4. Breast cancer screening Tariffs 7098, 7099, 7104, 7110, 7111
5. Antibiotic prescription management ATC code J01
6. Antidepressant follow-up Depression: ICD-9-CM 296, 311 Antidepressants: ATC codes N06AA, N06AB, N06AF, N06AG, N06AX
7. Asthma care Asthma: ICD-9-CM 493, ICD-10 CA J45Asthma Drugs: ATC codes R03A, R03B, R03C, R03D
8. Benzodiazepine prescribing for community-dwelling adults aged 75 and older
ATC code: N05B
9. Congestive heart failure (CHF): treatment with an Angiotensin Converting Enzyme Inhibitor (ACEI) or an Angiotensin II Receptor Blockers (ARB)
CHF:
Hospital diagnosis: ICD-10 CA 150Medical diagnosis: ICD-10 CA 428ACEI/ARB: ATC codes C09A, C09B, C09C, C09D
10. Diabetes care Diabetes: Medical diagnosis: ICD-9-CM 250Hospital diagnosis: ICD-10 E10,E11,E12, E13,E14Optometrist/Ophthalmologist: MD Bloc 051, 053
11. Post-myocardial infarction care: beta-blocker prescribing
MI: ICD-9-CM 410, ICD-10 CA I21, 122Excluding :
Asthma: ICD-9-CM 493, ICD-10 CA J45COPD: ICD-9-CM 491, 492; ICD-10 CA J41-J44Peripheral vascular disease:
ICD-9-CM 443, 459; ICD-10 CA I73, I79.2, I87, I9Beta-blocker: ATC codes C07AA C07AB
12. Post-myocardial infarction care: cholesterol-lowering drug prescribing
MI: ICD-9-CM 410 Cholesterol lowering drug: ATC code C10
Preventive Care
Acute and Chronic Disease Management
Source: Mantioba Centre for Health Policy, 2010

82 | University of Manitoba
Appendix
Table A1.2: Manitoba’s Routine Childhood Immunization Schedule (as of January 2001)
AGE DaPTP* Hib* MMR
2 months X X -- 4 months X X -- 6 months X X --
12 months -- -- X
18 months X X --
*DaPTP and Hib are given as “one needle” D or d aP T P Hib
- diphtheria - accelular pertussis
(whooping cough) - tetanus - polio - haemophilus influenzae type B
M M R
- measles (red measles) - mumps - rubella (german measles)
Source: Routine Childhood Immunization Schedule (as of January 2001). Communicable Disease Control Unit, Manitoba Health and Healthy Living, May 2001

Manitoba Centre for Health Policy | 83
Physician Integrated Network Baseline Evaluation
Recent MCHP Publications2010
Profi le of Metis Health Status and Healthcare Utilization in Manitoba: A Population–Based Study by Patricia Martens, Judith Bartlett, Elaine Burland, Heather Prior, Charles Burchill, Shamima Huq, Linda Romphf, Julianne Sanguins, Sheila Carter, and Angela Bailly
The Additional Cost of Chronic Disease in Manitoba by Gregory Finlayson, Okechukwu Ekuma, Marina Yogendran, Elaine Burland, and Evelyn Forget
2009
Eff ects of Manitoba Pharmacare Formulary Policy on Utilization of Prescription Medications byAnita Kozyrskyj, Colette Raymond C, Matt Dahl, Oke Ekuma, Jenn Schultz, Mariana Sklepowich, and Ruth Bond
Manitoba RHA Indicators Atlas 2009 by Randy Fransoo, Patricia Martens, Elaine Burland, The Need to Know Team, Heather Prior, and Charles Burchill
Composite Measures/Indices of Health and Health System Performance by Colleen Metge, Dan Chateau, Heather Prior, Ruth-Ann Soodeen, Carolyn De Coster, and Louis Barre
The Direct Cost of Hospitalizations in Manitoba, 2005/06 by Greg Finlayson, Julene Reimer, Matthew Stargardter, and Kari-Lynne McGowan
Physician Resource Projection Models by Alan Katz, Bogdan Bogdanovic, Oke Ekuma, Ruth-Ann Soodeen, Dan Chateau, and Chris Burnett
2008
Manitoba Child Health Atlas Update by Marni Brownell, Carolyn De Coster, Robert Penfold, Shelley Derksen, Wendy Au, Jennifer Schultz, and Matthew Dahl
An Initial Analysis of Emergency Departments and Urgent Care in Winnipeg by Malcolm Doupe, Anita Kozyrskyj, Ruth-Ann Soodeen, Shelley Derksen, Charles Burchill, and Shamima Huq
What Works? A First Look at Evaluating Manitoba’s Regional Health Programs and Policies at the Population Level by Patricia Martens, Randy Fransoo, The Need to Know Team, Elaine Burland, Heather Prior, Charles Burchill, Linda Romphf, Dan Chateau, Angela Bailly, and Carole Ouelette

84 | University of Manitoba
2007
Next Steps in the Provincial Evaluation of the BabyFirst program: Measuring Early Impacts on Outcomes Associated with Child Maltreatment by Marni Brownell, Rob Santos, Anita Kozyrskyj, Noralou Roos, Wendy Au, Natalia Dik, Mariette Chartier, Darlene Gerard, Okechukwu Ekuma, Monica Sirski, Nadine Tonn, Jennifer Schultz
Allocating Funds for Healthcare in Manitoba Regional Health Authorities: A First Step—Population–Based Funding by Gregory S Finlayson, Evelyn Forget, Okechukwu Ekuma, Shelley Derksen, Ruth Bond, Patricia Martens, and Carolyn De Coster.
Waiting Times for Surgery, Manitoba: 1999/2000 to 2003/04 by Carolyn De Coster, Dan Chateau, Matt Dahl, Ruth-Ann Soodeen, and Nancy McKeen
2006
Using Administrative Data to Develop Indicators of Quality Care in Personal Care Homes by Malcolm Doupe, Marni Brownell, Anita Kozyrskyj, Natalia Dik, Charles Burchill, Matt Dahl, Dan Chateau, Carolyn De Coster, Aynslie Hinds, and Jennifer Bodnarchuk
Profi ling Primary Care Practice in Manitoba by Norman Frohlich, Alan Katz, Carolyn De Coster, Natalia Dik, Ruth-Ann Soodeen, Diane Watson, and Bogdan Bogdanovic
Defi ning and Validating Chronic Diseases: An Administrative Data Approach by Lisa Lix, Marina Yogendran, Charles Burchill, Colleen Metge, Nancy McKeen, David Moore, and Ruth Bond
Application of Patient Safety Indicators in Manitoba: A First Look by Sharon Bruce, Heather Prior, Alan Katz, Mark Taylor, Steven Latosinsky, Patricia Martens, Carolyn De Coster, Marni Brownell, Ruth-Ann Soodeen, and Carmen Steinbach
2005
Sex Diff erences in Health Status, Health Care Use, and Quality of Care: A Population-Based Analysis for Manioba’s Regional Health Authorities by Randy Fransoo, Patricia Martens, The Need to Know Team (funded through CIHR), Elaine Burland, Heather Prior, Charles Burchill, Dan Chateau, and Randy Walld
Health and Health Care Use Among Older Adults: Using Population-Based Information Systems to Inform Policy in Manitoba, Canadian Journal on Aging, Volume 24, Supplement 1, 2005.
High-Cost Users of Pharmaceuticals: Who Are They? by Anita Kozyrskyj, Lisa Lix, Matthew Dahl, and Ruth-Ann Soodeen.
Primary Prevention: An Examination of Data Capabilities in Manitoba by Lisa Lix, Greg Finlayson, Marina Yogendran, Ruth Bond, Jennifer Bodnarchuk, and Ruth-Ann Soodeen.
Aboriginal Health Research and Policy: First Nations-University Collaboration in Manitoba, Canadian Journal of Public Health, Volume 96, Supplement 1, January/February 2005.

Copies of MCHP publications are available for dowload free of charge at: http://mchp-appserv.cpe.umanitoba.ca/deliverablesList.html
Hard copies of our reports are available free of charge, by contacting us at: Mail: 408 Brodie Centre, 727 McDermot Avenue Winnipeg, Manitoba, Canada R3E 3P5 Email: [email protected] Phone: (204) 789-3819 Fax: (204) 789-3910