
An experimental study on effect of process parameters in ...

Experimental parameters for a reactor antineutrino experiment at very short baselines
K.M. Heeger and M.N. Tobin
Department of Physics, University of Wisconsin, Madison, Wisconsin 53706, USA
B.R. Littlejohn*
Physics Department, University of Cincinnati, Cincinnati, Ohio 45221, USA
H. P. Mumm
National Institute of Standards and Technology, Gaithersburg, Maryland 20899, USA(Received 22 January 2013; published 23 April 2013)
Reactor antineutrinos are used to study neutrino oscillation, search for signatures of nonstandard
neutrino interactions, and monitor reactor operation for safeguard applications. The flux and energy
spectrum of reactor antineutrinos can be predicted from the decays of the nuclear fission products.
A comparison of recent reactor calculations with past measurements at baselines of 10–100 m suggests a
7.2% deficit. Precision measurements of reactor antineutrinos at very short baselines Oð1–10 mÞ can be
used to probe this anomaly and search for possible oscillations into sterile neutrino species. This paper
studies the experimental requirements for a new reactor antineutrino measurement at very short baselines
and calculates the sensitivity of various scenarios. We conclude that, given proper site optimization,
detector design, and background reduction, an experiment at a typical research reactor can provide 5�
discovery potential for the favored oscillation parameter space with 3 years of detector live time.
DOI: 10.1103/PhysRevD.87.073008 PACS numbers: 14.60.Pq
I. INTRODUCTION
Recent calculations of the predicted ��e flux from reac-tors [1] compared to past measurements at baselines be-tween 10 and 100 m have revealed a 7.2% deficit, an effectwith a significance of 3� confidence level [2]. This dis-crepancy, the reactor anomaly, can be interpreted as a signof new physics or point to an issue with the reactor fluxcalculations [3]. Independent calculations have verified thereactor ��e flux predictions [4], but subsequent calculationsbased on a full ab initio prediction using newly availablenuclear data [5] reduce the size of the discrepancy. It hasbeen suggested that the reactor anomaly may be the sig-nature of additional sterile neutrino states with mass split-tings of the order of �1 eV2 and oscillation lengths ofOð3 mÞ [6,7]. Other anomalies in neutrino physics includ-ing the observation of apparent �e and ��e appearance atsimilar mass-squared splittings in accelerator experiments[8–11], deficits in observed events from high-intensity �e
sources used to calibrate solar neutrino detectors [12,13],and the preference for more than three relativistic speciesin astrophysical surveys [14,15] add to the puzzle.
Additional data will soon be provided by the currentlyoperating kilometer-scale reactor experiments, Daya Bay,Double Chooz, and RENO [16–18]. While highly precise,these experiments cannot resolve the short oscillationlengths associated with eV2 mass splittings; at thesedistances and with a finite detector energy resolution, theoscillation effect from potential sterile states averages to
yield an effective rate deficit. Moreover, these measure-ments will eventually be limited by the understanding ofthe interference of multiple reactor cores, the presence ofoscillation effects from other mass-squared splittings, andthe inability to take background data free of reactor ��e.A new experiment at very short (<10 m) baselines with asingle core in a controlled research environment wherebackgrounds can be measured independently is needed tofully disentangle reactor flux and spectrum prediction un-certainties from sterile neutrino oscillation effects or othersigns of new physics.This paper explores some of the experimental require-
ments of a very-short-baseline experiment at reactors andthe related sensitivity to oscillation parameters. The paper isorganized as follows: Section II summarizes both the experi-mental detector and reactor parameters under consideration.Section III introduces the characteristic signature of neutrinooscillations and defines the �2 analysis used to calculateexperimental sensitivity. A nominal, generic reactor-detectorarrangement referred to as the ‘‘default experiment’’ is de-fined for systematic studies and comparison. Sections IV, V,VI, and VII present a discussion of reactor, facility, back-ground, and detector parameters and examine the impact onthe overall sensitivity of the experiment. Section VIII sum-marizes the sensitivity and discovery potential of a newreactor experiment and discusses its optimization.
II. EXPERIMENTAL PARAMETERS
A number of experiments have been proposed to addressthe reactor anomaly by making a precise measurementof the reactor flux and spectrum at very short baselines*[email protected]
PHYSICAL REVIEW D 87, 073008 (2013)
1550-7998=2013=87(7)=073008(18) 073008-1 � 2013 American Physical Society

[19–23]. The proposed experimental configurations are sitespecific and reflect the infrastructure and logistical con-straints at each site. This work studies generic experimen-tal parameters that determine the ultimate sensitivity of areactor experiment at very short baselines and helps guidethe optimization of a new experiment aimed at a definitivesterile neutrino oscillation search.
A. Reactor parameters
Antineutrinos from the reactor core are used as theflavor-pure ��e source. The relevant reactor core parametersare the following:
(I) Reactor power.—Each nuclear fission initiates therelease of a known amount of energy along withseveral antineutrinos. The reactor ��e flux is pro-portional to the thermal power output of thereactor modulo corrections for the isotopic fuelcomposition. High operating power combined withhigh reactor up time maximizes the event statistics.Most commercial reactors, but not all researchreactors, operate close to their licensed power.
(II) Fuel type.—Most nuclear reactors utilize uranium-based fuel containing a mixture of 238U and 235U,with the latter providing the majority of total fis-sions and thermal power. The two most commonclasses of reactor fuels, commercial and highlyenriched, differ primarily in their 235U fission frac-tions. Highly enriched uranium (HEU) fuel, com-monly utilized in research reactors, contains 90% ormore 235U, with fission fractions dominated by 235Uat all points in the fuel cycle. Commercial fuelgenerally contains less than 6% 235U. While 235Ufission comprises the majority of all fissions in thesecores, a significant fraction (30%–50%, dependingon the fuel burnup) is contributed by 238U and by239Pu and 241Pu accumulated during the fuel cycle[24]. These isotopes produce different proportionsof fission products, resulting ultimately in a differ-ence in the total number, energy spectrum, andspectral uncertainty of produced ��e.
(III) Duty cycle.—The duty cycle is given by the ratioof the power cycle to the subsequent shutdownperiods for refueling or maintenance. The dutycycle influences the statistical power of an experi-ment. Throughout this paper, we present resultsonly in terms of detector live time. Reactor downtime can be used for determining the energy spec-trum and position distribution of cosmogenic andsome reactor-related backgrounds [25–27].
(IV) Core dimensions.—Antineutrinos are producedthroughout the active reactor core and emittedisotropically. The core’s finite dimensions cause aspread in the neutrino path lengths between thereactor core and detector that washes out the ob-servable oscillation in the detector.
As examples, we use parameters from three researchreactors in the United States, the High Flux IsotopeReactor (HFIR) at Oak Ridge National Laboratory [28],the National Bureau of Standards Reactor at NationalInstitute of Standards and Technology (NIST) [29], andthe Advanced Test Reactor (ATR) at Idaho NationalLaboratory [30]. The Institut-Laue Langevin (ILL) reactorin France and the commercial San Onofre NuclearGenerating Station (SONGS) in California are includedfor reference [31,32].
B. Facility parameters
The reactor facility provides constraints on the locationof the detector, its size, and distance to the core. Thefollowing parameters determine an experiment’s designand sensitivity:(I) Experimental space and detector volume.—Detector
location, geometry, and dimensions are limited bythe available space near the reactor core. Typically,biological shielding limits the distance of closestapproach to the reactor, while the cross-sectionalarea of the detector and the maximum radial distanceare constrained by the layout of the reactor facility,floor-loading limits, and the availability of floorspace not occupied by other experiments, reactorequipment, or detector shielding. To maximize eventstatistics, a large cross-sectional area at close radialdistances is desirable.
(II) Detector distance to core.—The closest distance tothe reactor determines the overall ��e flux seen bythe detector as well as the oscillation wavelengthprobed. For the following discussion we define thisdistance of closest approach, rmin , to be from thecenter of the reactor core to the closest point in theactive detector target.
Throughout this discussion we explore a range ofdetector sizes and closest distances reflecting the expectedspace available at U.S. facilities.
C. Detector parameters
Intrinsic detector characteristics determine the observedevent distributions:(I) Fiducial volume and target mass.—The observed
number of ��e interactions in the detector scaleswith the number of target protons in the detectorand sets the statistical precision of the experiment.
(II) Detection efficiency.—The detection efficiency isdetermined by many factors, such as cosmic muonrates and veto window length, amount of nonscin-tillating material in the target volume, low-energyanalysis threshold, and spatial compactness andenergy of the delayed inverse beta signals in thedetector. Efficiency directly scales the detectednumber of events. For fixed signal-to-background(S/B), changes in the detection efficiency have the
HEEGER et al. PHYSICAL REVIEW D 87, 073008 (2013)
073008-2

same effect as increasing the detector volume ortarget mass.
(III) Position and energy resolution.—An unambiguousdemonstration of neutrino oscillation requires theobservation of oscillations in energy and distance,the characteristic L=E dependence. Good positionand energy resolution are necessary to maximizethe experimental sensitivity.
D. Backgrounds
A reactor experiment at very short baseline from areactor requires the operation of a detector on the surfaceunder minimal overburden. Muon and cosmic ray-inducedbackgrounds as well as backgrounds from the reactor arethus very important considerations. Cosmic backgroundsconsist of muons and their associated spallation products,as well as hadronic cosmic rays. Reactor-correlated back-grounds at such short baselines will be significant and willconsist of fast and thermal neutrons created in the fissionprocess, as well as high-energy gamma rays created byneutron activation of surrounding materials, such as cool-ing water, shielding, and metal infrastructure surroundingthe core. Small but irreducible backgrounds similar inenergy spectrum to the signal may also be providedby spent nuclear fuel nearby the reactor [33]. Both themagnitude and spectral characteristics of backgrounds areexpected to be highly site specific, depending on manyvariables such as experimental depth and surroundingbuilding structures, distance from the reactor, reactorpower, detector and reactor shielding, and proximity ofthe detector to reactor cooling and other infrastructure.
The effect of backgrounds on the sensitivity of a very-short-baseline (VSBL) experiment are investigated in thispaper by considering variations in key background metricsbased on current R&D efforts at VSBL reactor experiments[20] and experience from previous reactor experiments[27,31,34]. Detailed site-specific background studies atU.S. research reactors are currently underway and arethus not discussed in this paper. This paper can provideguidance to these R&D efforts by determining the back-ground requirements that must be achieved for a suffi-ciently sensitive experimental arrangement. These futureR&D efforts can then decide which techniques (i.e., somecombination reactor on-off background subtraction, activeshielding, segmentation, pulse shape discrimination, etc.)will be utilized to try to meet these requirements.
Specifically, this paper considers the following back-ground parameters:
(I) Signal-to-background ratio.—The overall S/B ratiois a measure of the total magnitude of time-coincident backgrounds and accidental backgroundin the delayed coincidence window of the inversebeta-decay reaction at all energies and positions. Thechoice of analysis low-energy threshold, which canbe raised or lowered in response to observed S/Brates at low energies, will also be investigated.
(II) Background spectral shape.—The backgrounds’ en-ergy dependence will determine the measured spec-tral shape of the observed events. Energy-dependentbackground subtraction and/or fitting will be im-portant for the analysis of the energy-dependentoscillation signature.
(III) Background position distribution.—In the vicinityof a reactor significant spatial variations ofbackgrounds are expected. In particular, fast neu-trons can scatter from surrounding materials,building structures, and even other experiments.Measurement of the observed event rate as a func-tion of position through detector movement orsegmentation will be critical for understandinglocal background variations on the meter scale.
III. EXPERIMENTAL SIGNATURE
A. Oscillations of reactor antineutrinos
Antineutrinos from reactors are produced as flavor-pure��e in the decays of neutron-rich fission products in thereactor fuel. More than 99.9% of all ��e emitted fromcommercial reactors are produced within the decay chainsof four isotopes: 235U, 238U, 239Pu, and 241Pu. The thermalheat released in the nuclear decays is proportional to thenumber of emitted ��e and is thus a measure of the flux ofexpected antineutrinos. The spectrum of reactor antineu-trinos detected via inverse beta decay has a mean energy ofabout 4 MeV and extends up to roughly 10 MeV.Neutrinos and antineutrinos are produced as a linear
combination of mass eigenstates and their flavor isassociated with the accompanying lepton. Due the differ-ence in the mass eigenstates the flavor of observedneutrinos oscillates as a function of baseline and energy.For the three active neutrino states the neutrino mixingparameters are well measured in atmospheric, solar, reac-tor, and accelerator based experiments. Reactor ��e disap-pearance over baselines of 1–2 km and�180 km has beenobserved [16–18,35]. The oscillation probability can beparametrized in terms of the mass splitting �m2
ij and the
mixing angle �ij between the ith and jth mass eigenstates.
Additional sterile neutrino mass states with �m2 � 1 eV2
beyond the three active neutrinos would yield an oscilla-tion effect over meter-long baselines with survival proba-bility described by
PsurðE; ~LÞ ’ 1� sin 22�eesin2
�1:27�m2
41j ~L� ~rjE
�(1)
with oscillation parameters �m241 and sin 22�ee.
Figure 1 illustrates the oscillation effect in baseline andenergy for (�m2 ¼ 1:8 eV2, sin 22�ee ¼ 0:5). The charac-teristic L=E oscillation is pictured in Fig. 2 for the sterileneutrino oscillation parameters (1:8 eV2, 0.1) preferred inglobal fits [6] and the default experimental arrangementdescribed below.
EXPERIMENTAL PARAMETERS FOR A REACTOR . . . PHYSICAL REVIEW D 87, 073008 (2013)
073008-3

B. A nominal reactor antineutrino experimentat very short baselines
Reactor neutrino experiments typically utilize the in-verse beta decay reaction ��e þ p ! eþ þ n with athreshold of �1:8 MeV to measure the flux and energyspectrum of reactor ��e. Liquid scintillating (LS) detec-tors provide a proton-rich target with high detectionefficiency and good energy resolution. Energy resolu-tions of around 8% and total detection efficiencies of75%–85% have been obtained in recent large-scaleunderground experiments [16,17]. For smaller detectorsdeveloped for early short-baseline ��e experiments andmore recent reactor monitoring purposes, energy reso-lutions of 10%–20% and efficiencies of 10%–50% have
been reported [27,36–38]. Rejection of backgrounds canbe achieved by the tried-and-true methods of time coin-cidence and rejection of muon-correlated triggers, aswell as by other previously demonstrated methods ofselection based on event topology and pulse shape dis-crimination. For the studies presented in this paper anominal experimental arrangement of a Oð1 m3Þ-sizeddetector at distances of Oð10 mÞ from an average re-search reactor is considered. The specific parametersutilized in this nominal arrangement are listed in Table I.
C. Experimental sensitivity and discovery potential
The sensitivity of a reactor experiment to neutrinooscillations is evaluated by comparing the detected energyspectrum to the expected one in the absence of neutrinooscillations. A radially extended detector with positionresolution allows a comparison as a function of baseline.A �2 test is used to test the hypothesis of no oscillation andfor parameter estimation in �m2
41 and sin 22�ee. Observed��e events are binned in energy E with index i and in
distance between the core and the point of detection, j ~Lj,along index j. The expected unoscillated number of eventsper bin, Tij, is given by
TðE; ~LÞ ¼ Np�
4�
Z �ðEÞSðEÞj ~L� ~rj2 d~r (2)
with Np as the number of target protons, the detection
efficiency �, energy E, point vector ~r between the core
center and ��e production point in the core, vector ~Lbetween the core center and ��e detection point in thedetector, ��e energy spectrum SðEÞ, and inverse beta crosssection �ðEÞ. Mij is the expected number Tij with back-
grounds added in the presence of sterile neutrino oscilla-tions as described by Eq. (1). Both Mij and Tij are subject
to Gaussian position and energy resolution smearing ac-cording to the values given in Table I. The �2 function isdefined as
Energy (MeV)12345678 B
asel
ine
(m)
3.54.0
4.55.0
5.56.0
6.57.0
7.5
Eve
nts,
Uno
scill
ated
/Bin
0.0
0.2
0.4
0.6
0.8
1.0
1.2
1.4
310×
Energy (MeV)12345678 B
asel
ine
(m)
3.54.0
4.55.0
5.56.0
6.57.0
7.5
Eve
nts,
Uno
scill
ated
0.0
0.2
0.4
0.6
0.8
1.0
1.2
1.4
310×
FIG. 1. Unoscillated (left) versus oscillated (right) detected ��e spectra at (�m2 ¼ 1:8 eV2, sin 22�ee ¼ 0:5) for a reactor ��e detector
with realistic parameters as described in Table I. Exaggerated oscillation values are chosen for illustrative purposes. The change inspectral shape from baseline to baseline is a key signature of neutrino oscillations.
Baseline/Energy (m/MeV)0.0 0.5 1.0 1.5 2.0 2.5 3.0
Osc
illat
ed/U
nosc
illat
ed
0.86
0.88
0.90
0.92
0.94
0.96
0.98
1.00
1.02
1 year live time
3 years live time
FIG. 2 (color online). Ratio of the oscillated to unoscillatedspectrum as a function of L=E for (�m2 ¼ 1:8 eV2, sin 22�ee ¼0:1) and the nominal experimental arrangement described inSec. III B. One year of live time provides 220 000 signal events.With the nominal 30% detection efficiency and example reactorup times provided by NIST, such statistics can be achieved inapproximately 1.5 years of calendar time. Error bars are purelystatistical.
HEEGER et al. PHYSICAL REVIEW D 87, 073008 (2013)
073008-4
�2 ¼ Xi;j
½Mij � ð�þ �ie þ �j
rÞTij � ð1þ �bÞBij�2Tij þ Bij þ ð�b2bBijÞ2
þ �2
�2þX
j
��jr
�r
�2 þX
i
��ie
�ie
�2 þ �2
b
�2b
: (3)
The �2 sums over 14 prompt energy and 15 position binsin the range of [2.0,7.6] MeV and [4.0, 7.0] m, with binwidths of 0.4 MeVand 0.2 m, respectively. The bin widthsare comparable to their respective modeled detector reso-
lutions (10%=ffiffiffiffiE
p, 0.15 m). Events smeared outside the
detector volume are included in the nearest in-detectorbin. The sum is minimized with respect to �ee, �m
241 and
to the nuisance parameters f�;�jr; �i
e; �bg, as described inRef. [45]. The parameter � allows the signal normalizationto vary within the bounds of its associated uncertainty � toaccount for uncertainties in the absolute reactor ��e nor-malization and absolute detection efficiency. The 100%error in � ensures a floating overall normalization. Thischoice of floating overall normalization is made to excludefrom the calculated sensitivities contributions from abso-lute rate deficits, which form the basis of the currentambiguous reactor anomaly signature.
The parameters �ie account for the uncertainty in the
reactor ��e spectrum from reactor flux predictions and fromprevious experimental measurements, as well as detectorsystematics that are not correlated between energy bins.These parameters allow position bins at one energy tofluctuate together, independently of position bins at anyother energy. These fluctuations, correlated in position butuncorrelated in energy, are limited by �i
e, which vary as afunction of energy as described in Ref. [4]. The energy-uncorrelated �i
e are mainly determined by the statisticaluncertainty of previous measurements of fission fractionbeta spectra. Energy-correlated contributions to the energyspectrum uncertainties also described in this paper are not
included in the �ie. Modeling of these uncorrelated errors
in energy is of particular importance, as they limit thepower of a pure energy-based oscillation analysis. Thiswill be discussed further in Sec. VIII B.
The position spectrum parameters �jr allow correlated
fluctuations with position, rather than energy, in order toincorporate the effects of relative efficiency differencesand uncertainties between position bins. In contrast to theenergy spectrum uncertainties, relative efficiency uncer-tainties between position bins, given a value�r ¼ 0:5% forall bins, should be smaller, as they are easier to characterizevia detector simulation and calibration.Backgrounds Bij are estimated with flat position depen-
dence and a two-component energy spectrum. The firstcomponent falls with energy as 1=E2, generally mirroringthe contribution of low-energy accidental coincidencesreported by previous short-baseline experiments[27,31,34,42]. The second component, of equal integratedmagnitude in the energy range of the analysis, is flat andextends to higher energy, reflecting the energy signatureof fast reactor and cosmic-induced neutrons of widelyvarying energy. Further detail about the high-energy back-ground shape, such as the exact energy spectrum of protonrecoils from fast neutrons, or possible peaks from reactor-induced high-energy gammas, will be highly site depen-dent. For this reason, these details are not included in thenominal background description. The normalization of thistwo-component background is allowed to fluctuate simi-larly to the signal normalization by incorporating the back-ground nuisance parameter �b, with an associatedsystematic uncertainty of �b ¼ 10%.In order to resolve spectral distortions in the energy and
position distribution of signal events, it will be necessary tocharacterize the uncorrelated uncertainties in the back-ground energy and position spectrum. Background positionand energy spectrum uncertainties are not likely to bedecoupled, as is the case for the signal position and energy
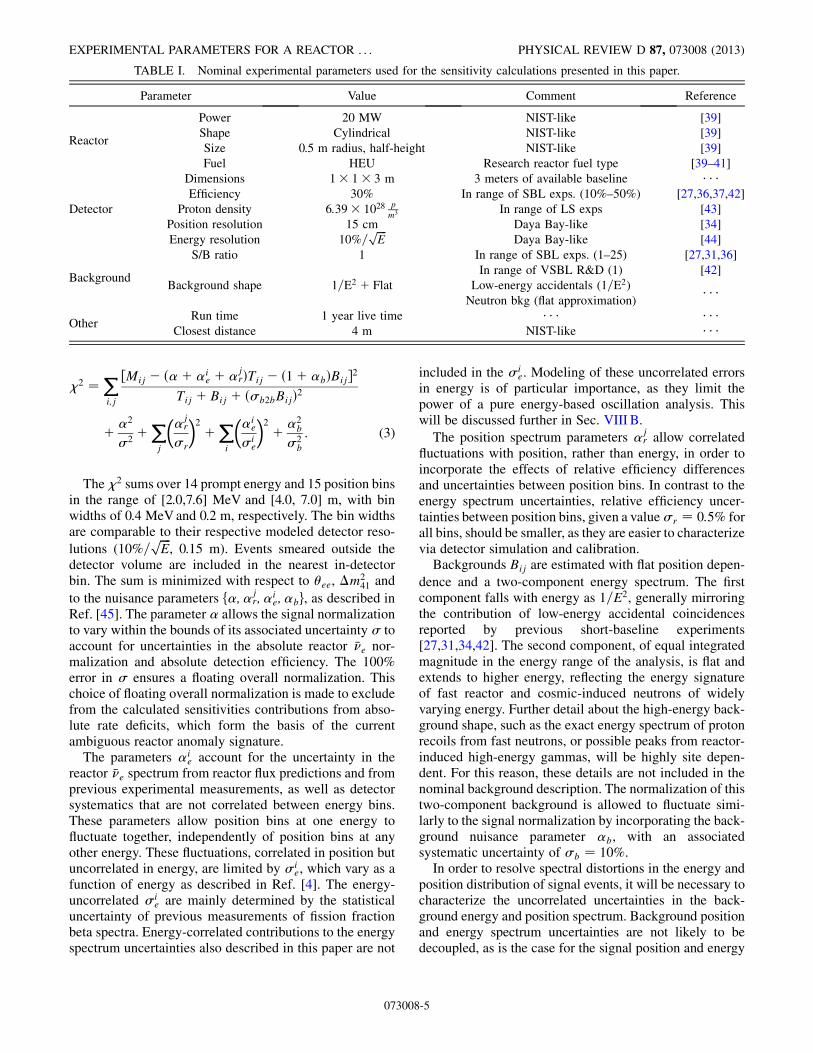
TABLE I. Nominal experimental parameters used for the sensitivity calculations presented in this paper.
Parameter Value Comment Reference
Reactor
Power 20 MW NIST-like [39]
Shape Cylindrical NIST-like [39]
Size 0.5 m radius, half-height NIST-like [39]
Fuel HEU Research reactor fuel type [39–41]
Detector
Dimensions 1� 1� 3 m 3 meters of available baseline � � �Efficiency 30% In range of SBL exps. (10%–50%) [27,36,37,42]
Proton density 6:39� 1028 pm3 In range of LS exps [43]
Position resolution 15 cm Daya Bay-like [34]
Energy resolution 10%=ffiffiffiffiE
pDaya Bay-like [44]
Background
S/B ratio 1 In range of SBL exps. (1–25) [27,31,36]
In range of VSBL R&D (1) [42]
Background shape 1=E2 þ Flat Low-energy accidentals (1=E2) � � �Neutron bkg (flat approximation)
OtherRun time 1 year live time � � � � � �
Closest distance 4 m NIST-like � � �
EXPERIMENTAL PARAMETERS FOR A REACTOR . . . PHYSICAL REVIEW D 87, 073008 (2013)
073008-5

spectrum uncertainties. For example, the signal energyspectrum in the absence of oscillations is the same for everyposition bin, while the background energy spectrum mayvary in normalization and shape from position to position,depending on many variables, such as variations in fastneutron fluxes or effective passive shielding with position.Without the specifics of these correlations, the most con-servative way to incorporate these background uncertaintiesinto the �2 analysis is to provide an additional independentnuisance parameter for every bin with an associated uncer-tainty �b2b that reflects the precision of any backgroundspectral measurements. Conservative consideration of theseuncertainties can be more simply achieved by adding the
effect of �b2b to the denominator of the �2. For this study,�b2b is given a default value of 0.5%.It should also be noted that no assumptions about spe-
cific background subtraction or reduction techniques areincluded in these sensitivity calculations. The backgroundshape and uncertainties are included in the �2 as describedabove, and the derived sensitivities represent the experi-ment’s scientific reach under the stated assumptions.Future R&D efforts will study the distribution and magni-tude of site-specific backgrounds and develop techniquesto mitigate and reduce their impact on a VSBL experiment.For the nominal experimental arrangement described in
Table I as well as for the varied cases to follow, 3� and 5�discovery potentials for neutrino oscillations are calculatedfollowing the prescription in Ref. [45]. Example discoverycontours from the nominal experimental setup are shown inFig. 3. The nominal arrangement considered in Table I iscapable of excluding a large fraction of the currentlypreferred parameter space to better than 3� with 1 yearof live time and at 5� C.L. with 3 years of data taking.Sections IV, V, and VII, investigate the impact of thereactor, facility, and detector parameters on the sensitivityof the experiment. The experimental parameters listed inTable I will be used throughout this paper as the nominalexperimental arrangement.
IV. REACTOR PARAMETERS
A. Reactor power and operations
The flux of ��e emitted from reactors is directly related toits thermal power. The total nominal power capacities forseveral research and commercial reactor sites are shown inFig. 4. At 3 GWth, typical commercial power stations suchas SONGS [46,47] are about an order of magnitude morepowerful than research reactors. Research reactors in theU.S. have a wide range of thermal powers up to a maxi-mum of 250 MW at the Advanced Test Reactor [41]. The
eeθ22sin
-210 -110 1
]2 [
eV142
m∆
-110
1
Default, 1 Year, 3σ C.L.
Default, 3 Years, 5σ C.L.
Reactor Anomaly, 95% C.L.
Reactor Anomaly, 90% C.L.
Global 3+1 Fit, 95% C.L.
FIG. 3 (color online). Sterile neutrino oscillation discoverypotential at 3� and 5� for the nominal experimental arrange-ment described in Table I. The 3� contour corresponds to oneyear of detector live time while the 5� contour is shown for threeyears of detector live time. Also pictured are the best-fit parame-ter spaces for the reactor antineutrino anomaly [6] and for the3þ 1 global fit to all relevant accelerator, source, and reactordata given in Ref. [7].
FIG. 4 (color online). Left: Comparison of nominal and operational thermal power output for selected reactor facilities. The nominallicensed power output (dashed line) is roughly equal to the operational power (solid line) for all facilities except the Advanced TestReactor. Right: Sensitivity of the nominal experimental configuration for various power levels and 1 year of detector live time.
HEEGER et al. PHYSICAL REVIEW D 87, 073008 (2013)
073008-6

variation of the experimental sensitivity of the baselineexperimental configuration with the power of several re-search reactors (or ��e flux) is shown in Fig. 4. The increasein event statistics with thermal power uniformly increasesan experiment’s sensitivity for all values of �m2.
Nuclear reactors are periodically shut down for refuelingand maintenance. As a result, the time-averaged thermaloutput of a nuclear reactor will be less than its maximumthermal output over that time period because of periods ofbelow-capacity operation and reactor-off periods. For ex-ample, at ATR the standard operating thermal output of110 MW is significantly below its maximum licensedthermal output of 250MW. See Fig. 4. All nuclear facilitiesundergo reactor-off periods in which reactor refueling andmaintenance takes place. Table II summarizes the lengthand frequency of reactor-off periods at several reactorfacilities as well as their reactor-on and -off time.
Reactor-off time and operation at reduced power directlyreduce the total annual ��e event statistics yielding the samenet effect as a lower thermal power capacity. Sensitivityto sterile oscillations decreases with lower power as illus-trated in Fig. 4. However, reactor-off time provides anopportunity to measure the rate and energy distributionof backgrounds. A detailed understanding of the spatialand energy distribution of backgrounds is critical for aprecision experiment at short distances from the reactor.This topic will be discussed in greater detail in Sec. VI. Theoptimum ratio of background measurement time relativeto ��e signal time will depend on the total signal statistics,the dominant uncertainties, as well as the signal-to-background ratio. This optimization should be carried outas part of a detailed design process for a VSBL experiment.For the research reactors in Table II the ��e signal time willbe between 50% and 73% of calendar time.
B. Reactor fuel
Commercial nuclear power stations use conventionalnuclear fuel comprised of a mixture of U and Pu isotopeswhile some research facilities operate with HEU. Thedecay chains of the four isotopes 235U, 238U, 239Pu, and241Pu produce >99:9% of all ��e produced in a reactor. InHEU cores nearly all fissions are accounted for by 235U.
Table III gives the main fission isotopes in the two reactorfuels and their relative contributions to the total fission rate.The ��e spectrum and rate per fission is different for each
of these isotopes [50] and the flux and spectrum of reactor��e are the sum for all isotopes in the reactor core. The time-averaged detected ��e spectra from HEU and conventionalfuels are compared in Fig. 5. The integrated flux differs byroughly 8%, and the time-averaged spectral differences are10% or less. In addition, the time evolution of the isotopicfuel composition creates a time-dependent spectral shape.For the spectral range shown in Fig. 5 the typical fissionfractions for the average fuel were evaluated and comparedto the upper and lower fractions at the beginning and end offuel cycle [24]. Using the spectral shapes from Ref. [50]together with the isotope fraction, the combined spectrumcan be calculated. When convoluted with the standardinverse beta cross section, we obtain the detected ��e spec-trum. The differences in the energy spectrum only have asmall impact on sensitivity to short-baseline neutrino os-cillation as shown in Fig. 6.In addition to differences in the integrated flux and
spectral shape, the uncertainties spectral shape varybetween the dominate fission isotopes. These arisefrom a combination of the statistical and measurementuncertainties of fission isotope beta spectra [31] anduncertainties in the conversion of electron spectra tocorresponding ��e spectra [4,51,52]. Spectral uncertain-ties for 235U range from 1.8% to 3.2% in the range from2 to 6 MeV, while for 239Pu they increase to 1.9%–5.7%and 2.5%–5.0% for 241Pu [53]. Because of these consid-erations, spectral uncertainties will be lower for HEU
TABLE II. Summary of reactor powers, accessible baselines, fuel cycles, and reactor-off times at various reactor facilities. At ATR,detector access is limited for baselines<12 m. SONGS data are from past operation; this facility is currently shut down. The estimateddown-time fraction includes estimates of occasional longer seasonal shutdowns and maintenance periods based on communicationwith the respective reactor facilities.
Reactor Power (MWth) Baselines (m) Reactor on (days) Reactor off (days) Down time Reference
NIST 20 4–20 42 10 �32% [39]
HFIR 85 6–8 24 18 �50% [40]
ATR250 (licensed) 7–8 (restricted)
48–56 14–21 �27% [41]110 (operational) 12–20 (full access)
ILL 58 7–9 50 41 �45% [48]
SONGS 3438 24 639 60 8.6% [46,47]
TABLE III. Approximate time-averaged fuel compositions forvarious reactor cores. Fractions for conventional [24] and HEUreactors [49], respectively.
Fuel isotope
Time-averaged fission fraction
Conventional fuel HEU fuel
235U 0.59 >0:99238U 0.07 <0:01239Pu 0.29 <0:01241Pu 0.05 <0:01
EXPERIMENTAL PARAMETERS FOR A REACTOR . . . PHYSICAL REVIEW D 87, 073008 (2013)
073008-7

fuel than for conventional fuel. The change in sensitivityresulting from this difference in spectral uncertainty forthe two fuel types is shown in Fig. 6. HEU fuel providesa minor improvement in sensitivity as a result of thelowered spectral uncertainties. The benefits of lowerspectral uncertainties will be amplified in the case ofdetectors with limited baseline ranges or position reso-lution, as will be discussed in Sec. VIII B.
C. Reactor core size and dimensions
Reactor cores come in a wide variety of shapes and sizes.The ��e production in a reactor follows closely the distri-bution of the fuel assemblies. For the purpose of a neutrinooscillation experiment at very short baselines the maindifference between commercial power reactors and re-search reactors is in their size. Conventional pressurizedwater power reactors are typically 3–4 m in height and
diameter, while research reactors tend to be smaller in sizewith dimensions as compact as �0:5 m or less. Figure 7provides an illustration of the variety of shapes and sizes ofvarious research and conventional reactor cores.For neutrino oscillation searches it is required that the
size of the reactor core and thus the spread in neutrino pathlengths to be less than the oscillation wavelength to avoid awashout of the oscillation signal. Figure 7 shows the spreadin path lengths between the finite-sized reactor cores and apointlike detector horizontally displaced from the verticalmidpoint of each reactor at a distance of r ¼ 10 m. Thedistance r is defined between the geometric center of thecore and the pointlike detector. A distance of Oð10 mÞrepresents a typical distance for a very-short-baseline re-actor experiment. We assume that neutrinos are producedand emitted uniformly throughout the core region. Wedefine the path length l as the distance between the pointsof ��e production and observation. Convolving the pathlength distribution with 1=R2 determines the expectedspatial distribution for the relative probability of ��e inter-actions in the detector. We note that a detector with finiteposition resolution or segmentation adds additional smear-ing to the observed path length distribution and the ob-served oscillation effect.For finite-sized reactor cores of any geometry we can
calculate the average path length �l and the rms of the pathlengths as
�l ¼ 1
volume
Zvol
ffiffiffiffiffiffiffiffiffiffiffiffiffiffiffiffiffiffiffiffiffiffiffiffiffiffiffix2 þ y2 þ z2
qdxdydz and (4)
lrms ¼ffiffiffiffiffiffiffiffiffiffiffiffiffiffiffiffiffiffiffiffiffiffiffiffiffiffiffiffiffiffiffiffiffiffiffiffiffiffiffiffiffiffiffiffiffiffiffiffiffiffiffiffiffiffiffiffiffiffiffiffiffiffiffiffiffiffiffiffiffiffiffiffiffiffiffiffiffiffiffiffiffi
1
volume
Zvol
ffiffiffiffiffiffiffiffiffiffiffiffiffiffiffiffiffiffiffiffiffiffiffiffiffiffiffiffiffiffiffiffiffiffiffiffiffix2 þ y2 þ z2 � �l2
qdxdydz
s: (5)
Figure 8 shows the average neutrino path length spreadfor different core geometries as a function of distance fromthe reactor. At d > 5 m the rms spread in path lengths
Neutrino Energy (MeV)2 3 4 5 6 7 8 9
Rel
ativ
e In
t. R
ate
(au)
0.020.040.060.080.100.120.140.160.180.20 HEU Fuel
Conv FuelConv Fuel Cycle Range
Neutrino Energy (MeV)2 3 4 5 6 7 8 9 10
Frac
tiona
l Dif
fere
nce
-0.05
0.00
0.05
0.10
0.15
0.20
Neutrino Energy (MeV)2 3 4 5 6 7 8 9 10
Frac
tiona
l Cha
nge
Ove
r Fu
el C
ycle
-0.05
0.00
0.05
0.10
0.15
0.20
HEU Fuel
Conv Fuel
FIG. 5 (color online). Left: Detected reactor ��e spectra from conventional commercial and HEU fuel (top panel), and their spectraldifferences (bottom panel). The band indicates the change in the spectral shape over one fuel cycle. Right: Fractional change inspectrum over one fuel cycle for conventional and HEU reactors.
eeθ22sin
-210 -110 1
]2 [
eV142
m∆
-110
1
HEU Fuel, 3σ C.L.
Conventional Fuel, 3σ C.L.
Reactor Anomaly, 95% C.L.Reactor Anomaly, 90% C.L.
Global 3+1 Fit, 95% C.L.
FIG. 6 (color online). Sensitivities of the nominal reactorexperiment for conventional and HEU fuel reactor cores. Theuse of HEU fuel leads to minor improvements in the overallsensitivity.
HEEGER et al. PHYSICAL REVIEW D 87, 073008 (2013)
073008-8

FIG. 7 (color online). Left: Approximate size and shape of fuel distribution in five reactors including the U.S. research reactors ATR,NIST, and HFIR. SONGS is a conventional power reactor, for comparison. Right: Relative event probability versus neutrino pathlengths for several finite-sized reactor cores and a pointlike detector horizontally displaced from the vertical midpoint of each reactor ata distance of r ¼ 10 m.
yz
x
y z
y x
Reactor-Detector Distance
3D Core
Vertical corecross section
Horizontal corecross section
FIG. 8 (color online). Left: Geometries, cross sections, and path lengths for a cylindrical reactor core and pointlike detector.Right: Corresponding path length spreads for a 1-m cylindrical core. The differences in path length spreads contributed by the circularhorizontal dimensions and the rectangular vertical dimensions of the core are a small correction on top of the overall magnitude of thespread, which is defined by the overall core size.
FIG. 9 (color online). Variations in the discovery potential of the nominal reactor experiment with a half-height core of various radii(left) and core geometries (right). The overall spread in neutrino path lengths is dominated by the overall dimensions of the core.
EXPERIMENTAL PARAMETERS FOR A REACTOR . . . PHYSICAL REVIEW D 87, 073008 (2013)
073008-9
approaches �0:5–0:6 m for a reactor of 1 m height anddiameter. The variation due to the core shape is significantlysmaller than the total magnitude of spread. For all practicalconsiderations and for realistic distances of d > 4 m fromthe reactor the shape of the core and fuel distribution is onlyof secondary consideration. For highly asymmetric coressuch as long, cylindrical arrangements choosing the orien-tation of the detector with respect to the symmetry axis ofthe core can be used to reduce the spread in neutrino pathlengths. Figure 9 shows the discovery potential of thenominal reactor experiment for varying dimensions of thereactor core. The sensitivity to higher �m2 values is lost asthe core width is increased. The overall core dimensionsdominate the spread in neutrino path lengths while the coreshape only plays a secondary role.
V. FACILITY PARAMETERS
A. Experimental area and detector volume
A key signature of neutrino oscillation is the distortionof the measured spectrum with energy and the variation ofthe energy spectrum with baseline. The baseline depen-dence of the energy spectrum can only be observed in adetector whose active length comprises more than a smallportion of one oscillation period. Ideally, one would mapout the oscillation over an entire wavelength or more. Theavailability of experimental space in a reactor facilitylimits the accessible baselines as well as the total activedetector volume. The accessible baselines listed in Table IIprovide a distance range of up to 9 m at one particularfacility. This allows the placement of several small detec-tors in various locations, or the construction of an extendeddetector in the radial direction. For any significantly ex-tended detector the change in event rate due to the 1=R2
law has to be taken into account.
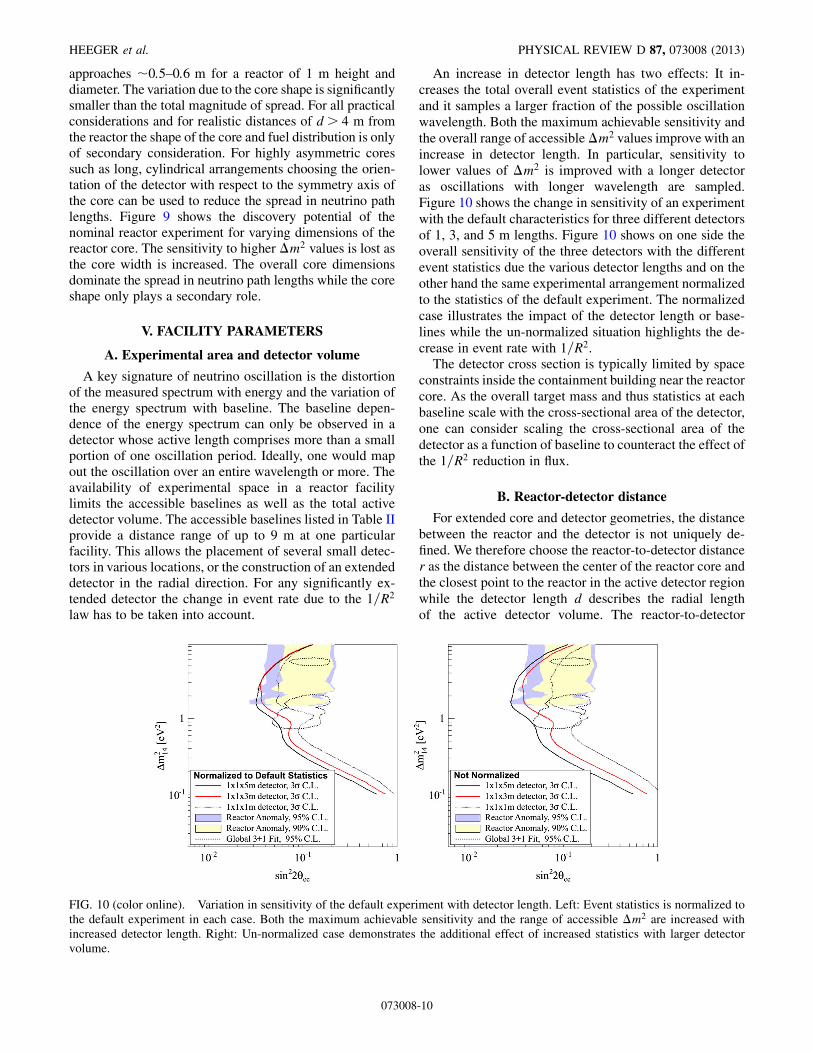
An increase in detector length has two effects: It in-creases the total overall event statistics of the experimentand it samples a larger fraction of the possible oscillationwavelength. Both the maximum achievable sensitivity andthe overall range of accessible�m2 values improve with anincrease in detector length. In particular, sensitivity tolower values of �m2 is improved with a longer detectoras oscillations with longer wavelength are sampled.Figure 10 shows the change in sensitivity of an experimentwith the default characteristics for three different detectorsof 1, 3, and 5 m lengths. Figure 10 shows on one side theoverall sensitivity of the three detectors with the differentevent statistics due the various detector lengths and on theother hand the same experimental arrangement normalizedto the statistics of the default experiment. The normalizedcase illustrates the impact of the detector length or base-lines while the un-normalized situation highlights the de-crease in event rate with 1=R2.The detector cross section is typically limited by space
constraints inside the containment building near the reactorcore. As the overall target mass and thus statistics at eachbaseline scale with the cross-sectional area of the detector,one can consider scaling the cross-sectional area of thedetector as a function of baseline to counteract the effect ofthe 1=R2 reduction in flux.
B. Reactor-detector distance
For extended core and detector geometries, the distancebetween the reactor and the detector is not uniquely de-fined. We therefore choose the reactor-to-detector distancer as the distance between the center of the reactor core andthe closest point to the reactor in the active detector regionwhile the detector length d describes the radial lengthof the active detector volume. The reactor-to-detector
FIG. 10 (color online). Variation in sensitivity of the default experiment with detector length. Left: Event statistics is normalized tothe default experiment in each case. Both the maximum achievable sensitivity and the range of accessible �m2 are increased withincreased detector length. Right: Un-normalized case demonstrates the additional effect of increased statistics with larger detectorvolume.
HEEGER et al. PHYSICAL REVIEW D 87, 073008 (2013)
073008-10
distance r, at a minimum, is comprised of the extent of thereactor itself and the thickness of the containment andshielding structures surrounding the core. In practicesome passive shielding will be required to operate a ��e
detector in the vicinity of a reactor. The accessible base-lines for various reactor facilities listed in Table II take0.5 m additional space into consideration for this purpose.The closest accessible baseline is site specific and referredto as rmin . As is shown in Table II, research reactorsprovide an opportunity for improved measurements ofthe reactor ��e flux and spectrum at the shortest baselinesto date. Facilities such as NIST may provide access tobaselines as short as 4 m or less.
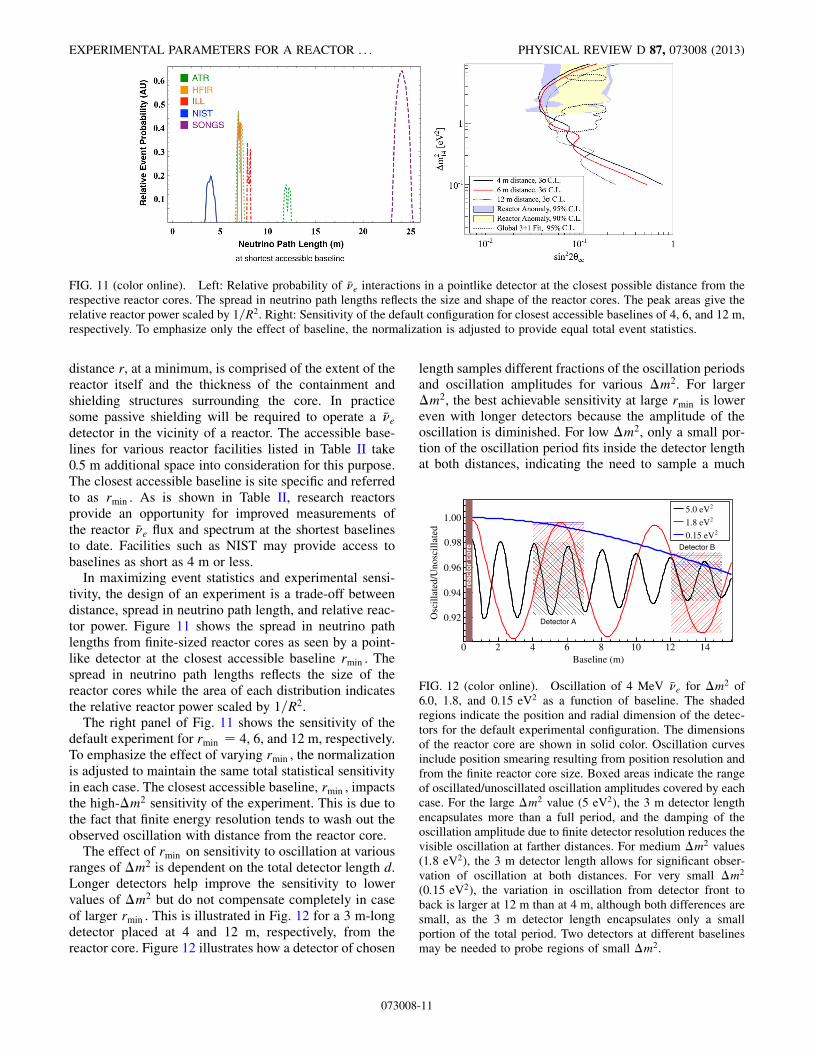
In maximizing event statistics and experimental sensi-tivity, the design of an experiment is a trade-off betweendistance, spread in neutrino path length, and relative reac-tor power. Figure 11 shows the spread in neutrino pathlengths from finite-sized reactor cores as seen by a point-like detector at the closest accessible baseline rmin . Thespread in neutrino path lengths reflects the size of thereactor cores while the area of each distribution indicatesthe relative reactor power scaled by 1=R2.
The right panel of Fig. 11 shows the sensitivity of thedefault experiment for rmin ¼ 4, 6, and 12 m, respectively.To emphasize the effect of varying rmin , the normalizationis adjusted to maintain the same total statistical sensitivityin each case. The closest accessible baseline, rmin , impactsthe high-�m2 sensitivity of the experiment. This is due tothe fact that finite energy resolution tends to wash out theobserved oscillation with distance from the reactor core.
The effect of rmin on sensitivity to oscillation at variousranges of �m2 is dependent on the total detector length d.Longer detectors help improve the sensitivity to lowervalues of �m2 but do not compensate completely in caseof larger rmin . This is illustrated in Fig. 12 for a 3 m-longdetector placed at 4 and 12 m, respectively, from thereactor core. Figure 12 illustrates how a detector of chosen
length samples different fractions of the oscillation periodsand oscillation amplitudes for various �m2. For larger�m2, the best achievable sensitivity at large rmin is lowereven with longer detectors because the amplitude of theoscillation is diminished. For low �m2, only a small por-tion of the oscillation period fits inside the detector lengthat both distances, indicating the need to sample a much
FIG. 11 (color online). Left: Relative probability of ��e interactions in a pointlike detector at the closest possible distance from therespective reactor cores. The spread in neutrino path lengths reflects the size and shape of the reactor cores. The peak areas give therelative reactor power scaled by 1=R2. Right: Sensitivity of the default configuration for closest accessible baselines of 4, 6, and 12 m,respectively. To emphasize only the effect of baseline, the normalization is adjusted to provide equal total event statistics.
Baseline (m)0 2 4 6 8 10 12 14
Osc
illat
ed/U
nosc
illat
ed
0.92
0.94
0.96
0.98
1.0025.0 eV21.8 eV
20.15 eV
reac
tor
core
Detector A
Detector B
FIG. 12 (color online). Oscillation of 4 MeV ��e for �m2 of6.0, 1.8, and 0:15 eV2 as a function of baseline. The shadedregions indicate the position and radial dimension of the detec-tors for the default experimental configuration. The dimensionsof the reactor core are shown in solid color. Oscillation curvesinclude position smearing resulting from position resolution andfrom the finite reactor core size. Boxed areas indicate the rangeof oscillated/unoscillated oscillation amplitudes covered by eachcase. For the large �m2 value (5 eV2), the 3 m detector lengthencapsulates more than a full period, and the damping of theoscillation amplitude due to finite detector resolution reduces thevisible oscillation at farther distances. For medium �m2 values(1:8 eV2), the 3 m detector length allows for significant obser-vation of oscillation at both distances. For very small �m2
(0:15 eV2), the variation in oscillation from detector front toback is larger at 12 m than at 4 m, although both differences aresmall, as the 3 m detector length encapsulates only a smallportion of the total period. Two detectors at different baselinesmay be needed to probe regions of small �m2.
EXPERIMENTAL PARAMETERS FOR A REACTOR . . . PHYSICAL REVIEW D 87, 073008 (2013)
073008-11

longer range of baselines. For the favored mass splittingthe oscillation period is sampled well at both chosenbaselines.
If the oscillation length were known a priori, a detectorof suitable length could be placed between the first oscil-lation minimum and subsequent maximum to maximizethe observed oscillation difference or around the oscilla-tion minimum to observe the turning point. Ideally, such adetector would be movable to measure both the differencebetween the oscillation maximum and minimum and theturning point around one of the oscillation extreme. Amovable, extended detector can also help mitigate possiblebackgrounds or systematic effects that can mimic thisoscillatory signature. In the case of longer wavelengthsand given the facility constraints at research reactors,multiple, radially extended detectors may be necessary toallow for a comprehensive search for and discovery ofneutrino oscillations with unknown �m2.
VI. BACKGROUNDS
The overall magnitude and spectral shape of back-grounds in a short-baseline reactor neutrino experimentare determined in large part by the detector’s surroundings,including overburden, the distance to the core, neutronbackgrounds from the reactor and nearby experiments,cosmic ray induced backgrounds, and nearby spent fuelrepositories. The cleanliness of the detector componentsdetermines the magnitude of low-energy backgrounds.
The contribution of each of the various backgroundtypes can be significantly reduced by implementing awide array of background reduction techniques. The useof passive shielding can reduce the number of gamma andneutron backgrounds incident on the detector target byorders of magnitude. Detector optical segmentation affordsthe ability to distinguish signal events based on their spatialdistribution, which will be significantly different than that
of many types of backgrounds, particularly accidentals[31,36,54,55]. The use of scintillator with pulse-shapediscrimination abilities will also increase the ability todistinguish the prompt positron of an inverse beta interac-tion with the prompt proton recoil of a fast neutron inter-action. The use of doped liquid scintillators using Li or Gdcan also reduce inverse beta time coincidence, leading tohigher muon veto efficiencies and lower accidental back-ground rates. Suitable pulse-shape discrimination anddoped liquid scintillators have been utilized in previousexperiments (for example, Ref. [36]) and are a subject ofsignificant current R&D efforts [26,56–59].Clearly, the exact shape and magnitude of backgrounds
and signal efficiency from background reduction cuts in aprospective VSBL experiment vary widely and can beprecisely known only by conducting site-specific back-ground surveys, detector material surveys, and detectordesign and simulation studies. This paper seeks to provideguidance to this R&D process by varying key backgroundmetrics to determine the necessary background reductionrequirements of a sufficiently sensitive VSBL sterile oscil-lation experiment.To determine the background rates necessary for a
highly sensitive VSBL oscillation experiment, the sensi-tivity of the default experiment to varying backgroundconditions was investigated by varying the magnitudeand shape of the input background spectrum in the �2
calculation. Signal-to-background ratios of 0.1, 1.0, and10 were considered. Changes in sensitivity resulting fromvariation of S/B ratio of the default experiment can be seenin Fig. 13. The overall background rate clearly has asignificant impact on experimental sensitivity at all valuesof �m2. If sensitivity to the full range of suggested sterileoscillation parameter space is desired, S/B ratios of 1 orbetter are likely necessary.In order to achieve these signal-to-background goals,
particularly in the case of high accidental backgrounds, it
FIG. 13 (color online). Variation in sensitivity of the default experiment with overall signal-to-background (left), low-energythreshold (right) and spectral shape (bottom). The default parameters used throughout the paper are a S/B ratio of 1:1 with a 2.0 MeVenergy threshold and a 1=E2 þ flat spectral shape. Backgrounds will clearly play a critical role in the experimental sensitivity at abroad range of �m2 values.
HEEGER et al. PHYSICAL REVIEW D 87, 073008 (2013)
073008-12
may be necessary to adjust the prompt energy cut thresh-old. Figure 13 also shows sensitivity for the defaultarrangement assuming a S/B of 1 for various promptenergy cut thresholds from 0.8 to 3.2 MeV. The higherthreshold clearly excludes the low-energy portion of signalevents, leading to lower sensitivity particularly at lower�m2 values.
As defined in the �2 given in Eq. (3), backgroundsare assigned a nuisance parameter that accounts for theuncertainty in the overall background normalization. Widevariation of this parameter’s associated systematic uncer-tainty has negligible effect on the sensitivity of the defaultexperiment.
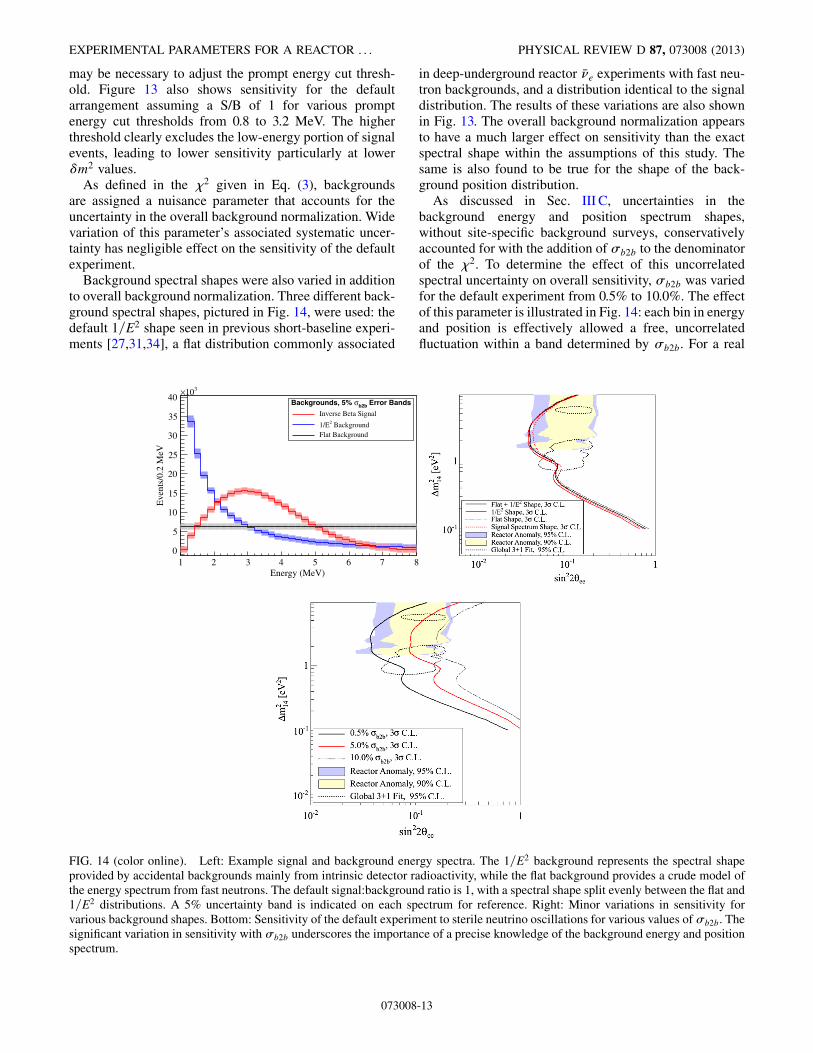
Background spectral shapes were also varied in additionto overall background normalization. Three different back-ground spectral shapes, pictured in Fig. 14, were used: thedefault 1=E2 shape seen in previous short-baseline experi-ments [27,31,34], a flat distribution commonly associated
in deep-underground reactor ��e experiments with fast neu-tron backgrounds, and a distribution identical to the signaldistribution. The results of these variations are also shownin Fig. 13. The overall background normalization appearsto have a much larger effect on sensitivity than the exactspectral shape within the assumptions of this study. Thesame is also found to be true for the shape of the back-ground position distribution.As discussed in Sec. III C, uncertainties in the
background energy and position spectrum shapes,without site-specific background surveys, conservativelyaccounted for with the addition of �b2b to the denominatorof the �2. To determine the effect of this uncorrelatedspectral uncertainty on overall sensitivity, �b2b was variedfor the default experiment from 0.5% to 10.0%. The effectof this parameter is illustrated in Fig. 14: each bin in energyand position is effectively allowed a free, uncorrelatedfluctuation within a band determined by �b2b. For a real
Energy (MeV)1 2 3 4 5 6 7 8
Eve
nts/
0.2
MeV
0
5
10
15
20
25
30
35
40310×
Error Bandsb2bσBackgrounds, 5%
Inverse Beta Signal
Background21/EFlat Background
FIG. 14 (color online). Left: Example signal and background energy spectra. The 1=E2 background represents the spectral shapeprovided by accidental backgrounds mainly from intrinsic detector radioactivity, while the flat background provides a crude model ofthe energy spectrum from fast neutrons. The default signal:background ratio is 1, with a spectral shape split evenly between the flat and1=E2 distributions. A 5% uncertainty band is indicated on each spectrum for reference. Right: Minor variations in sensitivity forvarious background shapes. Bottom: Sensitivity of the default experiment to sterile neutrino oscillations for various values of �b2b. Thesignificant variation in sensitivity with �b2b underscores the importance of a precise knowledge of the background energy and positionspectrum.
EXPERIMENTAL PARAMETERS FOR A REACTOR . . . PHYSICAL REVIEW D 87, 073008 (2013)
073008-13

experiment, the magnitude of �b2b will be determined bymeasurements of background spectra during reactor-offperiods, as well as measurements of low- and high-energysingles during reactor-on periods. Shifting the detectorradially may also help map out and constrain the spatialvariation of the backgrounds. The resultant change insensitivity of the default experiment with variations in�b2b are also shown in Fig. 14. Sensitivity to oscillationis highly dependent on �b2b for all values of �m
2. Preciseknowledge of the background spectral shapes is clearlynecessary for a definitive short-baseline oscillationexperiment.
VII. DETECTOR PARAMETERS
A. Target mass and efficiency
The total neutrino interaction rate scales proportionallywith target mass and detection efficiency. Variations oftarget mass and efficiency have an identical effect on thesensitivity as variations in reactor power. Thus, the effectof variations in efficiency can be interpreted from Fig. 4.The target mass can be increased by increasing the crosssection of the detector, which is largely constrained by theavailable facility space, or by increasing the proton densityof the target.
The main contributors to lowered detection efficiencycan be addressed with the application of appropriate de-tection techniques:
(i) Muon and singles dead times.—Muon veto effi-ciency is determined by the total detector muonflux (200–500 Hz for various on- or near-surfaceLS experiments [32,55] and by the width of thevetoed time window after a muon. Doped scintilla-tors can maintain inverse beta coincidence timesof less than 50 s [16,26,58]. Combination of thesurface muon flux with a short veto windowshould allow for reasonable muon veto efficiencies.Shorter coincidence times also should reduce the
number of signal events that are rejected becausethey are accompanied by an unrelated detectortrigger.
(ii) Delayed signal efficiency.—Delayed signal efficien-cies can be improved over previous experiments ifnecessary by reducing the delayed signal’s spatialspread through techniques such as Li doping.
(iii) Prompt signal efficiency.—Prompt signal efficien-cies can be improved over previous experiments ifnecessary by lowering the low-energy analysisthreshold if possible, or by increasing the pulseshape discrimination power, if used in the analysis.
B. Detector resolution and analysis binning
Independent of a specific reactor-detector orientationand facility space constraints, the detector parametersthat define the sensitivity of an experiment are the detec-tor’s energy and position resolution. Good energy resolu-tion is needed to both resolve the spectral distortions at aparticular baseline and avoid washing out the oscillation atlonger baselines, while position resolution allows for theobservation of an oscillation as a function of distance.Previous short-baseline experiments have demonstratedthe ability to attain sub-10% energy resolution [36,38],while larger �13 liquid scintillator detectors have achievedresolutions of around 7%–8% [44]. Acceptable positionresolution can be obtained either through optical segmen-tation of the detector volume, or by using charge topologyinformation to reconstruct event positions in a larger one-zone detector. The former technique has been demon-strated in a number of previous short-baseline experiments,such as Palo Verde and Bugey [36,54], while the largergadolinium-loaded liquid scintillation detectors at DayaBay, RENO, and Double Chooz have demonstrated suc-cessful position reconstruction with a resolution of 30 cmor better [17,34].Figure 15 demonstrates the effect of variations in detec-
tor resolution for the default experiment. The fractional
)EEnergy Resolution (%/0 20 40 60 80 100Fr
actio
nal C
hang
e In
L/E
Osc
illat
ion
Am
plitu
de
-1.2
-1.0
-0.8
-0.6
-0.4
-0.2
-0.0
0.2
, 4m Closest Distance20.15 eV
, 4m Closest Distance21.8 eV
, 4m Closest Distance25.0 eV
, 12m Closest Distance25.0 eV
Position Resolution (m)0.0 0.5 1.0 1.5 2.0 2.5 3.0Fr
actio
nal C
hang
e In
L/E
Osc
illat
ion
Am
plitu
de
-1.2
-1.0
-0.8
-0.6
-0.4
-0.2
-0.0
0.225.0 eV21.8 eV
20.15 eV
FIG. 15 (color online). Fractional change in detected oscillation amplitude with changes in energy (left) and position (right)resolution for the default experiment at either 4 or 12 m closest distance. �m2 values of 0.15, 1.8, or 5:0 eV2 are used. Fixed values of10% for energy and 15 cm for position are used when varying position resolution and energy resolution, respectively.
HEEGER et al. PHYSICAL REVIEW D 87, 073008 (2013)
073008-14
change in amplitude of the measured L=E oscillationpictured in Fig. 2 is taken as the figure of merit. Theoscillation signature is increasingly washed out as theposition and energy resolution decrease. Attaining an en-ergy resolution of better than 10% will not provide signifi-cant gains in sensitivity for this range of �m2. Positionresolution in the vicinity of 20–30 cm will be necessary todetect 90% or better of the optimal oscillation amplitude.
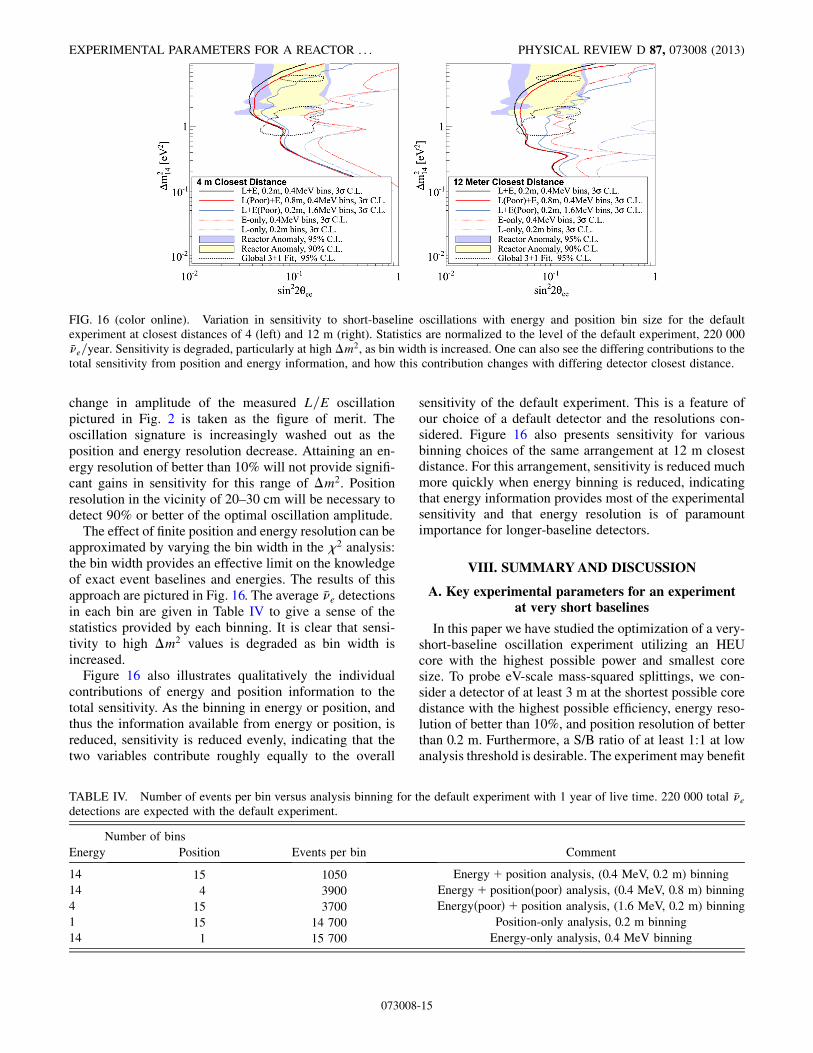
The effect of finite position and energy resolution can beapproximated by varying the bin width in the �2 analysis:the bin width provides an effective limit on the knowledgeof exact event baselines and energies. The results of thisapproach are pictured in Fig. 16. The average ��e detectionsin each bin are given in Table IV to give a sense of thestatistics provided by each binning. It is clear that sensi-tivity to high �m2 values is degraded as bin width isincreased.
Figure 16 also illustrates qualitatively the individualcontributions of energy and position information to thetotal sensitivity. As the binning in energy or position, andthus the information available from energy or position, isreduced, sensitivity is reduced evenly, indicating that thetwo variables contribute roughly equally to the overall
sensitivity of the default experiment. This is a feature ofour choice of a default detector and the resolutions con-sidered. Figure 16 also presents sensitivity for variousbinning choices of the same arrangement at 12 m closestdistance. For this arrangement, sensitivity is reduced muchmore quickly when energy binning is reduced, indicatingthat energy information provides most of the experimentalsensitivity and that energy resolution is of paramountimportance for longer-baseline detectors.
VIII. SUMMARYAND DISCUSSION
A. Key experimental parameters for an experimentat very short baselines
In this paper we have studied the optimization of a very-short-baseline oscillation experiment utilizing an HEUcore with the highest possible power and smallest coresize. To probe eV-scale mass-squared splittings, we con-sider a detector of at least 3 m at the shortest possible coredistance with the highest possible efficiency, energy reso-lution of better than 10%, and position resolution of betterthan 0.2 m. Furthermore, a S/B ratio of at least 1:1 at lowanalysis threshold is desirable. The experiment may benefit
FIG. 16 (color online). Variation in sensitivity to short-baseline oscillations with energy and position bin size for the defaultexperiment at closest distances of 4 (left) and 12 m (right). Statistics are normalized to the level of the default experiment, 220 000��e=year. Sensitivity is degraded, particularly at high �m
2, as bin width is increased. One can also see the differing contributions to thetotal sensitivity from position and energy information, and how this contribution changes with differing detector closest distance.
TABLE IV. Number of events per bin versus analysis binning for the default experiment with 1 year of live time. 220 000 total ��e
detections are expected with the default experiment.
Number of bins
Energy Position Events per bin Comment
14 15 1050 Energyþ position analysis, (0.4 MeV, 0.2 m) binning
14 4 3900 Energyþ positionðpoorÞ analysis, (0.4 MeV, 0.8 m) binning
4 15 3700 EnergyðpoorÞ þ position analysis, (1.6 MeV, 0.2 m) binning
1 15 14 700 Position-only analysis, 0.2 m binning
14 1 15 700 Energy-only analysis, 0.4 MeV binning
EXPERIMENTAL PARAMETERS FOR A REACTOR . . . PHYSICAL REVIEW D 87, 073008 (2013)
073008-15

from a second or third detector at longer baselines of 10–20 m to improve sensitivity to the regions of small �m2.
Figure 17 qualitatively summarizes the impact of vari-ous reactor and detector parameters on the parameter spacecovered by very-short-baseline reactor ��e experiments.The relative importance of these parameters is notweighted in this figure, and some experimental variablessuch as the precise core shape have only secondary effectson the experiment.
(i) Total statistics.—The per-bin statistical uncertaintycan be a limiting quantity when searching for oscil-lations over numerous energy and position bins. Byutilizing a core with the highest possible power and adetector with the highest possible efficiency, crosssection, or proton density, one can maximize thisquantity and considerably improve an experiment’ssensitivity to short-baseline oscillations at all �m2
values.(ii) Detector length.—A large detector length increases
an experiment’s ability to resolve oscillations withposition in addition to spectral distortions in energy.This effect can increase overall sensitivity at most�m2 values while extending the range of high sen-sitivity to lower values of �m2.
(iii) Detector-reactor distance.—The closest reactor-detector distance rmin determines the �m2 rangeof highest sensitivity. To achieve optimized sensi-tivity rmin should be paired with a detector length dof equal or larger magnitude to allow sampling of alarge fraction of the oscillation period. In addition,statistics naturally increase as rmin is decreased.
(iv) Detector resolution.—Oscillations at higher �m2
are only visible if resolutions and bin sizing aresmaller than the oscillation itself. Sensitivity tovalues of �m2 approaching this threshold are sig-nificantly reduced.
(v) Background.—Understanding backgrounds will becritical for the success of the experiment. Small S/Bratios make it difficult to resolve oscillation effectsabove statistical background fluctuations and uncor-related background uncertainties. Raising the analy-sis energy threshold may improve this S/B ratio, butat the expense of low-energy signal statistics andtheir attendant oscillation sensitivity. For a givenS/B, various background spectral shapes have simi-lar impact on the experiment. However, preciseknowledge of the backgrounds and their distributionin energy and position are critical for an experi-ment’s sensitivity and for demonstrating the obser-vation of neutrino oscillation.
Other variables, such as core size, shape, and fuel typewill not likely drive experimental design at most masssplittings.
B. Energy versus energyþ position measurements
Two classes of detectors have been proposed for very-short-baseline measurements at reactors. The first consistsof m3-sized experiments that will look for oscillation-related distortions in the reactor ��e energy spectrum. Thesecond class is larger multi-m3 experiments with goodenergy and position resolution that are sensitive to bothoscillations in position and energy. The sensitivity of thesetwo types of experiments can be compared using thedefault detector-reactor arrangement for each case whilevarying the total detector length: the energy-only experi-ment is defined to have a 1 m detector length, while theenergyþ position experiment is defined to have a 3 mdetector length. A comparison of the sensitivities ofthree configurations is given in Fig. 18: a 3 m detectorwith good position and energy resolution, a 1 m detectorwith good position and energy resolution, and a 1 m de-tector with no position reconstruction.
ee22sin
-210 -110 1
]2 [
eV142
m
-110
1
C.L.Default Experiment, 3
Reactor Anomaly, 95% C.L.
Reactor Anomaly, 90% C.L.
Global 3+1 Fit, 95% C.L.
ee22sin
-210 -110 1
]2 [
eV142
m
-110
1
C.L.Default Experiment, 3
Reactor Anomaly, 95% C.L.
Reactor Anomaly, 90% C.L.
Global 3+1 Fit, 95% C.L.
reactor power
core
siz
e
fuel type: minor effect
X-section,
resolution
background shape: minor effect
detector
length
dist
ance
to c
ore
live-timebkgd
threshold
FIG. 17 (color online). Reactor and detector parameters relevant for covering the suggested parameter space. The arrows indicate thedirection in which the sensitivity curve moved when reactor (left) and detector (right) parameters are improved or adjusted.
HEEGER et al. PHYSICAL REVIEW D 87, 073008 (2013)
073008-16

Experiments with energyþ position information pro-vide significantly better sensitivity to oscillations thanenergy-only experiments. Observing distortions of the en-ergy spectrum at multiple baselines will lessen the effect ofuncertainties in the energy spectrum shape. If viewed at asingle baseline, an energy spectrum distortion can be moreeasily described without oscillations by nuisance parame-ters for individual energy bins. This problem is amplified ifoscillations occur at high energies, where the reactor spec-tral uncertainties are larger. In contrast, distortions fromoscillation occur at different energy values for differentbaselines, an effect not easily neutralized with the com-paratively rigid energy spectrum uncertainty nuisanceparameters. Large differences also exist between experi-ments utilizing energyþ position information in 1 m and
3m-long detectors. In addition to the difference in statistics,the 1 m detector samples a shorter portion of the oscillationperiod as discussed in Sec. VB. Even better sensitivity isachieved by an experiment with multiple detectors, forexample at distances of 4 and 12 m, as shown Fig. 18.
IX. CONCLUSION
New experiments at very short distances from reactorshave the potential to make a precision measurement of thereactor antineutrino spectrum, resolve the reactor anomaly,and probe a large fraction of the sterile neutrino oscillationparameter space. This paper explores the experimentalvariables of a short-baseline reactor experiment and result-ing experimental sensitivity. The reactor power, detectorlength, reactor-detector distance, energy and position res-olutions of the detectors, signal-to-background ratio, andoverall background shape uncertainties are all key parame-ters for such an experiment.Radially extended detectors with good position and en-
ergy resolution provide a systematically robust approach tothe search for neutrino oscillations at very short baselines.A highly extended (>5 m) detector or multiple detectors atdifferent baselines may expand the sensitivity of the ex-periment to all relevant regions of �m2. Furthermore, theuse of movable detectors would allow deployment at mul-tiple radial locations, which may mitigate the possibleeffects of spatially varying backgrounds and will clearlydemonstrate the effect of neutrino oscillations.
ACKNOWLEDGMENTS
We thank Henry Band, Jeff Cherwinka, Randy Johnson,Walter Pettus, and Thierry Lasserre for useful discussionsand comments. This work was prepared with support fromthe Department of Energy, Office of High Energy Physics,under Grants No. DE-FG02-95ER40896 and No. DE-FG02-84ER-40153, the University of Wisconsin, and theAlfred P. Sloan Foundation.
[1] T. Mueller et al., Phys. Rev. C 83, 054615 (2011).[2] K. Abazajian et al., arXiv:1204.5379.[3] A. Hayes, in Proceedings of the Applied Antineutrino
Physics Workshop 2012, Honolulu (unpublished), http://www.phys.hawaii.edu/~jgl/AAP/AAP_2012_Agenda.htm.
[4] P. Huber, Phys. Rev. C 84, 024617 (2011).[5] M. Fallot et al., Phys. Rev. Lett. 109, 202504 (2012).[6] G. Mention, M. Fechner, T. Lasserre, T. A. Mueller, D.
Lhuillier, M. Cribier, and A. Letourneau, Phys. Rev. D 83,073006 (2011).
[7] C. Giunti and M. Laveder, Phys. Rev. D 84, 093006(2011).
[8] A. Aguilar et al. (LSND Collaboration), Phys. Rev. D 64,112007 (2001).
[9] A. A. Aguilar-Arevalo et al. (MiniBooNE Collaboration),Phys. Rev. Lett. 103, 111801 (2009).
[10] A. A. Aguilar-Arevalo et al. (MiniBooNE Collaboration),Phys. Rev. Lett. 105, 181801 (2010).
[11] A. A. Aguilar-Arevalo et al. (MiniBooNE Collaboration),arXiv:1207.4809.
[12] C. Giunti and M. Laveder, Mod. Phys. Lett. A 22, 2499(2007).
[13] C. Giunti and M. Laveder, Phys. Rev. C 83, 065504(2011).
FIG. 18 (color online). Comparison of sensitivities foroscillation experiments with energy-only or energyþ positioninformation. All experimental parameters, including closestreactor-detector distance, are identical, except the total detectorlength. Also pictured is an experiment utilizing an additionalsimilar detector at a longer baseline of 12 m. This extra detectorgreatly increases the available range of baselines, significantlyincreasing the experimental sensitivity at lower �m2 values.
EXPERIMENTAL PARAMETERS FOR A REACTOR . . . PHYSICAL REVIEW D 87, 073008 (2013)
073008-17
[14] E. Komatsu et al., Astrophys. J. Suppl. Ser. 192, 18(2011).
[15] J. Hamann, S. Hannestad, J. Lesgourgues, C. Rampf,and Y.Y.Y. Wong, J. Cosmol. Astropart. Phys. 07(2010) 022.
[16] F. An (Daya Bay Collaboration), Phys. Rev. Lett. 108,171803 (2012).
[17] Y. Abe (Double Chooz Collaboration), Phys. Rev. Lett.108, 131801 (2012); Phys. Rev. D 86, 052008 (2012).
[18] J. Ahn et al. (RENO Collaboration), Phys. Rev. Lett. 108,191802 (2012).
[19] K.M. Heeger, in Proceedings of Neutrino 2012, Kyoto,Japan (unpublished), http://neu2012.kek.jp/neu2012/programme.html.
[20] T. Lasserre, in Proceedings of CIPANP 2012, St. Petersburg(unpublished), http://cipanp2012.triumf.ca/timetable.html.
[21] N. Bowden, in Proceedings of SNAC 2011, Blacksburg(unpublished), http://www.cpe.vt.edu/snac/program.html.
[22] A. Serebrov et al., arXiv:1205.2955.[23] A. V. Derbin et al., arXiv:1204.2449.[24] V. Kopeikin, L. A. Mikaelyan, and V.V. Sinev, Phys. At.
Nucl. 67, 1892 (2004).[25] Y. Abe (Double Chooz Collaboration), Phys. Rev. D 87,
011102 (2013).[26] M. Vivier, in Proceedings of the Applied Antineutrino
Physics Workshop, Honolulu (unpublished), http://www.phys.hawaii.edu/~jgl/AAP/AAP_2012_Agenda.htm.
[27] N. Bowden et al., arXiv:physics/0612152.[28] Oak Ridge National Laboratory, The High Flux Isotope
Reactor at Oak Ridge National Laboratory, http://neutrons.ornl.gov/facilities/HFIR.
[29] National Institute of Standards and Technology, NISTCenter for Neutron Research, http://www.ncnr.nist.gov.
[30] Idaho National Laboratory, Advanced Test Reactor:Meeting US Nuclear Energy Research Challenges, http://www.inl.gov/research/advanced-test-reactor-research.
[31] H. Kwon, F. Boehm, A. Hahn, H. Henrikson, J. Vuilleumier,J. Cavaignac, D. Koang, B. Vignon, F. Feilitzsch, and R.Mossbauer, Phys. Rev. D 24, 1097 (1981).
[32] San Onofre Nuclear Generating Station, http://www.songscommunity.com/default.asp?from=SONGS.
[33] V. Kopeikin, L. A. Mikaelyan, and V.V. Sinev, Phys. At.Nucl. 69, 185 (2006).
[34] B. Littlejohn, Ph.D. thesis, University of Wisconsin–Madison, 2012.
[35] S. Abe et al. (KamLAND Collaboration), Phys. Rev. Lett.100, 221803 (2008).
[36] B. Ackhar et al., Nucl. Phys. B 434, 503 (1995).
[37] A. Afonin et al., JETP Lett. 54, 253 (1991).[38] A. Afonin et al., JETP Lett. 45, 247 (1987).[39] NIST Center for Neutron Research, 2012 Operations
Schedule, http://www.ncnr.nist.gov/ns_schedule.html.[40] Oak Ridge National Laboratory, HFIR Operating Forecast
& Planning Schedule, http://neutrons.ornl.gov/facilities/HFIR/pdf/rolling15month.pdf.
[41] ATR National Scientific Users Facility, FY 2009Advanced Test Reactor National Scientific User FacilityUsers’ Guide, https://secure.inl.gov/atrproposal/documents/ATRUsersGuide.pdf.
[42] T. Lasserre (private communication).[43] F. An (Daya Bay Collaboration), arXiv:hep-ex/0701029.[44] F. An (Daya Bay Collaboration), Nucl. Instrum. Methods
Phys. Res., Sect. A 685, 78 (2012).[45] J. Beringer et al. (Particle Data Group), Phys. Rev. D 86,
010001 (2012).[46] San Onofre Nuclear Generating Station, Anatomy of a
Nuclear Power Plant Planned Outage.[47] R. T. Ridenoure, Docket No. 50-361 60-day Post Cycle-15
Refueling Outage Reactor Pressure Vessel HeadInspection Report for San Onofre Nuclear GeneratingStation, Unit 2, http://pbadupws.nrc.gov/docs/ML0808/ML080850059.pdf.
[48] D. Ridikas, G. Fioni, P. Goberis, O. Deruelle, M. Fadil, F.Marie, and S. Rottger, On the Fuel Cycle and NeutronFluxes of the High Flux Reactor at ILL Grenoble, http://cdsweb.cern.ch/record/540488/files/sis-2002-086.pdf.
[49] A. Glaser, Ph.D. thesis, Technical University of Darmstadt,2005.
[50] P. Vogel and J. Engel, Phys. Rev. D 39, 3378 (1989).[51] K. Schreckenbach, G. Colvin, W. Gelletly, and F. Von
Feilitzsch, Phys. Lett. B 160, 325 (1985).[52] A. Hahn, K. Schreckenbach, W. Gelletly, F. von Feilitzsch,
G. Colvin, and B. Krusche, Phys. Lett. B 218, 365(1989).
[53] C. Lewis (private communication).[54] F. Boehm et al. (Palo Verde Collaboration), Phys. Rev. D
64, 112001 (2001).[55] J. C. Anjos, in Proceedings of the Applied Antineutrino
Physics Workshop, Honolulu (unpublished), http://www.phys.hawaii.edu/~jgl/AAP/AAP_2012_Agenda.htm.
[56] M. Yeh (private communication).[57] A. Glenn (private communication).[58] C. D. Bass et al., arXiv:1206.4036.[59] F. Seukane, in Proceedings of the Applied Antineutrino
Physics Workshop, Honolulu (unpublished), http://www.phys.hawaii.edu/~jgl/AAP/AAP_2012_Agenda.htm.
HEEGER et al. PHYSICAL REVIEW D 87, 073008 (2013)
073008-18