Physical Oceanography at Dalhousie University
17
Larval Flatfish Distributions andDrift on the Southern Grand Bank Kenneth T. Frank and John W. Loder Department of Fisheries and Oceans, Bedford /nstltute of ()ceanography, P.O. Box 1006, Dartmouth, N.5. 82Y 4A2, Canada James E.Carscadden Department of Fisheries and Oceans, Northwest Atlantic Flsheries Centre, P.O.Box 5667, St. John's,Nfld. AIC 5Xl , Canada William C. Leggett Department of Biology, McCill University, 1205 Ave. Dr. Penfield, Montreal, Que., H3A 1Bl , Canada andChristopher T. Taggart Department of Fisheries and Oceans, Northwest Atlantic Fisheries Centre, P.O.Box 5667, St. lohn's, Nf Id. AIC 5Xl , Canada Frank, K. T., J. W. Loder, J. E.Carscadden, W. C. Leggett, andC. T. Taggart. 1992. Larval flatfish distributions anddrift on thesouthern Crand Bank. Can. J. Fish. Aquat. Sci. 49: 467-483. lchthyoplankton andhydrographic surveys of thesouthern Crand Bank in September of 1986, 1987, and 19BB revealed substantial correspondence between the areal distributions of larvae of three flatfish species and tem- perature below the thermocline. Depth-averaged densities of American plaice (Hlppoglossoides p/atessoides) were negatively correlated withtemperature whereas yellowtail flounder (Limanda ferruginea\ andwitchflounder (Clyptocephalus cynoglossus) densities werepositively correlated with temperature. In spite of large interannual differences in abundance, the larval distributions showed similar structure fromyear to year. Using estimates of larval ageinferred from length frequency distributions and literature values for growth rate, in conjunction with moored current measurements, estimates of spawning times andlocations were obtained for each species. These estimates werecompared with historical information on the distribution of prespawning fishfor eachspecies to examine the hypothesis of passive larval drift. The results indicate that in most, but not all cases, the larval distributions and currents are consistent with passive larval driftfor particular growth rates and vertical distri- butions. However, the observations arenot adequate to ruleout alternative mechanisms involving behaviour. Des relev6s de l'ichtyoplancton et des paramdtres hydrographiques effectu6s dansle secteur sud des Crands Bancs en septembre 1986,1987 eI 19BB ont r6v6l6 unecorrespondance importante entre la r6partition spatiale des larves de troisespdces de poissons plats et la temp6rature de l'eausous la thermocline. Les densit6s, en fonction de la moyenne desprofondeurs, deslarves de plie canadienne (Hippoglossoldes p/atessoides) 6taient en corr6lation n6gative avec la temp6rature, tandis que les densit6s de larves de limande ) queue jaune (llrnanda ferruginea) et de pliegrise (C/yptocephalus cynoglossus) 6taient encorr6lation positive avec cette variable. Mal916 d'importantes diff6rences inter-annuelles de l'abondance, la r6partition des larves pr6sentaient une structure semblable d'une ann6e A l'autre. A l'aide d'estimations de l'Age deslarves 6tablies ) partir des distributions de la fr6quence des longueurs, de taux de croissance tir6s d'ouvrages publi6s et de quantifications courantom€- triques, les auteurs ontobtenu des estimations du moment et du lieu de la fraie de chaque espdce. llsontensuite compar6 ces estimations ) des donn6es historiques surla r6partition de chaque espdce avant la fraie pourtenter d'6tayer l'hypothdse d'uned6rive passive deslarves. Les r6sultats r6vdlent quedans la plupart des cas, mais pas tous, la r6partition deslarves et les courants appuient cette hypothdse dans le cas de certains taux de croissance et de r6partition verticale. Toutefois, les observations ne suffisent pasi 6carter d'autres m6canismes li6s au comportement. Received December 21, 1990 Accepted October 10, 1991 (JA84s) common approachin investigations aimed at under- standing recruitment to marine fish populations and its variability is a search for andquantification of the factors Reetr le t1 dcecmhrc l99Q Accept1 le 10 octobre 1991 that determinethe distribution and survival of the early life stages. Hypotheses includethose in which purely environmen- tal factors such as water drift (or lack thereof)dominate(e.g. Myers and Drinkwater 1988) and those requiring significant behavioural components such as vertical migration in relation to currents (e.g. Sinclair 1988).The possibilityof retention, or an extended residence time in a particulararea,hasbeen sug- gested for many species and hasbeenattributed both to purely Can. J. Fish. Aquat. Sci., Vol.49, 1992 physical processes (e.g. American plaice(Hippoglossoides pLa- tessoides), Nevinsky and Serebryakov 1973;silver hake (Mer- lucciusbilinearis) , Fahay 197 4) and vertical migration in rela- tion to depth-varying currents(e.g. Atlantrc herring (Clupea harengus harengus), Sinclair and Iles 1988). Two physical factors that affectthe degree to which eggs and larvaeare retained within an areaare its horizontalextent and the rate of horizontalwater exchange. Together,these factors determine the waterresidence time (extent/exchange rate).The Grand Bank of Newfoundland, a continental shelf region used as a spawning ground by numerous species, has both a broad 461
Transcript of Physical Oceanography at Dalhousie University

Larval Flatfish Distributions and Drift on the Southern Grand Bank
Kenneth T. Frank and John W. LoderDepartment of Fisheries and Oceans, Bedford /nstltute of ()ceanography, P.O. Box 1006, Dartmouth, N.5. 82Y 4A2, Canada
James E. CarscaddenDepartment of Fisher ies and Oceans, Northwest At lant ic Flsher ies Centre, P.O. Box 5667, St . John's, Nf ld. AIC 5Xl , Canada
Wil l iam C. LeggettDepartment of Biology, McCil l University, 1205 Ave. Dr. Penfield, Montreal, Que., H3A 1Bl , Canada
and Christopher T. TaggartDepartment of Fisher ies and Oceans, Northwest At lant ic Fisher ies Centre, P.O. Box 5667, St . lohn's, Nf Id. AIC 5Xl , Canada
Frank, K. T. , J . W. Loder, J . E. Carscadden, W. C. Legget t , and C. T. Taggart . 1992. Larval f la t f ish d is t r ibut ionsand dr i f t on the southern Crand Bank. Can. J . F ish. Aquat . Sci . 49: 467-483.
lchthyoplankton and hydrographic surveys of the southern Crand Bank in September of 1986, 1987, and 19BBrevealed substantial correspondence between the areal distributions of larvae of three flatfish species and tem-perature below the thermocline. Depth-averaged densities of American plaice (Hlppoglossoides p/atessoides)were negatively correlated with temperature whereas yellowtail f lounder (Limanda ferruginea\ and witch flounder(Clyptocephalus cynoglossus) densities were positively correlated with temperature. In spite of large interannualdifferences in abundance, the larval distributions showed similar structure from year to year. Using estimates oflarval age inferred from length frequency distributions and literature values for growth rate, in conjunction withmoored current measurements, estimates of spawning times and locations were obtained for each species. Theseestimates were compared with historical information on the distribution of prespawning fish for each species toexamine the hypothesis of passive larval drift. The results indicate that in most, but not all cases, the larvaldistributions and currents are consistent with passive larval drift for particular growth rates and vertical distri-butions. However, the observations are not adequate to rule out alternative mechanisms involving behaviour.
Des relev6s de l ' ichtyoplancton et des paramdtres hydrographiques effectu6s dans le secteur sud des CrandsBancs en septembre 1986,1987 eI 19BB ont r6v6l6 une correspondance importante entre la r6partit ion spatialedes larves de trois espdces de poissons plats et la temp6rature de l 'eau sous la thermocline. Les densit6s, enfonction de la moyenne des profondeurs, des larves de plie canadienne (Hippoglossoldes p/atessoides) 6taienten corr6lation n6gative avec la temp6rature, tandis que les densit6s de larves de l imande ) queue jaune (l lrnandaferruginea) et de plie grise (C/yptocephalus cynoglossus) 6taient en corr6lation positive avec cette variable. Mal916d'importantes diff6rences inter-annuelles de l 'abondance, la r6partit ion des larves pr6sentaient une structuresemblable d 'une ann6e A l 'autre. A l 'a ide d 'est imat ions de l 'Age des larves 6tabl ies ) par t i r des d is t r ibut ions dela fr6quence des longueurs, de taux de croissance tir6s d'ouvrages publi6s et de quantif ications courantom€-t r iques, les auteurs ont obtenu des est imat ions du moment et du l ieu de la f ra ie de chaque espdce. l ls ont ensui tecompar6 ces estimations ) des donn6es historiques sur la r6partit ion de chaque espdce avant la fraie pour tenterd'6tayer l 'hypothdse d'une d6rive passive des larves. Les r6sultats r6vdlent que dans la plupart des cas, mais pastous, la r6partit ion des larves et les courants appuient cette hypothdse dans le cas de certains taux de croissanceet de r6partit ion verticale. Toutefois, les observations ne suffisent pas i 6carter d'autres m6canismes li6s aucomportement.
Received December 21, 1990Accepted October 10, 1991(JA84s)
common approach in investigations aimed at under-standing recruitment to marine fish populations and itsvariability is a search for and quantification of the factors
R e e t r l e t 1 d c e c m h r c l 9 9 Q
Accept1 le 10 octobre 1991
that determine the distribution and survival of the early lifestages. Hypotheses include those in which purely environmen-tal factors such as water drift (or lack thereof) dominate (e.g.Myers and Drinkwater 1988) and those requiring significantbehavioural components such as vertical migration in relationto currents (e.g. Sinclair 1988). The possibility of retention, oran extended residence time in a particular area, has been sug-gested for many species and has been attributed both to purely
Can. J. F ish. Aquat. Sci . , Vol .49, 1992
physical processes (e.g. American plaice (Hippoglossoides pLa-tessoides), Nevinsky and Serebryakov 1973; silver hake (Mer-luccius bilinearis) , Fahay 197 4) and vertical migration in rela-tion to depth-varying currents (e.g. Atlantrc herring (Clupeaharengus harengus), Sinclair and Iles 1988).
Two physical factors that affect the degree to which eggs andlarvae are retained within an area are its horizontal extent andthe rate of horizontal water exchange. Together, these factorsdetermine the water residence time (extent/exchange rate). TheGrand Bank of Newfoundland, a continental shelf region usedas a spawning ground by numerous species, has both a broad
461

plateau and weak subtidal currents (except in the Labrador Cur-rent around its perimeter) (e. g. Petrie and Anderson I 983; Loderet al. 1988). Therefore, retention of early l i fe stages might beexpected to be a common feature on the Bank.
In this paper we report the distributions of the early life stagesof three flatfish species on the southern Grand Bank, asobserved in ichthyoplankton surveys conducted in Septemberof 1986, 1987, and 1988. The species examined are Americanplaice, yellowtail flounder (Limanda ferruginea), and witchflounder (Glltptocephalus cynoglossus). There is limited infor-mation on the distribution of larvae and juveniles of these spe-cies in the area. However, extensive sampling of older juveniles(ages I and older), conducted since 1985, indicates that thesouthern Bank may be a juvenile nursery area for yellowtail
and plaice (Walsh l99l). We describe the distributions of lar-vae and 0-group juveniles in relation to the temperature fieldand use current measurements derived fiom moored instru-ments to estimate their movement and probable spawning sites.assuming that the dominant influence is water drif i. We use theresults of these analyses to assess the hypothesis that passivedrift from spawning areas can account for the observed larvaldistributions.
Materials and Methods
Study Area
The study(approximate
500
area (Fig. I ) was the Southeast Shoalcentre 4,1o30'N. 50"W) of the Grand Bank, its
490
G R A N D B A N K
8 3 1 C887 0
T A I L43"
52 5 1 "Frc. l. Location map for the southern Grand Bank with theTable I for t imes and depths). l , 1986; I , 1987; O, 1988.
D 832
._v4n \
f,Nw160-
,-.)s\rT5Qr'*\
SOUTHEASTA
D S H O A L
43"
50" 49o
1986-88 current meter mooring sites (see
\ , , ,
j"'P
20o
Can. J. F ish. Aquat. Sci . , Vol .19, 1992

Teelr l . Summary of posit ions, depths (below surface), and periodswith reliable data for current meter measurements on the southernGrand Bank in 1986-88. Mooring No. refers to the Bedford Institute"f O..^""gr"phy Ct
Water DataMooring Latitude Longitude depth lnstrument return period
No. (N) (W) (m) depth (m) (calendar days)
l 986714 44" t4.4',
1981830 44"16.O' ,
831 M"t4.g ' ,
832 M '13 .3 ' ,
I 988887 44'15. l ' , 50"59.9 ' ,
shallowest area. The Shoal is or has been the site of majordomestic and international f isheries for capelin, cod, andflatfishes. [t is a major spawning area for capelin and has beenthe site of studies on spawning (Carscadden et al. 1989) andearly l i f 'e stages (Frank and Carscadden 1989) of capelin andon juvenile stages of f latf ish (Walsh l99l). The principalfeatures of its spring-fall physical oceanographic regime are anapproximate two-layer stratif ication (e.g. Loder l99l), weaksubtidal currents, and a branch of the Labrador Current alongthe shelf break to the east (e.g. Petrie and Anderson 1983).
Physical Oceanography
The current and hydrographic fields in the Southeast Shoalregion were monitored in 1986, 1987, and 1988 using mooredsensors deployed from spring to fall (Ross et al. 1988) andhydrographic surveys. The returned data include time seriesfrom two Aanderaa current meters at each of one site in 1986,three sites in 1987, and one in 1988 (see Fig. I and Table l,and Ross et al. 1988 for details). Temperature and salinity dis-tributions were obtained during the l986-88 September larvalsurveys from a CTD mounted on the BIONESS net system(Sameoto et al. 1980) and from XBT casts. Temperature andsalinity data for other times during spring-fall of 1986-88 wereobtained fiom dedicated hydrographic (CTD and XBT) surveysand from the Marine Environmental Data Service (MEDS). TheMEDS data were screened for suspect values which wereremoved, and all the hydrographic data were subsequentlygrouped into time intervals of 1-2 wk duration which providedquasi-synoptic coverage of the region.
Adults
Spawning has never been directly observed for any of thethree species studied. Published historical accounts of adult dis-tributions, the approximate l imits of the distribution of pre-spawners, and the relationship between these prespawning dis-tributions and bottom temperatures were therefore used to adelimit the expected spawning times and locations.
Larvae and Juveniles (0-Group)
The sampling methods used are detailed in Frank andCarscadden (1989). Briefly, the horizontal and vertical distri-
Can. J. F ish. Aquat. St ' i . . Vol .49. 1992
butions of larvae of the three flatfish species were assessed tiomsurveys conducted in September of igSO. 1987, and 1988. In1986, a rectangular grid of 39 stations spaced at l0 nauticalmile intervals along six transects was sampled. Eight additionalstations were sampled along 44'15' centered on the shelf break.In 1987 the grid was expanded to the north, west, and southyielding a total of 7 I stations. In 1988. anorher grid of 7 I sta-tions was sampled with slightly different spatial coverage. Weused a small-scale version (0.25 m'z) of the BIONESS, a mul-tiple opening and closing net. f itted with seven 333-pm-meshnets. Seven discrete depths were sampled at each deploymentand sample depths were spaced at 5-m intervals starting at 5 m(below surface). Each depth stratum was sampled for l0 minduring which approximately 200 mr of water was fi l tered. Sen-sors positioned on the net frame provided real-time on-deckreadouts of pitch, roll, and flow rate, as well as temperature,salinity, and depth (CTD). During the middle of each BIO-NESS tow, a horizontal tow of l0 min duration was made atI m depth with a 333-pm, 0.75-m diameter net.
All samples were preserved in 4Vc formalin buff'ered withsodium borate. All fish larvae and macrozooplankton weresorted from the samples and counted. Total length measure-ments were made using an ocular micrometer fbr larvae<15 mm and a mi l l imetre scale ru ler for larger larvae(> l 5 mmt and j uven i l es .
Variations in the depth distributions of larvae and juvenilesof the three species were evaluated by calculating the verlicalcentre of mass of their distributions, 2.,,,:
( l ) z , n : 4 , r , 2 , ) , j - I , m
yhgre p, is the proportion of larvae in the jth depth interval, z,is its average depth, and nr is the number of intervals. Thecentroids of the horizontal distribution of verticallv averasedlarval density were computed from
) Not^/ ' ) \ v - L\ L t ^ e n , -
) N .
.
) N^,t*t. -' " " -
5 J A : l ' r t
whereN. is the larval density,,r, and,\,* are the horizontal coor-dinates of the ftth station. and n is the number of stations.
Infened Spawning Areas
For an egg or larva released at horizontal position X, at t ime1, . i ts posi t ion at some later t ime l , is
t,,(3) X, : X, +
) ,, U,,(X,, t7 dt
where U.(X,, r) is its Lagrangian velocity (relative to the sea-floor) at t ime t. This velocity includes both the motion of theegg/larva relative to the water and the space- and time-depend-ent water velocity. To evaluate the influence of physical advec-tion on larval distributions, we assumed that the individual lar-vae move with the ambient water and approximated this velocityby the velocily u,,,(x^, l) observed at a current meter positionr,,. Taking r, to be the midtime of the September survey, themean release time can be approximated by
(4) t; : tr - (1, - l,)lg
50'04.2',
50'05 . 3',
50 '58.8 ' ,
49"19.5',
54
72
55
55 2015
7 3 1 363
l l441 441I L
45
r08-215I 08-268
123-215123-257t23-292t23-292124-187t2+-291
tzt 262t2t-262

where /, is the larval length from the September survey, /, thelength at release, and g its average growth rate. Thus, the releaseposition can be estimated from
f r r
(5) X, : X, - J,,
u,,,(x,,,, t) dt
with X,, /,, and /, specified from the September survey data,a.(r) fiom the m<iored current measurements, and /, and g fromliterature values. The use ofcurrent observations from a sinsleposition assumes that there is limited horizontal structure in ihesubtidal currents which dominate long term drift on the South-east Shoal. Cross-spectral analysis of the 1987 moored obser-vations indicates that the spatial scale of the subtidal currentsover the Shoal is of the order 50- 100 km, although around theShoal's perimeter, there is substantial structure aJsocrated withthe Labrador Current and the steep bathymetry. Hence, theaccuracy of X, estimated from (5) will generally decrease forearlier release times (older larvae) if positions are considerabledistances from the mooring site.
In the analysis presented here, the length at release was takenas the hatching length and the growth rate chosen to be appro-priate to post-hatching. Strictly speaking, the infened releasetimes and positions are therefore appropriate to hatching. How-ever, because the egg phase is short relative to the larval drifttime, they also approximate the spawning times and positions.
ResultsPhysical Oceanography
The temperature distributions observed along 44'15'N duringthe September survey in each year (Fig. 2) indicate a
pronounced vertical stratification with a sharp thermocline near20 m, consistent with historical observations (Loder 1991).Some interannual variability is apparent, including coolertemperatures and a less pronounced thermocline in 1986, andwanner near-surface waters and a slightly deeper thermoclinein 1988. The vertical sections also show elevated near-bottomtemperatures in the vicinity of the Shoal in each year, againconsistent with historical observations (Loder 1991), andsubzero temperatures along the Bank's eastern edge consistentwith the presence of the cold intermediate layer associated withthe Labrador Current (Petrie et al. 1988). Areal distributionsof bottom temperature (Fig. 3) during early spring, earlysummer, and late summer (from the MEDS and hydrographicsurvey data) confirm the persistence of these features duringspring and summer of each year, although with some variabilityin spatial structure and temperature from year to year (also seeCarscadden et a l . 1989).
The current measurements derived from the mooredinstruments revealed that, although the subtidal currents areimportant to long-term drift on the southern Grand Bank (Loderet al. 1988), they are generally weak. The mean currents havemagnituCes of up to 0.04 m/s, while the standard deviations ofthe low-frequency current components are typically 0.02-0.05 m/s (Ross et al. 1988). The expected particle driftsresulting from the measured currents are illustrated in Fig. 4which presents progressive vector plots for the centraf andeastem sites (Fig. l) in 1987. Typical of the central andwestern sites in the other years, the central-site drift is generallywestward and significantly stronger at the upper meter. In
20E.5 a ooo
60
2 0E.*o 40oo
60
O 5 0 1 O O 1 5 O 2 O O k m
FIc. 2. West-east vertical sections of temperature along 44"15'N from the CTD mounted on the BIO-NESS during the September larval surveys of (a) 1986, (b) 1987, and (c) 1988.
20
Es 4 0
c)- 6 0
Can. J. Fish. Aquat. Sci., Vol. 49, 1992

2 7 J U X E . 5 J U L Yt$a
2 6 J U X E . 5 J U L Y1 3E7
I O J U X E . 3 J U L Y1 S
5 2 W9 W
4 2 N4 2 Na 2 N
4 2 N
4 2 N4 2 N
" r ' l - \.e) l'VA
\ @. / l.=!A",-r<-
28 APR,- 6 MAY
5 2 W
2 I A P A . . E I A Y 2 I A U G . . ' S E P I
4 ? N
5 2 W $ w
Ftc. 3. Bottom temperature distributions on the southern Grand Bank during early spring, early summer, and late summer in 1986, 1987, and1988. Data are from dedicated hydrographic surveys and MEDS and have been sorted into time intervals with broad spatial coverage.
i 7 - 2 t s E P T .
6<)Fs"
Can. J. F ish. Aquat. Sci . , Vol .49, 1992 4 l l
?- 500B
Fo
-1
!< -500
-rro0
-2m.0
-50.0
-rm.0
-150.0
-?00.0
-250.0
-3000
-350.0
N
I
MOORING B3O AT I lM.SOUTHEAST SHOAL 1987
a)
2F
[email protected] -3c0.0 -an.o -250.0 -an.o -150.0 -1m.0 -50.0
K I LOME-TRES-100.0 -50.0 0.0
KILOMETRES50.o [email protected] 1n00 e000-m.0 -150_0
9? -rm.o
F
! -tm.o
.J
il -.m.o
A 5o.o
Fc l ^^
J
v -50.0
-1000
-15(I0
-ano
-300.o
-330.0-2d), -r5o.0 -t*o -ill.roJ.h"#.0 rml) 150.0 2d).0 25{ro -?5().0 -m.0 -t".. -tffirofr"rho# soo rm.o r5o.o e{oo
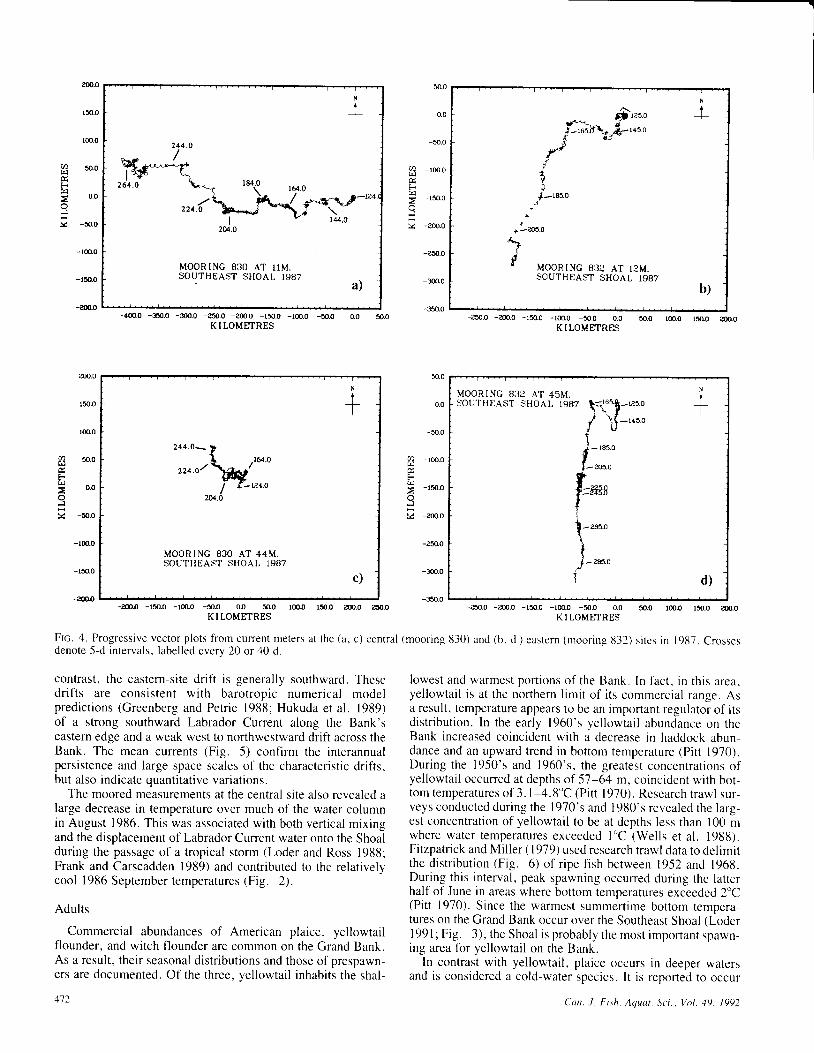
Ftc. 4. Progressive vector plots f iom current meters at the (a, c) central (mooring 830) and (b, d ) eastern (mooring t l32) si tcs in 1987. Crgssesdenote 5-d intervals, labelled every 20 or 40 d.
contrast, the eastern-site drift is generally southward. Thesedrifts are consistent with barotropic numerical modelpredictions (Greenberg and Petrie 1988; Hukuda et al. 1989)of a strong southward Labrador Current along the Bank'seastern edge and a weak west to northwestward drift across theBank. The mean currents (Fig. 5) confirm the interannualpersistence and large space scales of the characteristic drifts,but a lso indicate quant i ta t ive var iat ions.
The moored measurements at the central site also revealed alarge decrease in temperature over much of the water columnin August 1986. This was associated with both vertical mixingand the displacement of Labrador Current water onto the Shoalduring the passage of a tropical storm (Loder and Ross 1988;Frank and Carscadden 1989) and contributed to the relativelycool 1986 September temperatures (Fig. 2).
Adults
Commercial abundances of American plaice, yellowtailflounder, and witch flounder are common on the Grand Bank.As a result, their seasonal distributions and those of prespawn-ers are documented. Of the three, yellowtail inhabits the shal-
412
lowest and warmest portions of the Bank. In fact. in this area,yellowtail is at the northern l imit of its commercial range. Asa result, temperature appears to be an important regulator of itsdistribution. In the early 1960's yellowtail abundance on theBank increased coincidenr with a decrease in haddock abun-dance and an upward trend in bottom temperature (Pitt 1970).During the 1950's and 1960's. the greatest concentrations ofyellowtail occurred at depths of 57-64 m, coincident with bot-tom temperatures of 3.1-4.8"C (Pitt 1970). Research trawl sur-veys conducted during the 1970's and 1980's revealed the larg-est concentration of yellowtail to be at depths less than 100 mwhere water temperatures exceeded I'C lWells et al. 1988).Fitzpatrick and Miller ( 1979) used research trawl data to delimitthe distribution (Fig. 6) of ripe fish berween 1952 and 1968.During this interval, peak spawning occurred during the latterhalf of June in areas where bottom temperatures exceeded 2oC(Pitt 1970). Since the warmest summertime bottom temDera-tures on the Grand Bank occur over the Southeast Shoal (Loder1991; Fig. 3), the Shoal is probably the mosr importanr spawn-ing area for yellowtail on the Bank.
In contrast with yellowtail, plaice occurs in deeper watersand is considered a cold-water species. It is reported to occur
1$,..0f,liitt,J-'n.od u
g(5
J?)
,/r-185.0
N
t
b)
+_6.0
iE MooRrNc 83e AT rzM.
SOUTHEAST SHOAL 1987
N
IT
c)
MOORINC 830 AT 44M,SOUTHEAST SHOAL 1987
N
t-t-
d)
MOORING 832 AT ,15M.SOUTHEAST SHOAL T987
Can. J. F ish. At luut . Sci . , Vol . 19, 1992

I
I" l
4 4 N r
4 5 N5 2 w 4 9 W
o- 1'----'cm/s
4 4 N
4 5 N
4 4 N
Ftc;. 5. Record-mean currents from moored measurements on thesouthern Grand Bank in 1986-88. Solid vectors are for upper instru-mentsi broken vectors are for lower meters.
at depths ranging from 90 to 250 m and at temperatures fromjust below 0 to 1.5 'C (Scotr and Scot t 1988; Wel ls et a l . 1988).Plaice appears to spawn in most areas where the influence ofthe cold Labrador Current is apparent (Fig. 6). There is, how-ever, some dispute concerning the relative importance of dif-
ferent areas. Pitt (1966) reported that the northern and easternslopes of the Bank supported the greatest spawning activity.Nevinsky and Serebryakov (1973) also noted the importance ofthe northern Grand Bank but reported that spawning on theeastem, southwestern, and southern slopes was less intense.They concluded that spawning occurs from April to mid-Mayat bottom temperatures ranging from - 1.3 to 3.5"C, withspawning being most intense at 0-2'C. Pitt ( 1966) reported thataverage spawning temperatures ranged from - 1.3 to 2.8"C onthe northern, southeastern, and southwestern areas ofthe Bank.
Witch is generally considered to be a deepwater species,residing in gullies where the bottom is clay and mud rather thanon sand and gravel bottom typical of the banks and the inshore(McKenzie 1955). In the Grand Bank area, research trawl sur-veys conducted during 1958-14 have revealed that the greatestnumbers of witch occurred at depths of 185-366 m and at bot-tom temperatures of 2-6o (Bowering 1976). On the basis of therelative frequencies of ripening and recently spent fish fromresearch surveys, Bowering (1990a) concluded that spawningoccurs during April-June (Fig. 6) on the southern Grand Bankat depths ranging between 100 and 200 m and temperaturesbetween 2 and 3'C.
None of the three flatfish species discussed is reported toundergo extensive migrations, although yellowtail and plaicemigrate seasonally, moving into shallow water in the springand into deeper water during the winter (Scott and Scott 1988;Wa lsh l 99 l ) .
Larval Distributions and Size Composition
YeLLowtail flounderThe depth of the centre of mass of yellowtail larvae and juve-
ni les occurred at 24.2,28.0, and 26.1 m dur ing the day and18.6,23.9, and25.1 m dur ing the n ight in 1986, 1987, and1988, respectively (Fig. 7). This diel pattern of depth distri-bution is similar to that described by Smith et al. (1978), butthe day-night change in depth in rhe mid-Atlantic Bight wasgreater, exceeding 25 m. In view of the l imited day-nightchange observed on the southern Grand Bank, we combinedthe centre of mass depths for day and night when estimatingthe direction and magnitude of larval drift (Table 2).
5 8 w 5 6 w S w 5 2 W 5 o w 4 a W
1979) and witch (after Bowering 1990a)
4 2 N
6 0 w 5 8 W 5 6 W 6 0 w 5 8 W $ W g W 5 2 W
Ftc. 6. Composite picture of spawning distributions of yellowtail and plaice (after Fitzpatrick and Millerin the Grand Banks region for April-July.
Can. J. Fish. Aquat. St'i., Vol. 49, 1992
,i" i
!:: ::: li,.^
r? ::: :::: l:: ill: ,i:ll
:]:::::::::::::::: ::::::
' J '
: : ! '
+ t - )

I
5
l 0
l 5
- 2 0
t
o 2 5
t0
Frc. 7. Percentage of larvae in various depth intervals for yellowtail in (a) 1986, (b) 1987, and (c)1988, plaice in (d) 1986 and (e) 1987, and (f1 witch in 1988. Distr ibutions are shown for both day(open bars) and night (shaded bars) stations.
Furthermore, peak concentrations of yellowtail wereobserved at depths near or below the thermocline (Fig. 8). In1986 and 1987 , a majority of the yellowtail (>607o) werebelow the thermocline. Given the two-layer stratification, bot-tom temperature was taken as an index of the (lower-layer)
474
thermal regime principally experienced by the larvae andjuveniles.
In 1 986 the highest concentrations of yellowtail occurred overthe western half of the survey area where bottom temperaturegenerally exceeded 2'C (Fig. 9a, 99, 10a) . No yellowtail were
Can. J. F ish. Aquat. Sci . , Vol .49, 1992

Teer-e 2. Summary of midtimes (rr) of surveys, observed mean verticalpositions (2"-) and larval lengths (1r). assumed hatching lengths (/,) andgrowth rates (g), and calculated ages (post-hatching) and spawningd"t". ft,t fo. th" l.
tr z.^ l, l, g Age tiCohon (d) (m) (-rn) (..) (mnva) tdl fcil
Yellowtail1986
t987
1988
Plaice1986
1987
Witchr 988
individuals as small as 5 mm were captured. In September1988, yellowtail sizes ranged from 4 to 33 mm (Fig. l lc),with a mean of 19 mm (Table 2). For the above growth ratesand hatching length, the mean ages of larvae samfled in 1987and 1988 were in the ranges of 90-205 and 61-138 d, respec-tively (Table 2). While the uncertainty in the growth rate resulrsin a wide mean age range, the historical data on spawning times(e.g. Fitzpatrick and Miller 1979) suggest that the lower agesare more probable. The wide range of sizes (and ages) coin-cident in time and space in each of the three years also suggeststhat there is some retention of the early life stages (larvae andpelagic juveniles) of yellowtail on the Southeast Shoal.
American plaiceThere was little evidence of vertical migration by plaice lar-
vae and juveniles in the 1986-88 observations. The averagecentres of mass for day and night generally occurred at depthsexceeding 20 m (Fig. 1d,7e). Since there are no other pub-lished data on the depth distribution of the early stages of plaice,we used the mean depth for the day and night observationscombined to estimate drift (Table 2). Peak plaice concenrra-tions were located near the thermocline. with sreater than707oof the larvae and juveniles below the thermoc'iine in 1986 and1987 (Fig. 8d, 8e). As with yellowtail, bottom temperarurewas used as an index of the lower-layer thermal regime in ourevaluation of the horizontal distributions of olaice.
The horizontal distribution of plaice in September 1986 wasinversely related to that of yellowtail (Fig. 9a, 9d). Plaicedensities increased from west to east across the Shoal andpeaked along its eastem flank where bottom temperatures werebelow l 'C (Fig. 99, lOd ). Only a few plaice were found inthe western and central parts of the grid where temperaturesexceeded 2"C (Fig. 9d, 99).
The 1987 and 1988 plaice densities were approximately twoorders of magnitude lower than those from 1986. However, thedistributions were similar in all three years. In each of 1987(Fig. 9e) and 1988 (not shown), plaice were captured ar only8 of 71 stations. These were located primarilv alons the easternhalf of the grid where bottom tempeiatures *ere nJar or below0"C. There were also some occurrences of plaice at stationswith higher temperatures (Fig. 9e, th, l0e).
The ranges in iength of plaice collected during the Septembersurveys were 16-38 mm (Fig. l1d ), 25-35 mm (Fig. I le),and l0-38 mm (not shown) for 1986, 1987, and 1988, respec-tively. The mean lengths in 1986 and 1987 were 28 and 30 mm(Table 2). Growth rates of plaice larvae on the Grand Banksaverage 0.16 mnVd during May-September (Bonnyman 1983),while rates average 0.25 mm/d over the first 80 d in the Wad-den Sea (Zijlstra et al. 1982). For these growth rares and ahatching length of 4.0 mm (Fahay 1983), the mean age of rhe1986 and 1987 plaice cohorts was estimated to be in the rangesof 95-149 and 104-163 d, respectively (Table 2). Given thelimited occurrence of plaice over the Southeast Shoal, we sug-gest that their distribution is primarily influenced by LabradorCurrent advection along the Bank edge to the northeast of thestudy region. The occurrence ofplaice on the eastern Shoal mayresult from leakage of the Cunent onto the Bank followed bya weak westward drift.
Witch flounderThe depth of the centre of mass of witch larvae and juveniles
in 1988 was 2l m at night, 26 m during the day, and 23 m forboth combined (Fig. 7f; Table 2). Peak concentrations werein the thermocline (Fig. 8f). However, the larvae were broadly
258
264
264
258
264
2 3 . 2 2 3 . 1
24.7 26.0
25.7 18.7
24 .3 27 .8
29. t 30. r
22 .8 18 .3
J . )
3 . 5
3 . 5
4 .0
4 .0
4 .5
0 . r 10.250 . 1 10.250 . 1 10.25
0 . 1 60.250 . l 60.25
0.090.25
178 8078 180
205 5990 114
138 t2661 203
149 10995 163
163 101104 160
264
found on the eastern portion of the Bank where temperaturewas generally less than 2"C. The highest yellowtail concentra-tions occurred west of the peak temperatures, but the westwardlimits of the distribution were not resolved.
The 1987 yellowtail distribution (Fig. 9b) exhibited somesimilarity with that of 1986, although the average density wassubstantially lower. Maximum densities occurred on the north-western portion of the Shoal. Very few individuals were col-lected in the eastern, southern, or southeastem sections of thegrid. As in 1986, the highest catches were generally obtainedat stations where bottom temperature (Fig. th, 10b) exceeded2oC. However, the yellowtail and temperature maxima wereagain offset, with peak yellowtail densities to the north of thetemperature peak. The northwestward limit of the yellowtaildistribution was not resolved.
The average density of yellowtail in 1988 (Fig. 9c) was sim-ilar to that observed in 1986. Peak abundances were asain coin-cident with bottom temperatures above 2oC (Fig. 9i, I0.), tnithdensities declining from west to east. Unlike 1986 and 1987,the extent of the yellowtail patch was better defined and thepatch coincided with the temperature maximum. There was alsobimodality in the yellowtail-temperature relation, with highestdensities occurring at temperatures between 0 and l'C andabove 2'C (Fig. lOc). The observations from all three yearssupport a relation between the horizontal distributions of yel-lowtail and lower-layer temperature, although it is unclearwhether or not there is a direct influence.
The lengths (/) of yellowtail collected in September 1986ranged from 10 to 33 mm with a mean of 23 mm (Fig. lla;Table 2). Literature values for larval growth rate (g) range froman average of 0.1I mm/d for larvae collected over the GrandBank during June-August 1980 (Bonnyman 1983) to 0.25 mm/d for larvae reared in the laboratory at 1OoC (Smigielski 1979).Hatching length (/,) is approximately 3.5 mm (Fahay 1983).Assuming that the growth rates were similar in all areas, aswell as before and after metamorphosis, we estimate from (4)that the mean age (post-hatch) of yellowtail captured in 1986was in the range of 78-178 d (Table 2). In September 1987,the mean length of yellowtail was 26 mm (Table 2), with mostindividuals lying between22 and 34 mm (Fig. l1b), although
Can. J. Fish. Aauat. Sci.. Vol.49. 1992
1 5 3 1 1 1s5 209
415

E
)
o)o_
8
7
6
o -t
o)
2
1
0
-
q)o_tt
O
F
q)o_
E
c)o_
o
a
26
22
1 B
1 6
1 2
1 0
B
6
4
?,
0
Io * o
fr;
o
dB
f a
o
t r @D
l o o s ue S o
o q # o -oSS 6o d,, r"o.fl
- 1 0 1 0
Depth relative to thermocline-20 0 20
Depth relative to thermocline
Ftc. 8. Scatter plots of larval density versus depth (m) relat ive to the thermocline lor yel lowtai l in (a) 1986, (b) 1987. and (c) 1988, plaice in(d ) 1986 and (e ) 1987, and (0 w i tch in 1988.
o { o
o o o t r E J d o E o o
a E o o 6 o o i f t o e g l Q r o t r t r @
d )
o
o t rr t r
di , ,
F: B B*r _ n
;
o o n P o _
above i
O l
t o
I t r
n o l
o r Q ! t r
o l o_ c a - i do o n "(:i -m
f )
r t ri
l o o
i d
Do n
G D _
orih o o Er
D
t r q - n t
irpil.i
Can. J. F ish. Aquat. Sci . , Vol . 49, 1992

a )
A BC D
: , 2 3 ' . \ 4 64230 N
a530 N
Ih Pr .6 AB
C Dd )
. 1
IC
. 1
. 1 ) 2 i r 3 i l 4 ' - . r 5 , . _ l O
g w r i w a ' w 4 9 w
4330 N
4230 N
4530 N
u30 N
{:o r
s iw s iw *w rCw
i )
- r -A
, t 'n\\\ ( ) )
?Ut\;
t jw 5 'w
:o 'w .9 w
4 S N
s3o N
4330 N
FIc.9. Distr ibutions ofdepth-averaged larval density and bottom temperature (g, h, i) from surveys during (a, d, g) l3-18 September 1986(days 256-261), (b, e, h) l '7-26 September 1987 (days 260-269), and (c, f . 1) 11-23 September 1988 (days 261-267). Larval distr ibutions areshown fbr yel lowtai l in (a) 1986, (b) 1987, and (c) 1988. plaice in (d ) 1986 and (e) 1987. and (0 witch in 1988. Keys to the expanding symbols:( a , b , c ) l : n o n e , 2 : 0 . 0 5 - 0 . 1 3 , 3 : 0 . 1 3 - 0 . 3 1 . 4 : 0 . 3 1 - 0 . 7 8 . 5 : 0 7 8 - 2 . 0 , a n d 6 : > 2 . 0 ; ( d , e , f ) 1 : n o n e , 2 : 0 . 0 5 - 0 . 1 , 3 : 0 . 1 - 0 . 2 , 4 : 0 . 2 - 0 . 4 ,5: 0.4-0.8, and 6: >0.8,where al l densit ies are numbers per 100 mr. Centroid posit ions and second moments of the larval distr ibutions are alsoshown. The capital letters (A, B, C, D) indicate the inferred spawning locations presented in Table 3.
s )
C
. t
Can. J. F ish. Aquar. St i . , VoL.19, 1992 411

l . )
1.4
l . l
t . 2
L l
I
0.9
0 .8
0 .7
0 6
0 5
0.,1
0.3
0 2
0.1
0
a )
o
- oU D
o ^ o
oo o o o o o o
t . 5
1 .4
r . 3
1 . 2
1 . 1
l
0.9
0 .8
0 . 7
0.6
0.5
0.4
0.3
0.2
0 .1
0
b )
o
o o
. o Bu oU D
o o o o @ o t r e
3
2.8
2 .6
2 .2
2
1.8
1 . 6
1 .4
1 . 2
I
0.8
0.6
0.4
0 .2
0
0 2 4
I emperature. L
distributed over the water column, with roughly equal propor-tions occurring above and below the thermocline. As with theother species, we used bottom temperature as an index of thelower-layer thermal regime in examining the horizontal distri-bution of witch.
478
1 . 5
t . 3
t 2
I . I
I
0.9
0 8
0.7
0.6
0.5
0.4
0.3
0.2
0 .1
0
e )
0 )
f )
t r t r oo !
o o
n . - u L J
h "
n n o # # E
0 2 1
Temperature, C
Witch occurred as single individuals at only 2 of 4'7 stationsin September 1986 and 3 of 7l stations in 1987. They wereabundant during the 1988 survey (Fig. 9f) when their averagedensity equalled that of yellowtail. In 1988, witch larvae andpelagic juveniles were most abundant over the central, western,
tr
Az
o
z
1 . 5
1 .4
1 . 3
1 . 2
L l
o u . /
. 0.6
z 0.50.4
0 .3
0 .2
0 .1
!
z
3 5
- 2 .5
, 2
zz
FIc. 10. Scatterplots of larval abundance versus bottom temperature for yellowtail in (a) 1986, (b) 1987, and (c) 1988, plaice in (d ) 1986 and(e) 1987, and (f l witch in 1988.
d )
oo
o
oa -
o u ^o c b o o ' o E
c )
oo
O O
o
o
oo t r o q .
O n t r
o o oo
o
o
oo o
o
O Oo
o E E o -o o " . !
Can. J. F ish. Aquat. Sci . , Vol .49, 1992

30
28
26
21
22
20( ) . -oo rd
^00.) t2P
l 0
6
6
4
2
q)
()
40
35
30
25
?0
l 5
l 0
5
0
a) yel lowtai l , 1986
3 6 I 12 15 18 21 21 2 ' t 30 31 36 39
d) American plaice, 1986
9 t2 15 18 21 21 2 ' t 30 33 36 19
9 t 2 1 5 1 8 2 t 2 1 2 1 3 0 3 3 1 6 1 9
b) ycl lowtai l , 1987
I 6 9 t2 15 18 21 24 2 ' l 30 3 l 16 39
c) yel lowtai l , 1988
9 12 15 18 2 t 24 2 ' t 30 33 36 39
Length, mm
FIc. 1l. Length frequency distributions of yellowtail in (a) 1986,1988.
Can. J. F ish. Aquat. Sci . , Vol .49, 1992
f l wi tch. 1988
CO JU
c.)()ro ) 0
(.) -"
20
to
22
20
t 8
C) t6
a) tz
8
6
4
2
20l 9l l Jt 1
1 5l , l
l 3(.) .^bo t tr w l l
s r 9( ) 8
6
5
4
3
2.
I
3 6 9 12 t5 t8 2 l 24 2 ' t 30 33 36 >39
Length, mm
e) American pla ice, 1987
(b ) 1987, and (c ) 1988, p la ice in (d ) 1986 and (e ) 1987. and (0 w i tch in

and northwestern portions of the survey area, particularly wherebottom temperatures exceeded 2"C (Fig. 9f, 9i, l0l). Theywere absent from the eastern edge of the survey where tem-peratures were near 0'C. The witch distributions were thus sim-ilar to those of yellowtail, with maximum densities occurringin relatively warm bottom waters (Fig. 9).
The length of witch collected in 1988 ranged fiom 5 to50 mm, with a mean of 19 mm (Fig. I lf). The only publishedestimate of growth rate for witch (0.09 mm/d ) is based onmonthly collections from the southern Grand Bank (Bonnyman1983). We assumed an upper l imit growth rate of 0.25 mn/dconsistent with that of the other two species. Given a hatchinglength of 4.5 mm and the above growth rates, we estimated amean age for witch in our samples ranging from 55 to 153 d(Table 2).
Inlerred Spawning Posit ions
To examine whether the larval distributions and the esti-mated ages at capture are consistent with passive advection tiomsites with historical distributions of prespawning fishes, we used(5) to estimate the spawning (hatching) sites by species and yearfor a range of input values. Examination of (4) and (5) indicatesthat there will be uncertainty in the infened sites associated withuncertainties in 1,, 1,, g, Xr, and the horizontal and vertical struc-ture of u,, (taking passive advection as a given). However. con-
sideration of the available information suggests that the largestcontributors to this uncertainty are the growth rates, the depthof the larvae during the drift period. and horizontul structure inthe currents near the Bank edge. To provide approximatebounds on the l ikely sites, we show in Table 3 the expectedlarval displacements (Xt - Xi) for fbur cases (A. B, C, D) fbreach species and year. These are estimates based on the twodifferent mean ages (or spawning dates) shown in Table 2 andestimates for currents typical of the upper (A, C) and lower (B,D) water columns (current meters). For yellowtail and witch,current measurements from the respective ycars are used, whilethe 1987 measurements from the eastern mooring site are usedfor plaice in both 1986 and 1987. The estinated spawning posi-tions for the different cases are indicated in Fig. 9.
For most of the cases considered. the infened spawning posi-tions are off the Bank in areas which are represented poorly bythe moored measurements. The specific positions in those caseshave limited meaning, but the prediction of remote spawningsites under the assumed conditions should neverthe less be valid.In particular. the moored measurements of upper-layer currentsstrongly suggest that, if larvae occupy these surfhce watersthrough the summer and are transported passively. spawningmust occur well away from the Southeast Shoal (cases A. C).In contrast. passive advection by lower-layer curents doesallow for spawning sites in the vicinity of the Shoal, particularlyif growth rates approximate 0.25 mm/d (case D).
li - ,\j Currcnt sourcc:(km) period and mooring No
Tnsr-e 3. Estimated displacements of spawning posit ions (.r, , r ' , ) from September observation posit ions(x,, ,r,) for various species and years. Results are shown fbr four cases for each species/year: two diffcrentspawning dates (growth rates) taken from Table 2 and drifts as measured at the upper (cases A. C) andlower (cases B. D) cunent meters. A posit ive -r-displacement denotes a spawning site to the east of theSeptember larval position, and a positive r'-displacement denotes a spawning position to the north ofthe September position. Where current measurements are available for the entire drift period, they areused; otherwise th
Spawning Drift ri - -rrCohort Case date (d) depth (m) (km)
Yellowtai lI 986
I 987
lgt iu
Plaicel9u6
I 987
Witchl 9u8
Bt_D
B
D
B
D
80 20 37045 290
180 20 16045 170
59 il 49044 120
t14 I I 28044 39
126 13 25063 94
203 13 I l 06 3 2 l
370 Record nrean (a 77zl- 290- 160
190 Days lt l0-258 (rr 77453 Rccord mean (r 830
-9010 Days l74 26zl (o 83054 Record mcan (a 83033 Days 126-262 (tt t3tt758
130 Days 203-262 (a 8874
420 Record mean (tr 8322U0270I ttO4603 1 0290230 Days 160-264 (a 832
40 Rccord mean (a 887- 1 0130 Days 209 262 @ 881
)
A 109 t2B 4 5c 1 6 3 t 2D 4 5A l 0 l t 28 4 5c 160 t2D 4 5
28061
1 8 04 l
3 r 010
200I J
A l i l 13 280B 6 3 l l 0c 209 13 l l 0D 6 3 2 8
Can. J. F ish. Aquut. St i . , Vol .19, 1992

Yellowtail flounderFor yellowtail. the observed 1987 and 1988 larval distribu-
tions are consistent with spawning over the Shoal if larvae driftwith the lower-level currents and experience a high growth rate(case D) (Fig. 9b, 9c). The bottom temperature distributions(Fig. 3) during the late June/early July spawning times inferredfor the high growth rate for 1987 and 1988 show values above2"C in the vicinity of the inferred spawning sites. Although themeasured (northwestward ) lower-level currents in 1986 werestronger than in 1987 and 1988 (Fig. 5) and imply an off-bankspawning site, the bottom temperature (and salinity, not shown)distributions (Fig. 3) suggest persistence of relatively warmbottom water over the Shoal during spring-summer and anintrusion of water from the west. Given the suggested increasedspatial structure of the near-bottom currents in 1986, the pos-sibil i ty that lower-layer residence times were greater than thatimplied by the current measurements cannot be discounted. Forthe other cases (A, B. C), the inferred yellowtail spawning siteswere off the Bank, although the sites for lower-level drift andslow growth in 1987 and 1988 were close to the Shoal.
American pLaiceGiven that the September plaice distributions were concen-
trated along the eastern edge of the Bank where the measuredcurrents were southward, the inferred spawning positions arewell to the north of the study area. Only the slower growth rateyielded spawning times (Table 2) consistent with historicalinformation. The inferred spawning positions under these con-ditions are in the vicinity of historical spawning sites on thenorthern northeastern Grand Bank (Fig. 6), but it is not pos-sible to discriminate between upper- and lower-layer drift.However, passive advection in the core of the Labrador Currentwhere the residual current soeeds are substantiallv sreater thanthose observecl at the eastern moor ing s i te lMoui ta in l9 l {0:Greenberg and Petrie 1988) would not lead to the distributionobserved. The bottom tempcratures on the eastem Bank in thestudy years (Fig. 3) are consistent with a cold intermediatelayer, with temperatures in the range observed historically forp la ice spawning.
Witch flounderGiven the low densities of witch observed in I 986 and I 987.
we estimated spawning sites for 1988 only. In that year therange of expected growth rates generates spawning times thatare consistent with historical observations and. assuming driftwith the lower-level currents, implies spawning positions(Fig. 9f) which bracket the historical sites. In contrast, driftin the upper-level currents would require spawning positionswell off the Bank. There are, however, some unresolved ques-tions regarding the witch distributions (in addition to theiroccurrence in l98ti but not 1986 and 1987). Lower-level pas-sive drif i and a high growth rate (D) are unlikely, since theyimply a Shoal spawning site inconsistent with the historicalinformation presented in Bowering (1990a). Lower-level drif irequires a slower growth rate (similar to B) in order to have anoff-bank spawning site. However, our l imited information oncurrents and hydrography on the eastern side of the Bank in1988 makes thc cxpectcd spawning posi t ion and i ts consistencywith the temperature range of witch unclear. Thus, a witchspawning site on the eastern sidc of the Bank together withpassive lower-layer drif i cannot be discounted for 1988,although there is no direct evidence fbr this.
Cun. J. F ish. Aquat. St i . , Vol . 19, 1992
Discussion
The horizontal distributions of larvae and iuveniles of thethree flatfish species show a striking correspondence to the bot-tom temperature distributions, suggesting a probable influenceof the physical environment on the early life stages of flatfishon the southern Grand Bank. Correlation analyses betweendepth-averaged densities and temperature and salinity at var-ious vertical levels generally yielded the highest (significant)correlations for bottom temDerature. There are. however. sev-eral unresolved questions. in particular, the full extent of theflatfish and temperature features was not resolved by the surveygrids, the flatfish and temperature maxima appear to be offsetin some cases (yellowtail in 1986 and 1987), the flatfish dis-tributions extend through the thermocline into the upper layerwhile the bottom temperaures are representative of depths below25-30 m (Fig. 2), and the mechanism(s) underlying the cor-respondence is unclear. It is unclear whether there is a directtemperature influence on larval distributions or whether larvaldensities and temperature are indirectly related by some com-mon correlate (e.9. diff 'erent water masses). One possiblescenario linking larval distributions directly to temperature ispassive advection of the eggs and larvae in subthermoclinewaters followed by active seeking, by late-stage larvae andjuveniles, of the adults' preferred bottom temperature.
The vertical distributions observed during the September lar-val surveys are of l imited value in identifying the origin of thelarvae-temperature relation. Plaice distributions were domi-nantly subthermocline, but yellowtail and witch were distrib-uted over the range of sampled depths with centres of mass nearthe thermocline. It is possible that the dominant sampling above40 m missed a significant number of older larvae and juvenilesat depth and biased the centres of mass towards the surface.Some support for this comes from annual flatfish surveys con-ducted in September over the southern Grand Bank usingbottom trawling gear which occasionally capture 0-group yel-lowtail and plaice as small as 2 cm standard length (S. J. Walsh,Department of Fisheries and Oceans, St. John's, Nfld., pers.comm.). On the other hand, the observed depth distributions,especially the high concentrations near the thermocline, maypromote fast growth and high survival for those individualsoccupying depths of maximum thermal gradients, as previouslydocumented for fish larvae inhabiting oligotrophic lake systerns(e.g. see Wurtsbaugh and Neverman 1988).
Comparison of spawning sites inferred from the observeddistributions and measured currents with historical concentra-tions of mature fishes provides some support for the hypothesisof passive advection in some but not all cases, and then onlywith significant provisos. For two of the three years sampled(1987, 1988), the yellowtail distributions were consistent withpassive advection from a Southeast Shoal spawning site pro-vided that the survivors drift in the lower water column and thegrowth rate is near the maximum value considered (0.25 mm/d ). The spawning times inferred from this growth rate approx-imate historical descriptions, and the bottom temperaturesobserved in the vicinity of the inferred spawning locations andtimes are consistent with reported temperature preferences ofadult yellowtail. However, the 1986 infened spawning site foryellowtail was implausible. This may have been due toincreased spatial structure in the lower-layer drift. Observationsof yellowtail egg and early-stage larval distributions in otheryears (May-June 1983 (J. Anderson, Department of Fisheriesand Oceans, St . John's , Nf ld. , pers. comm.) , Ju ly 1985) sup-
4 8 1

port their persistence over the Shoal in summer as well as theiroccurrence to the northwest.
The observed plaice distributions in all three years suggestspawning along the northern or northeastern Grand Bank fol-lowed by southward advection in the Labrador Current. Forplaice the current data are not adequate to discriminate betweenupper- and lower-layer drift. The historical spawning times forplaice are consistent with the slower growth rate considered(0. 16 mm/d ), and the historical sites imply slow rates of larvaldrift in the bankward portion of the Labrador Current.
For witch, there was little evidence that the 1988 distributionon the Shoal was consistent with historical spawning sites,although the possibility that they resulted from passive lower-layer drift from the Bank's eastem edge and a relatively slowgrowth rate could not be discounted. Among the three speciesstudied, witch has the longest pelagic phase (up to I yr) (Scottand Scott 1988), suggesting that slow growth is a reasonableapproximation. Indeed, the cooccurrence of yellowtail (histor-ical spawning on the Bank) and witch (historical spawning onthe sides of the Bank) larvae on the Bank in 1988 requires eitherearlier spawning for witch (and subsequent drift through theyellowtail spawning area) or dominant behavioural influencesfor one of the species.
While most of the above evidence in support of the passiveadvection scenario is inadequate to exclude the possibility thatthe distributions result from behavioural mechanisms which actto govern the observed larval and juvenile distributions, theobservations on diel pattern of depth distribution provide littlesupport for retention via diel vertical migration. The centres ofmass for the nighttime distributions were only about 5 m deeperthan those for the daytime distributions, and larval drift trajec-tories computed on the assumption of a diel migration betweenthe observed time-varying currents (linearly interpolated fromthe moored measurements) were little different from those gen-erated by assuming drift at the average depth of the centre ofMASS.
The observations point to significant interspecies and inter-annual variations in larval abundance and distribution, as wellas persistent features within species from year to year. Theplaice larvae were consistently associated with the relativelycool bottom water along the Bank's eastern edge. They werealso more abundant in 1986 coincident with an increase in thedistribution of cooler water on the Bank. These conditions arosefrom displacement of Labrador Current water onto the Bank inAugust 1986 during the most energetic (summertime) windevent of the three years. The associated increase in plaice abun-dance is consistent with the inferred advection ofplaice south-ward along the bankward edge of the Labrador Current.Yellowtail distributions were qualitatively similar in the threeyears. However, witch distributions differed greatly, beingmore abundant in 1988 than in 1986 and 1987 without anyunusual environmental conditions having been detected.
It appears that changes in spawning stock biomass can bedismissed as a cause for the large interannual differences inlarval and juvenile densities. For yellowtail, research vesselsurveys showed a decline in age 5 * abundance from 189 (mil-l ions) in 1986 to 168 and 98 and 1987 and 1988, respectively,while commercial catch rates indicated no change in stock sta-tus (Brodie et al. 1990b). In contrast, ourlarval surveys suggestthe lowest densities during 1987 and approximately equal andmuch higher densities during 1986 and 1988. All indicators forplaice (research vessel suryeys, catch rates, and sequential pop-ulation models) indicate that there was no detectable change in
482
adult abundance between 1986 and 1988 (Brodie et al. 1990a).Results from research vessel surveys for adult witch are incon-clusive because of incomplete coverage of the expected distri-bution of adults (Bowering 1990b). However, commercial catchrates show a decline of about 40Vo between 1986 and 1988(Bowering 1990b). If catch rates in the witch fishery are indic-ative of stock biomass, this implies a significant decline duringthis period, a result which contrasts with our ichthyoplanktonsurveys which yielded much higher catches of witch in 1988.
Overall, the larval distributions of plaice and yellowtail showsimilar patterns in the three years surveyed, apparently relatedto the bottom temperature variation across the southern GrandBank. Although the mechanism underlying this temperaturerelation remains unclear, the available information on currentssuggests that the distributions can be explained by passiveadvection, provided the larvae are in the lower water columnand growth rates are close to maximum for yellowtail and closeto minimum for plaice. Given the limited information availableon vertical distributions of larvae and the horizontal structureof currents, it must be emphasized that this consistency doesnot exclude other scenarios requiring significant behaviour. Thedistribution of witch was not consistent in the three years (hav-ing a significant occurrence in only one year). There is morelimited support for its distribution being consistent with passiveadvection, although it cannot be discounted.
Acknowledgements
We thank the many individuals who contributed to the execution ofthe field program. C. Ross made a major contribution to the physicaloceanographic component, and J. McRuer, D. Reimer, and P. Vassmade important contributions during the preparation and execution ofthe biological component. J. Simon, E. Dalley, R. Stone, L. Allen,B. McKenzie, C. Parsons, and H. Budgey also assisted during theprogram. M.-J. Graca assisted with the physical data analysis. Thisresearch was funded by the Department of Fisheries and Oceans, andby the Natural Sciences and Engineering Research Council ofCanadathrough a Strategic Grant to W. C. Leggett.
References
Bot{Nryr!,hN, S. 1983. Ichthyoplankton of the Grand Banks of Newfoundland.Grand Banks Oceanographic Study, Mobit Oil Canada, Ltd, St. John's,Nfld,
BowenrNc, W. R. 1976. Distribution, age and growth, and sexual maturity ofwitch flounder (Glyptocephalus cynoglossus) in Newfoundland waters. J.Fish. Res. Boird Can. 33: 15'74-1584.
1990a. Spawning of witch flounder (G/ypto cephalus cynoglossus L. )in the Newfoundland-Labrador area of the No(hwest Atlantic as a func-tion of depth and water temperature. Fish. Res. 9:23-39.
1990b. Witch flounder in Divisions 3NO. NAFO SCR Doc. 90/54.Ser. No. N1775: 6 p.
BRoDrE, W. B. , W. R. BowrnrNc, ANDJ. W. Brrno. 1990a. An assessmentof the American plaice stock in Divisions 3LNO. NAFO SCR Doc. 90/80 , Se r . No . N1802 :32 p .
BRoDrE. W. B., S. J. WeLsH. rNo W. R. BowrnrNc. 1990b. Yellowtail floun-der in NAFO Div. 3LNO - an assessment of stock status. NAFO SCRDoc. 90/86, Ser. No. Nl8l2: 24 p.
CenscnooeN, J.8. , K. T. FuNx, nNob. S. Mrr , rEn. 1989. Capebn(Mal lotusvillosus) spawning on the Southeast Shoal: influence of physical factorspast and present. Can. J. Fish. Aquat. Sci. 46: l'143-l'754.
FrHnv, M. P. 1974. Occurrence of silver hake, Merluccius bilinearis, eggsand larvae along the middle Atlantic Continental shelfduring 1966. Fish.Bu l l . 72 :813 -830 .
1983. Guide to the early stages of marine fishes occuning in thewestem North Atlantic Ocean, Cape Hatteras to the southern Scotian Shelf.J. Northwest Atl. Fish. Sci. 4: 423 o.
Can. J. Fish. Aquat. Sci., Vol. 49, 1992

Fttzpatnrcr , C. . aruo R. J. Mt lEn. 1979. Review of spawning t imes andlocations fbr some commercial finfish on the Newfoundland and Labradorcoasts. Fish. Mar. Serv. Tech. Reo. 905: v + 14 o.
FtqNr. K. T. . eru J. E. Censceoor\ . 1989. Facrors af l 'ect ing recrui tmenlvariability of capelin (Mallotus vi1losls) in the Northwest Atlantic. J. Cons.Int . Explor . Mer 45: 146-164.
Gt<EENElEnc. D. A., eNo B. Pr.rRrr-. 1988. The mean barotropic circulation onthe Newfoundland shel fand s lope. J. Geophys. Res. 93: 15541-15550.
Huxuoa, H. , R. J. GpsergercH, AND A. E. Hev. 1989. A s imole three-dimensional model of the c i rculat ion of fNewfoundland. J. Geoohvs. Res.9 4 : 1 2 6 0 7 - 1 2 6 1 8 .
Looen, J. W. 1991. Summertime bottom temperatures on the Southeast Shoalof the Grand Bank, and implications for exchange rates. Can. J. Fish.Aqua t . Sc i . 48 : l 3 l 6 -1325 .
LoDER, J. W., AND C. K. Ross 1988. Moored current and hydrographic meas-urements on the Southeast Shoal of the Grand Bank in 1986 and 1987.NAFO SCR Doc . 88 /61 , Se r . No . N1520 :21 p .
Looen, J. W.. C. K. Ross, aNo P. C. SMtrH. I988. A space- and t ime-scalecharacterization of circulation and mixing over submarine banks, withapplication to the northwestem Atlantic shelf. Can. J. Fish. Aquat. Sci.4 5 : 1 8 6 0 - 1 8 8 5 .
McKENzt, R. A. 1955. Canadian At lant ic f lounder f ishery. Fish. Res.Can. MS Rep. 596.
MouNrerN. D. 1980. Direct measurements in the Labrador Cunent. Jphys. Res. 85: 4097-4100.
MyF.Rs, R. A. , aNo K. F. Dnrtxwerun. I 988. Ekman transDort and larval f ish\urv ival . Biu l . Oceanogr. 6: ,15 h4.
NEvrNsry, M. M.. eNo V. P. SsREenyrxov. 1973. American pla ice, Hippo-gktssoides platessoides Fabr., spawning in the Northwest Atlantic area.Int . Comm. Northwest At l . F ish. Res. Bul l . l0 : 23-36.
Pe'rnre, 8. , S. AxnNneeo, J. LAZTER, rNo J. Looen. 1988. The cold inter-mediate layer on the Labrador and Northeast Newfoundland shelves.1978 -1986 . NAFO Sc i . Counc . S tud . 12 :51 69 .
PETRIE, 8. , aNo C. ANocRsoN. 1983. Circulat ion on the Newfbundland con-t inentaf shel f . Atmos.-Ocean 2l :201 226.
PITI, T. K. 1966. Sexual maturity and spawning of the American plaice, Hip-poglossoides platessoides (Fabricius), from Newfoundland and GrandBank areas. J. F ish. Res. Board Can. 23:651-672.
1970. Distribution, abundance, and spawning ofyellowtail flounder,Limanda ferruginea, in the Newfoundland area of the Northwest Atlantic.J. F ish. Res. Board Can. 27: 2261-227 1.
Ross, C. K. , J . W. Loosn, rNo M.-J. GRAqA. 198u. Moored current andhydrographic measurements on the Southeast Shoal of the Grand Bank,1986 and 1987. Can. Data Rep. Hydrogr. Ocean Sci . 7 l : 132 p.
Srvt- :oro, D. D. , L. O. JenoszyNsxr, aNo W. B. FRASER. 1980. BIONESS.a new design in multiple net zooplankton samplers. Can. J. Fish. Aquat.Sc i . 37 :722 124 .
Scorr , W. B. , aNo M. G. Scorr . 1988. At lant ic f ishes of Canada. Can. Bul l .F i sh . Aqua t . Sc i . 219 :731 p .
StncLetn, M. 1988. Marine populations: an essay on population regulation andspeciation. University of Washington Press, Seattle, WA. 252 p.
StNcr-rrn, M., eNo T. D. I les. 1988. Populat ion r ichness of mar ine f ish spe-cies. Aquat. L iv ing Resour. l :71 83.
Svrcrelsrt, A. S. 1979. Induced spawning and larval rearing ofthe yellowtailflounder, Limanda ferruginea. Fish. Bull. 76: 931-936.
SurrH, W. G., J . D. SrsuNrr . eNo A. Wsr-r-s. 1978. Diel movements of larvalyellowtail flounder, Limanda ferruginea, determined from discrete depthsamplng. Fish. Bul l . 16: 167-118.
WrlsH, S. J. 1991. Commercial fishing practices on offshore.juvenile flatfishnursery grounds on the Grand Banks ofNewfoundland. Neth. J. Sea Res.27:423-432.
Wel ls, R. , W. B. Bnoore, C. A. BlsHop, ,qr . roJ. W. Bnrno. 1988. Distr ibut ionand abundance of three fish species on the Grand Bank in relation to depthand temperature of the water. NAFO SCR Doc. tl8/94, Ser. No. 1546:2 6 p
WunrsaeucH, W. A. , AND D. NsvsnueN. 1988. Post- feeding thermotaxis anddaily vertical migration in a larval fish. Nature (Lond.) 333: 846-848.
Zulsru, J. J., R. DeppEn, nNo J. Wrrrr-. 1982. Settlement, growth and mor-tality of post-larval plaice (Pleuronet.tes platessa)in the westem WaddenSea. Neth. J. Sea Res. 15:250-272.
Board
Geo-
Cun. J. F ish. Aquat. Sci . , Vol .19, 1992 483