PHYSICAL MODELLING OF EMERGENCY REPAIRS...
10
Proceedings of the 6 th International Conference on the Application of Physical Modelling in Coastal and Port Engineering and Science (Coastlab16) Ottawa, Canada, May 10-13, 2016 Copyright ©: Creative Commons CC BY-NC-ND 4.0 PHYSICAL MODELLING OF EMERGENCY REPAIRS TO THE MAIN BREAKWATER OF CALSHOT HARBOUR ON TRISTAN DA CUNHA ISLAND JOHAN KIEVIET 1 , PAUL BOUTON 2 , FRANS VAN EEDEN 2 1 Council for Scientific and Industrial Research, South Africa, [email protected] 2 WSP Group Africa (Pty) Ltd, South Africa, [email protected], [email protected] ABSTRACT The main breakwater of Calshot Harbour on Tristan da Cunha Island was severely damaged by major storms. Quasi 3D stability testing for the emergency repairs of the main breakwater was carried out at the hydraulics laboratory of the Council for Scientific and Industrial Research (CSIR) in Stellenbosch, South Africa. The option to repair the damaged section of trunk, close to the roundhead, with 10 t dolos units was tested. A 4m wide Quasi 3D flume was used for the stability tests at a scale of 1:42.8. The construction method used, in particular the “fence post” packing method and interlocking of armour units into the core as well as roughening of the bathymetry profile makes the physical model tests presented in this manuscript unique. KEWORDS: Physical model, Emergency repairs, Breakwater, Calshot Harbour, Tristan da Cunha. 1 PROJECT BACKGROUND 1.1 Harbour History Leading to Emergency Repairs Being Required Access to the island was originally gained by longboats landing on a gravel beach. The gravel beach was however covered by lava flows during a volcanic eruption in 1961. The islanders were evacuated and returned in 1963. Calshot Harbour was then constructed in 1965 for the re-establishment of the crayfish industry. The new harbour was located to the west of the original gravel beach (Tristan da Cunha Government & the Tristan da Cunha Association, 2015). The newly constructed harbour was protected by gabions and opened in 1967. The harbour was however shallow and resulted in even modest waves, breaking in and around the entrance. This resulted in the harbour being closed on most days of the year (Vonk et al., 2007). By 1990, small seaward extensions were built on both breakwaters and a dolos layer added on the seaward side. The dolos breakwaters were then extended even further seaward between 1992 -1994. Harbour quay walls and a slipway was also added during this time (DFID, 2011). Although 3.5 t dolosse was mainly used for armouring, 2.5 t dolosse was placed on the base of the trunk and 1.77 t dolosse in front of the splash wall at the root of the breakwater (Vonk et al., 2007). Following a near failure of the western breakwater, a decision to carry out a structural survey of the harbour and breakwaters as well as to design for the rehabilitation and improvements of both structures was made in 2006. In 2008 – 2009 part of the rehabilitation process involved thickening the capping, repairing quay walls and adding 3.5 t dolosse above water on both breakwaters. Nine months after the repairs took place, new dolosse were already missing (DFID, 2011). In August 2010, a storm removed the dolos armouring on the western breakwater head. This resulted in core material being exposed and a portion of capping being undermined and lifted. Any further undermining of the capping and erosion of core material at such a stage of damage could lead to a collapse of the roundhead and total breakwater failure. This led to an emergency repair exercise being planned to start in early 2011. A picture of Calshot Harbour after the 2010 storm is shown in Figure 1. WSP Africa Coastal Engineers (Pty) LTD was commissioned by the Department for International Development (DFID) in assisting with proving a workable solution for the emergency repairs. WSP Africa then requested the CSIR Coastal and Hydraulics Laboratory to conduct stability tests for the emergency repairs. 1
Transcript of PHYSICAL MODELLING OF EMERGENCY REPAIRS...

Proceedings of the 6th International Conference on the Application of Physical Modelling in Coastal and Port Engineering and Science (Coastlab16) Ottawa, Canada, May 10-13, 2016 Copyright ©: Creative Commons CC BY-NC-ND 4.0
PHYSICAL MODELLING OF EMERGENCY REPAIRS TO THE MAIN BREAKWATER OF CALSHOT HARBOUR ON TRISTAN DA CUNHA ISLAND
JOHAN KIEVIET1, PAUL BOUTON2, FRANS VAN EEDEN2
1 Council for Scientific and Industrial Research, South Africa, [email protected] 2 WSP Group Africa (Pty) Ltd, South Africa, [email protected], [email protected]
ABSTRACT
The main breakwater of Calshot Harbour on Tristan da Cunha Island was severely damaged by major storms. Quasi 3D stability testing for the emergency repairs of the main breakwater was carried out at the hydraulics laboratory of the Council for Scientific and Industrial Research (CSIR) in Stellenbosch, South Africa.
The option to repair the damaged section of trunk, close to the roundhead, with 10 t dolos units was tested. A 4m wide Quasi 3D flume was used for the stability tests at a scale of 1:42.8. The construction method used, in particular the “fence post” packing method and interlocking of armour units into the core as well as roughening of the bathymetry profile makes the physical model tests presented in this manuscript unique.
KEWORDS: Physical model, Emergency repairs, Breakwater, Calshot Harbour, Tristan da Cunha.
1 PROJECT BACKGROUND
1.1 Harbour History Leading to Emergency Repairs Being Required
Access to the island was originally gained by longboats landing on a gravel beach. The gravel beach was however covered by lava flows during a volcanic eruption in 1961. The islanders were evacuated and returned in 1963. Calshot Harbour was then constructed in 1965 for the re-establishment of the crayfish industry. The new harbour was located to the west of the original gravel beach (Tristan da Cunha Government & the Tristan da Cunha Association, 2015).
The newly constructed harbour was protected by gabions and opened in 1967. The harbour was however shallow and resulted in even modest waves, breaking in and around the entrance. This resulted in the harbour being closed on most days of the year (Vonk et al., 2007).
By 1990, small seaward extensions were built on both breakwaters and a dolos layer added on the seaward side. The dolos breakwaters were then extended even further seaward between 1992 -1994. Harbour quay walls and a slipway was also added during this time (DFID, 2011). Although 3.5 t dolosse was mainly used for armouring, 2.5 t dolosse was placed on the base of the trunk and 1.77 t dolosse in front of the splash wall at the root of the breakwater (Vonk et al., 2007).
Following a near failure of the western breakwater, a decision to carry out a structural survey of the harbour and breakwaters as well as to design for the rehabilitation and improvements of both structures was made in 2006. In 2008 – 2009 part of the rehabilitation process involved thickening the capping, repairing quay walls and adding 3.5 t dolosse above water on both breakwaters. Nine months after the repairs took place, new dolosse were already missing (DFID, 2011).
In August 2010, a storm removed the dolos armouring on the western breakwater head. This resulted in core material being exposed and a portion of capping being undermined and lifted. Any further undermining of the capping and erosion of core material at such a stage of damage could lead to a collapse of the roundhead and total breakwater failure. This led to an emergency repair exercise being planned to start in early 2011. A picture of Calshot Harbour after the 2010 storm is shown in Figure 1.
WSP Africa Coastal Engineers (Pty) LTD was commissioned by the Department for International Development (DFID) in assisting with proving a workable solution for the emergency repairs. WSP Africa then requested the CSIR Coastal and Hydraulics Laboratory to conduct stability tests for the emergency repairs.
1
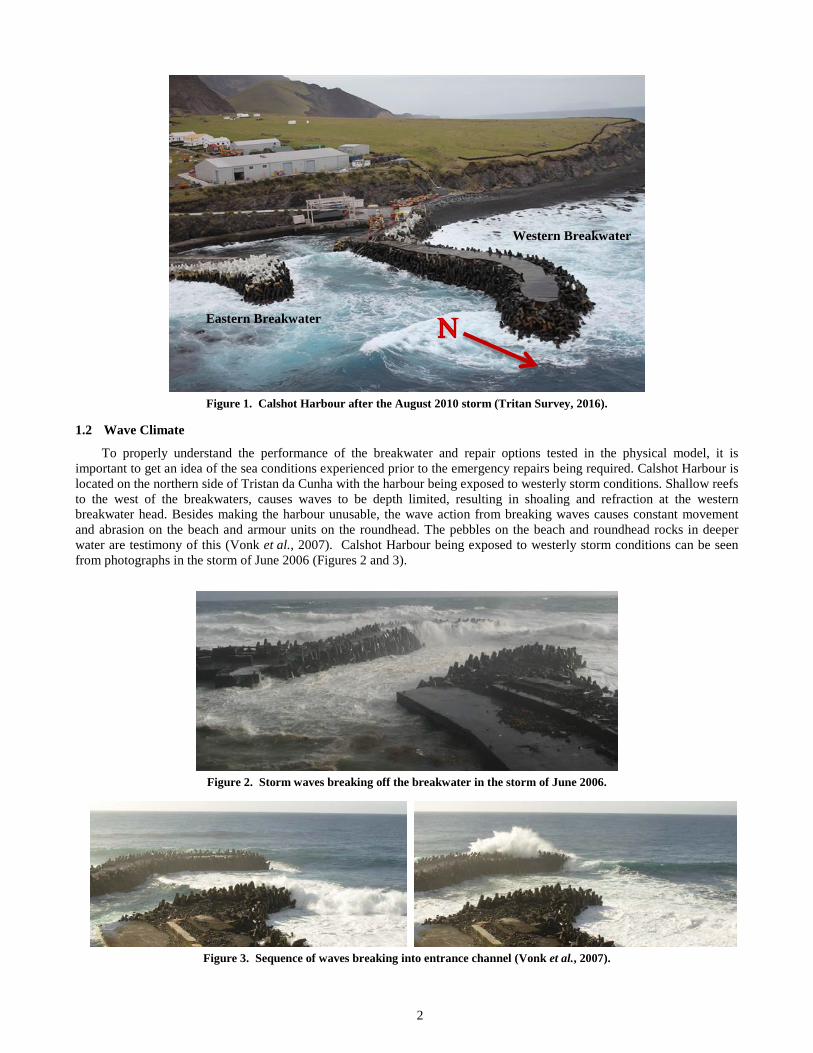
Figure 1. Calshot Harbour after the August 2010 storm (Tritan Survey, 2016).
1.2 Wave Climate
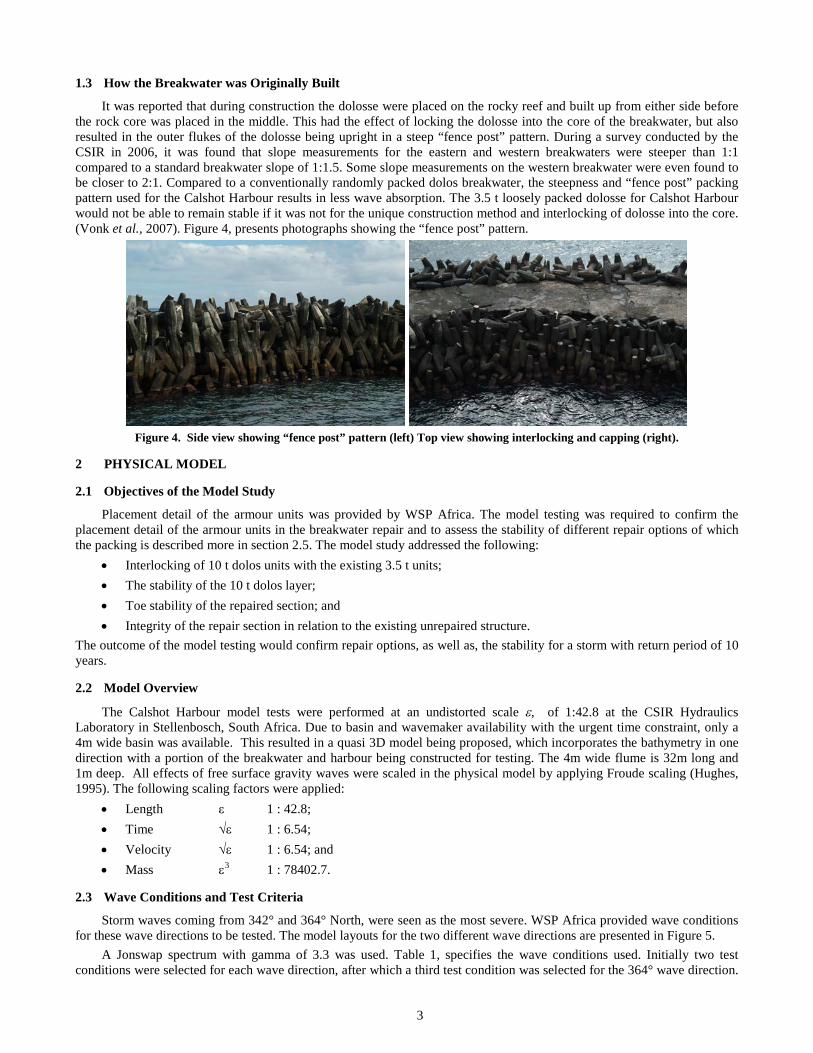
To properly understand the performance of the breakwater and repair options tested in the physical model, it is important to get an idea of the sea conditions experienced prior to the emergency repairs being required. Calshot Harbour is located on the northern side of Tristan da Cunha with the harbour being exposed to westerly storm conditions. Shallow reefs to the west of the breakwaters, causes waves to be depth limited, resulting in shoaling and refraction at the western breakwater head. Besides making the harbour unusable, the wave action from breaking waves causes constant movement and abrasion on the beach and armour units on the roundhead. The pebbles on the beach and roundhead rocks in deeper water are testimony of this (Vonk et al., 2007). Calshot Harbour being exposed to westerly storm conditions can be seen from photographs in the storm of June 2006 (Figures 2 and 3).
Figure 2. Storm waves breaking off the breakwater in the storm of June 2006.
Figure 3. Sequence of waves breaking into entrance channel (Vonk et al., 2007).
Western Breakwater
Eastern Breakwater
2
1.3 How the Breakwater was Originally Built
It was reported that during construction the dolosse were placed on the rocky reef and built up from either side before the rock core was placed in the middle. This had the effect of locking the dolosse into the core of the breakwater, but also resulted in the outer flukes of the dolosse being upright in a steep “fence post” pattern. During a survey conducted by the CSIR in 2006, it was found that slope measurements for the eastern and western breakwaters were steeper than 1:1 compared to a standard breakwater slope of 1:1.5. Some slope measurements on the western breakwater were even found to be closer to 2:1. Compared to a conventionally randomly packed dolos breakwater, the steepness and “fence post” packing pattern used for the Calshot Harbour results in less wave absorption. The 3.5 t loosely packed dolosse for Calshot Harbour would not be able to remain stable if it was not for the unique construction method and interlocking of dolosse into the core. (Vonk et al., 2007). Figure 4, presents photographs showing the “fence post” pattern.
Figure 4. Side view showing “fence post” pattern (left) Top view showing interlocking and capping (right).
2 PHYSICAL MODEL
2.1 Objectives of the Model Study
Placement detail of the armour units was provided by WSP Africa. The model testing was required to confirm the placement detail of the armour units in the breakwater repair and to assess the stability of different repair options of which the packing is described more in section 2.5. The model study addressed the following:
• Interlocking of 10 t dolos units with the existing 3.5 t units; • The stability of the 10 t dolos layer; • Toe stability of the repaired section; and • Integrity of the repair section in relation to the existing unrepaired structure.
The outcome of the model testing would confirm repair options, as well as, the stability for a storm with return period of 10 years.
2.2 Model Overview
The Calshot Harbour model tests were performed at an undistorted scale ε, of 1:42.8 at the CSIR Hydraulics Laboratory in Stellenbosch, South Africa. Due to basin and wavemaker availability with the urgent time constraint, only a 4m wide basin was available. This resulted in a quasi 3D model being proposed, which incorporates the bathymetry in one direction with a portion of the breakwater and harbour being constructed for testing. The 4m wide flume is 32m long and 1m deep. All effects of free surface gravity waves were scaled in the physical model by applying Froude scaling (Hughes, 1995). The following scaling factors were applied:
• Length ε 1 : 42.8; • Time √ε 1 : 6.54; • Velocity √ε 1 : 6.54; and • Mass ε3 1 : 78402.7.
2.3 Wave Conditions and Test Criteria
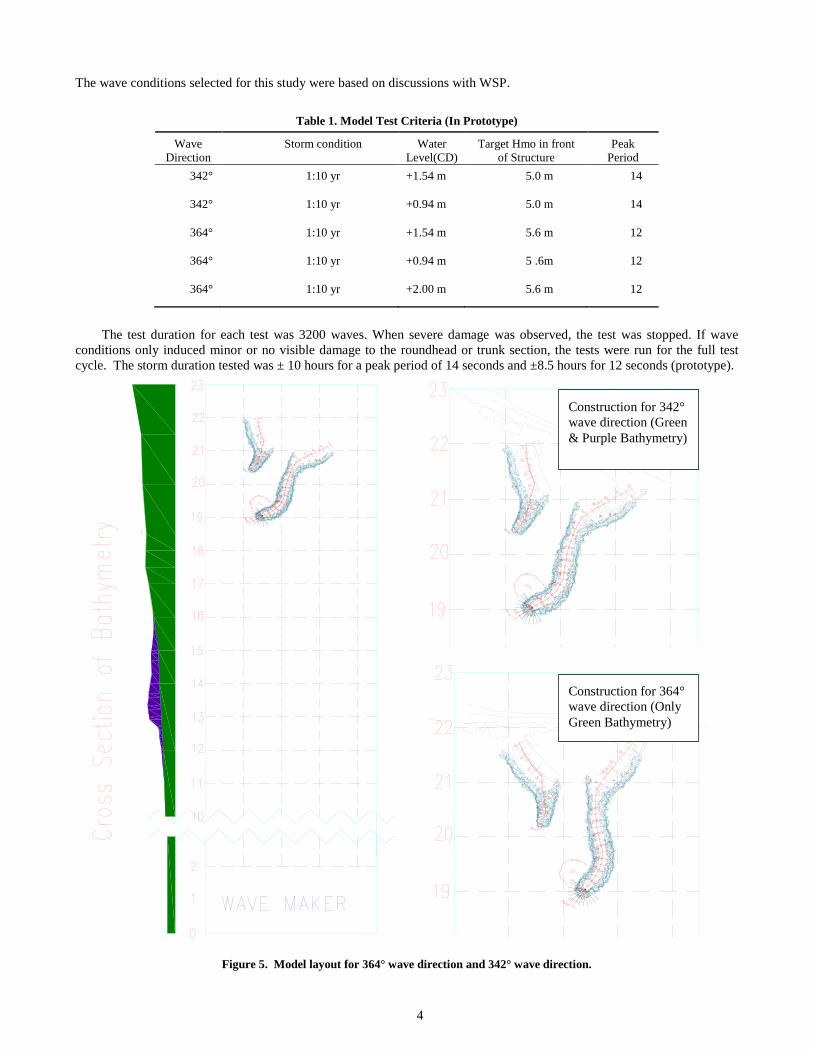
Storm waves coming from 342° and 364° North, were seen as the most severe. WSP Africa provided wave conditions for these wave directions to be tested. The model layouts for the two different wave directions are presented in Figure 5.
A Jonswap spectrum with gamma of 3.3 was used. Table 1, specifies the wave conditions used. Initially two test conditions were selected for each wave direction, after which a third test condition was selected for the 364° wave direction.
3
Displace
d Dolos
The wave conditions selected for this study were based on discussions with WSP.
Table 1. Model Test Criteria (In Prototype)
Wave Direction
Storm condition Water Level(CD)
Target Hmo in front of Structure
Peak Period
342° 1:10 yr +1.54 m 5.0 m 14
342° 1:10 yr +0.94 m 5.0 m 14
364° 1:10 yr +1.54 m 5.6 m 12
364° 1:10 yr +0.94 m 5 .6m 12
364° 1:10 yr +2.00 m 5.6 m 12
The test duration for each test was 3200 waves. When severe damage was observed, the test was stopped. If wave
conditions only induced minor or no visible damage to the roundhead or trunk section, the tests were run for the full test cycle. The storm duration tested was ± 10 hours for a peak period of 14 seconds and ±8.5 hours for 12 seconds (prototype).
Figure 5. Model layout for 364° wave direction and 342° wave direction.
Displace
d Dolos
DisplacedDolos
Construction for 342° wave direction (Green & Purple Bathymetry)
Construction for 364° wave direction (Only Green Bathymetry)
4
9 10 11 12 13 14 15 16 17 18 19 20 21 22 23
Basin Floor342 deg Bathy364 deg Bathy
Flume Chainage (m)
Con
stru
ctio
nH
eigh
t (m
)0
1
2.4 Model Construction and Bathymetry
The model was constructed for wave directions from 342° and 364°. The bathymetry for the wave direction of 364° was constructed first, after which the bathymetry for waves coming from 342°, which was shallower, was constructed on top of the original bathymetry.
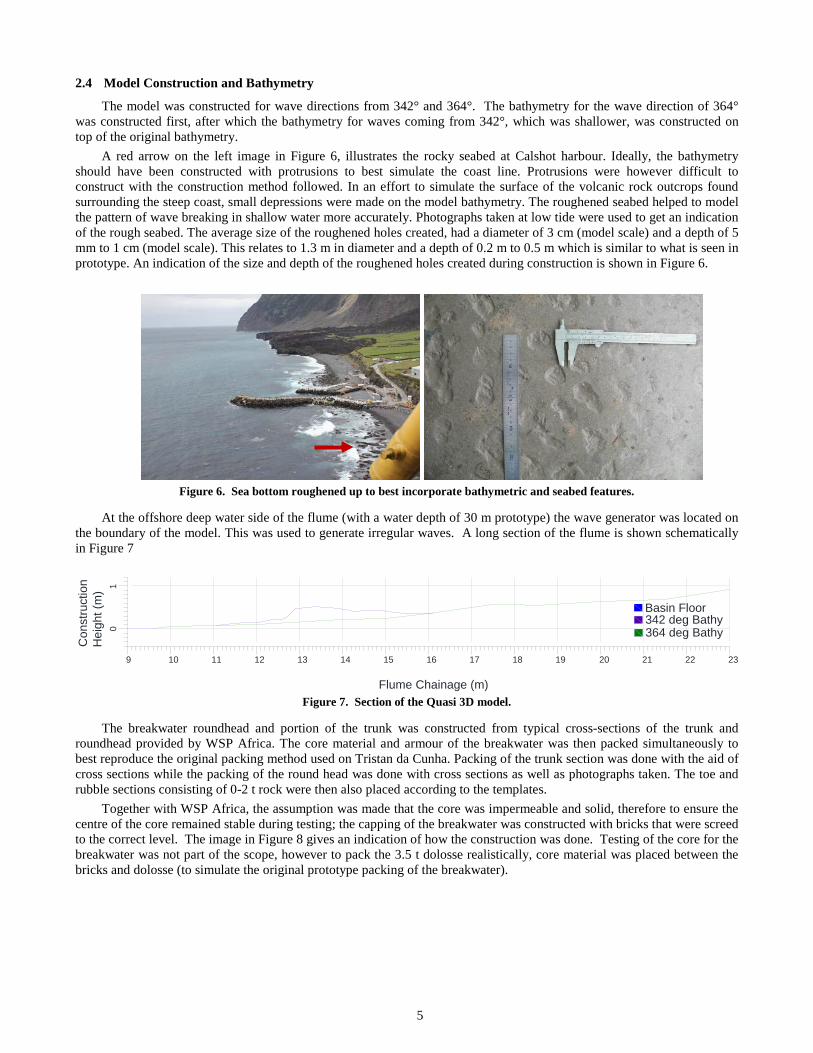
A red arrow on the left image in Figure 6, illustrates the rocky seabed at Calshot harbour. Ideally, the bathymetry should have been constructed with protrusions to best simulate the coast line. Protrusions were however difficult to construct with the construction method followed. In an effort to simulate the surface of the volcanic rock outcrops found surrounding the steep coast, small depressions were made on the model bathymetry. The roughened seabed helped to model the pattern of wave breaking in shallow water more accurately. Photographs taken at low tide were used to get an indication of the rough seabed. The average size of the roughened holes created, had a diameter of 3 cm (model scale) and a depth of 5 mm to 1 cm (model scale). This relates to 1.3 m in diameter and a depth of 0.2 m to 0.5 m which is similar to what is seen in prototype. An indication of the size and depth of the roughened holes created during construction is shown in Figure 6.
Figure 6. Sea bottom roughened up to best incorporate bathymetric and seabed features.
At the offshore deep water side of the flume (with a water depth of 30 m prototype) the wave generator was located on the boundary of the model. This was used to generate irregular waves. A long section of the flume is shown schematically in Figure 7
Figure 7. Section of the Quasi 3D model.
The breakwater roundhead and portion of the trunk was constructed from typical cross-sections of the trunk and roundhead provided by WSP Africa. The core material and armour of the breakwater was then packed simultaneously to best reproduce the original packing method used on Tristan da Cunha. Packing of the trunk section was done with the aid of cross sections while the packing of the round head was done with cross sections as well as photographs taken. The toe and rubble sections consisting of 0-2 t rock were then also placed according to the templates.
Together with WSP Africa, the assumption was made that the core was impermeable and solid, therefore to ensure the centre of the core remained stable during testing; the capping of the breakwater was constructed with bricks that were screed to the correct level. The image in Figure 8 gives an indication of how the construction was done. Testing of the core for the breakwater was not part of the scope, however to pack the 3.5 t dolosse realistically, core material was placed between the bricks and dolosse (to simulate the original prototype packing of the breakwater).
5
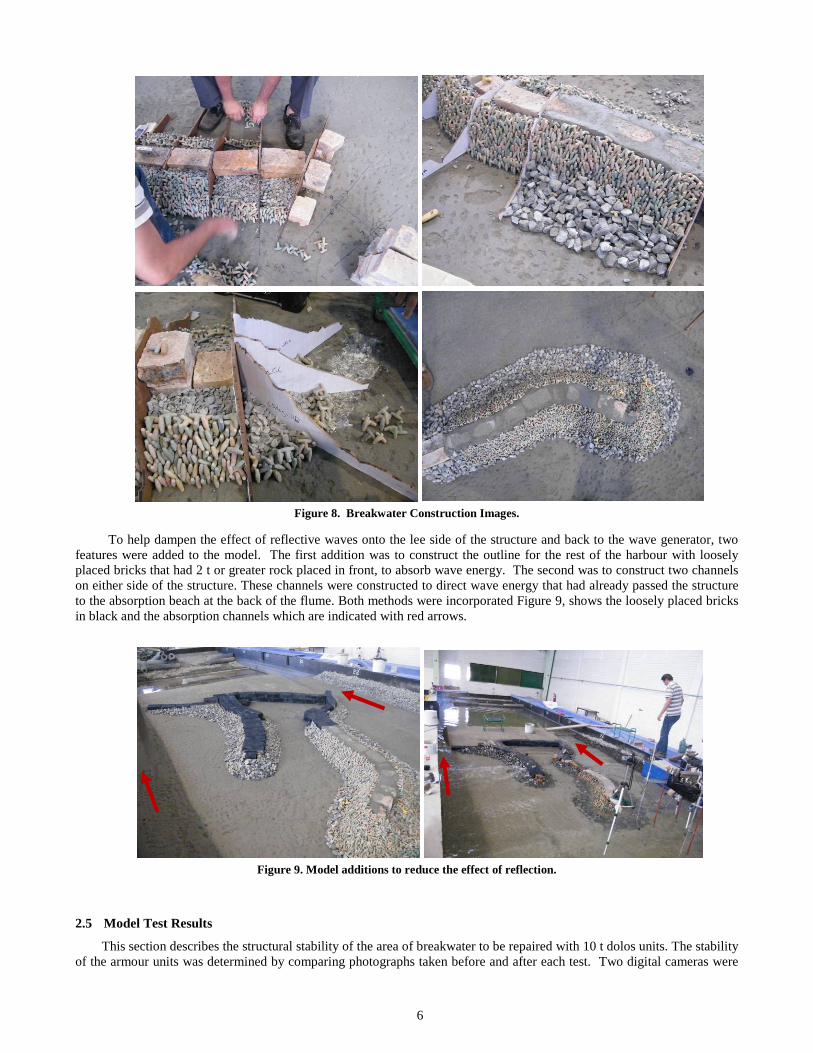
Figure 8. Breakwater Construction Images.
To help dampen the effect of reflective waves onto the lee side of the structure and back to the wave generator, two features were added to the model. The first addition was to construct the outline for the rest of the harbour with loosely placed bricks that had 2 t or greater rock placed in front, to absorb wave energy. The second was to construct two channels on either side of the structure. These channels were constructed to direct wave energy that had already passed the structure to the absorption beach at the back of the flume. Both methods were incorporated Figure 9, shows the loosely placed bricks in black and the absorption channels which are indicated with red arrows.
Figure 9. Model additions to reduce the effect of reflection.
2.5 Model Test Results
This section describes the structural stability of the area of breakwater to be repaired with 10 t dolos units. The stability of the armour units was determined by comparing photographs taken before and after each test. Two digital cameras were
6

mounted at fixed positions with a view angle perpendicular to the seaward slope. The areas of interest were the repaired section and the roundhead. Figure 10 indicates the two camera stations.
Figure 10. Camera Stations.
Camera station 1 was used to determine the stability of the 10 t dolosse units. This covered the section of armour where the core material had become severely exposed and threatened the survival of the structure. Stability results for the 3.5 t dolosse on the roundhead (camera station 2) were also taken but only in the form of observations.
For the measurement of damage to the armour units as well as the toe, the armour track method was used as described by Phelp & Tulsi (2006). The two images were analysed using software developed by CSIR to assess armour unit damage. The displacements were classified as follows:
• 0.25*H-0.5*H = settlement; • 0.5*H-1*H = rocking + potential damage; • > 1.0*H = full displacement; and • H = The height of the dolos unit. These classifications are derived from Phelp, (2000). Model dolos units are made of polyester resin which do not
break and do not have the strength of a prototype unit. However rocking units during model testing might break in prototype and therefore have to be accounted for in the calculation of damage.
A total of nine tests were carried out to evaluate the stability of the emergency repair section (shakedown and additional tests excluded). Before every repair option to be tested, the round head consisting of 3.5 t dolosse were repacked. This included recreating the damage as per photographs taken after the August 2010 storm. The repair option to be tested was then constructed.
Each repair consisted of placing 10 t dolosse over the section to be repaired. The dolosse were then stitched into the 3.5 t armour layer. The repair options differed mainly in size and shape of the placement footprint. It however also differed in packing density and armour layers packed. Due to the remoteness and logistical aspects of getting material to Tristan da Cunha, a limited number of 10 t dolosse (75 in total) were available for each repair option to be tested. Table 2 presents the wave conditions and test information while Table 3 presents the armour unit packing for the different tests. Figure 11 shows how one of the repair options was constructed.
It was found that the start of failure was always on the section of roundhead not being repaired. For this reason a separate test with no repair was undertaken to determine if the cause of the roundhead failure during the tests are indirectly caused by the section repaired with the 10 t dolosse, (Test 010). For this test the damaged mass capping at the front of the roundhead was also modelled using 4 individual pieces of flat rock that were screed together with rock set cement. The mass of the individual pieces were 135 t, prototype. Note that this is slightly conservative in terms of breakwater stability, with the existing cap having an estimated weight of about 110 t.
2
1
7
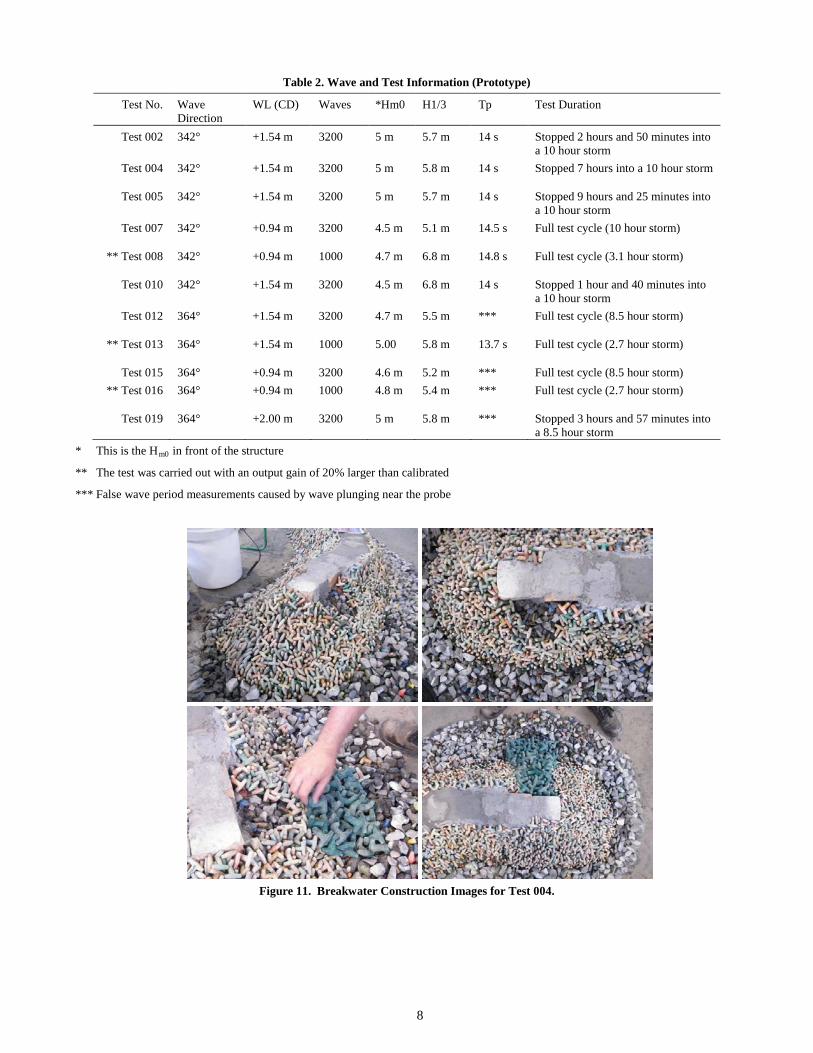
Table 2. Wave and Test Information (Prototype)
Test No. Wave Direction
WL (CD) Waves *Hm0 H1/3 Tp Test Duration
Test 002 342° +1.54 m 3200 5 m 5.7 m 14 s Stopped 2 hours and 50 minutes into a 10 hour storm
Test 004 342° +1.54 m 3200 5 m 5.8 m 14 s Stopped 7 hours into a 10 hour storm
Test 005 342° +1.54 m 3200 5 m 5.7 m 14 s Stopped 9 hours and 25 minutes into a 10 hour storm
Test 007 342° +0.94 m 3200 4.5 m 5.1 m 14.5 s Full test cycle (10 hour storm)
** Test 008 342° +0.94 m 1000 4.7 m 6.8 m 14.8 s Full test cycle (3.1 hour storm)
Test 010 342° +1.54 m 3200 4.5 m 6.8 m 14 s Stopped 1 hour and 40 minutes into a 10 hour storm
Test 012 364° +1.54 m 3200 4.7 m 5.5 m *** Full test cycle (8.5 hour storm)
** Test 013 364° +1.54 m 1000 5.00 5.8 m 13.7 s Full test cycle (2.7 hour storm)
Test 015 364° +0.94 m 3200 4.6 m 5.2 m *** Full test cycle (8.5 hour storm) ** Test 016 364° +0.94 m 1000 4.8 m 5.4 m *** Full test cycle (2.7 hour storm)
Test 019 364° +2.00 m 3200 5 m 5.8 m *** Stopped 3 hours and 57 minutes into a 8.5 hour storm
* This is the Hm0 in front of the structure
** The test was carried out with an output gain of 20% larger than calibrated
*** False wave period measurements caused by wave plunging near the probe
Figure 11. Breakwater Construction Images for Test 004.
8

Table 3. Dolos Packing for Tests
Test No. Packing
Test 002 3.5 t dolos units placed to best reproduce existing profile, layer thickness and interlocking of the head, trunk and damaged area of the breakwater. Dolos units on the trunk section were packed in a “fence post” formation. The roundhead was packed randomly with the top armour of the breakwater packed loosely. The section to be repaired was packed with 75, 10 t dolos units stitched into the 3.5 t armour layer. The repair dolosse were packed double layer with a density of roughly 1.05.
Test 004 Armour layer on seaward side of roundhead packed randomly as in Test_002 but slightly denser. The leeward side of the roundhead the armour layer was packed using a “fence post” method instead of the random packing method used for Test_002. Although the packing of the 3.5 t armour layer was more realistic for Test_002, the main focus was the 10 t dolosse on the repaired section and not the roundhead. Therefore the roundhead was packed slightly denser for Test_004 in the hope that if the roundhead failed it would not have such a great influence on the stability results of the repaired section as in Test_002. The repair section had the same packing placement and density as in Test_002.
Test 005 This was an additional test, most of the 3.5 t armour layer on the roundhead was replaced with an additional 75, 10 t units packed randomly. The repair section was again packed in the same manner as for Test_002 and Test_004. The repair section had the same packing placement and density as in Test_002.
Test 007 The main reason for undertaking this test was to determine the stability for the toe of the 10 t repair dolosse. Because of this, most of the roundhead was packed with a “fence post” method. The repair section had the same packing placement and density as in Test_002.
Test 008 Overload condition, No repacking of the roundhead and trunk was done; the test was run directly after Test_007.
Test 010 Main reason for test was to determine if the cause of the roundhead failure during tests 002, 004 and 005 are indirectly as a result of the section repaired with the 10 t dolosse. As for Test_002 the armour layer was packed realistically, using survey photographs with single layer areas on the roundhead to recreate the damage caused by the previous storms. The roundhead was packed randomly with the top armour of the breakwater packed loosely. The section to be repaired was constructed using survey photographs taken after the previous storms.
Test 012 The 3.5 t dolosse packed as for Test_004. The 10 t dolosse were not packet all the way up to the mass capping but had three rows of random placed dolosse at the top. The repair section had the same packing placement and density as in Test_002.
Test 013 During Test_012 the main integrity of the structure survived the full 8.5 hour storm duration. Test_013 was setup as an overload condition for Test_012. While the roundhead and trunk section was not repaired for the Test_013, The 10 t dolosse were repacked onto the section being repaired. During the repacking of the 10 t dolosse it is important to note that unlike for Test-012, the dolosse were packed right up against the mass capping.
Test 015 As for Test_013, the dolosse were packed to right up against the mass capping. The strip of 75, 10 t dolosse were more densely packed together with 2 to 3 fewer units per row. The repair dolosse were packed double layer with a density greater than 1.15.
Test 016 During Test_015 the section repaired with 10 t units was still intact with the roundhead of the breakwater damaged. Test_016 was set-up as an overload condition for Test_015.
Test 019 The packing of the armour units was done in the same manner as for Test_012, but with some 3.5 t units now placed randomly on the top half of the roundhead.
3 CONCLUSIONS
Because of the unique construction methods used to build the existing breakwater for Calshot Harbour on Tristan da Cunha, it was important to try and recreate this in the physical model. This included the “fence post” packing of the 3.5 t dolosse and the cementing of the top rows of dolosse into the mass capping. The damaged section, including broken dolosse, exposed mass capping and core rock were reproduced using photographs of the actual breakwater.
Although a lot of settling of dolos units took place for both of the wave directions tested, only a few units were displaced a distance lager than 0.5xH for each test. Table 4 illustrates the average number of dolosse displaced more than 0.5xH for all the tests at the same water level and condition. When more than 5 units were displaced a distance of 0.5xH or greater, it was usually as a result of the roundhead failing up to the repaired section.
For both wave directions of 342° and 364° the toe of the 10 t repair sections were found to be stable. The stitching between the 3.5 t and 10 t dolosse, sustained little or no damage during all the tests. When some damage occurred between
9

the stitching on the roundhead side, it was mostly because of the roundhead failing. When the roundhead remained intact, no displacements were observed. The stitching between the 3.5 t and 10 t units on the trunk side of the repaired section showed a minimum number of 10 t units which came dislodged for all the tests.
The general conclusion which can be drawn from the model tests is that the planned repairs using 75, 10 t dolosse will be successful as an emergency repair to protect the existing damaged area from a 1:10 year storm. Some settlement can be expected as the new heavier dolosse “shake down” into the smaller dolosse and rock slope beneath.
Although the stitching between the 3.5 t and 10 t dolosse, sustained little or no damage during all the tests, the stability of surrounding 3.5 t dolosse is of concern, especially that of the roundhead. This was not the focus of the tests and report, results did however indicate how vulnerable the roundhead is in its current state.
Table 4. Summary of displacements greater than half the dolos height “H”
Water Level Section of interest 342° wave direction 364° wave direction
Between 0.5H - H >H Between 0.5H - H >H +1.54 m (CD) Normal condition\
All 75 units 5 units 11 units 1 units 2 units Toe Section 1 unit 0 unit 0 units 0 units Roundhead stitching 0 units 5 units 0 units 0 units Trunk stitching 1 units 2 units 2 units 0 units
+1.54 m (CD) Overload Condition
All 75 units -------- -------- 0 units 6 units Toe Section -------- -------- 0 units 0 units Roundhead stitching -------- -------- 0 units 0 units Trunk stitching -------- -------- 0 units 5 units
+0.94 m (CD) Normal Condition
All 75 units 1 unit 0 unit 0 unit 1 unit Toe Section 0 units 0 units 0 units 0 units Roundhead stitching 0 units 0 units 0 units 0 units Trunk stitching 1 unit 0 unit 0 unit 1 unit
+0.94 m (CD) Overload Condition
All 75 units 0 units 4 units 1 units 3 units Toe Section 0 units 0 units 0 units 0 units Roundhead stitching 1 unit 0 unit 0 units 0 units Trunk stitching 0 units 3 units 1 units 3 units
+2.0 m (CD) Extreme condition
All 75 units -------- -------- 1 units 1 units Toe Section -------- -------- 0 units 0 units Roundhead stitching -------- -------- 0 unit 1 unit Trunk stitching -------- -------- 1 units 0 units
ACKNOWLEDGEMENT
The authors wish to acknowledge the late Dave Phelp who passed away on 29 October 2013. Dave Phelp was the Group Leader for the Coastal Engineering and Port Infrastructure group at the CSIR. As the breakwater stability expert at the CSIR his contribution was invaluable.
REFERENCES DFID, 2011. Ongoing maintenance of Calshot Harbour, Tristan da Cunha, [Online], Available:
http://iati.dfid.gov.uk/iati_documents/3717109.docx [13 January 2015]. Hughes, S.A., 1995. Physical Models and Laboratory Techniques in Coastal Engineering, World Scientific, Singapore. ISBN-10:
9810215401. Phelp, D. & Tulsi, K., 2006. Digital Image Technology as a Measurement Tool in Physical Models, Coastal Lab 2006 – 1st International
Conference on the Application of Physical Modelling to Port and Coastal Protection, Porto, Portugal. Phelp, D & Zwamborn, J. A., 2000. Correlation between Model and Prototype Damage of Dolos Breakwater Armouring, Coastal
Engineering 2000 – 27th Conference on Coastal Engineering, Sidney, Australia. Tristan da Cunha Government and the Tristan da Cunha Association, 2015. Calshot Harbour [Homepage of The Tristan da Cunha
Website], [Online]. Available: http://www.tristandc.com/harbour.php [21 December 2015]. Tritan Survey, 2016. Close Ramge Photogrammetry [Homepage of Tritan Survey], [Online]. Available:
http://www.tritan.co.za/_photos/Close_Range_photogrammetry/Tristan%20Calshot%20Harbour.jpg [13 January 2016]. Vonk, R., Phelp, D., Boysons, C., Edries, R., 2007. Survey of the old dolos breakwaters, Tristan da Cunha, Coastal Structures 2007 –
5th International Conference, Venice, Italy, 92 – 103.
10