Physi ViewCalc book - Micromeritics
16
Physi ViewCalc © Operator Instructions May 2009
Transcript of Physi ViewCalc book - Micromeritics

Physi ViewCalc©
Operator Instructions
May 2009

Microsoft Excel is a registered trademark of Microsoft Corporation.
Copyright Micromeritics Instrument Corporation 2009.

Physi ViewCalc Product Description
Product Description
The Physi ViewCalc tool enables you to import, enter, or copy and paste an isotherm data set into Excel and use the following data reduction methods to manipulate data and produce plots and data overlays.
• BET surface area • Langmuir surface area• t-Plot
License
Before using this software, review the License for the terms of usage.
Isotherm Data and Overlay Isotherm Data
You may import, copy and paste, or manually enter data from one isotherm data set. The tool comes with a sample isotherm data file that contains results from a carbon reference material analysis. You may select a different isotherm data file at any time. Only one isotherm data file may be used at a time.
You may select up to five data sets to be overlaid on the isotherm data for each type of data reduction. The name of the overlaid file appears in the legend below the graph.
When you import an Overlay Isotherm Data File, the raw data are imported into a worksheet containing the following columns:
Column A: Absolute Pressure (mmHg)
Column B: Relative Pressure (p/p°)
Column C: Quantity Adsorbed (cm3/g STP)
Column D: Time - Hours since the beginning of the analysis at which the point was recorded
Column H: The name of the gas in the data file
May 09 1

Product Description Physi ViewCalc
Isotherm Menu
The Isotherm menu appears in the menu bar at the top of the screen in Excel 2003 and under the Add-ins tab in Excel 2007. The following commands are available from this menu:
• Show IsothermShow BETShow LangmuirShow t-Plot
These commands enable you to view the associated worksheet.
• Import Isotherm Data
Enables you to select a different isotherm data file.
• Import Overlay Isotherm Data
Enables you to select one or more data files to be overlaid on the isotherm data file. When you import an overlay file, it is added to the Overlays list which appears when you choose the Add/Remove Overlays function.
• Create Overlay Sheet
Enables you to create a blank overlay sheet with the columns labeled as described previously.
• Add/Remove Overlays
You may select this function when a graph is displayed in the current worksheet. A dialog box displays that allows you to select up to five overlay files from drop-down lists. You may also remove an existing overlay file by double-clicking its name in the list.
• Refresh
Restores the data in tables to their original imported format.
• Create Isotherm Chart• Create BET Chart• Create Langmuir Chart• Create t-Plot Chart
These commands enable you to recreate Isotherm, BET, Langmuir, or t-Plot graphs if they were removed.
2 May 09

Physi ViewCalc Isotherm Data Worksheet
Isotherm Data Worksheet
Isotherm Data Table
The Isotherm Data Table contains three columns: Absolute Pressure, Relative Pressure, and Quantity Adsorbed. The table contains both adsorption and desorption points. The last adsorption point in the table is highlighted in green.
Isotherm Data Graphs
Two graphs are shown on each worksheet: linear and logarithmic. Linear X-axes begin at zero; logarithmic X-axes begin at the selected data point. The name of the overlaid file is shown in the legend below the linear graph.
May 09 3

Isotherm Data Worksheet Physi ViewCalc
Methods of Adding Isotherm Data
You may add data to the Isotherm Data Table in one of several ways:
• You may import isotherm data. The data to be imported must be in one of the following formats.
• You may copy data from a text file and paste it into the table.
• You may manually enter data into the table.
Format Description
ISO This file format is used by some Micromeritics gas adsorption applications to export isotherm data. This is a CSV (comma separated value) file with the following columns of data: Absolute Pressure, Relative Pressure, Volume Adsorbed, and run time.
TXT This file format contains some lines of header information, and then the isotherm data. On loading this file, you are prompted to select the data in columns A through D, the starting line of data, and the type of delimiters in the file. The defaults are setup to support the export format of Micromeritics gas adsorption software.
4 May 09
Physi ViewCalc Isotherm Data Worksheet
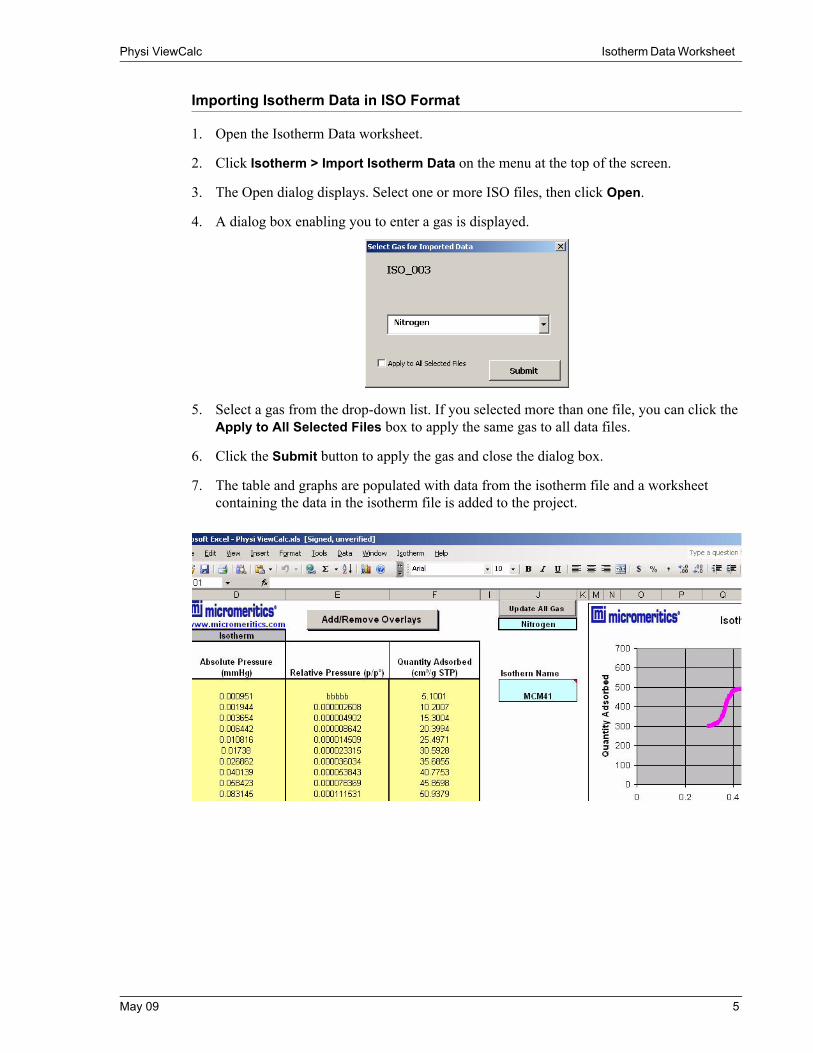
Importing Isotherm Data in ISO Format
1. Open the Isotherm Data worksheet.
2. Click Isotherm > Import Isotherm Data on the menu at the top of the screen.
3. The Open dialog displays. Select one or more ISO files, then click Open.
4. A dialog box enabling you to enter a gas is displayed.
5. Select a gas from the drop-down list. If you selected more than one file, you can click the Apply to All Selected Files box to apply the same gas to all data files.
6. Click the Submit button to apply the gas and close the dialog box.
7. The table and graphs are populated with data from the isotherm file and a worksheet containing the data in the isotherm file is added to the project.
May 09 5

Isotherm Data Worksheet Physi ViewCalc
Importing Isotherm Data in TXT Format
1. Open the Isotherm Data worksheet.
2. Click Isotherm > Import Isotherm Data on the menu at the top of the screen.
3. The Open dialog displays. Select one or more TXT files, then click Open.
4. The Import Delimited Text File dialog box displays.
5. From the drop-down lists, select the data to be imported into Columns A through D (1st column through 4th column).
6. Select the first line of data to be imported into the data table.
7. Click the appropriate radio button for the type of delimiters used in the file.
8. Click Submit.
Copy and Pasting Data or Manually Entering Data
You can edit and enter data using the following methods:
• Delete data from the data table
• Copy and paste data from a text file into the data table
• Type data into the data table
Methods of Adding Overlays to an Isotherm
You may add overlays to isotherms in one of several ways:
• You may import overlay isotherm data. The data to be imported must be in ISO or TXT format.
• You may select an overlay data file from data files that already exist in the Excel project.
• You may create a new Overlay sheet and add data to it.
6 May 09

Physi ViewCalc Isotherm Data Worksheet
Importing Overlay Isotherm Data
1. Open the Isotherm Data worksheet.
2. Click Isotherm > Import Overlay Isotherm Data on the menu at the top of the screen.
3. The Open dialog displays. Select one or more files, then click Open.
4. A dialog box enabling you to enter a gas is displayed.
5. Select a gas from the drop-down list. If you selected more than one file, you can click the Apply to All Selected Files box to apply the same gas to all data files.
6. Click the Submit button to apply the gas and close the dialog box.
7. Click the Add/Remove button at the top of the worksheet to display the Overlays dialog box.
8. Click an arrow to display a drop-down list of overlay data files. Select the desired files. (To remove a file, double-click its name in the list.)
9. Click Close to close the dialog box.
10. The data from the file are overlaid on the isotherm data in the graphs.
These instructions refer to ISO formatted data. To import TXT data, refer to “Importing Isotherm Data in TXT Format” on page 6.
May 09 7

Isotherm Data Worksheet Physi ViewCalc
Selecting an Existing Overlay Data File
To select data from a file that is currently in the Excel project, follow Steps 8 through 11 on the previous page.
Creating a New Overlay Sheet
1. Click Isotherm > Create Overlay Sheet on the menu at the top of the screen to display a new worksheet. Columns A through D are labeled as follows:
• Column A: Absolute Pressure (mmHg)
• Column B: Relative Pressure (p/p°)
• Column C: Quantity Adsorbed (cm3/g STP)
• Column D: Time - Hours since the beginning of the analysis at which the point was recorded. This data is not used in calculations, so this column can be left blank.
2. You can import data, enter data, or copy and paste data into the worksheet.
The data you enter in the columns must be consistent with the column headings.
The program assumes that adsorption data are monotonically increasing and that desorption data are monotonically decreasing.
8 May 09

Physi ViewCalc Isotherm Data Worksheet
3. If you import a TXT file, the following dialog box displays.
a. Select the data to be imported into Columns A through D (1st through 4th columns).
b. Select the first line of data you want to include in the data table.
c. Select the type of delimiters in the file.
d. Click Submit.
4. If you manually entered or copied and pasted data into the columns, click the Refresh ISO List button.
5. The worksheet will now be added to the Add/Remove Overlays list.
Selecting a Different Gas
On the Isotherm Data worksheet:
1. Click in the row below the Update All Gas button. An arrow appears. Click the arrow to display a list of gases.
2. Select the desired gas from the list. The gas is changed for the isotherm.
3. If you wish to have the gas you selected apply to all reports, click the Update All Gas button.
Gases are added to the project on the Parameter Worksheet.
May 09 9

Data Reduction Worksheets Physi ViewCalc
Data Reduction Worksheets
Type of Data Reduction Worksheets
The Physi View Calc tool supports three methods of data reduction:
• The BET calculation obtains the sample surface area value by determining the monolayer volume of adsorbed gas from the isotherm data.
• The Langmuir calculation determines the surface area of a sample by relating the surface area to the volume of the gas adsorbed as a monolayer.
• The t-Plot calculation allows quantitative analysis of the area and total volume ascribed to micropores. Matrix area, the area external to micropores, is directly determined and often proves to be a valuable way of characterizing complex mixed materials.
Selecting Overlay Files
You may select up to five files to overlay on the primary data file. Refer “Methods of Adding Overlays to an Isotherm” on page 6.
Viewing Analysis Results and Parameters
Analysis raw results and parameters are shown above the data table.
Analysis resultsand parameters
10 May 09

Physi ViewCalc Data Reduction Worksheets
You may change the gas as follows:
1. Click in the gas cell.
2. An arrow appears. Click the arrow to display a drop-down list of gases.
3. Click the desired gas.
When working with t-Plots, you may also select a different thickness curve.
1. Click the Thickness Curve cell.
2. An arrow appears. Click the arrow to display a drop-down list of thickness curves.
3. Click the desired thickness curve.
Thickness curve parameters can be edited on the Parameter Worksheet.
May 09 11

Data Reduction Worksheets Physi ViewCalc
Selecting Data Points
You can select a range of data points to include in the report using the following methods:
• Use the up and down arrow keys located above the minimum and maximum relative pres-sure cells to select the desired data range.
• Edit the values in the Fit Data Limits and Experimental Data Limits cells.
All data points from the main isotherm adsorption branch between the Experimental Data Limits are shown in the table. The points between the Fit Data Limits are the ones used for the calculation. These points are shown in green in the table.
12 May 09

Physi ViewCalc Parameters Worksheet
Parameters Worksheet
The Parameters worksheet enables you to add gases to the program, edit the parameters of thickness curves, and enter user-defined thickness parameters.
Adding a Gas
1. Click in the cell below the last gas listed in the gas table.
2. Enter the name of the gas and its symbol, Density Conversion Factor (DCF), and Molecular Cross-Sectional Area (CSA nm2). The gas will now appear in the drop-down gas lists.
Editing a Thickness Parameter
You can edit the parameters for the following types of thickness curves:
Halsey
Harkins-Jura
May 09 13

Parameters Worksheet Physi ViewCalc
Broekoff-de Boer
Carbon Black STSA
To edit a parameter, click on the appropriate parameter and type the changes.
Adding a User-Defined Thickness Curve
In addition, you can enter data and parameters for a User Defined thickness curve. Enter the Relative Pressure and Thickness for each data point in the data table.
14 May 09