
Photosynthetic Electron Transport in Single Guard Cells...
7
Plant Physiol. (1 997) 11 3: 895-901 Photosynthetic Electron Transport in Single Guard Cells as Measured by Scanning Electrochemical Microscopy’ Michael Tsionsky, Zoe G. Cardon, Allen J. Bard, and Robert B. Jackson* Department of Chemistry and Biochemistry (M.T., A.J.B.) and Department of Botany (R.B.J.), University of Texas, Austin, Texas 7871 2; and Department of Biology, Bowdoin College, Brunswick, Maine 0401 1 (Z.G.C.) Scanning electrochemical microscopy (SECM) is a powerful new tool for studying chemical and biological processes. It records changes in faradaic current as a microelectrode (57 p m in diame- ter) is moved across the surface of a sample. The current varies as a function of both distance from the surface and the surface’s chemical and electrical properties. We used SECM to examine in vivo topography and photosynthetic electron transport of individual guard cells in Tradescantia fluminensis, to our knowledge the first such analysis for an intact plant. We measured surface topography at the micrometer level and concentration profiles of O, evolved in photosynthetic electron transport. Comparison of topography and oxygen profiles above single stomatal complexes clearly showed photosynthetic electron transport in guard cells, as indicated by induction of O, evolution by photosynthetically active radiation. SECM is unique in its ability to measure topography and chemical fluxes, combining some of the attributes of patch clamping with scanning tunneling microscopy. In this paper we suggest severa1 questions in plant physiology that it might address. SECM, a type of scanning probe microscopy, was intro- duced in 1989 as a technique to study processes occurring on chemical interfaces (Bard et al., 1989).SECM is a “chem- ical microscope” that operates in two modes, feedback and collection (see ”Materials and Methods”). The feedback mode provides three-dimensional surface topography, with the current in the microelectrode varying with dis- tance from the sample surface (Bard et al., 1991). The collection mode records chemical changes at the surface, including which sample regions are insulating or conduct- ing, and the rate of generation of an electrochemical agent (in our case, O, evolved in photosynthetic electron trans- port). Since 1989 a variety of complex electrochemical and catalytic reactions have been studied, including surface topography and chemical reactions for metals, semicon- ductors, polymers, and liquid / liquid interfaces (e.g. Mir- kin et al., 1992; Horrocks et al., 1994; Wei and Bard, 1995). SECM is related to a variety of SPTs, including STM, in which surface topography is obtained by recording the tunneling current between electrode and sample, and atomic force microscopy, which measures the force be- Support was provided by the National Science Foundation, the Welch Foundation, and the Andrew W. Mellon Foundation. Z.G.C. was supported by a Department of Energy Distinguished Postdoctoral Fellowship for Global Change. *. Corresponding author; e-mail rjacksonQmail.utexas.edu; fax 1-512-471-3878. tween electrode and sample for a given x-y position over the surface (Hansma et al., 1989). Just as in STM, the microelectrode in SECM is controlled with nanometer res- olution in the x,y, and z directions (Bard et al., 1991). The main advantage of SECM compared with other SPTs is that it provides not just topographic information at micrometer and submicrometer scales, but also information about the concentration of electroactive species above the probed surface (Lee et al., 1990). This combination of topographic and electrochemical information is also one way that SECM differs from typical patch-clamp techniques, which provide no topographical data. Although the resolution of SECM is 100 nm under some conditions, it does not yet provide the atomic resolution of STM or atomic force microscopy. SECM resolution is improving rapidly and is already suf- ficient for us to examine such a biological phenomenon as O, diffusion from individual stomata in intact leaves. Stomata act as valves on the surface of leaves, balancing CO, availability for photosynthesis with water loss to the atmosphere. Over the last century instruments ranging from rudimentary porometers to complex gas-exchange systems have been used to investigate stomata from the perspective of whole-leaf or whole-plant physiology (e.g. Sestak et al., 1971; Zeiger et al., 1987; Jackson et al., 1991). Investigations at the cellular level, in turn, have attempted to understand the mechanisms by which guard cells re- spond to their environment, most often using epidermal peels or guard cell protoplasts (for reviews, see MacRobbie, 1987; Assmann, 1993). Peels and protoplasts, however, may not always reflect in vivo, unstressed physiology. Guard cells isolated from subsidiary cells (either physically in a protoplast preparation or via cell death during peeling) no longer communicate with a live, turgid epidermis that provides back-pressure against stomatal turgor. Isolated guard cells also have been separated from ion sources and sinks fundamental for guard cell function in vivo. Ideally, experiments with functionally or physically isolated guard cells should be tested in intact leaves, and observations of stomatal behavior at the physiological level must be linked with cell-leve1 processes. Abbreviations: E, electric potential; i , , steady-state tip current; i , , , , steady-state tip current far from the sample surface; SECM, scanning electrochemical microscopy; SPT, scanning probe tech- niques; STM, scanning tunneling microscopy; UME, ultra micro- electrode. 895
Transcript of Photosynthetic Electron Transport in Single Guard Cells...

Plant Physiol. (1 997) 11 3 : 895-901
Photosynthetic Electron Transport in Single Guard Cells as Measured by Scanning Electrochemical Microscopy’
Michael Tsionsky, Zoe G. Cardon, Allen J. Bard, and Robert B. Jackson*
Department of Chemistry and Biochemistry (M.T., A.J.B.) and Department of Botany (R.B.J.), University of Texas, Austin, Texas 7871 2; and Department of Biology, Bowdoin College, Brunswick, Maine 0401 1 (Z.G.C.)
Scanning electrochemical microscopy (SECM) is a powerful new tool for studying chemical and biological processes. I t records changes in faradaic current as a microelectrode ( 5 7 p m in diame- ter) is moved across the surface of a sample. The current varies as a function of both distance from the surface and the surface’s chemical and electrical properties. W e used SECM to examine in vivo topography and photosynthetic electron transport of individual guard cells in Tradescantia fluminensis, to our knowledge the first such analysis for an intact plant. W e measured surface topography at the micrometer level and concentration profiles of O, evolved in photosynthetic electron transport. Comparison of topography and oxygen profiles above single stomatal complexes clearly showed photosynthetic electron transport in guard cells, as indicated by induction of O, evolution by photosynthetically active radiation. SECM is unique in its ability to measure topography and chemical fluxes, combining some of the attributes of patch clamping with scanning tunneling microscopy. In this paper we suggest severa1 questions in plant physiology that i t might address.
SECM, a type of scanning probe microscopy, was intro- duced in 1989 as a technique to study processes occurring on chemical interfaces (Bard et al., 1989). SECM is a “chem- ical microscope” that operates in two modes, feedback and collection (see ”Materials and Methods”). The feedback mode provides three-dimensional surface topography, with the current in the microelectrode varying with dis- tance from the sample surface (Bard et al., 1991). The collection mode records chemical changes at the surface, including which sample regions are insulating or conduct- ing, and the rate of generation of an electrochemical agent (in our case, O, evolved in photosynthetic electron trans- port). Since 1989 a variety of complex electrochemical and catalytic reactions have been studied, including surface topography and chemical reactions for metals, semicon- ductors, polymers, and liquid / liquid interfaces (e.g. Mir- kin et al., 1992; Horrocks et al., 1994; Wei and Bard, 1995).
SECM is related to a variety of SPTs, including STM, in which surface topography is obtained by recording the tunneling current between electrode and sample, and atomic force microscopy, which measures the force be-
Support was provided by the National Science Foundation, the Welch Foundation, and the Andrew W. Mellon Foundation. Z.G.C. was supported by a Department of Energy Distinguished Postdoctoral Fellowship for Global Change.
*. Corresponding author; e-mail rjacksonQmail.utexas.edu; fax 1-512-471-3878.
tween electrode and sample for a given x-y position over the surface (Hansma et al., 1989). Just as in STM, the microelectrode in SECM is controlled with nanometer res- olution in the x, y, and z directions (Bard et al., 1991). The main advantage of SECM compared with other SPTs is that it provides not just topographic information at micrometer and submicrometer scales, but also information about the concentration of electroactive species above the probed surface (Lee et al., 1990). This combination of topographic and electrochemical information is also one way that SECM differs from typical patch-clamp techniques, which provide no topographical data. Although the resolution of SECM is 100 nm under some conditions, it does not yet provide the atomic resolution of STM or atomic force microscopy. SECM resolution is improving rapidly and is already suf- ficient for us to examine such a biological phenomenon as O, diffusion from individual stomata in intact leaves.
Stomata act as valves on the surface of leaves, balancing CO, availability for photosynthesis with water loss to the atmosphere. Over the last century instruments ranging from rudimentary porometers to complex gas-exchange systems have been used to investigate stomata from the perspective of whole-leaf or whole-plant physiology (e.g. Sestak et al., 1971; Zeiger et al., 1987; Jackson et al., 1991). Investigations at the cellular level, in turn, have attempted to understand the mechanisms by which guard cells re- spond to their environment, most often using epidermal peels or guard cell protoplasts (for reviews, see MacRobbie, 1987; Assmann, 1993). Peels and protoplasts, however, may not always reflect in vivo, unstressed physiology. Guard cells isolated from subsidiary cells (either physically in a protoplast preparation or via cell death during peeling) no longer communicate with a live, turgid epidermis that provides back-pressure against stomatal turgor. Isolated guard cells also have been separated from ion sources and sinks fundamental for guard cell function in vivo. Ideally, experiments with functionally or physically isolated guard cells should be tested in intact leaves, and observations of stomatal behavior at the physiological level must be linked with cell-leve1 processes.
Abbreviations: E , electric potential; i,, steady-state tip current; i,,,, steady-state tip current far from the sample surface; SECM, scanning electrochemical microscopy; SPT, scanning probe tech- niques; STM, scanning tunneling microscopy; UME, ultra micro- electrode.
895

896 Tsionsky et al. Plant Physiol. Vol. 113, 1997
One limitation is the lack of techniques for probing chemical processes at the cellular leve1 while the ceI1 is living and functioning in its normal environment. The development of patch-clamping has led to the character- ization of many ion channels and signaling systems in guard cell protoplasts ( e g Assmann, 1993), although the behavior and chemistry of isolated guard cells may some- times differ from that of intact leaves. Chlorophyll fluores- cence provides one avenue for probing photosynthetic ac- tivity in living guard cells in epidermal peels and protoplasts (eg. Melis and Zeiger, 1982; Shimazaki, 1989), and the technique has also been applied to guard cells in intact leaves (Cardon and Berry, 1992). Another recent approach examines guard cell membranes in epidermal peels that are patch-clamped through laser-cut holes in cell walls (Henriksen et al., 1996).
In this paper, we present SECM as a new technique for observing guard cell chemistry and leaf surface topology in vivo, and as a new tool for physiologists in general. Understanding the role of guard cell chloroplasts in sto- mata1 functioning is critically important, yet controversy still exists regarding the activity of guard cell chloroplasts and their energetic contribution to ion uptake and stoma- tal opening (Shimazaki, 1989; Reckmann et al., 1990; Gau- tier et al., 1991; Wu and Assmann, 1993). We first provide a description of SECM, including its modes of operation and the information to be gained in each mode. We then apply SECM to photosynthetic electron transport and to- pography in variegated leaves of Tradescantia fluminensis, which is ideal for photosynthetic studies because its leaves provide both green regions, where chloroplasts are present in mesophyll and guard cells, and white regions, where chloroplasts are present only in the guard cells (Cardon and Berry, 1992). We use SECM to examine to- pography and net photosynthesis in the green leaf regions (as measured by O, evolution). Finally, as a more chal- lenging application of SECM, we demonstrate in vivo photosynthetic electron transport for individual guard cells in white leaf regions.
MATERIALS A N D M E T H O D S
SECM
SECM is based on the steady-state current or E detected by the SECM UME. The UME tip for measuring current is usually made of a single metal (e.g. Au or Pt) wire or carbon fiber sealed into an insulating material ( e g glass, wax, or epoxy resin). Only the wire cross-section is exposed in the solution. As in most SPTs, the resolution of SECM increases as the tip diameter decreases. There are two operational modes of SECM. The feedback mode is used mainly to obtain topographic images, and the collection mode provides concentration profiles of an electroactive species across the sample surface.
The feedback mode of SECM is based on the effect of an oxidized electroactive substrate (O), O + e- + R, on UME current. Because of fast hemispherical diffusion of the elec- troactive species to the UME surface, the i, is well defined
and relatively unaffected by convection (Bard and Faulkner, 1980). iT,m is calculated as:
i,, = 4nFC,Da (1 1 where n is the number of electrons, F is the Faraday con- stant, D is the diffusion coefficient of species O, C, is the concentration of species O in the bulk solution, and a is the radius of the tip UME. When the UME is placed sufficiently close to the insulative substrate (e.g. of the order of the tip radius), i, decreases relative to because the insulative substrate partially blocks diffusion of O to the UME. The closer the tip is to the substrate, the greater the reduction in current. In the ideal case (i.e. the tip UME and substrate are smooth and parallel to each other), UME current should approach zero as the separation distance approaches zero. Although Equation 1 is most appropriate for microelec- trodes with a glass radius at least 10 times the electrode radius, such microelectrodes are unwieldy for fine-scale work over a rough surface. Our glass radius was two to three times larger than the electrode radius. Such elec- trodes generally deviate from Equation 1 by less than 10%, and our measurements showed almost perfect agreement (see ”Results”).
The dependence of tip current on distance to the insula- tive surface (d) is given by the following equation (Mirkin et al., 1992):
1- (2) ZT 7 = (0.292 + [1.5151/L] + 0.6553e[-2.4035’L1 2T.m
where L is the normalized distance between the tip UME and the substrate ( L = d/a). In feedback mode as the tip travels across an insulative surface increases in current represent hollows and decreases in current represent humps (i.e. negative feedback).
In collection mode the UME detects a species generated on or diffusing from the substrate. UME response can represent current or potential. If the substrate generates an electroactive species that can be detected by the UME, UME current will increase as the tip approaches. However, while operating in collection mode the tip-substrate dis- tance cannot be calculated definitively because the tip re- sponse is a function of both the substrate activity and the tip-substrate separation. In the case where the substrate is an insulator and has isolated regions that generate an electroactive species (in our case, O, evolution from a leaf), the image of such a surface can be obtained by scanning the UME across the substrate. Regions of active evolution will yield greater tip response compared with the rest of the insulative or inactive surface.
The SECM used in our experiments (Fig. 1) was de- scribed by Wipf and Bard (1991). Briefly, a UME was mounted on an XYZ stage (Burleigh Instruments, Fishers, NY) and was biased at a potential of oxygen reduction using an E-400 potentiostat. Nanometer control of the UME in x, y, and z directions by attached piezoelectric elements was provided by a CE-1000 controller and personal com- puter (Inchworm Controller, Burleigh Instruments). Data were acquired using unpublished software of D.O. Wipf.

Photosynthetic Electron Transport and Scanning Electrochemical Microscopy 897
XYZ CONTROLER 0 9
POTENTIOSTAT
. I 1 , i: II
II
i,’ < iT2
Figure 1. SECM apparatus for in vivo experiments of leaf surfaces. The upper panel describes the experimental station, and the lower panel illustrates how topography affects diffusion of a substrate to the UME tip.
The SECM UMEs were prepared as described by Bard et al. (1989) with the following modifications. The UME used for the experiments was a 7-pm-diameter C fiber (Good- fellow Corp., Berwyn, PA) that was heat-sealed in a 3-mm 0.d. glass capillary drawn down and polished until the wire cross-section was exposed. The counter and reference electrodes attached to the potentiostat (Fig. 1) were a 0.5- mm-diameter Pt wire and a Ag/ AgCl wire, respectively, immersed in saturated KCl. A11 reported values of E are given relative to the Ag/AgCl reference electrode. All of the experiments were performed in a 0.1 M buffer solution (prepared from NH,H,PO, and [NH,],HPO, in deionized water [Milli-Q, Millipore]) at pH 7.0. A xenon lamp with an attached optical fiber (1 mm in diameter) provided the PAR source for photosynthesis in the SECM. Light intensity was measured with a quantum sensor (Li-Cor, Lincoln, NE) and was maintained between 700 and 800 pmol m-’s-’ for all experiments.
Description of Plants and Experiments
Tradescantiafluminensis Variegata clones were grown in a walk-in growth chamber with a photon flux density of 350 pmol m-’s-’ and a 13-h photoperiod. The day and night temperatures were 24 and 20°C, respectively. Each plant
was grown in a 2-L pot with Metromix 700 potting medium (Scotts Co., Marysville, OH). Plants were watered daily to excess and fertilized weekly with approximately 0.1 L of 40 mM NH,H,PO,, 25 mM CH,N,O, and 14 mM K,O (plus trace elements).
Prior to SECM experiments, T. Juminensis leaves were carefully washed with deionized water. The hypostoma- tous leaves were held between two soft O-rings or with mounting tape. In all of the experiments the leaves were alive and remained attached to the plant. When the UME scans an illuminated portion of leaf, the tip responds to a combination of leaf topography and O, availability. The large background concentration of O, in air (and in air- saturated solution) makes the potential detection of photo- synthetically derived O, more difficult, particularly in a white region of the leaf, where chloroplasts are present only in the guard cells. To maximize the resolution for detecting O, generated in photosynthetic electron trans- port, two of the images were generated by placing the plant and experimental apparatus into a glove-bag for short pe- riods of time with reduced atmospheric O, (approximately 2% by volume).
To obtain images of leaf topography, the tip UME was brought to <10 pm from the leaf surface in the dark. The tip was moved in the y direction at a speed of 10 p m / s while collecting i,. After finishing one pass (usually 100- 250 pm), the tip was shifted 5 to 10 pm in the x direction and then returned in the opposite y direction. The time required to obtain a square image of 200 X 200 pm was 10 to 20 min. If desired, a series of stable, reproducible images of the same leaf area could be obtained sequentially over severa1 hours, depending on suitable control of leaf condi- tions. To map the topography of open stomata in the ab- sence of O, generated by photosynthesis, 0.1 M KCI (Hum- ble and Hsiao, 1969) was used to open stomates in one image. For a11 images taken directly over a stomatal com- plex, the location of the complex was first detected by topographic scan before any O, measurements were taken.
In addition to examining topography and O, evolution across the surface of the leaf, we also examined the re- sponse of specific white and green positions on the leaf to a step change in light availability (from 800 pE m-’s-’, to dark, and back to 800 pE m-’ s-’). For these experiments (Figs. 6B and 7B), the UME tip was positioned directly above an illuminated stomatal complex until i, reached a steady maximum. The light was then switched off for 5 to 10 min, after which PAR was restored to 800 pE m-’ s-’. i, was monitored continuously throughout the changes in illumination. This fixed-tip approach was used because stomatal aperture can change rapidly over the 10 to 20 min required to image a 200- x 200-pm leaf region after a change in PAR. Focusing on individual stomata yielded much more precise results.
RESULTS
Typical steady-state voltammograms (graphs of i, versus E ) in buffer saturated with 21, 10, and 2% O, show the sensitivity of the UME to O, (Fig. 2). During SECM exper- iments the tip UME was biased at a potential of -0.95 V, at

898
-1.2
-0.8
s -- 9 3
Q O .-
-0.4
O
Tsionsky et al. Plant Physiol. Vol. 11 3, 1997
O -0.2 -0.4 -0.6 -0.8 -1
E, V (Ag/AgCI)
Figure 2. Typical cyclic voltammograms (ir versus 0 for the reduction of dissolved O, measured with a 7-pm-diameter carbon UME tip in ammonium buffer solution (pH 7.0). Curve 1 corresponds to an air- saturated solution (79% N,, 21% O,), curve 2 to a solution saturated in 90% N, and 10% O,, and curve 3 to a solution saturated in 98% N, and 2% O,. iT initially increases with applied potential (0 for all curves, eventually becoming independent of potential but linearly dependent on O, concentration. The pair of curves for each O, concentration represent the two cases of ascending and descending E.
which leve1 voltammograms show well-defined, diffusion- limiting current for dissolved oxygen reduction that is relatively independent of potential but linearly dependent on O, concentration (Fig. 2).
The ability of the UME to detect O, generated in photo- synthesis above an individual stomatal complex is shown clearly by graphing i, versus the distance between the UME tip and the leaf (Fig. 3A). Curves 1 and 2 were both generated in an air-saturated solution, but were generated in the dark and light, respectively (Fig. 3A). In the dark (without photosynthesis and with stomates closed), i, de- creased as the UME tip approached the leaf surface, in precise agreement with SECM theory for an insulative substrate in negative feedback (Fig. 3A, curve 1; solid line generated from Eq. 2). In the presence of PAR, however, normalized i, was constant until approximately 10 pm distance from the leaf, below which it increased in response to photosynthetically generated O, diffusing through the stomate (Fig. 3A, curve 2). Figure 3B (curve 1) shows the identical theoretical line presented in Figure 3A, but at an expanded scale of distance. If a previously illuminated leaf is placed in the dark and quickly examined with the SECM, normalized i, does not immediately follow SECM theory for an insulative substrate (Fig. 3B, curve 2) . This results from residual O, evolution/diffusion from the leaf to the solution. After a short time, an equilibrium is reached and the leaf surface begins to show pure insulative behavior (Fig. 38, curve 2 converges to curve 1).
To present the physical structure of the stomatal complex in T. fluminensis, a scanning electron microscopy image of
such a complex is presented in Figure 4. The guard cells are approximately 40 pm in length (the reference bar is 20 pm long). A topographic image by SECM of a 200- X 200-pm leaf area shows three stomatal complexes (Fig. 5). Prior to making the image, the stomates were opened by applying 0.1 M KCI, and SECM clearly detects the open stomatal pores. Because the SECM was operating in negative- feedback mode, the image in Figure 5A is inverted (i.e. the dark areas represent bulges on the leaf surface and corre- spond to low iT). This inverted image can be converted to the proper physical orientation by Equation 2 (Fig. 5B). As measured with SECM, a typical T. fluminensis stomatal complex protrudes approximately 4 pm from the sur- rounding epidermal region of the leaf.
In addition to purely topographic images, SECM can be used to monitor O, evolution from an illuminated leaf for an individual stomate or leaf region. Such a 200- X 200-pm region of a green leaf shows three peaks in i, correspond- ing to O, evolution from three stomata (Fig. 6A). i, values for these peaks are at least twice background i, for the leaf
I .40
- C g 2
U o 1.00
- B E ô Z 0.60
0.20
O” o 0
O 2 0 Light
O 10 20 30 40
Distance, pm
“ I
O 50 100 150 200
Distance, pm
Figure 3. Normalized ir as a func t ion of distance to the surface of a green leaf maintained in the dark (A, curve 1) and in t he light (A, curve 2). Curve 1 (A) was generated by moving the UME tip toward the stomate of a leaf immersed in air-saturated solution and in darkness for 20 min. Curve 2 (A) is for an illuminated leaf in solution saturated with low O, (air with 2% O,). The solid “line” in both panels is the theoretical path for the approach of a tip to a n insulative surface (generated from Eq. 2). iT for a leaf maintained in the dark matches the theoretical path almost perfectly in the absence of O, evolution (A, curve 1) . 8, Curve 2 shows the approach of the UME tip for a leaf recently placed in the dark. Because of residual O, diffu- sion, the leaf does not yet act as a perfect insulator. Al l measurements were made with a 7-pm-diameter carbon microelectrode.

Photosynthetic Electron Transport and Scanning Electrochemical Microscopy 899
Figure 4. Scanning electron microscopy image of a stomatal com-plex of T. fluminensis. Bar = 20 /j,m.
surface as a whole. Figure 6A cannot be inverted into astrictly topographic image because i-v reflects both topog-raphy and O2 evolution, so to contrast images of a leaf inthe light and dark, Figure 6A should be compared withFigure 5A.
If the UME tip is held in position above an individualstomate, the response to changes in PAR can be examined.When the light source is eliminated, /'-,- decreases as O2
evolution from the stomate slows (Fig. 6B). The signal doesnot completely disappear, because of residual diffusion ofO2 into the solution and because the solution maintains aminimum equilibrium O2 concentration. When the PAR isrestored, / , increases as photosynthesis and O2 evolutionrecommence (Fig. 6B).
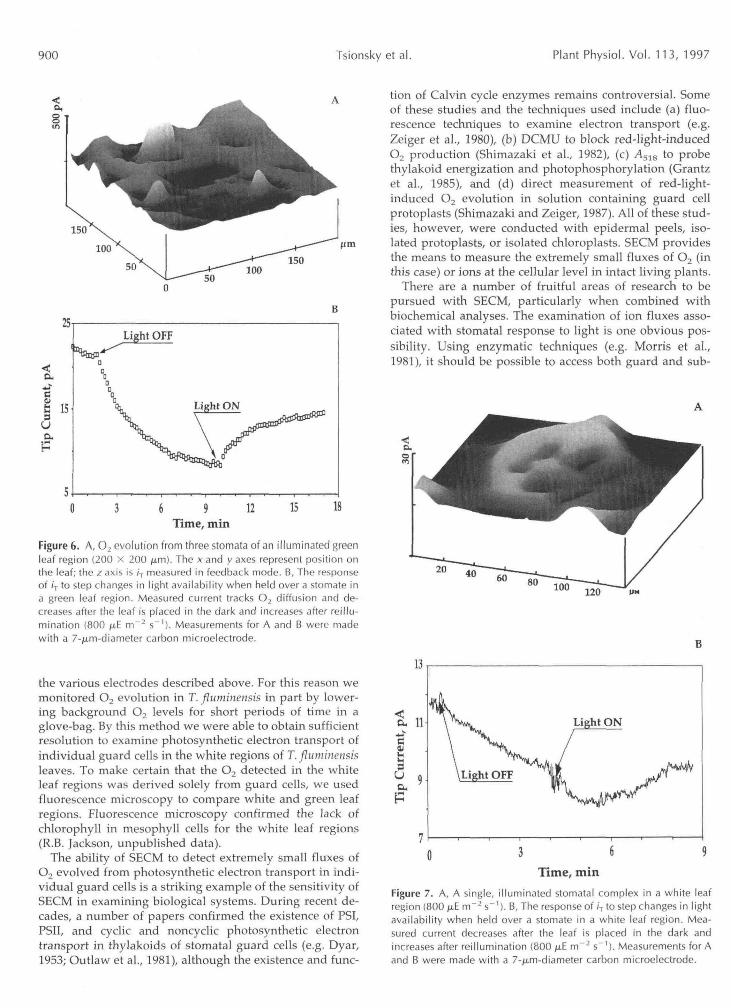
Having demonstrated the usefulness of SECM for topog-raphy and for O2 evolution in a green leaf, we then exam-ined in vivo photosynthetic electron transport in guardcells of a white leaf region, in which functional, greenchloroplasts are present only in the guard cells. An SECMimage of such a region is presented in Figure 7A. Thestomatal complex is visible as a ring-shaped structure witha peak in the center due to O2 evolution. Additional evi-dence for photosynthetic electron transport in guard cells isprovided by manipulating PAR while holding the UME tipabove an individual stomate. When the light source iseliminated, ;'.,- decreases as O2 evolution from the guardcells slows (Fig. 7B). The signal does not decrease (orincrease) as quickly as in Figure 6B because the O2 signal ismuch smaller in the white portion of the leaf than in thegreen. When PAR is restored, a detectable increase in i'Tand O2 evolution is visible beginning approximately 2 minafter restoration of the light (Fig. 7B).
DISCUSSION
There are two kinds of electrode probes used in SECM.The most convenient are voltammetric electrodes, in which
an electrochemical reaction can be driven and a resultingcurrent is measured. The O2 electrode is this type of probe,with O2 reduced to H2O2 at a carbon electrode. Voltam-metric electrodes are used to measure other species thatcan undergo oxidation or reduction (e.g. hydroquinone,ascorbic acid, dopamine, etc.). The second type of electrodeis the potentiometric probe (Area et al., 1994), which issimilar to a specific ion electrode, in which the potentialresponds to the concentration (activity) of a particular spe-cies. Potentiometric probes can be made for H+, K+, andNH4
+, as just a few examples.For most photosynthetic studies, measuring CO2 uptake
is more desirable than measuring O2 evolution due to thelower background signature of CO2 in air (350 versus210,000 joiL L"1 for CO2 and O2, respectively). Unfortu-nately, there is not yet a convenient method in SECM tomonitor CO2 evolution from chemical or biological sub-strates. Measurements of CO2 are possible through changesin solution pH, although the method is not as accurate as
50100
ISO
50
Figure 5. SECM images of a green portion of the leaf obtained witha 7-ju.m-diameter carbon tip in an air-saturated solution in the dark.A, /, across the leaf surface. Because the data were generated innegative-feedback mode, the image is inverted (i.e. the dark areasrepresent bulges on the surface and correspond to low /•,). B, Theimage in A returned to the proper physical orientation (y axis in jam).The images were obtained 30 min after addition of 0.1 M KCI to thebuffer solution to open stomates.
900 Tsionsky et al. Plant Physiol. Vol. 113, 1997
25
.ss isua,p
Light OFF
6 9 12Time, min
15 18
Figure 6. A, O2 evolution from three stomata of an illuminated greenleaf region (200 x 200 ^im). The x and y axes represent position onthe leaf; the z axis is ir measured in feedback mode. B, The responseof /T to step changes in light availability when held over a stomate ina green leaf region. Measured current tracks O2 diffusion and de-creases after the leaf is placed in the dark and increases after reillu-mination (800 fj,E rrT2 s"1). Measurements for A and B were madewith a 7-^.m-diameter carbon microelectrode.
the various electrodes described above. For this reason wemonitored O2 evolution in T. fluminensis in part by lower-ing background O2 levels for short periods of time in aglove-bag. By this method we were able to obtain sufficientresolution to examine photosynthetic electron transport ofindividual guard cells in the white regions of T. fluminensisleaves. To make certain that the O2 detected in the whiteleaf regions was derived solely from guard cells, we usedfluorescence microscopy to compare white and green leafregions. Fluorescence microscopy confirmed the lack ofchlorophyll in mesophyll cells for the white leaf regions(R.B. Jackson, unpublished data).
The ability of SECM to detect extremely small fluxes ofO2 evolved from photosynthetic electron transport in indi-vidual guard cells is a striking example of the sensitivity ofSECM in examining biological systems. During recent de-cades, a number of papers confirmed the existence of PSI,PSII, and cyclic and noncyclic photosynthetic electrontransport in thylakoids of stomatal guard cells (e.g. Dyar,1953; Outlaw et al., 1981), although the existence and func-
tion of Calvin cycle enzymes remains controversial. Someof these studies and the techniques used include (a) fluo-rescence techniques to examine electron transport (e.g.Zeiger et al., 1980), (b) DCMU to block red-light-inducedO2 production (Shimazaki et al., 1982), (c) A518 to probethylakoid energization and photophosphorylation (Grantzet al., 1985), and (d) direct measurement of red-light-induced O2 evolution in solution containing guard cellprotoplasts (Shimazaki and Zeiger, 1987). All of these stud-ies, however, were conducted with epidermal peels, iso-lated protoplasts, or isolated chloroplasts. SECM providesthe means to measure the extremely small fluxes of O2 (inthis case) or ions at the cellular level in intact living plants.
There are a number of fruitful areas of research to bepursued with SECM, particularly when combined withbiochemical analyses. The examination of ion fluxes asso-ciated with stomatal response to light is one obvious pos-sibility. Using enzymatic techniques (e.g. Morris et al.,1981), it should be possible to access both guard and sub-
20 40 60 80 100 120
13
11
? 9
Light ON
Time, minFigure 7. A, A single, illuminated stomatal complex in a white leafregion (800 /^E rrT2 s"1). B, The response of /T to step changes in lightavailability when held over a stomate in a white leaf region. Mea-sured current decreases after the leaf is placed in the dark andincreases after reillumination (800 /xE m~2 s"1). Measurements for Aand B were made with a 7-/nm-diameter carbon microelectrode.

Photosynthetic Electron Transport and Scanning Electrochemical Microscopy 901
sidiary cell membranes with the SECM. The flux of H+ or K+ from both cell types could then be examined in vivo with a potentiometric probe as the quantity and wave- length of the light varied. Guard and subsidiary cell re- sponses to long-term (Field et al., 1995) and short-term (Mott, 1990) perturbations in CO, concentrations could be similarly explored. Longer term, we hope to develop a gas-phase scheme for measuring CO, and H,O fluxes di- rectly with SECM. Of course, the usefulness of SECM in examining in vivo cell physiology is not limited to studying stomata. SECM could be used to examine the regulation of other cell types that undergo reversible changes in turgor or those in which function depends on ion flux. Possibili- ties include pulvinal cells moving in response to light or circadian cycles (e.g. Schrempf et al., 1976; Bjorkmann and Prowles, 1981), floral cells regulating reversible opening and closing of flowers, and the selective absorption or exudation of compounds in localized root zones (e.g. Clarkson, 1985).
ACKNOWLEDCMENTS
We thank S. Assmann, S. Roux, J. Berry, and two anonymous reviewers for helpful comments on the manuscript. We also thank John Mendenhall and the Cell Research Institute at the University of Texas for assistance with the scanning electron microscopy image, and R.M. Brown for use of the fluorescence microscope.
Received June 24, 1996; accepted November 21, 1996. Copyright Clearance Center: 0032-0889 /97/ 113/ 0895/ 07.
LITERATURE ClTED
Arca M, Bard AJ, Horrocks BR, Richards TC, Treichel DA (1994) Advances in scanning electrochemical microscopy. Analyst 119:
Assmann S (1993) Signal transduction in guard cells. Annu Rev Cell Biol 9: 345-375
Bard AJ, Fan FF, Pierce DT, Unwin PR, Wipf DO, Zhou F (1991) Chemical imaging of surfaces with the scanning electrochemical microscope. Science 254 68-74
Bard AJ, Fan FRF, Kwak J, Lev O (1989) Scanning electrochemical microscopy: introduction and principles. Ana1 Chem 61: 132-138
Bard AJ, Faulkner LR (1980) Electrochemical Methods: Funda- mentals and Applications. John Wiley & Sons, New York, p 145
Bjorkmann O, Prowles SB (1981) Leaf movement in the shade species Oxulis oregana. I. Response to light leve1 and light quality. Carnegie Institution of Washington Year Book 80: 59-62
Cardon ZG, Berry J (1992) Effects of O, and CO, concentration on the steady-state fluorescence yield of single guard cell pairs in intact leaf discs of Tradescantia albiflora. Plant Physiol 99: 1238- 1244
Clarkson DT (1985) Factors affecting mineral nutrient acquisition by plants. Annu Rev Plant Physiol 36: 77-115
Dyar MT (1953) Studies on the reduction of a tetrazolium salt by green plant tissue. Am J Bot 40: 20-25
Field CB, Jackson RB, Mooney HA (1995) Stomatal responses to, increased CO,: implications from the plant to the global scale. Plant Cell Environ 18: 1214-1225
Gautier H, Vavasseur A, Gans P, Lascève G (1991) Relationship between respiration and photosynthesis in guard cell and me- sophyll cell protoplasts of Commelina communis L. Plant Physiol
Grantz DA, Graan T, Boyer JS (1985) Chloroplast function in
719-726
95: 636-641
guard cells of Vicia faba L. Measurement of the electrochromic absorbance change at 518 nm. Plant Physiol 77: 956-962
Hansma PK, Drake B, Marti O, Gould SNC, Prater CB (1989) The scanning ion-conductance microscope. Science 243: 641-643
Henriksen GH, Taylor AR, Brownlee C, Assmann SM (1996) Laser microsurgery of higher plant cell walls permits patch- clamp access. Plant Physiol 110 1063-1068
Horrocks BR, Mirkin MV, Bard AJ (1994) Application to investi- gation of the kinetics of heterogeneous electron transfer of semi- conductor electrodes. J Phys Chem 98: 9106-9114
Humble GD, Hsiao TC (1969) Specific requirement for potassium for light-activated opening of stomata in epidermal strips. Plant Physiol 44: 230-234
Jackson RB, Woodrow IE, Mott KA (1991) Nonsteady-state pho- tosynthesis following an increase in photon flux density (PFD): effects of magnitude and duration of initial PFD. Plant Physiol
Lee C, Kwak J, Bard AJ (1990) Application of scanning electro- chemical microscopy to biological samples. Proc Natl Acad Sci
MacRobbie EAC (1987) Ionic relations of guard cells. In E Zeiger, GD Farquhar, IR Cowan, eds, Stomatal Function. Stanford Uni- versity Press, Stanford, CA, pp 125-162
Melis A, Zeiger E (1982) Chlorophyll a fluorescence transients in mesophyll and guard cells. Plant Physiol 69: 642-647
Mirkin MV, Arca M, Bard AJ (1992) Direct electrochemical mea- surements inside a 2000A thick polymer film by scanning elec- trochemical microscopy. Science 257: 364-366
Morris P, Linstead P, Thain JF (1981) Comparative studies of leaf tissue and isolated protoplasts. 111. Effects of wall degrading enzymes and osmotic stress. J Exp Bot 3 2 801-811
Mott KA (1990) Sensing of atmospheric CO, by plants. Plant Cell Environ 13: 731-737
Outlaw WH Jr, Mayne BC, Zenger VE, Manchester J (1981) Presence of both photosystems in guard cells of Vicia faba L. Implications for environmental signal processing. Plant Physiol 67: 12-16
Reckmann U, Scheibe R, Raschke K (1990) Rubisco activity in guard cells compared with the solute requirement for stomatal opening. Plant Physiol 92: 246-253
Schrempf M, Satter RL, Galston AW (1976) Potassium-linked chloride fluxes during rhythmic leaf movements of Albizzia julibrissin. Plant Physiol 58: 190-192
Sestak Z, Catsky J, Jarvis PG (1971) Plant Photosynthetic Produc- tion: Manual of Methods. Junk, The Hague, The Netherlands
Shimazaki KI (1989) Ribulose bisphosphate carboxylase activity and photosynthetic O, evolution rate in Vicia guard-cell proto- plasts. Plant Physiol 91: 459463
Shimazaki K-I, Gotow K, Kondo N (1982) Photosynthetic prop- erties of guard cell protoplasts from Vicia faba L. Plant Cell Physiol 23: 871-879
Shimazaki K-I, Zeiger E (1987) Red light-dependent CO, uptake and oxygen evolution in guard cell protoplasts of Vicia fuba L. Evidence for photosynthetic CO, fixation. Plant Physiol 84: 7-9
Wei C, Bard AJ (1995) Application of SECM to the study of charge transfer processes at the liquid/liquid interface. J Phys Chem 99:
Wipf DO, Bard AJ (1991) Scanning electrochemical microscopy 7 effect of heterogeneous electron transfer rate at the substrate on the tip feedback. J Electrochem SOC 138: 469474
Wu W, Assmann SM (1993) Photosynthesis by guard cell chloro- plasts of Vicia faba L.: effects of factors associated with stomatal movement. Plant Cell Physiol 3 4 1015-1022
Zeiger E, Armond P, Melis A (1980) Fluorescence properties of guard cell chloroplasts. Evidence for linear electron transport and light-harvesting pigments of photosystems I and 11. Plant Physiol 67: 17-20
Zeiger E, Farquhar GD, Cowan IR (1987) Stomatal Function. Stanford University Press, Stanford, CA
95: 498-503
USA 87: 1740-1743
16033-16042


