PHOTOLUMINESCENCE SPECTROMETER FLS1000
24
FLS1000 PHOTOLUMINESCENCE SPECTROMETER
Transcript of PHOTOLUMINESCENCE SPECTROMETER FLS1000
FLS1000
PHOTOLUMINESCENCE SPECTROMETER

The FLS1000 is a state-of-the-art, modular photoluminescence spectrometer for the most
demanding applications in Photophysics, Photochemistry, Material Sciences and Life Sciences.
The instrument sets the standards in both steady state and time-resolved spectroscopy:
The system demonstrates unmatched sensitivity and can be configured for spectral measurements
from the ultraviolet to the mid-infrared spectral range, and for lifetime measurements spanning
time resolutions over 12 orders of magnitude from picoseconds to seconds.
The World’s Most Sensitive Photoluminescence Spectrometer
The Industry Leading Photoluminescence Lifetime Spectrometer
Maps – Adding an Extra Dimension
FLS1000 Combined Steady State & Time-Resolved Photoluminescence Spectrometer
Sample Holders and Temperature Control
Configurations
Applications Overview
Techical Specifications
4
8
12
16
20
21
22
23
APPLICATIONS
LifeSciences
Geology
Material Sciences
EnvironmentalSciences
Forensic Sciences and
Security
TECHNIQUES
Molecular Processes and Mechanisms
Singlet Oxygen Detection Display
Industry
Fluorescence Based Assays
PhotodynamicTherapy
Authentication of Counterfeits
Identification of Materials
Energy Conversion and Storage
Drug Discovery
TraceAnalysis
Explosives Detection
Laser GainMedia
Fluorescent Inks
Total OrganicContent
DNASequencing
SAMPLE TYPES
Nanotubes
LaserMaterials
FluorescentBeads
Lanthanides
SemiconductorBand-Gap
QuantumWells
Upconversion materials
Phosphors
Excitons
SyntheticDyes
Nanospheres
Phonons
QuantumDots
QuantumRods
Photo-voltaicMaterials
Natural Dyes
Temperature DependenceQuantum Yield ChromaticityFRETEEM
Circularly-Polarised LuminescenceTime-Resolved Anisotropy
Spectral AnisotropyTitration
TRES
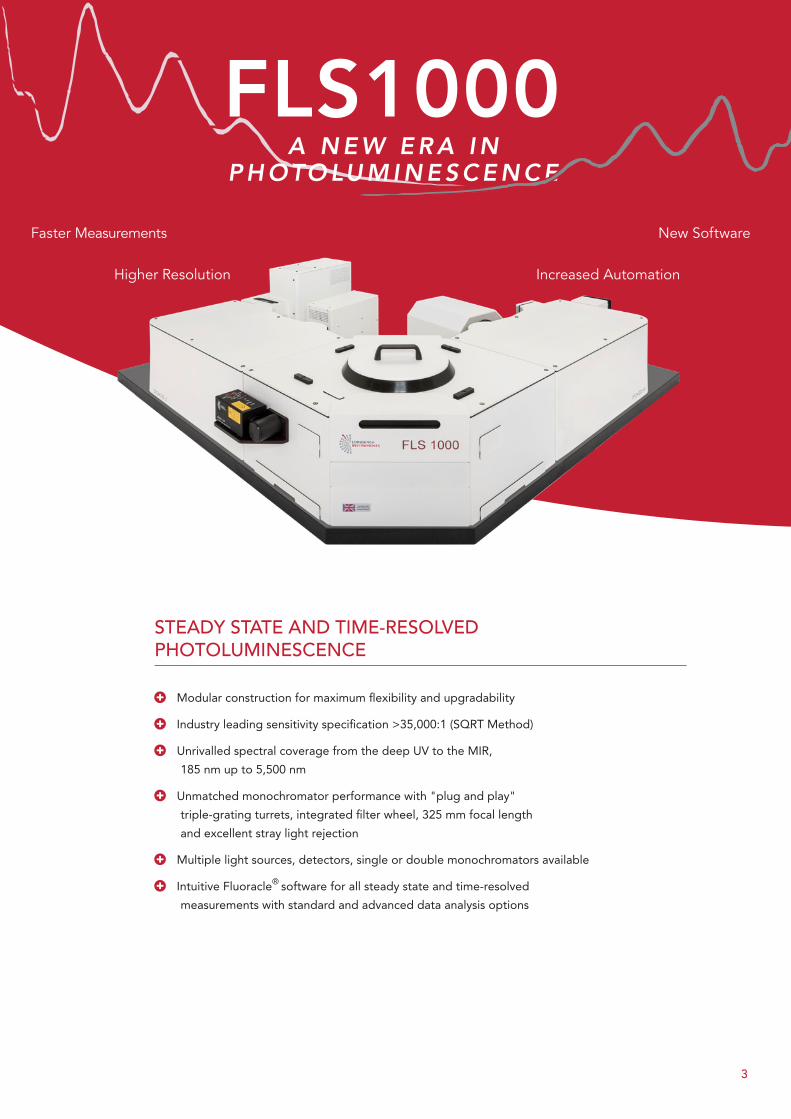
STEADY STATE AND TIME-RESOLVED PHOTOLUMINESCENCE
Higher Resolution
New SoftwareFaster Measurements
Increased Automation
A N E W E R A I N P H OTO LU M I N E SC E N C E
FLS1000
� Modular construction for maximum flexibility and upgradability
� Industry leading sensitivity specification >35,000:1 (SQRT Method)
� Unrivalled spectral coverage from the deep UV to the MIR,
185 nm up to 5,500 nm
� Unmatched monochromator performance with "plug and play"
triple-grating turrets, integrated filter wheel, 325 mm focal length
and excellent stray light rejection
� Multiple light sources, detectors, single or double monochromators available
� Intuitive Fluoracle® software for all steady state and time-resolved
measurements with standard and advanced data analysis options
3
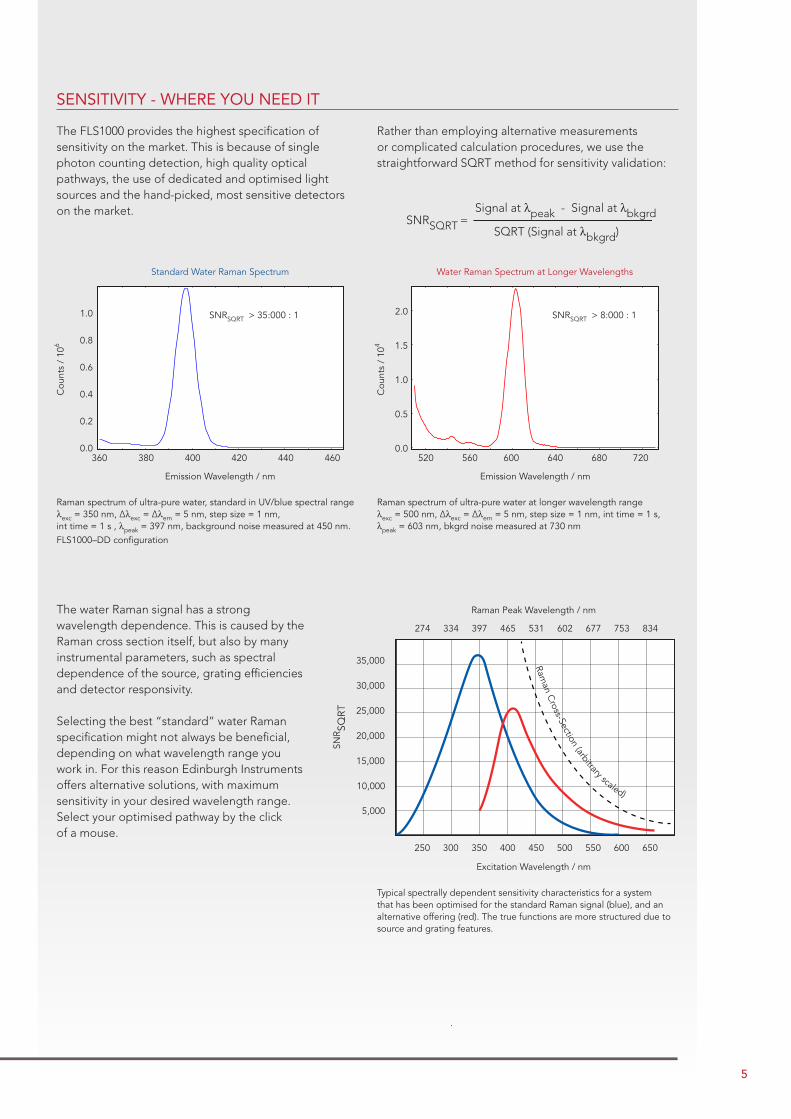
Raman Spectrum of CCl4, measured with a FLS1000-SS (single monochromators, blue) and FLS1000-DD (double monochromators, red), λexc = 348 nm, Δλexc = Δλem = 0.5 nm, step size = 0.05 nm.
0.51.01.52.02.53.03.54.04.55.0
350 352 354 356 358 360
Coun
ts/1
04
Em Wavelength/nm
Cou
nts
/ 10
4
1.0
2.0
3.0
4.0
5.0
Emission Wavelength / nm
350 352 354 356 358 360
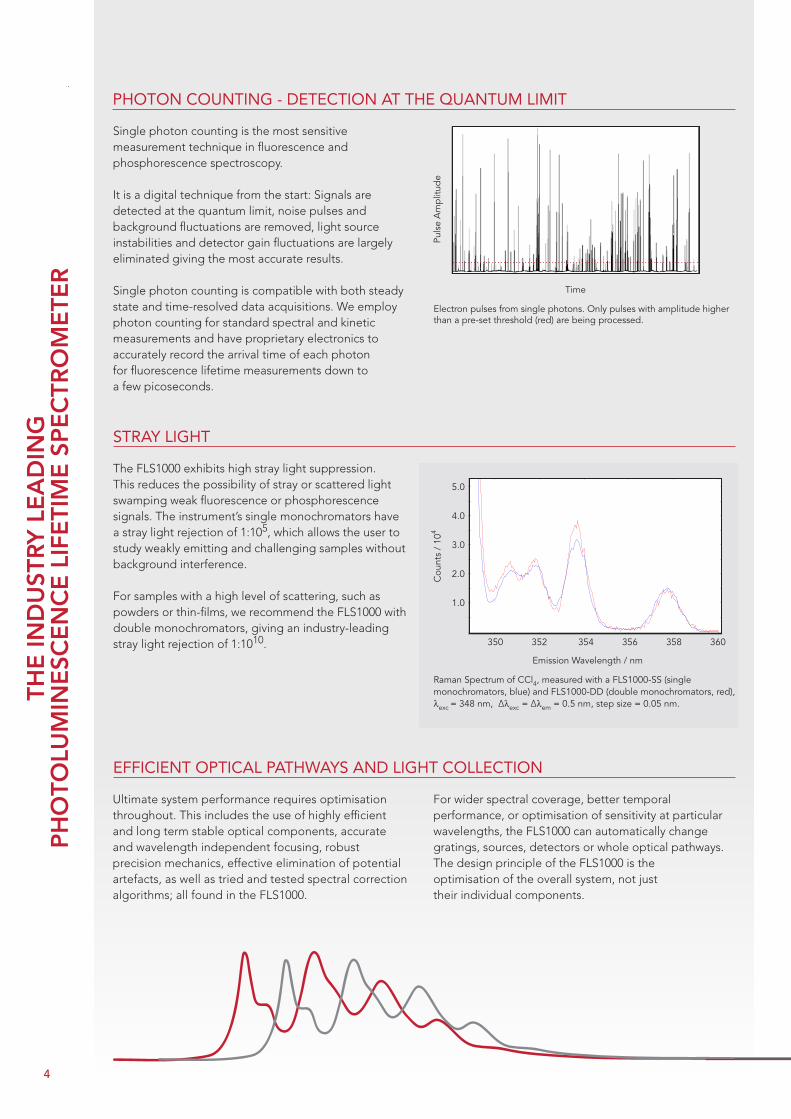
Electron pulses from single photons. Only pulses with amplitude higher than a pre-set threshold (red) are being processed.
Puls
e A
mp
litud
e
Time
The FLS1000 exhibits high stray light suppression. This reduces the possibility of stray or scattered light swamping weak fluorescence or phosphorescence signals. The instrument’s single monochromators have a stray light rejection of 1:105, which allows the user to study weakly emitting and challenging samples without background interference.
For samples with a high level of scattering, such as powders or thin-films, we recommend the FLS1000 with double monochromators, giving an industry-leading stray light rejection of 1:1010.
STRAY LIGHT
EFFICIENT OPTICAL PATHWAYS AND LIGHT COLLECTION
Ultimate system performance requires optimisation throughout. This includes the use of highly efficient and long term stable optical components, accurate and wavelength independent focusing, robust precision mechanics, effective elimination of potential artefacts, as well as tried and tested spectral correction algorithms; all found in the FLS1000.
For wider spectral coverage, better temporal performance, or optimisation of sensitivity at particular wavelengths, the FLS1000 can automatically change gratings, sources, detectors or whole optical pathways. The design principle of the FLS1000 is the optimisation of the overall system, not just their individual components.
Single photon counting is the most sensitive measurement technique in fluorescence and phosphorescence spectroscopy.
It is a digital technique from the start: Signals are detected at the quantum limit, noise pulses and background fluctuations are removed, light source instabilities and detector gain fluctuations are largely eliminated giving the most accurate results.
Single photon counting is compatible with both steady state and time-resolved data acquisitions. We employ photon counting for standard spectral and kinetic measurements and have proprietary electronics to accurately record the arrival time of each photon for fluorescence lifetime measurements down to a few picoseconds.
PHOTON COUNTING - DETECTION AT THE QUANTUM LIMIT
THE
IND
UST
RY L
EA
DIN
G
PH
OTO
LUM
INE
SCE
NC
E L
IFE
TIM
E S
PE
CTR
OM
ETE
R
4
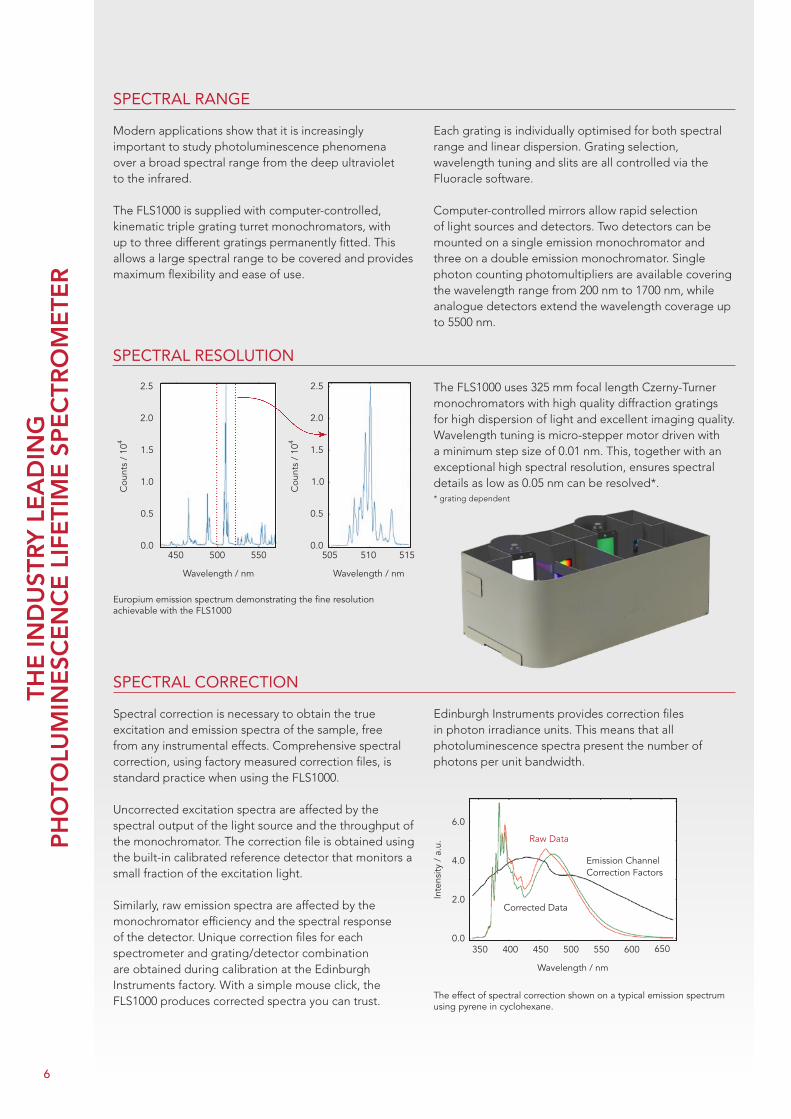
Raman spectrum of ultra-pure water, standard in UV/blue spectral range λexc = 350 nm, Δλexc = Δλem = 5 nm, step size = 1 nm, int time = 1 s , λpeak = 397 nm, background noise measured at 450 nm. FLS1000–DD configuration
SNRSQRT =Signal at λpeak - Signal at λbkgrd
SQRT (Signal at λbkgrd)
Typical spectrally dependent sensitivity characteristics for a system that has been optimised for the standard Raman signal (blue), and an alternative offering (red). The true functions are more structured due to source and grating features.
Raman spectrum of ultra-pure water at longer wavelength range λexc = 500 nm, Δλexc = Δλem = 5 nm, step size = 1 nm, int time = 1 s, λpeak = 603 nm, bkgrd noise measured at 730 nm
0.0
0.2
0.4
0.6
0.8
1.0
360 380 400 420 440
Cou
nts
/ 10
6
Emission Wavelength / nm
0.0
0.2
0.4
0.6
0.8
1.0
360 380 400 420 440
Cou
nts
/ 10
6
Emission Wavelength / nm
0.0
0.2
0.4
0.6
0.8
1.0
360 380 400 420 440
Cou
nts
/ 10
6
Emission Wavelength / nm360 380 400 420 440 460
0.0
0.2
0.4
0.6
0.8
1.0
Cou
nts
/ 10
6
Emission Wavelength / nm
Standard Water Raman Spectrum
SNRSQRT > 35:000 : 1
0.0
0.5
1.0
1.5
2.0
520 560 600 640 680 720
Coun
ts /
104
Emission Wavelength / nm520 560 600 640 680 720
0.0
0.5
1.0
1.5
2.0
Cou
nts
/ 10
4
Emission Wavelength / nm
Water Raman Spectrum at Longer Wavelengths
SNRSQRT > 8:000 : 1
35,000
30,000
25,000
20,000
15,000
10,000
SNR SQ
RT
Raman Peak Wavelength / nm
Excitation Wavelength / nm
274 334 397 465 531 602 677 753 834
250 300 350 400 450 500 550 600 650
Raman C
ross-Section (arbitrary scaled)
5,000
The FLS1000 provides the highest specification of sensitivity on the market. This is because of single photon counting detection, high quality optical pathways, the use of dedicated and optimised light sources and the hand-picked, most sensitive detectors on the market.
Rather than employing alternative measurements or complicated calculation procedures, we use the straightforward SQRT method for sensitivity validation:
SENSITIVITY - WHERE YOU NEED IT
The water Raman signal has a strong wavelength dependence. This is caused by the Raman cross section itself, but also by many instrumental parameters, such as spectral dependence of the source, grating efficiencies and detector responsivity.
Selecting the best “standard” water Raman specification might not always be beneficial, depending on what wavelength range you work in. For this reason Edinburgh Instruments offers alternative solutions, with maximum sensitivity in your desired wavelength range. Select your optimised pathway by the click of a mouse.
5
The effect of spectral correction shown on a typical emission spectrum using pyrene in cyclohexane.
Europium emission spectrum demonstrating the fine resolution achievable with the FLS1000
450 5505000.0
0.5
2.5
2.0
1.0
1.5
Wavelength / nm
Cou
nts
/ 10
4
Wavelength / nm
Cou
nts
/ 10
4
2.5
2.0
1.5
1.0
0.5
0.0505 510 515
Raw Data
Corrected Data
Emission Channel Correction Factors
Wavelength / nm
Inte
nsity
/ a
.u.
6.0
4.0
2.0
0.0350 400 450 500 550 600 650
Modern applications show that it is increasingly important to study photoluminescence phenomena over a broad spectral range from the deep ultraviolet to the infrared.
The FLS1000 is supplied with computer-controlled, kinematic triple grating turret monochromators, with up to three different gratings permanently fitted. This allows a large spectral range to be covered and provides maximum flexibility and ease of use.
Each grating is individually optimised for both spectral range and linear dispersion. Grating selection, wavelength tuning and slits are all controlled via the Fluoracle software.
Computer-controlled mirrors allow rapid selection of light sources and detectors. Two detectors can be mounted on a single emission monochromator and three on a double emission monochromator. Single photon counting photomultipliers are available covering the wavelength range from 200 nm to 1700 nm, while analogue detectors extend the wavelength coverage up to 5500 nm.
SPECTRAL RANGE
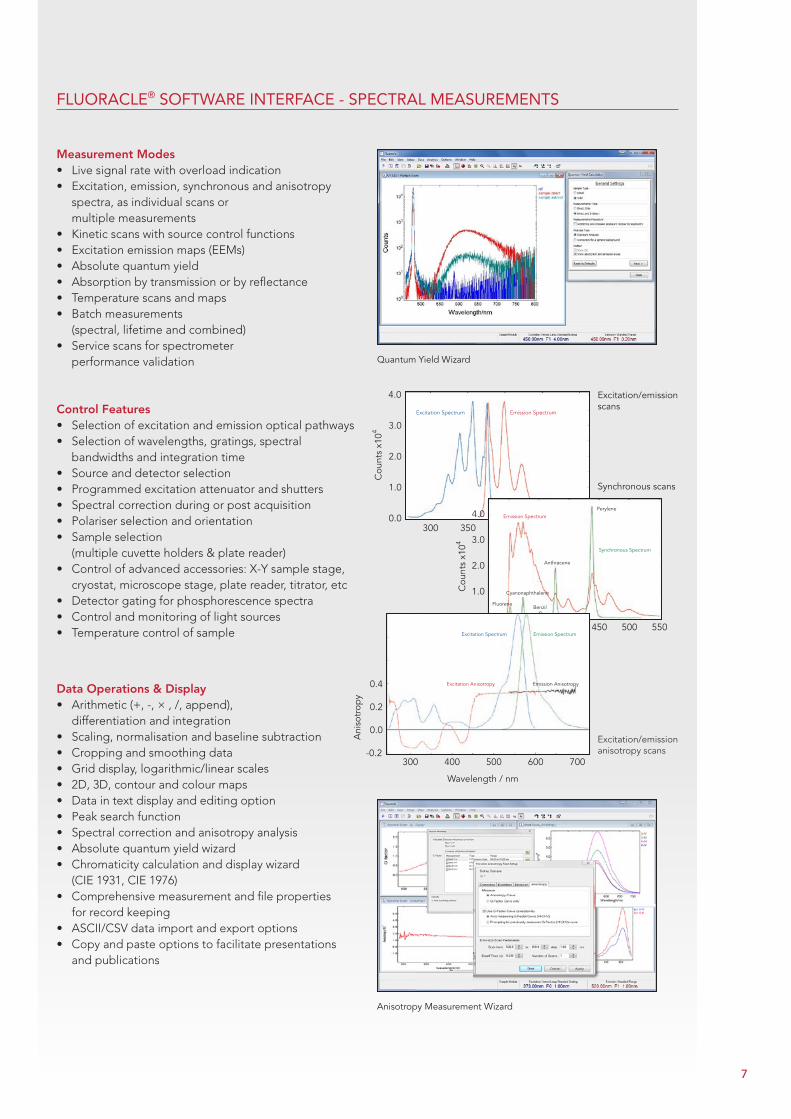
The FLS1000 uses 325 mm focal length Czerny-Turner monochromators with high quality diffraction gratings for high dispersion of light and excellent imaging quality. Wavelength tuning is micro-stepper motor driven with a minimum step size of 0.01 nm. This, together with an exceptional high spectral resolution, ensures spectral details as low as 0.05 nm can be resolved*.
SPECTRAL RESOLUTION
Spectral correction is necessary to obtain the true excitation and emission spectra of the sample, free from any instrumental effects. Comprehensive spectral correction, using factory measured correction files, is standard practice when using the FLS1000.
Uncorrected excitation spectra are affected by the spectral output of the light source and the throughput of the monochromator. The correction file is obtained using the built-in calibrated reference detector that monitors a small fraction of the excitation light.
Similarly, raw emission spectra are affected by the monochromator efficiency and the spectral response of the detector. Unique correction files for each spectrometer and grating/detector combination are obtained during calibration at the Edinburgh Instruments factory. With a simple mouse click, the FLS1000 produces corrected spectra you can trust.
Edinburgh Instruments provides correction files in photon irradiance units. This means that all photoluminescence spectra present the number of photons per unit bandwidth.
SPECTRAL CORRECTION
* grating dependent
THE
IND
UST
RY L
EA
DIN
G
PH
OTO
LUM
INE
SCE
NC
E L
IFE
TIM
E S
PE
CTR
OM
ETE
R
6
Quantum Yield Wizard
Anisotropy Measurement Wizard
450400350300 5000.0
1.0
4.0
2.0
3.0
Cou
nts
x104
Emission SpectrumExcitation Spectrum
Wavelength / nm
Excitation/emission scans
Wavelength / nm
300 500450400350 5500.0
1.0
4.0
2.0
3.0
Wavelength / nm
Cou
nts
x104
Anthracene
Benzil
Cyanonaphthalene
Fluorene
Perylene
Synchronous Spectrum
Emission Spectrum
Synchronous scans
Excitation/emission anisotropy scans
Ani
sotr
opy
Excitation Spectrum
Excitation Anisotropy Emission Anisotropy
Emission Spectrum
-0.2
0.0
0.2
0.4
300 600500400 700
Measurement Modes• Live signal rate with overload indication • Excitation, emission, synchronous and anisotropy
spectra, as individual scans or multiple measurements
• Kinetic scans with source control functions • Excitation emission maps (EEMs) • Absolute quantum yield • Absorption by transmission or by reflectance• Temperature scans and maps • Batch measurements
(spectral, lifetime and combined) • Service scans for spectrometer
performance validation
Control Features• Selection of excitation and emission optical pathways • Selection of wavelengths, gratings, spectral
bandwidths and integration time • Source and detector selection • Programmed excitation attenuator and shutters • Spectral correction during or post acquisition • Polariser selection and orientation • Sample selection
(multiple cuvette holders & plate reader) • Control of advanced accessories: X-Y sample stage,
cryostat, microscope stage, plate reader, titrator, etc • Detector gating for phosphorescence spectra • Control and monitoring of light sources • Temperature control of sample
Data Operations & Display• Arithmetic (+, -, × , /, append),
differentiation and integration • Scaling, normalisation and baseline subtraction • Cropping and smoothing data • Grid display, logarithmic/linear scales • 2D, 3D, contour and colour maps • Data in text display and editing option • Peak search function • Spectral correction and anisotropy analysis • Absolute quantum yield wizard • Chromaticity calculation and display wizard
(CIE 1931, CIE 1976) • Comprehensive measurement and file properties
for record keeping • ASCII/CSV data import and export options • Copy and paste options to facilitate presentations
and publications
FLUORACLE® SOFTWARE INTERFACE - SPECTRAL MEASUREMENTS
7
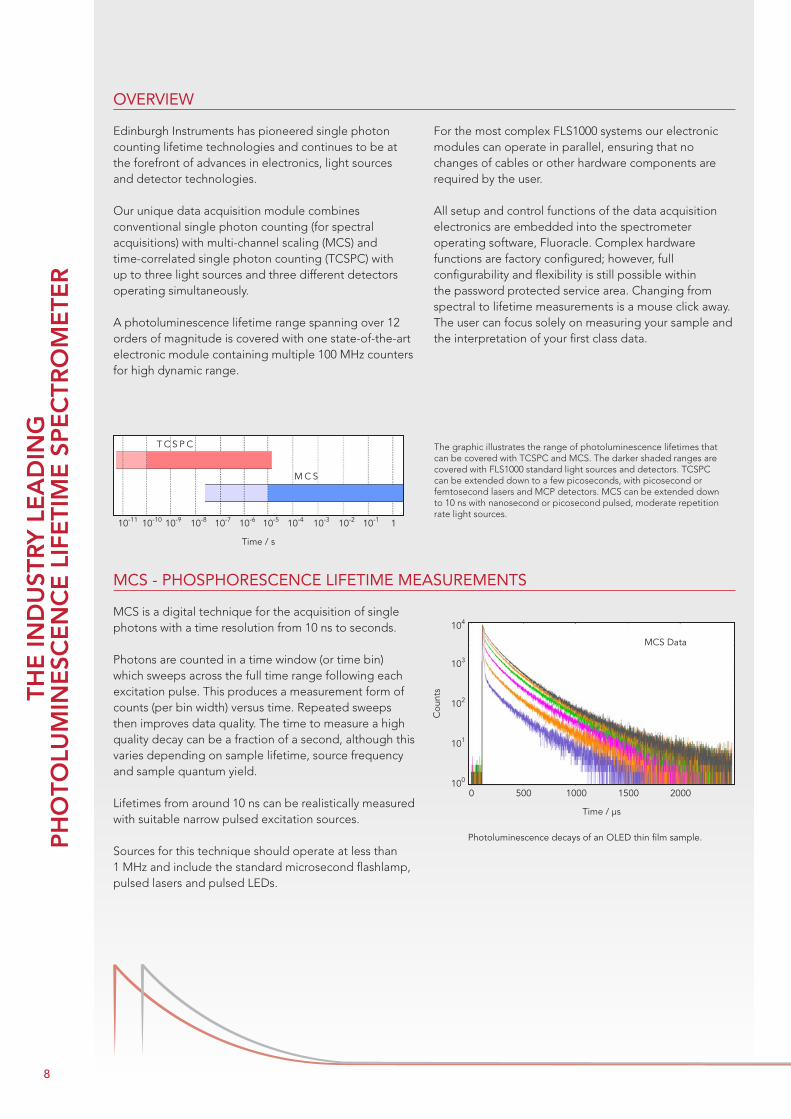
The graphic illustrates the range of photoluminescence lifetimes that can be covered with TCSPC and MCS. The darker shaded ranges are covered with FLS1000 standard light sources and detectors. TCSPC can be extended down to a few picoseconds, with picosecond or femtosecond lasers and MCP detectors. MCS can be extended down to 10 ns with nanosecond or picosecond pulsed, moderate repetition rate light sources.
Photoluminescence decays of an OLED thin film sample.
104
103
102
101
100
Cou
nts
Time / µs
0 500 1000 1500 2000
MCS Data
T C S P C
M C S
Time / s
10-610-10 10-9 10-8 10-7 10-5 10-4 10-3 10-2 10-110-11 1
MCS - PHOSPHORESCENCE LIFETIME MEASUREMENTS
MCS is a digital technique for the acquisition of single photons with a time resolution from 10 ns to seconds.
Photons are counted in a time window (or time bin) which sweeps across the full time range following each excitation pulse. This produces a measurement form of counts (per bin width) versus time. Repeated sweeps then improves data quality. The time to measure a high quality decay can be a fraction of a second, although this varies depending on sample lifetime, source frequency and sample quantum yield.
Lifetimes from around 10 ns can be realistically measured with suitable narrow pulsed excitation sources.
Sources for this technique should operate at less than 1 MHz and include the standard microsecond flashlamp, pulsed lasers and pulsed LEDs.
Edinburgh Instruments has pioneered single photon counting lifetime technologies and continues to be at the forefront of advances in electronics, light sources and detector technologies.
Our unique data acquisition module combines conventional single photon counting (for spectral acquisitions) with multi-channel scaling (MCS) and time-correlated single photon counting (TCSPC) with up to three light sources and three different detectors operating simultaneously.
A photoluminescence lifetime range spanning over 12 orders of magnitude is covered with one state-of-the-art electronic module containing multiple 100 MHz counters for high dynamic range.
For the most complex FLS1000 systems our electronic modules can operate in parallel, ensuring that no changes of cables or other hardware components are required by the user.
All setup and control functions of the data acquisition electronics are embedded into the spectrometer operating software, Fluoracle. Complex hardware functions are factory configured; however, full configurability and flexibility is still possible within the password protected service area. Changing from spectral to lifetime measurements is a mouse click away. The user can focus solely on measuring your sample and the interpretation of your first class data.
OVERVIEW
THE
IND
UST
RY L
EA
DIN
G
PH
OTO
LUM
INE
SCE
NC
E L
IFE
TIM
E S
PE
CTR
OM
ETE
R
8
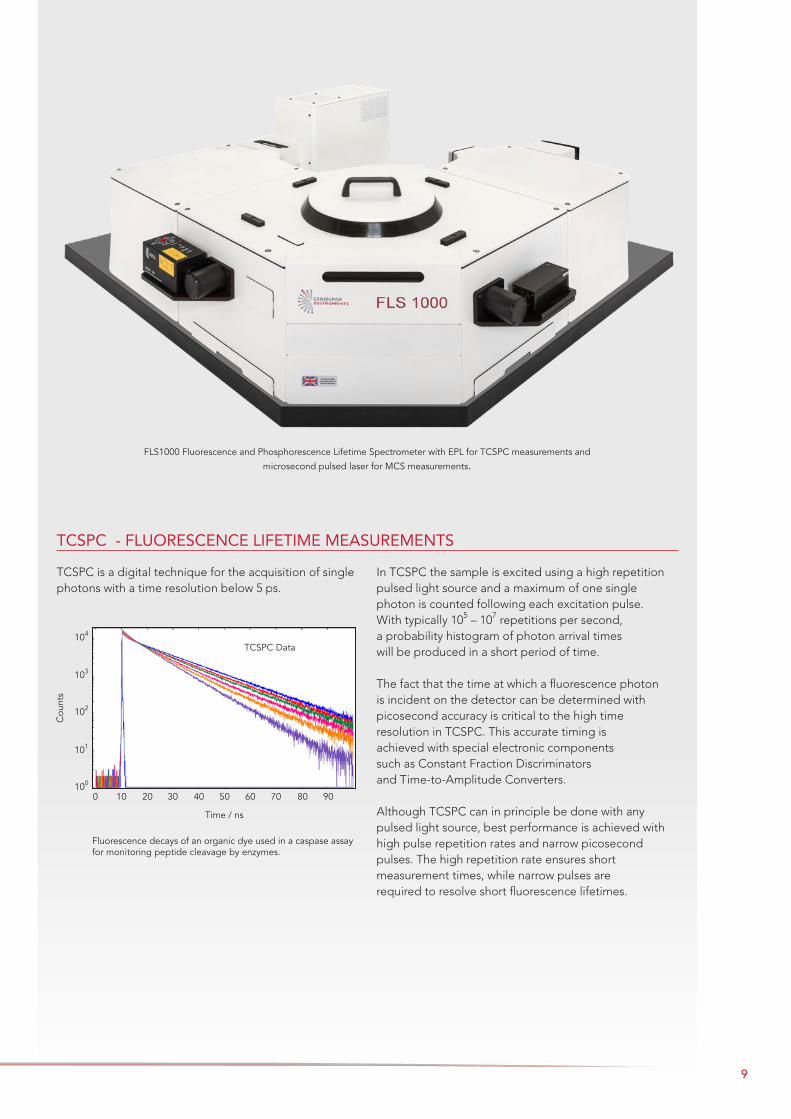
FLS1000 Fluorescence and Phosphorescence Lifetime Spectrometer with EPL for TCSPC measurements and
microsecond pulsed laser for MCS measurements.
Fluorescence decays of an organic dye used in a caspase assay for monitoring peptide cleavage by enzymes.
Cou
nts
Time / ns
102
103
104
100
101
10 20 30 40 50 60 70 800 90
TCSPC Data
TCSPC is a digital technique for the acquisition of single photons with a time resolution below 5 ps.
In TCSPC the sample is excited using a high repetition pulsed light source and a maximum of one single photon is counted following each excitation pulse. With typically 105 – 107 repetitions per second, a probability histogram of photon arrival times will be produced in a short period of time.
The fact that the time at which a fluorescence photon is incident on the detector can be determined with picosecond accuracy is critical to the high time resolution in TCSPC. This accurate timing is achieved with special electronic components such as Constant Fraction Discriminators and Time-to-Amplitude Converters.
Although TCSPC can in principle be done with any pulsed light source, best performance is achieved with high pulse repetition rates and narrow picosecond pulses. The high repetition rate ensures short measurement times, while narrow pulses are required to resolve short fluorescence lifetimes.
TCSPC - FLUORESCENCE LIFETIME MEASUREMENTS
9
5.10.0
-5.1
410
210
310
Cou
nts
Time/ns
010
110
0 20 40 60 80 100 120 140
4.30.0
-4.3Res
idua
ls
8.00.0
-8.0
2-exponential fit
3-exponential fit
4-exponential fit5.10.0
-5.1
410
210
310
Cou
nts
Time/ns
010
110
0 20 40 60 80 100 120 140
4.30.0
-4.3Res
idua
ls
8.00.0
-8.0
2-exponential fit
3-exponential fit
4-exponential fit5.10.0
-5.1
410
210
310
Cou
nts
Time/ns
010
110
0 20 40 60 80 100 120 140
4.30.0
-4.3Res
idua
ls
8.00.0
-8.0
2-exponential fit
3-exponential fit
4-exponential fit5.10.0
-5.1
410
210
310
Cou
nts
Time/ns
010
110
0 20 40 60 80 100 120 140
4.30.0
-4.3Res
idua
ls
8.00.0
-8.0
2-exponential fit
3-exponential fit
4-exponential fit
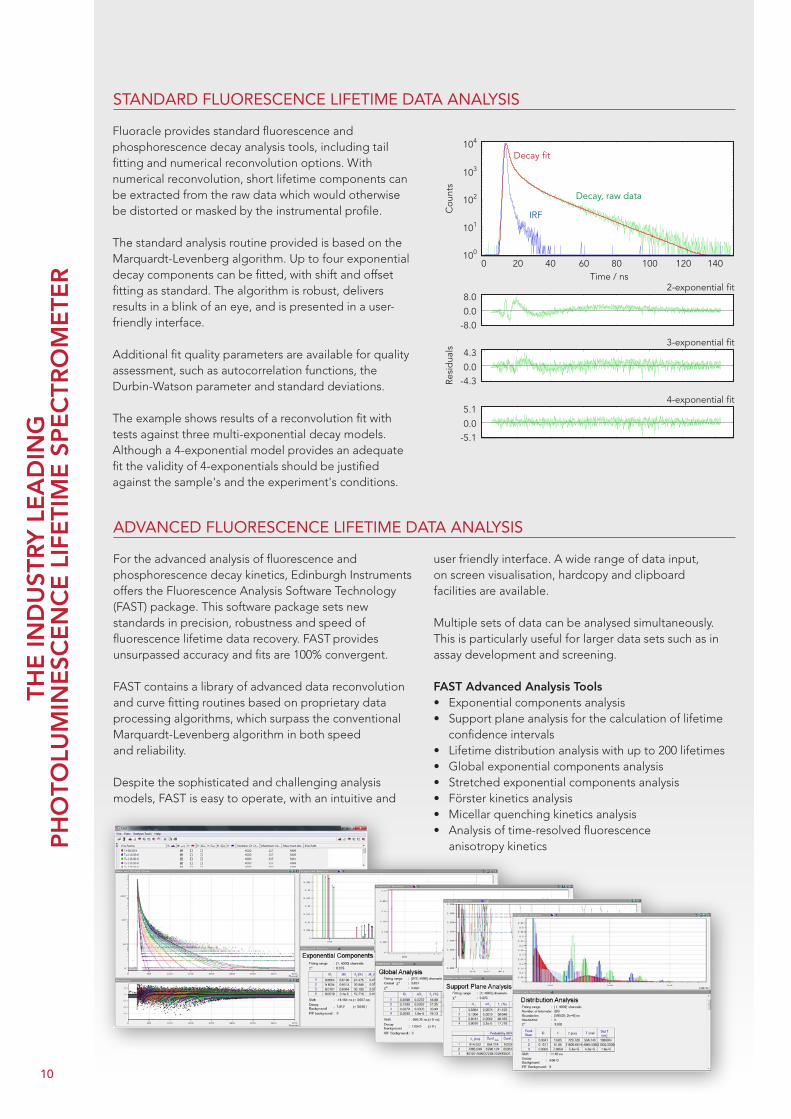
IRF
Decay, raw data
Decay fit
Cou
nts
Resi
dua
ls
Time / ns2-exponential fit
3-exponential fit
4-exponential fit
0 20 40 60 80 100 120 140
104
103
102
101
100
8.0
4.3
5.1
0.0
0.0
0.0
-8.0
-4.3
-5.1
STANDARD FLUORESCENCE LIFETIME DATA ANALYSIS
Fluoracle provides standard fluorescence and phosphorescence decay analysis tools, including tail fitting and numerical reconvolution options. With numerical reconvolution, short lifetime components can be extracted from the raw data which would otherwise be distorted or masked by the instrumental profile.
The standard analysis routine provided is based on the Marquardt-Levenberg algorithm. Up to four exponential decay components can be fitted, with shift and offset fitting as standard. The algorithm is robust, delivers results in a blink of an eye, and is presented in a user-friendly interface.
Additional fit quality parameters are available for quality assessment, such as autocorrelation functions, the Durbin-Watson parameter and standard deviations.
The example shows results of a reconvolution fit with tests against three multi-exponential decay models. Although a 4-exponential model provides an adequate fit the validity of 4-exponentials should be justified against the sample's and the experiment's conditions.
ADVANCED FLUORESCENCE LIFETIME DATA ANALYSIS
For the advanced analysis of fluorescence and phosphorescence decay kinetics, Edinburgh Instruments offers the Fluorescence Analysis Software Technology (FAST) package. This software package sets new standards in precision, robustness and speed of fluorescence lifetime data recovery. FAST provides unsurpassed accuracy and fits are 100% convergent.
FAST contains a library of advanced data reconvolution and curve fitting routines based on proprietary data processing algorithms, which surpass the conventional Marquardt-Levenberg algorithm in both speed and reliability.
Despite the sophisticated and challenging analysis models, FAST is easy to operate, with an intuitive and
user friendly interface. A wide range of data input, on screen visualisation, hardcopy and clipboard facilities are available.
Multiple sets of data can be analysed simultaneously. This is particularly useful for larger data sets such as in assay development and screening.
FAST Advanced Analysis Tools• Exponential components analysis• Support plane analysis for the calculation of lifetime
confidence intervals• Lifetime distribution analysis with up to 200 lifetimes• Global exponential components analysis• Stretched exponential components analysis• Förster kinetics analysis• Micellar quenching kinetics analysis• Analysis of time-resolved fluorescence
anisotropy kinetics
THE
IND
UST
RY L
EA
DIN
G
PH
OTO
LUM
INE
SCE
NC
E L
IFE
TIM
E S
PE
CTR
OM
ETE
R
10
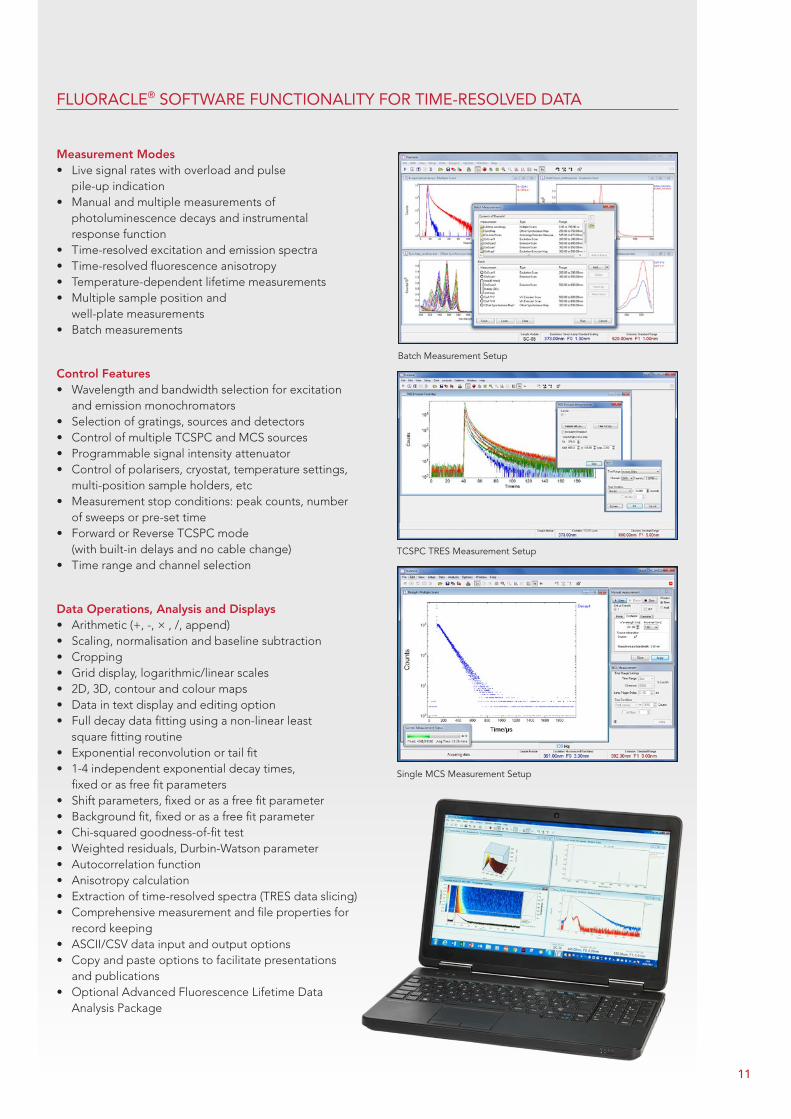
Batch Measurement Setup
TCSPC TRES Measurement Setup
Single MCS Measurement Setup
FLUORACLE® SOFTWARE FUNCTIONALITY FOR TIME-RESOLVED DATA
Measurement Modes• Live signal rates with overload and pulse
pile-up indication • Manual and multiple measurements of
photoluminescence decays and instrumental response function
• Time-resolved excitation and emission spectra • Time-resolved fluorescence anisotropy • Temperature-dependent lifetime measurements • Multiple sample position and
well-plate measurements • Batch measurements
Control Features• Wavelength and bandwidth selection for excitation
and emission monochromators • Selection of gratings, sources and detectors • Control of multiple TCSPC and MCS sources • Programmable signal intensity attenuator • Control of polarisers, cryostat, temperature settings,
multi-position sample holders, etc • Measurement stop conditions: peak counts, number
of sweeps or pre-set time • Forward or Reverse TCSPC mode
(with built-in delays and no cable change)• Time range and channel selection
Data Operations, Analysis and Displays• Arithmetic (+, -, × , /, append) • Scaling, normalisation and baseline subtraction • Cropping • Grid display, logarithmic/linear scales • 2D, 3D, contour and colour maps • Data in text display and editing option • Full decay data fitting using a non-linear least
square fitting routine • Exponential reconvolution or tail fit • 1-4 independent exponential decay times,
fixed or as free fit parameters • Shift parameters, fixed or as a free fit parameter • Background fit, fixed or as a free fit parameter • Chi-squared goodness-of-fit test • Weighted residuals, Durbin-Watson parameter • Autocorrelation function • Anisotropy calculation • Extraction of time-resolved spectra (TRES data slicing)• Comprehensive measurement and file properties for
record keeping • ASCII/CSV data input and output options • Copy and paste options to facilitate presentations
and publications• Optional Advanced Fluorescence Lifetime Data
Analysis Package
11
MA
PS
– A
DD
ING
AN
EX
TRA
DIM
EN
SIO
N
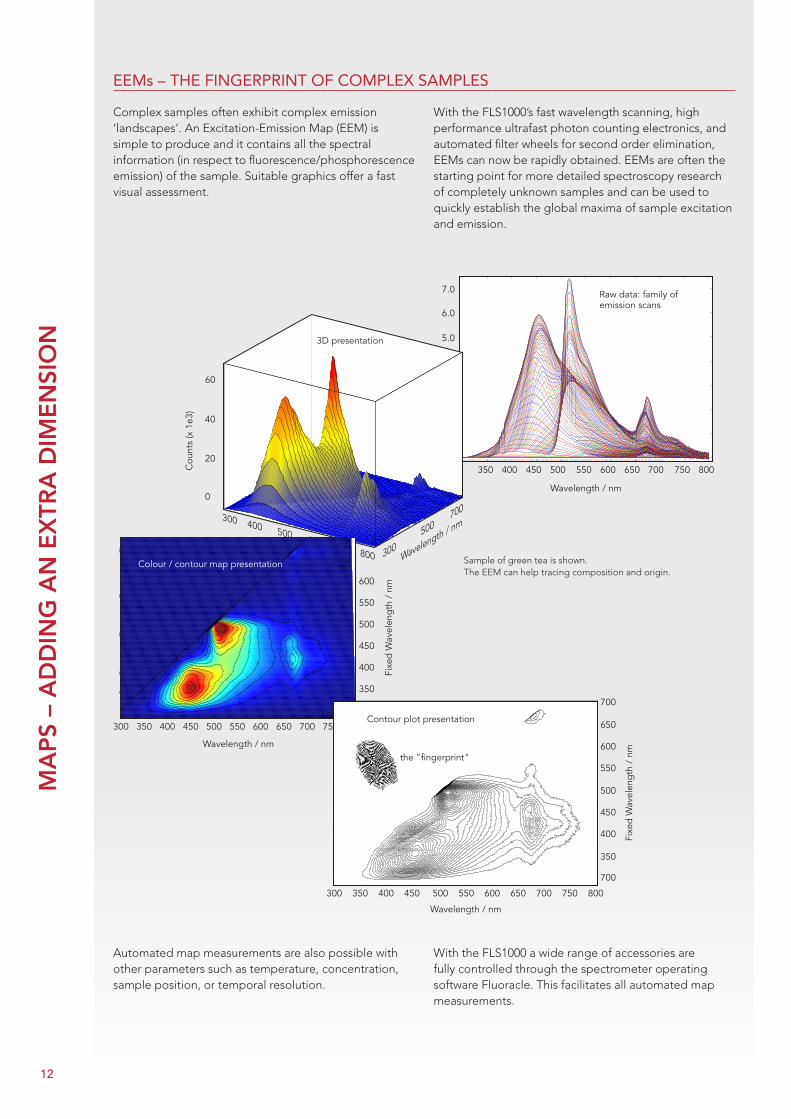
Sample of green tea is shown. The EEM can help tracing composition and origin.
1.0
2.0
3.0
4.0
5.0
6.0
7.0
300 350 400 450 500 550 600 650 700 750 800
Cou
nts/
104
Wavelength/nm
Raw data: family of emission scans
450 500 550 600 650 700 750 800400350
1.0
2.0
3.0
4.0
5.0
6.0
7.0
Wavelength / nm
Cou
nts
/ 10
4
300
400
500
600
700
800
700
600
500
400
300
0
20
40
60
Wa velength (nm) F ixed Wave length (nm)
Cou
nts
( x
1e3)
3D presentation
60
40
20
0
Cou
nts
(x 1
e3)
300 400 500 600 700 800 300 5
00 700
Wavelength (nm) Wavelength / nm
300 350 400 450 500 550 600 650 700 750 800Wavelength / nm
300
350
400
450
500
550
600
650
700
Fix
ed W
avel
ength
/ nm
0.0
1.0
2.0
3.0
4.0
5.0
6.0
Counts
/104
Colour / contour map presentation
300 350 400 450 500 550 600 650 700 750 800
350
400
450
500
550
600
Fixe
d W
avel
eng
th /
nm
Wavelength / nm
300 350 400 450 500 550 600 650 700 750 800Wavelength / nm
300
350
400
450
500
550
600
650
700
Fix
ed W
avel
ength
/ nm
Contour plot presentation
300 350 400 450 500 550 600 650 700 750 800
700
700
350
400
450
500
550
600
650
Fixe
d W
avel
eng
th /
nm
Wavelength / nm
the "fingerprint"
EEMs – THE FINGERPRINT OF COMPLEX SAMPLES
Complex samples often exhibit complex emission ‘landscapes’. An Excitation-Emission Map (EEM) is simple to produce and it contains all the spectral information (in respect to fluorescence/phosphorescence emission) of the sample. Suitable graphics offer a fast visual assessment.
With the FLS1000’s fast wavelength scanning, high performance ultrafast photon counting electronics, and automated filter wheels for second order elimination, EEMs can now be rapidly obtained. EEMs are often the starting point for more detailed spectroscopy research of completely unknown samples and can be used to quickly establish the global maxima of sample excitation and emission.
Automated map measurements are also possible with other parameters such as temperature, concentration, sample position, or temporal resolution.
With the FLS1000 a wide range of accessories are fully controlled through the spectrometer operating software Fluoracle. This facilitates all automated map measurements.
12
0 20 40 60 80 100 120 140 160 180
Time / ns
104
103
102
101
100
Cou
nts
Raw data: family of decay curves
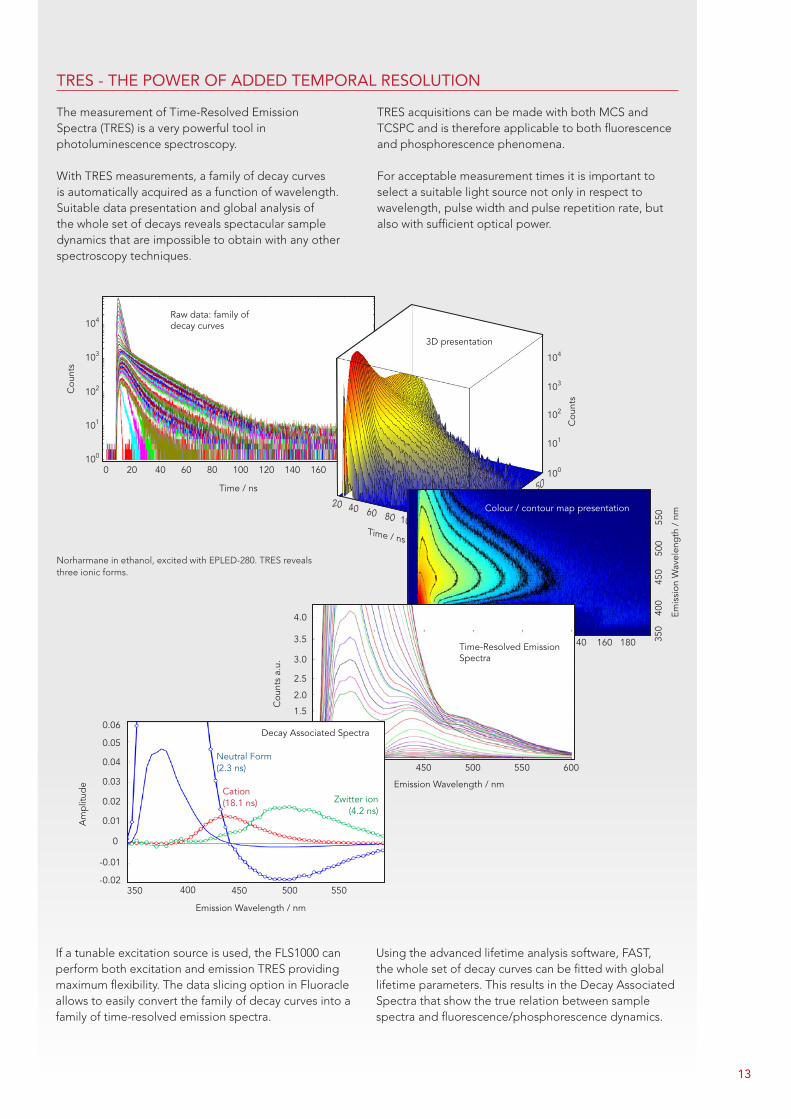
Norharmane in ethanol, excited with EPLED-280. TRES reveals three ionic forms.
100
101
102
103
104
20140
12010080604020
10
30 4050
Time / ns
3D presentation
Cou
nts
0 20 40 60 80 100 120 140 160 180
Time / ns35
0
400
4
50
500
550
Emis
sion
Wav
elen
gth
/ n
mColour / contour map presentation
Emission Wavelength / nm
350 400 450 500 550 600
3.0
2.5
2.0
1.5
1.0
0.5
Cou
nts
a.u.
4.0
3.5Time-Resolved Emission Spectra
-0.02
-0.01
0
0.01
0.02
0.03
0.04
0.05
0.06
350 400 450
Emission Wavelength / nm
Am
plit
ude
Neutral Form (2.3 ns)
Cation (18.1 ns)
500 550
Zwitter ion (4.2 ns)
Decay Associated Spectra
TRES - THE POWER OF ADDED TEMPORAL RESOLUTION
The measurement of Time-Resolved Emission Spectra (TRES) is a very powerful tool in photoluminescence spectroscopy.
With TRES measurements, a family of decay curves is automatically acquired as a function of wavelength. Suitable data presentation and global analysis of the whole set of decays reveals spectacular sample dynamics that are impossible to obtain with any other spectroscopy techniques.
TRES acquisitions can be made with both MCS and TCSPC and is therefore applicable to both fluorescence and phosphorescence phenomena.
For acceptable measurement times it is important to select a suitable light source not only in respect to wavelength, pulse width and pulse repetition rate, but also with sufficient optical power.
Using the advanced lifetime analysis software, FAST, the whole set of decay curves can be fitted with global lifetime parameters. This results in the Decay Associated Spectra that show the true relation between sample spectra and fluorescence/phosphorescence dynamics.
If a tunable excitation source is used, the FLS1000 can perform both excitation and emission TRES providing maximum flexibility. The data slicing option in Fluoracle allows to easily convert the family of decay curves into a family of time-resolved emission spectra.
13
µF2
4rd 3rd 2nd Nd:YAG Laser
Diode Lasers
3rd 2rd Ti: Sapphire
Supercontinuum Source
EPL-Series
EPLED-Series
nF920
Xe2 (ozone generating)
Xe2 (ozone free)
100 500 1000 1500 Wavelength / nm
Continuous Sources
MCS Sources
TCSPC Sources
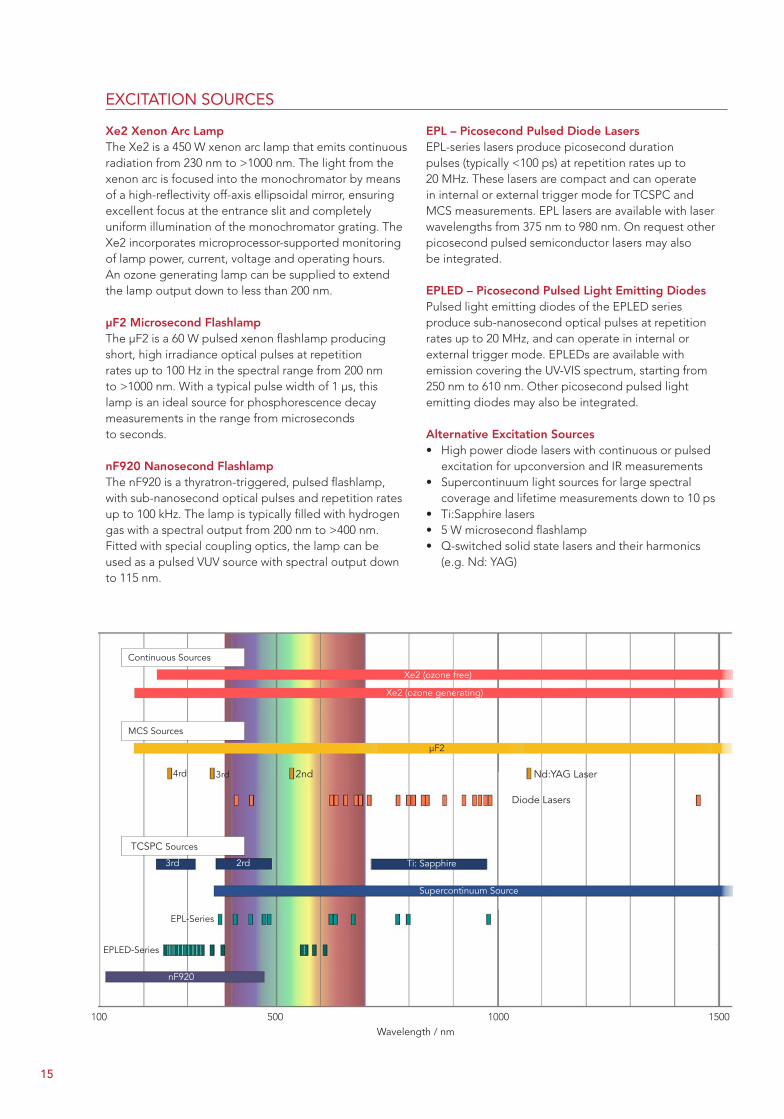
Xe2 Xenon Arc LampThe Xe2 is a 450 W xenon arc lamp that emits continuous radiation from 230 nm to >1000 nm. The light from the xenon arc is focused into the monochromator by means of a high-reflectivity off-axis ellipsoidal mirror, ensuring excellent focus at the entrance slit and completely uniform illumination of the monochromator grating. The Xe2 incorporates microprocessor-supported monitoring of lamp power, current, voltage and operating hours. An ozone generating lamp can be supplied to extend the lamp output down to less than 200 nm.
µF2 Microsecond FlashlampThe µF2 is a 60 W pulsed xenon flashlamp producing short, high irradiance optical pulses at repetition rates up to 100 Hz in the spectral range from 200 nm to >1000 nm. With a typical pulse width of 1 μs, this lamp is an ideal source for phosphorescence decay measurements in the range from microseconds to seconds.
nF920 Nanosecond FlashlampThe nF920 is a thyratron-triggered, pulsed flashlamp, with sub-nanosecond optical pulses and repetition rates up to 100 kHz. The lamp is typically filled with hydrogen gas with a spectral output from 200 nm to >400 nm. Fitted with special coupling optics, the lamp can be used as a pulsed VUV source with spectral output down to 115 nm.
EPL – Picosecond Pulsed Diode LasersEPL-series lasers produce picosecond duration pulses (typically <100 ps) at repetition rates up to 20 MHz. These lasers are compact and can operate in internal or external trigger mode for TCSPC and MCS measurements. EPL lasers are available with laser wavelengths from 375 nm to 980 nm. On request other picosecond pulsed semiconductor lasers may also be integrated.
EPLED – Picosecond Pulsed Light Emitting DiodesPulsed light emitting diodes of the EPLED series produce sub-nanosecond optical pulses at repetition rates up to 20 MHz, and can operate in internal or external trigger mode. EPLEDs are available with emission covering the UV-VIS spectrum, starting from 250 nm to 610 nm. Other picosecond pulsed light emitting diodes may also be integrated.
Alternative Excitation Sources• High power diode lasers with continuous or pulsed
excitation for upconversion and IR measurements• Supercontinuum light sources for large spectral
coverage and lifetime measurements down to 10 ps• Ti:Sapphire lasers• 5 W microsecond flashlamp• Q-switched solid state lasers and their harmonics
(e.g. Nd: YAG)
EXCITATION SOURCES
15
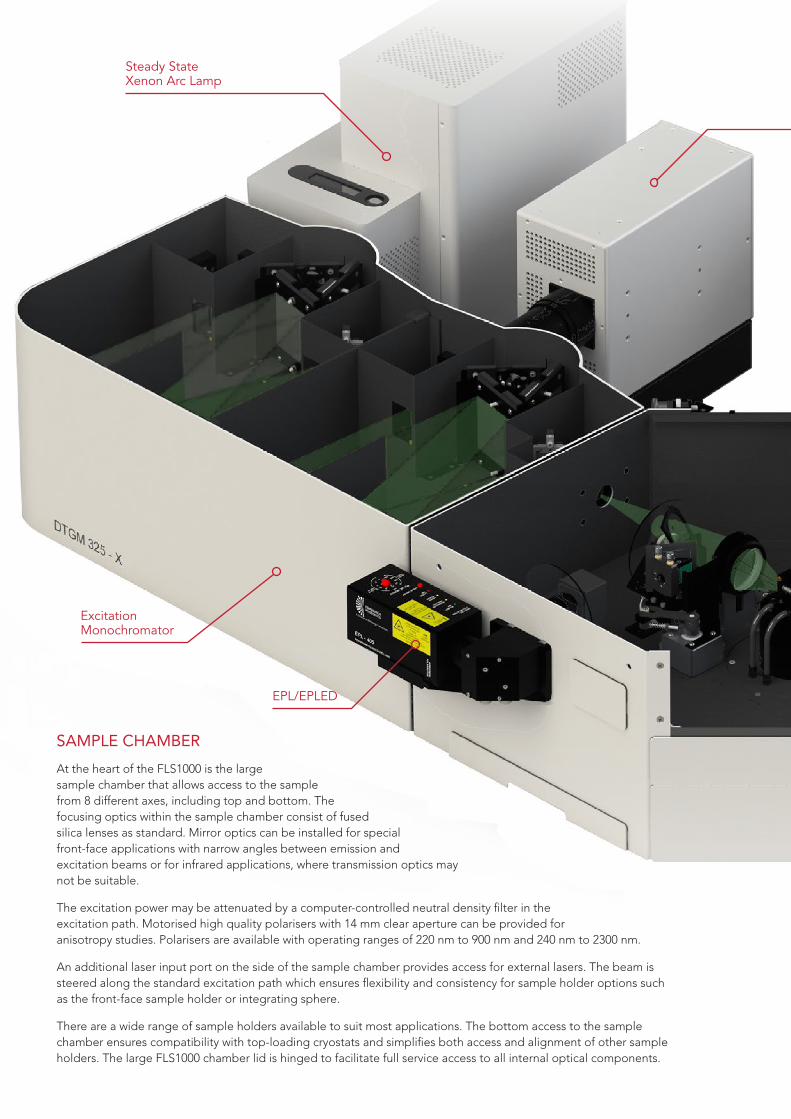
Excitation Monochromator
Steady State Xenon Arc Lamp
EPL/EPLED
SAMPLE CHAMBER
At the heart of the FLS1000 is the large sample chamber that allows access to the sample from 8 different axes, including top and bottom. The focusing optics within the sample chamber consist of fused silica lenses as standard. Mirror optics can be installed for special front-face applications with narrow angles between emission and excitation beams or for infrared applications, where transmission optics may not be suitable.
The excitation power may be attenuated by a computer-controlled neutral density filter in the excitation path. Motorised high quality polarisers with 14 mm clear aperture can be provided for anisotropy studies. Polarisers are available with operating ranges of 220 nm to 900 nm and 240 nm to 2300 nm.
An additional laser input port on the side of the sample chamber provides access for external lasers. The beam is steered along the standard excitation path which ensures flexibility and consistency for sample holder options such as the front-face sample holder or integrating sphere.
There are a wide range of sample holders available to suit most applications. The bottom access to the sample chamber ensures compatibility with top-loading cryostats and simplifies both access and alignment of other sample holders. The large FLS1000 chamber lid is hinged to facilitate full service access to all internal optical components.
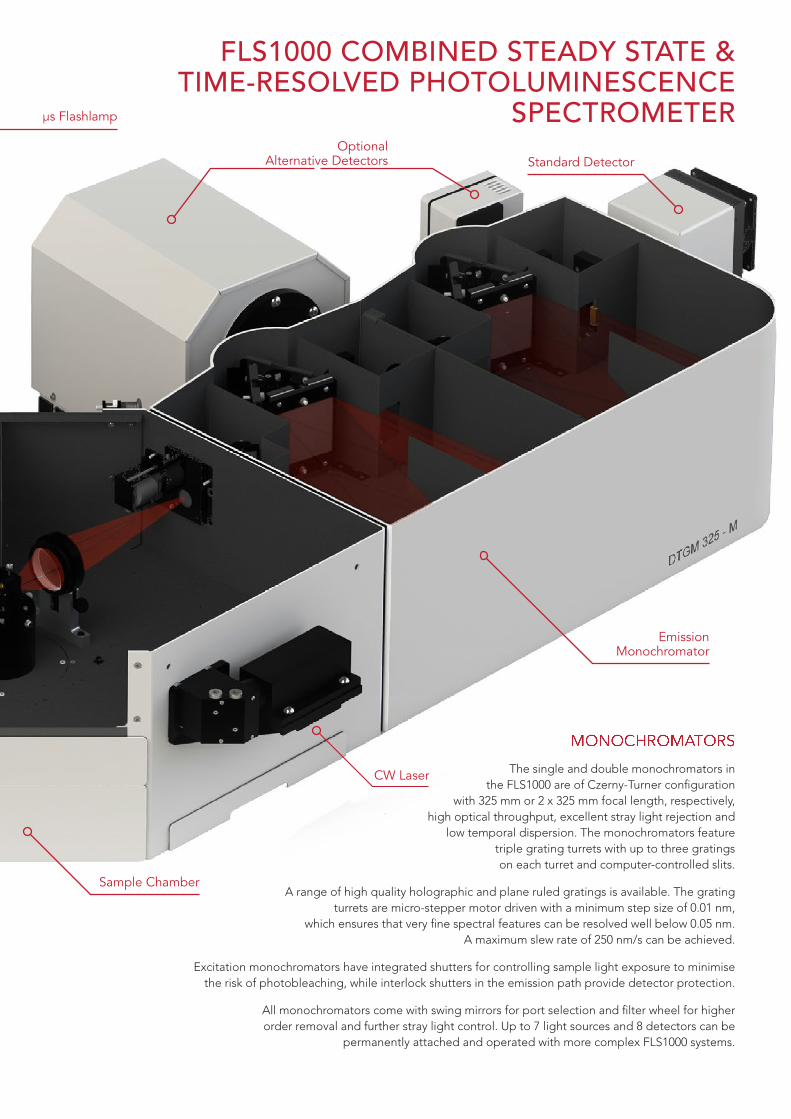
μs Flashlamp
Optional Alternative Detectors
Emission Monochromator
Standard Detector
Sample Chamber
CW Laser The single and double monochromators in the FLS1000 are of Czerny-Turner configuration
with 325 mm or 2 x 325 mm focal length, respectively, high optical throughput, excellent stray light rejection and
low temporal dispersion. The monochromators feature triple grating turrets with up to three gratings on each turret and computer-controlled slits.
A range of high quality holographic and plane ruled gratings is available. The grating turrets are micro-stepper motor driven with a minimum step size of 0.01 nm,
which ensures that very fine spectral features can be resolved well below 0.05 nm. A maximum slew rate of 250 nm/s can be achieved.
Excitation monochromators have integrated shutters for controlling sample light exposure to minimise the risk of photobleaching, while interlock shutters in the emission path provide detector protection.
All monochromators come with swing mirrors for port selection and filter wheel for higher order removal and further stray light control. Up to 7 light sources and 8 detectors can be
permanently attached and operated with more complex FLS1000 systems.
MONOCHROMATORS
FLS1000 COMBINED STEADY STATE & TIME-RESOLVED PHOTOLUMINESCENCE
SPECTROMETER
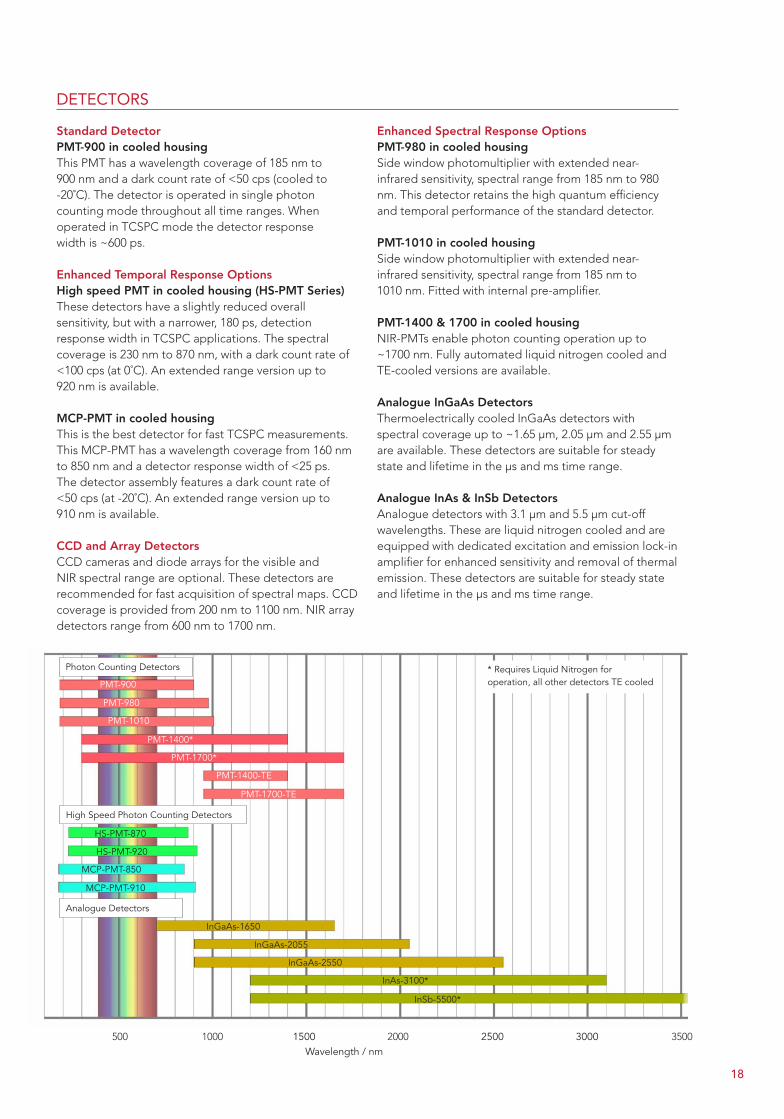
500 1000 2000 3500 Wavelength / nm1500 2500 3000
Photon Counting Detectors
High Speed Photon Counting Detectors
Analogue Detectors
PMT-900
PMT-980
PMT-1010
PMT-1400*
PMT-1700*
PMT-1400-TE
PMT-1700-TE
HS-PMT-920
HS-PMT-870
MCP-PMT-850
MCP-PMT-910
InGaAs-1650
InGaAs-2055
InGaAs-2550
InAs-3100*
InSb-5500*
* Requires Liquid Nitrogen for operation, all other detectors TE cooled
DETECTORS
Standard DetectorPMT-900 in cooled housingThis PMT has a wavelength coverage of 185 nm to 900 nm and a dark count rate of <50 cps (cooled to -20˚C). The detector is operated in single photon counting mode throughout all time ranges. When operated in TCSPC mode the detector response width is ~600 ps.
Enhanced Temporal Response OptionsHigh speed PMT in cooled housing (HS-PMT Series)These detectors have a slightly reduced overall sensitivity, but with a narrower, 180 ps, detection response width in TCSPC applications. The spectral coverage is 230 nm to 870 nm, with a dark count rate of <100 cps (at 0˚C). An extended range version up to 920 nm is available.
MCP-PMT in cooled housingThis is the best detector for fast TCSPC measurements. This MCP-PMT has a wavelength coverage from 160 nm to 850 nm and a detector response width of <25 ps. The detector assembly features a dark count rate of <50 cps (at -20˚C). An extended range version up to 910 nm is available.
CCD and Array Detectors CCD cameras and diode arrays for the visible and NIR spectral range are optional. These detectors are recommended for fast acquisition of spectral maps. CCD coverage is provided from 200 nm to 1100 nm. NIR array detectors range from 600 nm to 1700 nm.
Enhanced Spectral Response OptionsPMT-980 in cooled housingSide window photomultiplier with extended near-infrared sensitivity, spectral range from 185 nm to 980 nm. This detector retains the high quantum efficiency and temporal performance of the standard detector.
PMT-1010 in cooled housing Side window photomultiplier with extended near-infrared sensitivity, spectral range from 185 nm to 1010 nm. Fitted with internal pre-amplifier.
PMT-1400 & 1700 in cooled housingNIR-PMTs enable photon counting operation up to ~1700 nm. Fully automated liquid nitrogen cooled and TE-cooled versions are available.
Analogue InGaAs DetectorsThermoelectrically cooled InGaAs detectors with spectral coverage up to ~1.65 µm, 2.05 µm and 2.55 µm are available. These detectors are suitable for steady state and lifetime in the µs and ms time range.
Analogue InAs & InSb DetectorsAnalogue detectors with 3.1 µm and 5.5 µm cut-off wavelengths. These are liquid nitrogen cooled and are equipped with dedicated excitation and emission lock-in amplifier for enhanced sensitivity and removal of thermal emission. These detectors are suitable for steady state and lifetime in the µs and ms time range.
18
SAM
PLE
HO
LDE
RS
AN
D T
EM
PE
RA
TUR
E C
ON
TRO
L
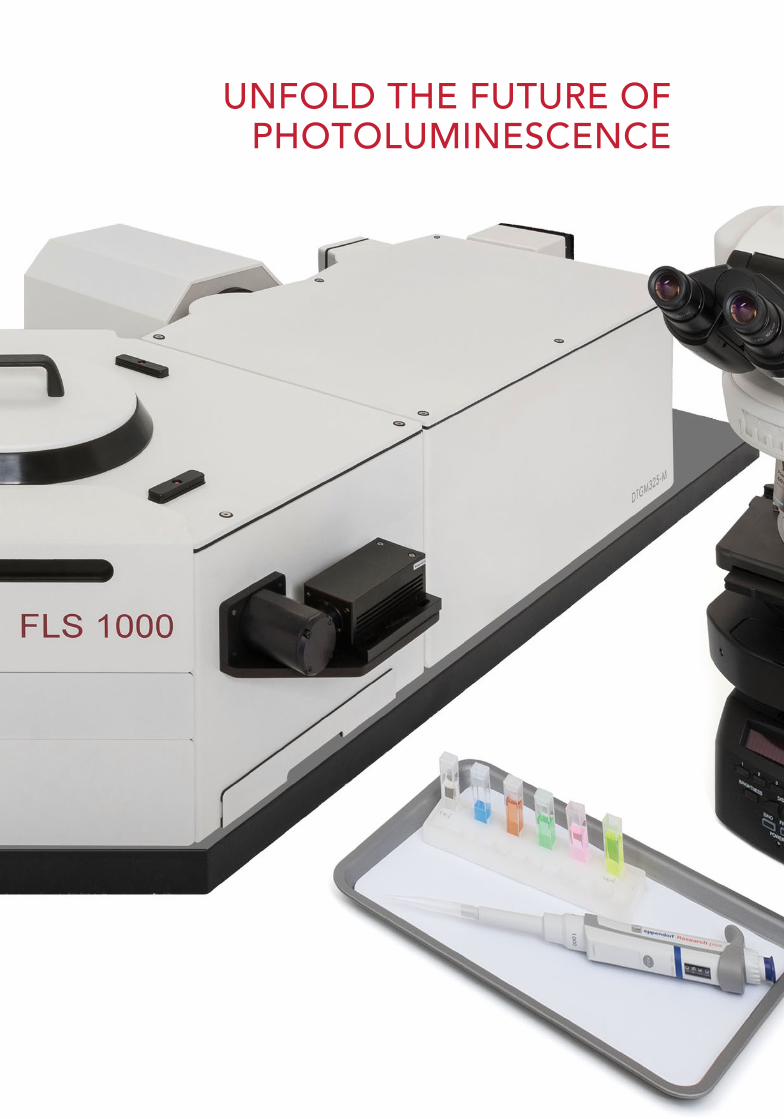
UNFOLD THE FUTURE OF PHOTOLUMINESCENCE
20
SAM
PLE
HO
LDE
RS
AN
D T
EM
PE
RA
TUR
E C
ON
TRO
L
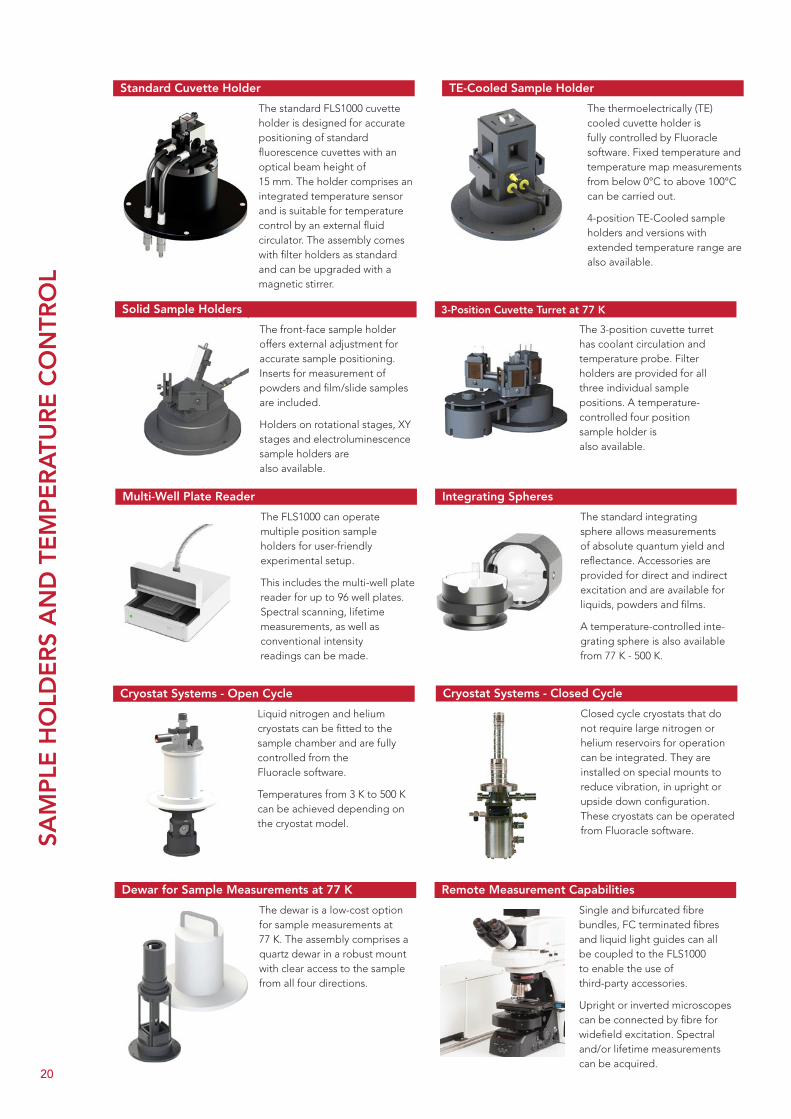
Solid Sample Holders
The front-face sample holder offers external adjustment for accurate sample positioning. Inserts for measurement of powders and film/slide samples are included.
Holders on rotational stages, XY stages and electroluminescence sample holders are also available.
Integrating Spheres
The standard integrating sphere allows measurements of absolute quantum yield and reflectance. Accessories are provided for direct and indirect excitation and are available for liquids, powders and films.
A temperature-controlled inte-grating sphere is also available from 77 K - 500 K.
3-Position Cuvette Turret at 77 K
The 3-position cuvette turret has coolant circulation and temperature probe. Filter holders are provided for all three individual sample positions. A temperature-controlled four position sample holder is also available.
TE-Cooled Sample Holder
The thermoelectrically (TE) cooled cuvette holder is fully controlled by Fluoracle software. Fixed temperature and temperature map measurements from below 0°C to above 100°C can be carried out.
4-position TE-Cooled sample holders and versions with extended temperature range are also available.
Multi-Well Plate Reader
The FLS1000 can operate multiple position sample holders for user-friendly experimental setup.
This includes the multi-well plate reader for up to 96 well plates. Spectral scanning, lifetime measurements, as well as conventional intensity readings can be made.
Remote Measurement Capabilities
Single and bifurcated fibre bundles, FC terminated fibres and liquid light guides can all be coupled to the FLS1000 to enable the use of third-party accessories.
Upright or inverted microscopes can be connected by fibre for widefield excitation. Spectral and/or lifetime measurements can be acquired.
Dewar for Sample Measurements at 77 K
The dewar is a low-cost option for sample measurements at 77 K. The assembly comprises a quartz dewar in a robust mount with clear access to the sample from all four directions.
Cryostat Systems - Closed Cycle
Closed cycle cryostats that do not require large nitrogen or helium reservoirs for operation can be integrated. They are installed on special mounts to reduce vibration, in upright or upside down configuration. These cryostats can be operated from Fluoracle software.
Cryostat Systems - Open Cycle
Liquid nitrogen and helium cryostats can be fitted to the sample chamber and are fully controlled from the Fluoracle software.
Temperatures from 3 K to 500 K can be achieved depending on the cryostat model.
Standard Cuvette Holder
The standard FLS1000 cuvette holder is designed for accurate positioning of standard fluorescence cuvettes with an optical beam height of 15 mm. The holder comprises an integrated temperature sensor and is suitable for temperature control by an external fluid circulator. The assembly comes with filter holders as standard and can be upgraded with a magnetic stirrer.
20
CO
NFI
GU
RA
TIO
N E
XA
MP
LES
Some spectrometer configurations include class 3R, 3B or class 4 laser products. Laser safety procedures must be followed.
EPL or EPLED
Xe2
μF2
PMT-1700
PMT-1010
MCP-PMT
S/C Laser
Xe2
PMT-1700
CCD
nF920
PMT-900
Xe2
μF2
Microscope
Fibre coupling, emission
Fibre coupling, excitation
μF2
Xe2
PMT-1700
PMT-1010
cw or pulsed laser
InGaAs-2550
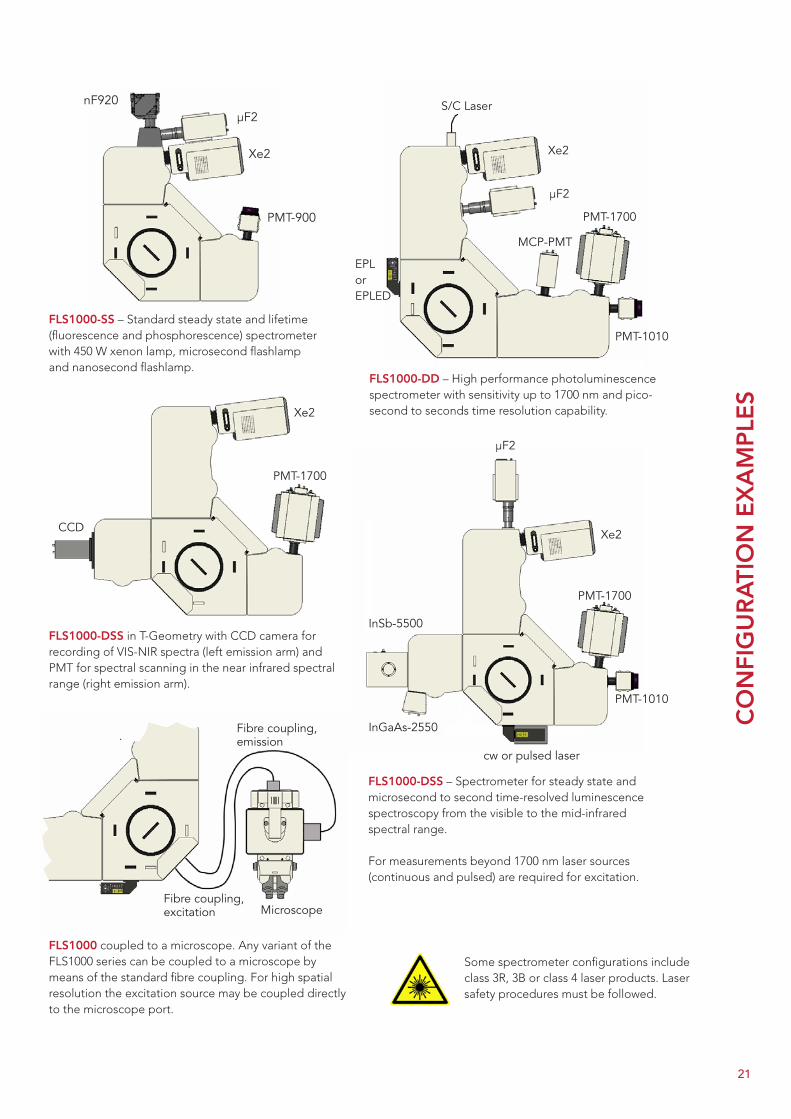
InSb-5500 FLS1000-DSS in T-Geometry with CCD camera for recording of VIS-NIR spectra (left emission arm) and PMT for spectral scanning in the near infrared spectral range (right emission arm).
FLS1000-DD – High performance photoluminescence spectrometer with sensitivity up to 1700 nm and pico-second to seconds time resolution capability.
FLS1000-DSS – Spectrometer for steady state and microsecond to second time-resolved luminescence spectroscopy from the visible to the mid-infrared spectral range.
For measurements beyond 1700 nm laser sources (continuous and pulsed) are required for excitation.
FLS1000 coupled to a microscope. Any variant of the FLS1000 series can be coupled to a microscope by means of the standard fibre coupling. For high spatial resolution the excitation source may be coupled directly to the microscope port.
FLS1000-SS – Standard steady state and lifetime (fluorescence and phosphorescence) spectrometer with 450 W xenon lamp, microsecond flashlamp and nanosecond flashlamp.
21
Lanthanides
Excitons
Phonons
Defects
Semiconductor Band-Gap
Quantum Wells
Time-Resolved Anisotropy
TRES
Nanospheres
Nanowires
NanotubesNatural
Dyes
Quantum Dots
Quantum Rods
Fluorescent Beads
EEM
FRET
Chromaticity
Pressure Dependence
Temperature Dependence
Synthetic Dyes
Titration
Circularly-Polarised Luminescence
Spectral Anisotropy
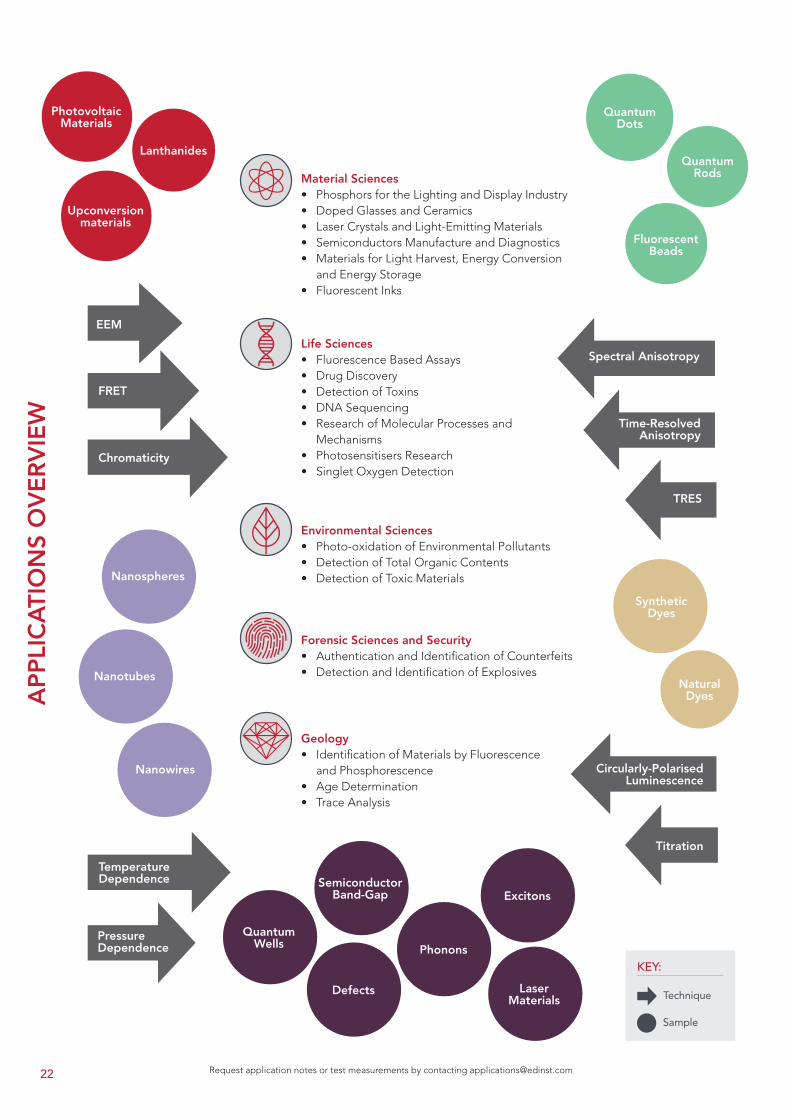
Material Sciences• Phosphors for the Lighting and Display Industry • Doped Glasses and Ceramics • Laser Crystals and Light-Emitting Materials • Semiconductors Manufacture and Diagnostics • Materials for Light Harvest, Energy Conversion
and Energy Storage• Fluorescent Inks
Life Sciences• Fluorescence Based Assays• Drug Discovery • Detection of Toxins • DNA Sequencing• Research of Molecular Processes and
Mechanisms • Photosensitisers Research • Singlet Oxygen Detection
Environmental Sciences• Photo-oxidation of Environmental Pollutants• Detection of Total Organic Contents• Detection of Toxic Materials
Forensic Sciences and Security• Authentication and Identification of Counterfeits• Detection and Identification of Explosives
Geology• Identification of Materials by Fluorescence
and Phosphorescence• Age Determination• Trace Analysis
Request application notes or test measurements by contacting [email protected]
Laser Materials
AP
PLI
CA
TIO
NS
OV
ER
VIE
W
Photovoltaic Materials
Upconversion materials
KEY:
Technique
Sample
22
FLS1
000
- TE
CH
NIC
AL
SPE
CIF
ICA
TIO
NS
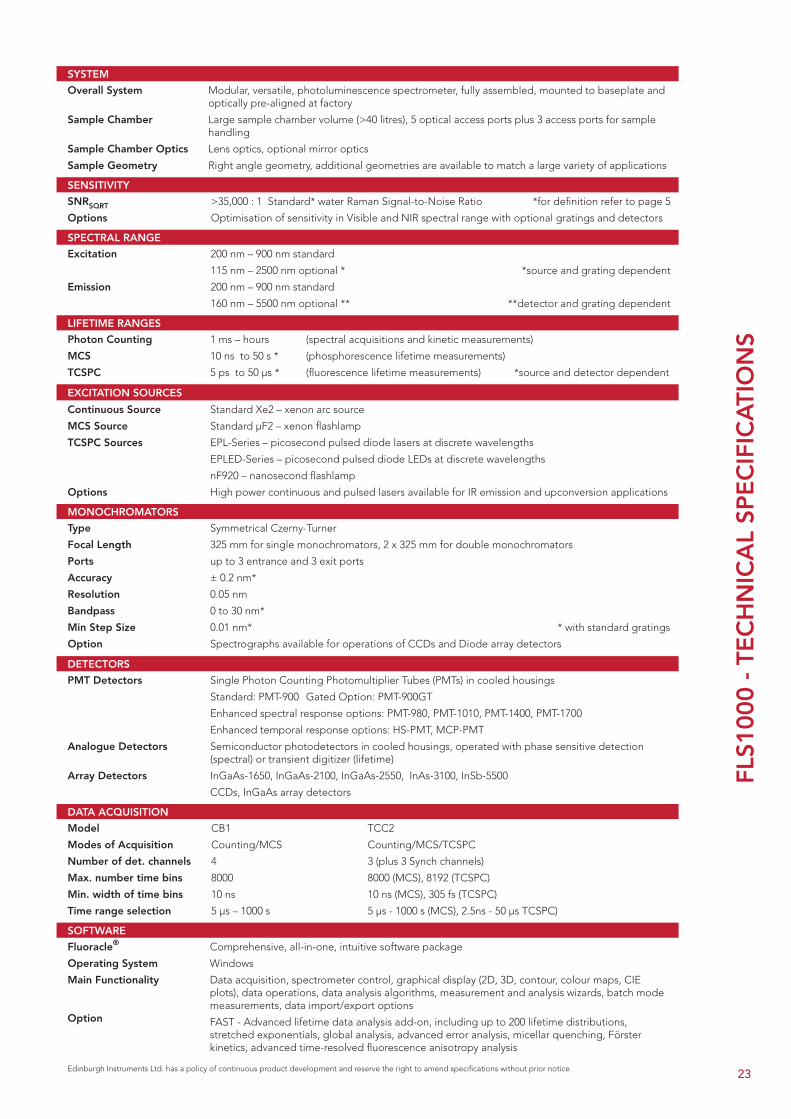
Overall System
Sample Chamber
Sample Chamber Optics
Sample Geometry
Modular, versatile, photoluminescence spectrometer, fully assembled, mounted to baseplate and optically pre-aligned at factory
Large sample chamber volume (>40 litres), 5 optical access ports plus 3 access ports for sample handling
Lens optics, optional mirror optics
Right angle geometry, additional geometries are available to match a large variety of applications
SYSTEM
Fluoracle®
Operating System
Main Functionality Option
Comprehensive, all-in-one, intuitive software package
Windows
Data acquisition, spectrometer control, graphical display (2D, 3D, contour, colour maps, CIE plots), data operations, data analysis algorithms, measurement and analysis wizards, batch mode measurements, data import/export options
FAST - Advanced lifetime data analysis add-on, including up to 200 lifetime distributions, stretched exponentials, global analysis, advanced error analysis, micellar quenching, Förster kinetics, advanced time-resolved fluorescence anisotropy analysis
SOFTWARE
LIFETIME RANGES
1 ms – hours (spectral acquisitions and kinetic measurements)
10 ns to 50 s * (phosphorescence lifetime measurements)
5 ps to 50 μs * (fluorescence lifetime measurements) *source and detector dependent
Photon Counting
MCS
TCSPC
EXCITATION SOURCES
Standard Xe2 – xenon arc source
Standard μF2 – xenon flashlamp
EPL-Series – picosecond pulsed diode lasers at discrete wavelengths
EPLED-Series – picosecond pulsed diode LEDs at discrete wavelengths
nF920 – nanosecond flashlamp
High power continuous and pulsed lasers available for IR emission and upconversion applications
Continuous Source
MCS Source
TCSPC Sources
Options
DETECTORS
Single Photon Counting Photomultiplier Tubes (PMTs) in cooled housings
Standard: PMT-900 Gated Option: PMT-900GT
Enhanced spectral response options: PMT-980, PMT-1010, PMT-1400, PMT-1700
Enhanced temporal response options: HS-PMT, MCP-PMT
Semiconductor photodetectors in cooled housings, operated with phase sensitive detection (spectral) or transient digitizer (lifetime)
InGaAs-1650, InGaAs-2100, InGaAs-2550, InAs-3100, InSb-5500
CCDs, InGaAs array detectors
PMT Detectors
Analogue Detectors
Array Detectors
MONOCHROMATORS
Symmetrical Czerny-Turner
325 mm for single monochromators, 2 x 325 mm for double monochromators
up to 3 entrance and 3 exit ports
± 0.2 nm*
0.05 nm
0 to 30 nm*
0.01 nm* * with standard gratings
Spectrographs available for operations of CCDs and Diode array detectors
Type
Focal Length
Ports
Accuracy
Resolution
Bandpass
Min Step Size
Option
SPECTRAL RANGE
Excitation
Emission
200 nm – 900 nm standard
115 nm – 2500 nm optional * *source and grating dependent
200 nm – 900 nm standard
160 nm – 5500 nm optional ** **detector and grating dependent
Model
Modes of Acquisition
Number of det. channels
Max. number time bins
Min. width of time bins
Time range selection
CB1
Counting/MCS
4
8000
10 ns
5 μs – 1000 s
DATA ACQUISITION
TCC2
Counting/MCS/TCSPC
3 (plus 3 Synch channels)
8000 (MCS), 8192 (TCSPC)
10 ns (MCS), 305 fs (TCSPC)
5 μs - 1000 s (MCS), 2.5ns - 50 μs TCSPC)
SNRSQRT
Options
SENSITIVITY
>35,000 : 1 Standard* water Raman Signal-to-Noise Ratio *for definition refer to page 5
Optimisation of sensitivity in Visible and NIR spectral range with optional gratings and detectors
Edinburgh Instruments Ltd. has a policy of continuous product development and reserve the right to amend specifications without prior notice. 23

EDINBURGH INSTRUMENTS
2 Bain Square, Kirkton Campus, Livingston, EH54 7DQ United Kingdom
Tel: +44 (0)1506 425 300 Fax: +44 (0)1506 425 320
Customer support is available worldwide
edinst.com Registered in England and Wales No: 962331 VAT No:GB 271 7379 37 ©Edinburgh Instruments Ltd 2020
F / 12.2020
MANUFACTURED WITH PRIDE IN THE UNITED KINGDOM
U.S. OFFICE CONTACT:
Tel: +1 800 323 6115 Fax: +44 (0)1506 425 320