Photocatalytic degradation of methylene blue by a combination of TiO2-anatase and coconut shell...
9
Photocatalytic degradation of methylene blue by a combination of TiO 2 -anatase and coconut shell activated carbon Hoang Anh Le, Le Thuy Linh, Sungmin Chin, Jongsoo Jurng ⁎ Korea Institute of Science and Technology (KIST), 39-1 Hawolgok, Seongbuk, Seoul, Republic of Korea abstract article info Article history: Received 28 November 2011 Received in revised form 11 March 2012 Accepted 1 April 2012 Available online 10 April 2012 Keywords: Carbonized coconut TiO 2 Chemical vapor condensation Photocatalytic degradation Methylene blue TiO 2 -anatase is obtained directly by chemical vapor condensation (T-95), or from a commercial catalyst (P-25). TiO 2 nanoparticles and coconut shell activated carbon, CSAC, are mixed with mass ratios of 1/1 (CT-1, CP-1) and 2/1 (CT-2, CP-2), respectively. These nanomaterials are characterized by X-ray powder diffraction (XRD), transmission electron microscopy (TEM), Brunauer–Emmett–Teller (BET) surface area, and X-ray photo- electron spectroscopy (XPS). The catalyst obtained from the CVC process is better than the commercial one in a comparison of the physico-chemical properties, and was also confirmed by the photocatalytic degradation of methylene blue (MB). The composited catalysts (CSAC/TiO 2 ) are better than CSAC or naked TiO 2 only. At the same TiO 2 to CSAC mass ratio, the MB removal efficiencies followed the trend: CT-2 > CT-1 > CP-2> CP-1> T-95>CSAC>P-25. Furthermore, the advantages of the CT-2 catalyst revealed its practical potential to treat pollutants. © 2012 Elsevier B.V. All rights reserved. 1. Introduction Biomass is a ubiquitous and abundant renewable resource on Earth [1]. Charcoal from biomass is popular adsorbent for air and water purification [2]. Activated carbon (AC), which is sometimes called activated charcoal or active carbon, is used mostly for adsorption in industry and is commonly used owing to its large adsorption capacity, fast adsorption kinetics and relative ease of regeneration [3,4]. AC can be produced from a range of raw carbon resources, such as lignite, peat and coal and biomass resources, such as eucalyptus [5], cherry, carstone, apricot stone, nuts, grape seeds [6], olive and peach stones [7], walnut shell [4,8], oil palm trunks/sells [9], wood, sawdust, bagasse and coconut shells [10]. Gratuito et al. [11] suggested that coconut shell AC is advantageous over carbon made from other materials because of its high density, high purity and virtually dust-free nature. Photocatalysis is an important industrial process in wastewater treatment, heavy metal remediation, air purification, sterilization, etc. Titanium dioxide (TiO 2 ) is the most widely used photocatalyst owing to its efficiency, low cost, and chemical stability [12]. AC has also been studied extensively as a support for the TiO 2 photocatalyst. Besides being used as a catalyst support, some studies used a combi- nation of TiO 2 and activated carbon mixtures to treat pollutants [13]. TiO 2 nanoparticles have attracted considerable attention for their novel physical, chemical, and electrical properties, which are suitable for a range of applications. TiO 2 has three polymorphs, rutile, anatase and brookite. Among those, anatase is the most photoactive, which is improved by its high crystallinity and large surface area [14–16]. Recently, several methods have been developed to synthesize nanosized TiO 2 particles, such as thermal decomposition reactions [17–20], flame- made process [21,22], sol–gel methods [23–25], electrodeposition [26,27], etc. Among these methods, chemical vapor condensation (CVC) which is one type of thermal decomposition reactions is well known as an alternative method for the direct synthesis of nanoparti- cles. The particle morphology, crystalline phase and surface chemistry of thermally decomposed particles can be controlled by regulating the precursor composition, reaction temperature, pressure, solvent proper- ties, and aging time [28,29]. The CVC process was developed originally for the synthesis of single-component metallic nanoparticles. It can produce nanostructured powders with high purity, little agglomeration and a grain size b 30 nm, and it is applicable to most materials because of the wide range of precursors available [30–32]. Chin et al. [33] reported that the photocatalytic activity of the TiO 2 nanoparticles (TNP) prepared at a precursor heating temperature of 95 °C and a synthesis temperature of 900 °C was the highest compared to that of other TiO 2 photocatalysts. UV/TiO 2 systems are also used widely to remove volatile organic com- pounds [34,35]. UV/TiO 2 combined with wood charcoal [36], commer- cial activated carbon [37], and carbonized moso bamboo [2] possess greater efficiencies in the removal of gaseous organics than those of unmodified materials. TiO 2 photocatalysts supported on AC appear to have a range of benefits and advantages for providing a cheap and effec- tive waste water treatment and remediation option [13]. In this study, commercial (P-25) and vapor-made (T-95, synthesized by the CVC process) TNP were modified with coconut shell activated carbon (CSAC) powder with different mass ratios. To examine the Powder Technology 225 (2012) 167–175 ⁎ Corresponding author. Tel.: +82 2 958 5597; fax: +82 2 958 6711. E-mail address: [email protected] (J. Jurng). 0032-5910/$ – see front matter © 2012 Elsevier B.V. All rights reserved. doi:10.1016/j.powtec.2012.04.004 Contents lists available at SciVerse ScienceDirect Powder Technology journal homepage: www.elsevier.com/locate/powtec
-
Upload
hoang-anh-le -
Category
Documents
-
view
212 -
download
0
Transcript of Photocatalytic degradation of methylene blue by a combination of TiO2-anatase and coconut shell...
Powder Technology 225 (2012) 167–175
Contents lists available at SciVerse ScienceDirect
Powder Technology
j ourna l homepage: www.e lsev ie r .com/ locate /powtec
Photocatalytic degradation of methylene blue by a combination of TiO2-anatase andcoconut shell activated carbon
Hoang Anh Le, Le Thuy Linh, Sungmin Chin, Jongsoo Jurng ⁎Korea Institute of Science and Technology (KIST), 39-1 Hawolgok, Seongbuk, Seoul, Republic of Korea
⁎ Corresponding author. Tel.: +82 2 958 5597; fax: +E-mail address: [email protected] (J. Jurng).
0032-5910/$ – see front matter © 2012 Elsevier B.V. Alldoi:10.1016/j.powtec.2012.04.004
a b s t r a c t
a r t i c l e i n f oArticle history:Received 28 November 2011Received in revised form 11 March 2012Accepted 1 April 2012Available online 10 April 2012
Keywords:Carbonized coconutTiO2
Chemical vapor condensationPhotocatalytic degradationMethylene blue
TiO2-anatase is obtained directly by chemical vapor condensation (T-95), or from a commercial catalyst(P-25). TiO2 nanoparticles and coconut shell activated carbon, CSAC, are mixed with mass ratios of 1/1 (CT-1,CP-1) and 2/1 (CT-2, CP-2), respectively. These nanomaterials are characterized by X-ray powder diffraction(XRD), transmission electronmicroscopy (TEM), Brunauer–Emmett–Teller (BET) surface area, and X-ray photo-electron spectroscopy (XPS). The catalyst obtained from the CVC process is better than the commercial one in acomparison of the physico-chemical properties, and was also confirmed by the photocatalytic degradation ofmethylene blue (MB). The composited catalysts (CSAC/TiO2) are better than CSAC or naked TiO2 only. At thesame TiO2 to CSAC mass ratio, the MB removal efficiencies followed the trend: CT-2>CT-1>CP-2>CP-1>T-95>CSAC>P-25. Furthermore, the advantages of the CT-2 catalyst revealed its practical potential to treatpollutants.
© 2012 Elsevier B.V. All rights reserved.
1. Introduction
Biomass is a ubiquitous and abundant renewable resource onEarth [1]. Charcoal from biomass is popular adsorbent for air andwater purification [2]. Activated carbon (AC), which is sometimescalled activated charcoal or active carbon, is used mostly for adsorptionin industry and is commonly used owing to its large adsorption capacity,fast adsorption kinetics and relative ease of regeneration [3,4]. AC can beproduced from a range of raw carbon resources, such as lignite, peat andcoal and biomass resources, such as eucalyptus [5], cherry, carstone,apricot stone, nuts, grape seeds [6], olive and peach stones [7], walnutshell [4,8], oil palm trunks/sells [9], wood, sawdust, bagasse and coconutshells [10]. Gratuito et al. [11] suggested that coconut shell AC isadvantageous over carbon made from other materials because of itshigh density, high purity and virtually dust-free nature.
Photocatalysis is an important industrial process in wastewatertreatment, heavy metal remediation, air purification, sterilization,etc. Titanium dioxide (TiO2) is the most widely used photocatalystowing to its efficiency, low cost, and chemical stability [12]. AC hasalso been studied extensively as a support for the TiO2 photocatalyst.Besides being used as a catalyst support, some studies used a combi-nation of TiO2 and activated carbon mixtures to treat pollutants [13].TiO2 nanoparticles have attracted considerable attention for theirnovel physical, chemical, and electrical properties, which are suitablefor a range of applications. TiO2 has three polymorphs, rutile, anatase
82 2 958 6711.
rights reserved.
and brookite. Among those, anatase is the most photoactive, which isimproved by its high crystallinity and large surface area [14–16].Recently, severalmethods have been developed to synthesize nanosizedTiO2 particles, such as thermal decomposition reactions [17–20], flame-made process [21,22], sol–gel methods [23–25], electrodeposition[26,27], etc. Among these methods, chemical vapor condensation(CVC) which is one type of thermal decomposition reactions is wellknown as an alternative method for the direct synthesis of nanoparti-cles. The particle morphology, crystalline phase and surface chemistryof thermally decomposed particles can be controlled by regulating theprecursor composition, reaction temperature, pressure, solvent proper-ties, and aging time [28,29]. The CVC process was developed originallyfor the synthesis of single-component metallic nanoparticles. It canproduce nanostructured powders with high purity, little agglomerationand a grain size b30 nm, and it is applicable tomostmaterials because ofthe wide range of precursors available [30–32]. Chin et al. [33] reportedthat the photocatalytic activity of the TiO2 nanoparticles (TNP) preparedat a precursor heating temperature of 95 °C and a synthesis temperatureof 900 °Cwas the highest compared to that of other TiO2 photocatalysts.UV/TiO2 systems are also used widely to remove volatile organic com-pounds [34,35]. UV/TiO2 combined with wood charcoal [36], commer-cial activated carbon [37], and carbonized moso bamboo [2] possessgreater efficiencies in the removal of gaseous organics than those ofunmodified materials. TiO2 photocatalysts supported on AC appear tohave a range of benefits and advantages for providing a cheap and effec-tive waste water treatment and remediation option [13].
In this study, commercial (P-25) and vapor-made (T-95, synthesizedby the CVC process) TNP were modified with coconut shell activatedcarbon (CSAC) powder with different mass ratios. To examine the

168 H.A. Le et al. / Powder Technology 225 (2012) 167–175
synergetic effects, mixtures of TNP and CSAC powder were preparedwithmass ratios of 1/1 and 2/1, respectively. The photocatalytic behav-ior of the resulting powderswas characterized by quantifying the rate ofmethylene blue (MB) degradation in an aqueous suspension. MB, acommon organic dye, was examined because of its ubiquitous use andbecause the removal of dyes from waste water is an acute problem.
2. Materials and method
2.1. Materials
Coconut shell activated carbon, CSAC, was purchased from Tra BacJoint Stock Co. (Vietnam). TiO2 (P-25) was obtained from Degussa(Germany). Titanium tetraisopropoxide ([(CH3)2CHO]4Ti, TTIP, Aldrich,>97%) was used as a precursor for TNP synthesis by the CVC process.Methylene blue (analytical reagent grade) was purchased from JunseiChemical Co., Ltd. (Japan).
2.2. Experimental
2.2.1. Commercial catalyst preparationCSAC was ground and passed through 90 μm mesh, and oven-dried
at 120 °C for 24 h under vacuum.Degussa TiO2 powder (ca. 80% anatase,20% rutile: BET area ca. 52 m2 g−1), which is denoted as P-25, was used.
2.2.2. Synthesis of TiO2 nanoparticlesThe CVC process was employed to synthesize TNP. It is a simple
experimental system, consisting of the following three parts: aprecursor evaporator, hot wall reactor, and particle trap (collector).The precursor (TTIP) was stored in a bubbler that was placed in anoil bath at 95 °C. The sorbent precursor was introduced into thesystem by bubbling argon (prepurified, 99.99%, 0.042 m3 h−1). Thebubbler was wrapped with a heating tape (95 °C) to prevent lossesdue to condensation. An additional inlet was connected to the reactorto supply air (0.42 m3 h−1). All the precursor and carrier gases (airand argon, total 0.462 m3 h−1) passed though an alumina tube (ID0.01 m, 0.8 m in length) placed in a hot wall reactor (electric furnace).After synthesis, the TNP were collected outside the reactor tube,where the temperature was held at room temperature using awater-cooling jacket. The TNP sample prepared by the CVC processis noted as T-95. Details of the apparatus are reported elsewhere[33,38].
2.2.3. TNP modified with CSACThe abovementioned CSAC and TNP (P-25, T-95) were used for the
preparation of carbonized coconut modified with TNP samples. First,5 g of CSAC powder was mixed with different amounts of TNP, stirredvigorously overnight at 25 °C at a stirring rate of 400 rpm, and dilutedto 1 L in double deionized water. The CSAC mixed with differentamounts of P-25 and T-95 are denoted as CP-n and CT-n, where n is1 or 2, representing the mass ratios of CSAC to TiO2 (1:1) or (1:2),respectively. The suspension was centrifuged at 21,400×g for 20 minto separate the mixed materials. After removing the supernatant, themixedmaterials were then oven-dried at 120 °C for 24 h under vacuum.They were then reheated to 500 °C isothermally for 120 min under anitrogen gas flow (0.03 m3 h−1). The obtained powders were oven-dried at 120 °C for 24 h under vacuum.
2.3. Characterization
2.3.1. X-ray powder diffractionXRDwas performed using a Riguka MiniFlex-II X-ray diffractometer
with Cu Kα radiation (λ=0.15418 nm). The sample was scanned from20 to 80° (2θ) at a rate of 0.02°/min. The phases present in the catalystsamples were identified using the Joint Committee on Powder Diffrac-tion Standard (JCPDS) powder data files. The XRD pattern and data
were also analyzed using the PowderX program [39]. From these XRDpatterns, the crystallite or grain size (dXRD) of the prepared powderswas estimated using the Scherrer equation as follows [40]:
dXRD ¼ K � λβ � cosθ
where λ, θ and β are the X-ray wavelength, Bragg diffraction angle andthe full width at half-maximum (FWHM) of the diffraction peak,respectively. K is a constant normally equal to 0.94 and λ=0.1540 nm(the wavelength of emission of the device).
2.3.2. Specific surface areaThe powder specific surface areas (SSA) were determined by
nitrogen adsorption (>99.999%) at 77.35 K using the Brunauer–Emmett–Teller (BET)method on aMicromeritics Tristar 3000 apparatus.Prior to analysis, the sample was heated (150 °C, 1 h) with flowing N2
(>99.999%) to remove the adsorbed water. Assuming a monodisperseparticle distribution and spherical primary particles, the BET-equivalent particle diameter (dBET, in nm) was calculated using thefollowing expression (2) [41], where SSA (m2 g−1) is specific surfaceareas, ρ is theoretical densities (g cm−3). The corresponding pore sizedistribution (POSD) were calculated using the desorption data basedon the Barrett–Joyner–Halenda (BJH) method.
dBET ¼ 6000ρ� SSA
:
2.3.3. Transmission electron microscopyFor scanning transmission electron microscopy, the materials
were deposited onto carbon foil supported by a copper grid. TEManalysis was carried out using a CM-30 microscope (Philips; operatedat 300 kV, image resolution b0.23 nm). The TEM images were analyzedusing the flexible plugin architecture of the public domain imageprocessing program ImageJ [42] to determine precisely the primaryparticle size (dTEM) and particle size distribution (PASD).
2.3.4. X-ray photoelectron spectroscopyThe surface oxidation states of the metals were determined by
XPS. The binding energies (BEs) were used to obtain information onthe valence and chemical environment of the atom studied. The XPSintensities are calculated less frequently, even though they can pro-vide valuable information, e.g., the concentration profile of the activematerial in the catalyst pellet and the size of the deposited material.XPS was performed on an AXIS-NOVA (Kratos. Inc) spectrometerwith high-resolution scans using monochromatic Al Ka radiation(1486.6 eV), a step size of 0.05 eV and a dwell time of 100 ms. Thespectral regions of the Ti 2p, O 1 s, and C 1 s peaks were acquired.After subtracting the Shirley-type background, the core-level spectrawere decomposed into their components with mixed Gaussian–Lorentzian lines using a non-linear least squares curve-fitting procedureon the public software package XPSPEAK v4.1.
2.4. Photocatalytic activities
The photocatalytic activity of catalystswas characterized bymeasur-ing the rate of MB degradation. MB was selected because of its strongadsorption to metal oxide surfaces, well defined optical absorptionand good resistance to light degradation. The catalyst (100 mg) wasslurried in 100 cm3 of a methylene blue solution (50 ppm) at 25 °C,initial pH of 7.0. Before irradiation, the suspensionswere stirredmagnet-ically under dark conditions for 30 min (graphically, Fig. 6, representedas time−30 min). The mixture was continuously stirred under a 15WUV light (LV-215.LC; Vilber Lourmat, France) with intense emissionlines at 365 nm. The slurry was stirred constantly to avoid settling and

169H.A. Le et al. / Powder Technology 225 (2012) 167–175
ensure constant exposure of the catalyst to UV radiation for 0–120 min.In the absence of a photocatalyst, MB was stable when exposed to UVradiation for extended periods. The progress of the photocatalytic degra-dation of MB was monitored by measuring the absorbance in a UV–VISspectrophotometer (SHIMADZU, UV-2550) at its maximum absorptionpeak (λmax=663 nm). The MB photodegradation experiments wererepeated three times with excellent agreement.
3. Results and discussion
3.1. Characterization of catalysts
3.1.1. Specific results on XRD analysisThe materials were analyzed by XRD and the results are shown in
Fig. 1. The diffraction patterns of TiO2 (with/without CSAC composited)and CSAC are also presented for comparison. The two broad peaks of theCSAC sample indicate that the content of the well ordered crystallinephase can be neglected. The peak from 20° to 30° 2θ corresponds toreflexes in the (002) plane, whereas the peak from 40° to 48° 2θ corre-spond to the (100) plane [43]. It exhibits broad peaks and an absence ofa sharp peak indicating a predominantly amorphous structure, which isa typical characteristic of activated carbon. This also indicated an advan-tageous property for well-defined adsorbents. The naked TNP (P-25,T-95), CP-n and CT-n photocatalystswere dominatedmainly by anatase.The main diffraction peaks at 25.3°, 37.8°, 48°, 53.9°, 55° and 62.5° 2θwere assigned to the diffraction planes of (1 0 1), (0 0 4), (2 0 0), (10 5), (2 1 1) and (2 0 4) for anatase (JCPDS # 021-1272), respectively.Other crystal phases corresponding to peaks at 27.4 and 36.1° 2θ wereassigned the diffraction peaks of (1 1 0) and (1 0 1) of rutile (JCPDS #021-1276), respectively. The XRD patterns revealed the diffractionpeaks of a mixture of anatase and rutile, which is favorable for photoca-talytic reactions [14,15,44,45]. XRD also showed that the CSAC did notaffect the crystal structure of TiO2 deposited but peaks intensity becamelower and peaks shape wider while the mass ratio of TiO2/CSAC isincreasing. The XRD pattern of CT-1 appears to be smoother than itsprimary (T-95) and out of the same cloth (CT-2). This might be causedby the mass ratio of CSAC present in the powders. On the other hand,it was not observed in the CP-1 sample with the same mass ratio ofCSAC. This might be because the vapor-made catalyst T-95 was synthe-sized by CVC process using TTIP as a precursor, whereas the commercialcatalyst P-25 was produced by flame using TiCl4 as the precursor.Nevertheless, no new compounds were found in obtained compositecatalysts.
Data analysis of XRD patterns was performed using the PowderXprogram. The crystallite or grain size (dXRD) was determined using
20 30 40 50 60 70 80
(100
)
(002
)
CSAC
Rel
ativ
e in
tens
ity (
a.u.
)
2-theta (deg.)
T-95
CT-2
CT-1
CP-2
CP-1
P-25
Fig. 1. XRD pattern of the different catalysts. The symbols (○) and (□) indicated anataseand rutile phases, respectively.
means of the Scherrer formula, which is expressed and listed inTable 1. The anatase crystallite sizes of P-25, T-95, CP-1, CP-2, CT-1and CT-2 were 22.4, 12.6, 21.7, 20.2, 11.8 and 10.2 nm, respectively.The diffraction peak width increased with increasing BET surface areaand pore volume. Therefore, the crystal size of the TiO2 decreasedaccording to Eq. (1). This is in agreement with the literature in that itcan produce nanostructured powders with high purity, no agglomera-tion and a grain size b30 nm [30–32]. The TiO2/CSAC ratio may beresponsible for this crystallite size reduction because the formation ofTiO2 can occur in the pores of activated carbon. This suggests that theCSAC could enhance the photocatalytic activity of TNP and would bepresented in composited samples. Furthermore, the anatase content(fA), as listed in Table 1, was determined from the integrated intensityof the anatase diffraction line (101), IA, and that of the rutile diffractionline (110), IR, using the following equation [46].
f Að Þ ¼1
1þ 12:6IAIR
:
The anatase content of P-25, T-95, CP-1, CP-2, CT-1 and CT-2 were0.823, 0.966, 0.750, 0.758, 0.942 and 0.936, respectively. The f(A)values show that the phases of obtained catalysts were mainlyanatase with a small amount of rutile. This also suggests that thevapor-made catalyst (T-95) and its composite CSAC with >90% anataseshow improved photocatalyst activity.
3.1.2. Specific results on catalyst surface area, porosity and pore sizedistribution
Table 1 lists the BET surface area (SSA), pore volume and averagepore diameter of CSAC, TNP, CP-n and CT-n. The results show that theSSA of the CP-n and CT-n composite was reduced by approximately300–670 m2 g−1 compared to the CSAC (ca. 1062 m2 g−1). On theother hand, the pore volume was reduced by 0.09–0.37 cm3 g−1.The SSA of naked TiO2 (P-25, T-95) was increased from 58.5, 134.4to 388.09, 577.03 or 601.99, 753.79 m2 g−1, respectively dependingon the mass ratio of TiO2/CSAC (1/1 or 2/1). This suggests that thecharacteristics of the composited catalyst were enhanced because itmay provide more active sites for the photocatalytic reaction.
Fig. 2 shows a plot of POSD of CSAC, TNP, CP-n, and CT-n catalysts,as estimated using the BJH method from the desorption branches. Theaverage pore diameter of the composited samples (CP-n, and CT-n)remained relatively unchanged. There are probably two factors leadingto these results. First, a considerable amount of the TNP blocked a part ofthe porous structures of the CSAC. Second, the density of TiO2 is higherthan that of CSAC and there is absence of a porous structure in TNP.Therefore, the CP-n and CT-n composite shows a smaller BET surfacearea and pore volume than CSAC. The dBET increased with increasingmass ratio of CSAC on composite catalysts but the SSA decreased.There are significant gaps in the particles sizes of dBET and dXRD, whichwere calculated based on the BET and XRD results, as listed in Table 1,respectively. This reveals a factor of 0.1 to 0.9 difference. The possiblereasons for this difference are polydispersity because dBET is a surface-weighted particle property, whereas dXRD is a mass-weighted particleproperty, which would lead to dBET/dXRDb1 [47].
3.1.3. Specific results on TEMFig. 3 shows the PASD and TEM. The TEM images (Fig. 3a, b) of the
CSAC sample showed irregular nanorods and a spherical morphology.The diameter and lengths of the nanorods were less than 10 nm and100 nm, respectively. As shown in Fig. 3b, the break appears to bemacropores, which indicates high adsorption capacity [48]. ThePASD histograms in Fig. 3 show that the main particle sizes of P-25,CP-1 and CP-2 are ≤20 nm, whereas the particle sizes of T-95, CT-1and CT-2 are ≤10 nm. The primary particle size (dTEM) is smaller thanthe crystalline or grain size (dXRD) obtained by XRD line broadening.

Table 1Texture properties of the different catalysts.
Sample TiO2:CSACweight ratio
SSA(m2 g−1)
Pore volume(cm3 g−1)
Average pore diameter(nm)
dBETa
(nm)dXRD
b
(nm)fA
c
CSAC 0:1 1061.44 0.371668 1.68 – – –
P-25 1:0 58.51 0.001542 12.24 20.70 22.4 0.823T-95 1:0 134.40 0.004169 7.14 11.63 12.6 0.966CP-1 1:1 601.99 0.204225 3.02 2.60 21.7 0.750CP-2 2:1 388.09 0.123341 4.68 4.03 20.2 0.758CT-1 1:1 753.79 0.188216 3.26 2.07 11.8 0.942CT-2 2:1 577.03 0.280216 3.62 2.71 10.2 0.936
a Particle size, calculated by Eq. (2) [41].b Crystallite size of TiO2 (1 0 0) calculated using the Eq. (1) [40].c Anatase content calculated using Eq. (3) [46].
170 H.A. Le et al. / Powder Technology 225 (2012) 167–175
The TEM images also show a stepped surface, which is a result of thehigh crystallinity [47].
3.1.4. Specific results on XPS analysisXPS is a powerful technique for characterizing the surface oxygen
species and determining the surface chemical composition. In thisstudy, XPS was used for both purposes. To examine the local chemicalstate of functional groups on the surface, curve fitting of the raw dataof the C 1 s, O 1 s and Ti 2p3/2 spectra was performed using the publicsoftware package XPSPEAK v4.1 and plotted in Figs. 4 and 5, respec-tively. Table 2 lists the deconvolution results with respect to eachpeak position. As shown in Fig. 4, the carbon 1 s peak (C1) of allsamples appeared at the same energy level and was asymmetricalwith the BE of the peak at 284.4 eV. Table 2 shows that a series ofgroups, such as graphitic carbons (C\C) and/or C\H, may exist on
0 20 40 60 80 100 0 20 40
0 20 40 60 80 100 0 20 40
0.00
0.05
0.10
0.15
0.20
0.25
0.00
0.05
0.10
0.15
0.20
0.25
0.0
0.1
0.2
0.3
0.4
0.5
0.0
0.2
0.4
0.6
0.8
0 10 20 30 40 50 60 700.0
0.1
0.2
0.3
0.4
0.5
Average pore diameter (nm)
Average pore diameter (nm)
Average por
Average po
T-95
P-25
CSAC
dv/d
log(
D)
cm3
g-1dv
/dlo
g(D
) cm
3 g-1
dv/d
log(
D)
cm3
g-1
dv/d
log(
D)
cm3
g-1
dv/d
log(
D)
cm3
g-1
Average pore diameter (nm)
Fig. 2. Pore-size distribution
the catalyst surface [49,50]. The C 1 s BE for graphite is 284.4 eV, asdetermined from XRD. The C2 peaks in the C 1 s spectra located atapproximately 285.4–285.8 eV were assigned to a C atom bound to O.
In Fig. 5 (left cluster), the XPS O 1 s spectra of sample CSAC showsa peak at approximately 531.3 eV, corresponding to carbonyl/C_Ospecies; the peak at approximately 533.1 was assigned to hydroxyl/C\OH and/or C\Omoieties, respectively. On the other hand, samplesof naked TNP with/without composites with CSAC, showed twogroups of O1 and O2 at 530.7 eV and 532.8 eV, which were assignedto atomic oxygen and hydroxyl groups, respectively [51]. The mainpeaks O1 located at a BE of 530.7 eVwere attributed to carbon or titaniaoxides. Composite materials were reported to have a significantlyhigher total amount of surface oxygen-containing functional groupscompared to that of the CSAC host [52]. Thus far, this band was alsoenhanced compared to that in the CSAC host.
60 80 100
60 80 100 0 20 40 60 80 100
0 20 40 60 80 100 1200.0
0.2
0.4
0.6
0.8
0.0
0.1
0.2
0.3
0.4
0.5CT-2
Average pore diameter (nm)e diameter (nm)
CT-1
CP-2
re diameter (nm) Average pore diameter (nm)
CP-1
dv/d
log(
D)
cm3
g-1dv
/dlo
g(D
) cm
3 g-1
of the different catalysts.

Fig. 3. Particle size distribution and TEM images from the CSAC (a, b); P-25 (c); T-95 (d); CP-1 (e); CP-2 (g); CT-1 (f), and CT-2 (h).
171H.A. Le et al. / Powder Technology 225 (2012) 167–175
Fig. 5 shows the XPS Ti 2p3/2 spectra (right cluster). The compo-nents of the Ti 2p3/2 peaks were centered at BE of 459.5 eV, indicatingthe presence of a Ti4+ state, so the Ti element of the surface of TiO2
exists in the form of TiO2 for all samples. This point is in strong agree-ment with other characteristics of the materials. The relative intensityof the low-BE peak decreased with increasing Ti content, even thoughit was much less intense than that of the high-BE peak. For the CT-2sample, however, the doublet observed at a BE of 458.3 eV (8.6%) waswell decomposed by two doublets corresponding to two oxidationstates of Ti atoms [53], which is more consistent with bulk anatase[54] and with Ti\O\Ti bonds [55]. The component at a lower BEmight be interpreted, according to Zhu et al. [56], as being due to thepresence of defective titanium surface sites, which are the result ofinteractions of the oxide surface with OH radicals. Interestingly, CT-2was the most photocatalytic activity sample [57] in terms of the degra-dation of MB. Overall, XPS showed that titanium is mostly confined toits highest oxidation state (Ti4+). The data are in good agreementwith the fact that the main peak of TiO2 is located at 459.5 eV. Therewas no significant difference in the XPS spectra between naked TiO2
(P-25, T-95) and the catalysts modified with CSAC. The XPS results arealso in agreement with the XRD results.
3.2. Specific results on characterization of photocatalytic activity andadsorption kinetic study
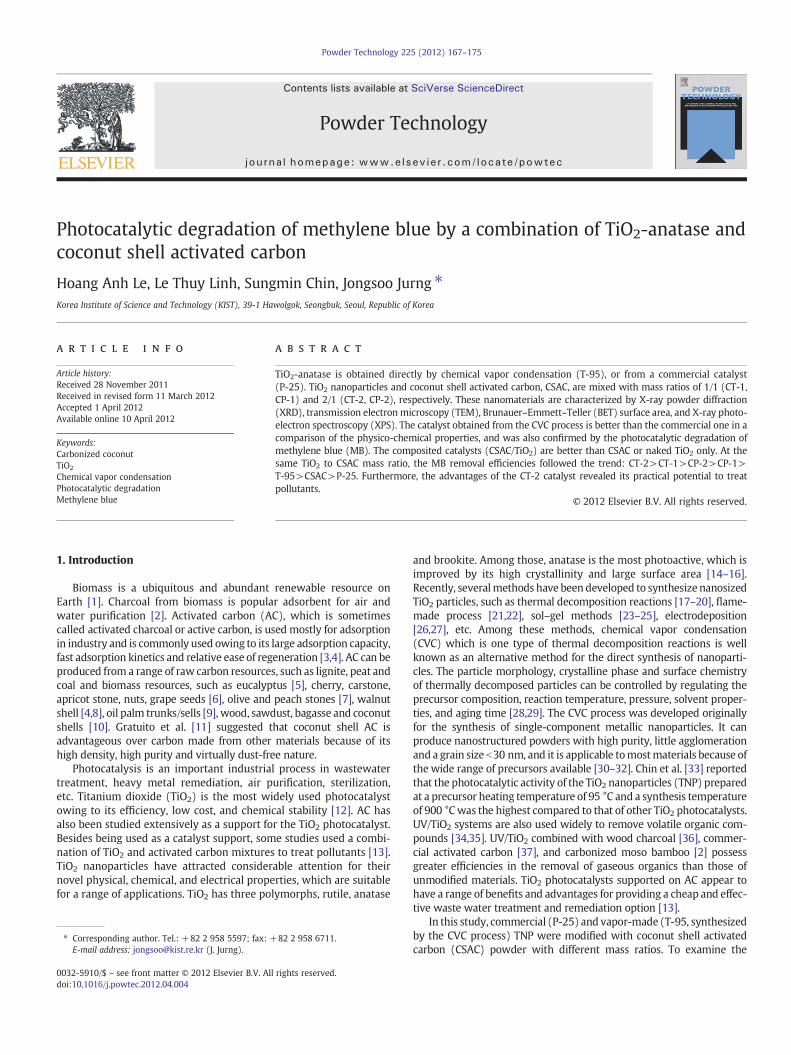
Fig. 6 shows the photocatalytic activity of CSAC, TNP and thosecombinations. Under dark conditions, the adsorption yield, CSACpresented the highest activity, whereas TNP showed almost no activity.There are two clusters presented in this condition of MB degradation;naked TNP (P-25 and T-95), and CSAC and composited catalysts (CP-nand CT-n). Under dark conditions, adsorption yield, the catalyst activitydepends on the CSACmass ratio. The naked TNP composited CSAC witha 1/1 mass ratio (CP-1, CT-1) was stronger than that with a 2/1 mass
ratio (CP-2, CT-2) but the situation was opposite when the UV lampwas turned-on (light on yield). Reactions (1)–(5) describe the simpli-fied mechanism of TiO2 activation with UV light [58].
TiO2 þ hνðUVÞ→TiO2ðe−CB þ hþVBÞ ð1Þ
TiO2ðhþVBÞ þ H2O→TiO2 þ H
þ þ OH• ð2Þ
TiO2ðhþVBÞ þ OH
−→TiO2 þ OH• ð3Þ
TiO2ðe−CBÞ þ O2→TiO2 þ O•−2 ð4Þ
O•−2 þ H
þ→HO2:• ð5Þ
For the mechanism of photosensitized oxidation, in the presenceof catalysts the excited state of MB injects an electron into the con-duction band (reaction (6)). The dye is then converted to a cationicdye radical that undergoes degradation to yield products accordingto the following reactions ((7)–(10)) [58].
MB⁎ þ TiO2→MB•
þ þ e−CBðTiO2Þ ð6Þ
O2 þ e−→O•−2 ð7Þ

288 287 286 285 284 283 282
288 287 286 285 284 283 282
288 287 286 285 284 283 282
288 287 286 285 284 283 282
288 287 286 285 284 283 282
Legend:
Raw data Fit curve Backgound Peak 1 Peak 2
Binding energy (eV)Binding energy (eV)
Inte
nsity
(a.
u.)
Inte
nsity
(a.
u.)
Inte
nsity
(a.
u.)
Inte
nsity
(a.
u.)
C2
C1
CSAC
Inte
nsity
(a.
u.)
Binding energy (eV)
CP-1
C1
C2
C2
C1
Binding energy (eV)Binding energy (eV)
CT-1
C1
C2
CT-2
CP-2
C2 C
1
Fig. 4. Curve-fitted as-measured C 1 s of the different catalysts.
172 H.A. Le et al. / Powder Technology 225 (2012) 167–175
MB•þ þ OH
−→MB þ OH• ð8Þ
MB•þ þ OH•→products ð9Þ
MB•þ þ O•
−2 →products: ð10Þ
The absorption of visible light by the catalyst produced a hole inthe valence band and an electron in the conduction band. Theelectron-hole pairs, thus generated, can initiate oxidation and reduc-tion reactions on the surface of the TiO2 particles. The holes (hVB+)react with adsorbed OH− groups and produce OH• radicals. On theother hand, electrons (eCB−) react with O2 and produce the superoxideanion radical O•2−. OH• and O•2− radicals worked together to degradeMB. The experimental results show that the rate of MB degradationusing CT-2 is high compared to each other, which could be due tothe anatase phase stability and the high surface area. Furthermore,the important factor that enhances the photoactivity of TiO2 is thepresence of CSAC. By CSAC support, the photoactivity of TiO2 isevidently increased because the high surface area of CSAC effectivelyconcentrates MB around the deposited TiO2 and produce highconcentrations of organic compounds for the TiO2 photocatalysis.The CSAC might improve the thermal stability of TiO2, the growth ofcrystalline size, the surface area and preserve a higher content ofsurface hydroxyl groups [59]. The removal MB reached 100% of thecomposited photocatalysts with TiO2/CSAC mass ratios of 1:1 and2:1 at 60 and 80 min, respectively. The vapor-made catalyst (T-95)synthesized by CVC showed higher photoactivity than commercialcatalyst (P-25). Thiswas predicted by the physico-chemical properties
of materials, such as the anatase content, particle size and SSA. TheCT-2 was the most effective, which was attributed to the synergisticeffects of the adsorptive properties of CSAC and photocatalytic activityof the TiO2 in the composite. Owing to its high performance ability, thecomposite TiO2/CSAC is a very promising photocatalyst for the degra-dation of organic pollutants.
Several experimental results suggest that the rates of photocatalyticoxidation of various contaminants over illuminated TiO2 occur viapseudo-first-order kinetics [60–63].
lnC0
Ct
� �¼ kKt ¼ kappt ð11Þ
or
Ct ¼ C0e−kappt ð12Þ
where C0 is the initial concentration of MB, Ct is the concentration ofthe MB at illumination time t, k is the reaction rate constant and K isthe adsorption coefficient of the reactant. A plot of ln(C0/Ct) versus timerepresents a straight line, the slope equals the apparent first-order rateconstant kapp. Table 3 lists the apparent first-order rate constants (kapp)for different photocatalysts, which were calculated from Fig. 6. kapp hasbeen used as a comparison parameter because it is independent of theconcentration used. It enables one to determine the photocatalyticactivity independent of the previous adsorption period in the dark.The degradation rate of MB by the composite catalysts was higherthan that of the naked TNP. Hence, the kapp of CT-2 is the highest(0.097). The kapp values of the composited catalysts with a TiO2/CSACmass ratio 1:1 and 2:1 were two- and three times faster than naked

536 534 532 530 528
Legend:
Raw data Fit curve Background Peak 1 Peak 2
Binding energy (eV)
O1
O2
O1
O2
O1
O2
462 461 460 459 458 457
Ti-O
Ti-O
Ti-O
Ti-O
Ti-O
Ti-O-Ti
Ti-O
CSAC
P-25
CP-2
CP-1
Inte
nsity
(a.
u.)
O1O
2
O1O
2
T-95
CT-1
O1
O2
CT-2O
2
Fig. 5. Curve-fitted as-measured O 1 s (left cluster) and Ti 2p3/2 (right cluster) for different catalysts.
173H.A. Le et al. / Powder Technology 225 (2012) 167–175
TNP, respectively. CSAC possesses large numbers of active adsorptionsites due to its well-developed pore structure with a very large surfacearea and adsorption capacity. Therefore, organic molecules were
Table 2Binding energy and area ratio (%) of the characteristic peaks in C 1 s, O 1 s, and Ti 2p3/2 spe
Sample C 1 s O 1 s
C1 C2 O1
C\CC\H
O\C_O O atomC_O
CSAC 284.4 (83.5) 285.5 (16.5) 531.3 (58.P-25 – – 530.7 (61.T-95 – – 530.7 (76.CP-1 284.4 (67.1) 285.4 (32.9) 530.7 (76.CP-2 284.4 (53.0) 285.6 (47.0) 530.7 (80.CT-1 284.4 (57.0) 285.5 (43.0) 530.7 (75.CT-2 284.4 (41.6) 285.8 (58.4) 530.7 (92.
The number in brackets is area ratio (%) of each group.
adsorbed by CSAC prior to being transferred to the decompositioncenter of TiO2. In the composite, the organic concentration aroundTiO2 was higher than for the case of naked TiO2, so the reaction rate
ctra for the different catalysts.
Ti 2p3/2
O2 T1 T2
O\HC\O
Ti\O Ti\O\Ti
8) 533.1 (41.2) – –
8) 532.8 (38.2) 459.5 (100) –
8) 532.8 (23.2) 459.5 (100) –
1) 532.8 (23.9) 459.5 (100) –
6) 532.8 (19.4) 459.5 (100) –
9) 532.8 (24.1) 459.5 (100) –
2) 532.8 (7.8) 459.5 (91.4) 458.3 (8.6)
-20 0 20 40 60 80 100 1200.0
0.2
0.4
0.6
0.8
1.0 UV light on
dark
MB
con
vers
ion
(C/C
o)
UV irradiation time (min)
CSAC P-25 T-95 CP-1 CP-2 CT-1 CT-2
Fig. 6. Kinetics of photocatalytic MB degradation over the different catalysts.
174 H.A. Le et al. / Powder Technology 225 (2012) 167–175
was faster. This is a good confirmation for materials in which physico-chemical properties were mentioned. It had a better performance forMB photocatalytic degradation compared with two mixture catalystsof synthetic TiO2/CSAC and commercial one P-25/CSAC.
4. Conclusions
The charcoal from biomass, carbonized coconut (CSAC), wasmodified successfully with TNP (P-25 commercial catalyst and T-95synthesized by CVC process). The materials' characteristics showedthat TNP was mainly anatase with high crystallinity, small particlesize, and large SSA (>750 m2 g−1) after being composited. Themodified products (CP-n and CT-n) demonstrated significantly highercapacity in pollutant removal than the unmodified materials (CSAC,P-25, T-95). Owing to the composited TiO2 and CSAC, the preparedTiO2/CSAC showed high photoactivity for the photodegradation of MBin the following order: CT-2>CT-1>CP-2>CP-1>T-95>CSAC>P-25.The obtained CT-2 catalyst (TiO2/CSAC with the mass ratio of 2:1) hasgreat practical potential in wastewater treatment. This study suggeststhat these modified materials have high potential economic value forremoving pollutants and warrant further studies.
Acknowledgment
This work has been supported by the Ministry of Environment(192-091-001), the Ministry of Education, Science and Technology(2011K000750) and the Korea Institute of Science and Technology(KIST) Institutional Program (2E22181).
Table 3Apparent first-order rate constants (kapp) for the different photocatalysts.
Photocatalysts kapp (min−1) R2
P-25 0.014 0.963T-95 0.024 0.989CP-1 0.029 0.968CP-2 0.045 0.969CT-1 0.050 0.997CT-2 0.097 0.989
References
[1] T. Han, T. Fan, S.-K. Chow, D. Zhang, Biogenic N-P-codoped TiO2: synthesis, char-acterization and photocatalytic properties, Bioresource Technology 101 (2010)6829–6835.
[2] C.S. Chuang, M.K. Wang, C.H. Ko, C.C. Ou, C.H. Wu, Removal of benzene and tolu-ene by carbonized bamboo materials modified with TiO2, Bioresource Technology99 (2008) 954–958.
[3] G. Afrane, O. Achaw, Effect of the concentration of inherent mineral elements onthe adsorption capacity of coconut shell-based activated carbons, BioresourceTechnology 99 (2008) 6678–6682.
[4] Z. Hu, M. Srinivasan, Preparation of high-surface-area activated carbons from co-conut shell, Microporous and Mesoporous Materials 27 (1999) 11–18.
[5] P. Patnukao, P. Pavasant, Activated carbon from Eucalyptus camaldulensis Dehnbark using phosphoric acid activation, Bioresource Technology 99 (2008)8540–8543.
[6] K. Gergova, N. Petrov, S. Eser, Adsorption properties and microstructure of acti-vated carbons produced from agricultural by-products by steam pyrolysis, Car-bon 32 (1994) 693–702.
[7] M. Molina-Sabio, F. Rodriguez-Reinoso, F. Caturla, M. Sellés, Porosity in granularcarbons activated with phosphoric acid, Carbon 33 (1995) 1105–1113.
[8] J.F. González, S. Román, J.M. Encinar, G. Martínez, Pyrolysis of various biomassresidues and char utilization for the production of activated carbons, Journal ofAnalytical and Applied Pyrolysis 85 (2009) 134–141.
[9] K.Y. Foo, B.H. Hameed, Utilization of biodiesel waste as a renewable resource foractivated carbon: application to environmental problems, Renewable and Sus-tainable Energy Reviews 13 (2009) 2495–2504.
[10] O. Ioannidou, A. Zabaniotou, Agricultural residues as precursors for activated car-bon production — a review, Renewable and Sustainable Energy Reviews 11(2007) 1966–2005.
[11] M. Gratuito, T. Panyathanmaporn, R. Chumnanklang, N. Sirinuntawittaya, A.Dutta, Production of activated carbon from coconut shell: optimization using re-sponse surface methodology, Bioresource Technology 99 (2008) 4887–4895.
[12] U.I. Gaya, A.H. Abdullah, Heterogeneous photocatalytic degradation of organiccontaminants over titanium dioxide: a review of fundamentals, progress andproblems, Journal of Photochemistry and Photobiology C: Photochemistry Re-views 9 (2008) 1–12.
[13] G. Li Puma, A. Bono, D. Krishnaiah, J.G. Collin, Preparation of titanium dioxidephotocatalyst loaded onto activated carbon support using chemical vapor deposi-tion: a review paper, Journal of Hazardous Materials 157 (2008) 209–219.
[14] J. Moon, H. Takagi, Y. Fujishiro, M. Awano, Preparation and characterization of theSb-doped TiO2 photocatalysts, Journal of Materials Science 36 (2001) 949–955.
[15] J. Ovenstone, Preparation of novel titania photocatalysts with high activity, Jour-nal of Materials Science 36 (2001) 1325–1329.
[16] M. Toyoda, Y. Nanbu, Y. Nakazawa, M. Hirano, M. Inagaki, Effect of crystallinity ofanatase on photoactivity for methyleneblue decomposition in water, Applied Ca-talysis B: Environmental 49 (2004) 227–232.
[17] S. Chin, J. Jurng, J.H. Lee, S.J. Moon, Catalytic conversion of 1, 2-dichlorobenzeneusing V2O5/TiO2 catalysts by a thermal decomposition process, Chemosphere 75(2009) 1206–1209.
[18] M. Inagaki, T. Imai, T. Yoshikawa, B. Tryba, Photocatalytic activity of anatase pow-ders for oxidation of methylene blue in water and diluted NO gas, Applied Catal-ysis B: Environmental 51 (2004) 247–254.
[19] C.S. Kuo, Y.H. Tseng, C.H. Huang, Y.Y. Li, Carbon-containing nano-titania preparedby chemical vapor deposition and its visible-light-responsive photocatalytic ac-tivity, Journal of Molecular Catalysis A: Chemical 270 (2007) 93–100.
[20] S. Matsuda, H. Hatano, A. Tsutsumi, Ultrafine particle fluidization and its applica-tion to photocatalytic NOx treatment, Chemical Engineering Journal 82 (2001)183–188.
[21] K.K. Akurati, A. Vital, G. Fortunato, R. Hany, F. Nueesch, T. Graule, Flame synthesisof TiO2 nanoparticles with high photocatalytic activity, Solid State Sciences 9(2007) 247–257.
[22] G.W. Lee, S.M. Choi, Thermal stability of heat-treated flame-synthesized anataseTiO2 nanoparticles, Journal of Materials Science 43 (2008) 715–720.
[23] K.D. Kim, H.T. Kim, Synthesis of TiO2 nanoparticles by hydrolysis of TEOT and de-crease of particle size using a two-stage mixed method, Powder Technology 119(2001) 164–172.
[24] Y. Bessekhouad, D. Robert, J.V. Weber, Synthesis of photocatalytic TiO2 nanopar-ticles: optimization of the preparation conditions, Journal of Photochemistryand Photobiology A: Chemistry 157 (2003) 47–53.
[25] I. Kuznetsova, V. Blaskov, I. Stambolova, L. Znaidi, A. Kanaev, TiO2 pure phasebrookite with preferred orientation, synthesized as a spin-coated film, MaterialsLetters 59 (2005) 3820–3823.
[26] Y. Lei, L. Zhang, J. Fan, Fabrication, characterization and Raman study of TiO2
nanowire arrays prepared by anodic oxidative hydrolysis of TiCl3, Chemical Phys-ics Letters 338 (2001) 231–236.
[27] S. Liu, K. Huang, Straightforward fabrication of highly ordered TiO2 nanowire ar-rays in AAM on aluminum substrate, Solar Energy Materials and Solar Cells 85(2005) 125–131.
[28] W. Payakgul, O. Mekasuwandumrong, V. Pavarajarn, P. Praserthdam, Effects of re-action medium on the synthesis of TiO2 nanocrystals by thermal decompositionof titanium (IV) n-butoxide, Ceramics International 31 (2005) 391–397.
[29] P. Supphasrirongjaroen, P. Praserthdam, J. Panpranot, D. Na-Ranong, O.Mekasuwandumrong, Effect of quenching medium on photocatalytic activity ofnano-TiO2 prepared by solvothermal method, Chemical Engineering Journal 138(2008) 622–627.

175H.A. Le et al. / Powder Technology 225 (2012) 167–175
[30] E. Vasilyeva, O. Tolochko, B. Kim, D. Lee, D. Kim, Synthesis of tungsten disulphidenanoparticles by the chemical vapor condensation method, MicroelectronicsJournal 40 (2009) 687–691.
[31] J. Kim, B. Kim, Synthesis of nanosized tungsten carbide powder by the chemicalvapor condensation process, Scripta Materialia 50 (2004) 969–972.
[32] Z. Wang, C. Choi, J. Kim, B. Kim, Z. Zhang, Characterization of Fe–Co alloyed nano-particles synthesized by chemical vapor condensation, Materials Letters 57(2003) 3560–3564.
[33] S. Chin, E. Park, M. Kim, J. Jurng, Photocatalytic degradation of methylene bluewith TiO2 nanoparticles prepared by a thermal decomposition process, PowderTechnology 201 (2010) 171–176.
[34] M. Dagaonkar, The application of fine TiO2 particles for enhanced gas absorption,Chemical Engineering Journal 92 (2003) 151–159.
[35] W.Wang, L.W. Chiang, Y. Ku, Decomposition of benzene in air streams by UV/TiO2
process, Journal of Hazardous Materials 101 (2003) 133–146.[36] M. Doi, S. Saka, H. Miyafuji, D. Goring, Development of carbonized TiO2-woody
composites for environmental cleaning materials, Materials Science Research In-ternational 6 (2000) 615–621.
[37] C. Ao, S. Lee, Combination effect of activated carbon with TiO2 for the photodegra-dation of binary pollutants at typical indoor air level, Journal of Photochemistryand Photobiology A: Chemistry 161 (2004) 131–140.
[38] H.A. Le, S.-M. Chin, E.-S. Park, L.T. Linh, J.S. Jurng, Chemical vapor synthesis andcharacterization of manganese oxides, Chemical Vapor Deposition 17 (2011)228–234.
[39] C. Dong, PowderX, Institute of Physics, Chinese Academy of Sciences, Beijing,1997.
[40] H.P. Klug, L.E. Alexander, X-ray Diffraction Procedure for Polycrystalline andAmorphous Materials, second ed. Wiley, New York, 1974.
[41] R.A. Spurr, H. Myers, Quantitative analysis of anatase–rutile mixtures with an X-ray diffractometer, Analytical Chemistry 29 (1957) 760–762.
[42] W. Rasband, ImageJ, National Institutes of Health, Mental Health, Bethesda, Mary-land, USA, 2009.
[43] Z. Wang, Y. Chen, C. Zhou, R. Whiddon, Y. Zhang, J. Zhou, K. Cen, Decomposition ofhydrogen iodide via wood-based activated carbon catalysts for hydrogen produc-tion, International Journal of Hydrogen Energy 36 (2011) 216–223.
[44] M. Toyoda, Y. Nanbu, Y. Nakazawa, M. Hirano, M. Inagaki, Effect of crystallinity ofanatase on photoactivity for methyleneblue decomposition in water, Applied Ca-talysis B: Environmental 49 (2004) 227–232.
[45] S.S. Arbuj, R.R. Hawaldar, U.P. Mulik, B.N. Wani, D.P. Amalnerkar, S.B. Waghmode,Preparation, characterization and photocatalytic activity of TiO2 towards methy-lene blue degradation, Materials Science and Engineering B 168 (2010) 90–94.
[46] R.A. Spurr, H. Myers, Quantitative analysis of anatase–rutile mixtures with an X-ray diffractometer, Analytical Chemistry 29 (1957) 760–762.
[47] L. Mädler, W.J. Stark, S.E. Pratsinis, Flame-made ceria nanoparticles, Journal ofMaterials Research 16 (2002) 1356–1362.
[48] D. Das, V. Gaur, N. Verma, Removal of volatile organic compound by activated car-bon fiber, Carbon 42 (2004) 2949–2962.
[49] R. Yang, G. Liu, X. Xu, M. Li, J. Zhang, X. Hao, Surface texture, chemistry and ad-sorption properties of acid blue 9 of hemp (Cannabis sativa L.) bast-based activat-ed carbon fibers prepared by phosphoric acid activation, Biomass and Bioenergy35 (2011) 437–445.
[50] J. Díaz, G. Paolicelli, S. Ferrer, F. Comin, Separation of the sp3 and sp2 componentsin the C1s photoemission spectra of amorphous carbon films, Physical Review B:Condensed Matter and Materials Physics 54 (1996) 8064.
[51] E.R. Savinova, D. Zemlyanov, B. Pettinger, A. Scheybal, R. Schlögl, K. Doblhofer, Onthe mechanism of Ag(111) sub-monolayer oxidation: a combined electrochemi-cal, in situ SERS and ex situ XPS study, Electrochimica Acta 46 (2000) 175–183.
[52] Y.-J. Xu, G. Weinberg, X. Liu, O. Timpe, R. Schlögl, D.S. Su, Nanoarchitecturing ofactivated carbon: facile strategy for chemical functionalization of the surface ofactivated carbon, Advanced Functional Materials 18 (2008) 3613–3619.
[53] N. Mathews, M. Jacome, E.R. Morales, J. Antonio, Structural and spectroscopicstudy of the Fe doped TiO2 thin films for applications in photocatalysis, PhysicaStatus Solidi C 6 (2009) S219–S223.
[54] Y. Sheng, B. Zhou, Y. Liu, X. Zhao, C. Wang, Y. Pan, Z.C. Wang, Close-packed nano-TiO2 anatase microspheres synthesis and their luminescent properties, MaterialsLetters 60 (2006) 1327–1330.
[55] T. Blasco, M.A. Camblor, J.L.G. Fierro, J. Pérez-Pariente, X-ray photoelectron spec-troscopy of Ti-Beta zeolite, Microporous Materials 3 (1994) 259–263.
[56] J. Zhu, J. Yang, Z.-F. Bian, J. Ren, Y.-M. Liu, Y. Cao, H.-X. Li, H.-Y. He, K.-N. Fan, Nano-crystalline anatase TiO2 photocatalysts prepared via a facile low temperaturenonhydrolytic sol–gel reaction of TiCl4 and benzyl alcohol, Applied Catalysis B:Environmental 76 (2007) 82–91.
[57] G. Cappelletti, S. Ardizzone, C.L. Bianchi, S. Gialanella, A. Naldoni, C. Pirola, V.Ragaini, Photodegradation of pollutants in air: enhanced properties of nano-TiO2 prepared by ultrasound, Nanoscale Research Letters 4 (2008) 97–105.
[58] I.K. Konstantinou, T.A. Albanis, TiO2-assisted photocatalytic degradation of azodyes in aqueous solution: kinetic and mechanistic investigations: a review, Ap-plied Catalysis B: Environmental 49 (2004) 1–14.
[59] X. Wang, Z. Hu, Y. Chen, G. Zhao, Y. Liu, Z. Wen, A novel approach towards high-performance composite photocatalyst of TiO2 deposited on activated carbon, Ap-plied Surface Science 255 (2009) 3953–3958.
[60] J. Matos, J. Laine, J.M. Herrmann, Synergy effect in the photocatalytic degradationof phenol on a suspended mixture of titania and activated carbon, Applied Catal-ysis B: Environmental 18 (1998) 281–291.
[61] R.W. Matthews, Photooxidative degradation of coloured organics in water usingsupported catalysts. TiO2 on sand, Water Research 25 (1991) 1169–1176.
[62] T.C. An, X.H. Zhu, Y. Xiong, Feasibility study of photoelectrochemical degradationof methylene blue with three-dimensional electrode-photocatalytic reactor, Che-mosphere 46 (2002) 897–903.
[63] I.K. Konstantinou, T.A. Albanis, Photocatalytic transformation of pesticides inaqueous titanium dioxide suspensions using artificial and solar light: intermedi-ates and degradation pathways, Applied Catalysis B: Environmental 42 (2003)319–335.