PHOTO-INDUCED ISOMERIZATION AND DIMERIZATION OF VARIOUS STYRYL
85
PHOTO-INDUCED ISOMERIZATION AND DIMERIZATION OF VARIOUS STYRYL QUINOLINES Tyler Harris A Thesis Submitted to the University of North Carolina Wilmington in Partial Fulfillment of the Requirements for the Degree of Master of Science Department of Chemistry and Biochemistry University of North Carolina Wilmington 2009 Approved by Advisory Committee ____________Ralph Mead ____________ __________Jeremy Morgan ___________ ____________John Tyrell _____________ ___________Pam Seaton _____________ Chair Accepted by __________________________________ Dean, Graduate School
Transcript of PHOTO-INDUCED ISOMERIZATION AND DIMERIZATION OF VARIOUS STYRYL

PHOTO-INDUCED ISOMERIZATION AND DIMERIZATION OF VARIOUS STYRYL
QUINOLINES
Tyler Harris
A Thesis Submitted to the
University of North Carolina Wilmington in Partial Fulfillment
of the Requirements for the Degree of
Master of Science
Department of Chemistry and Biochemistry
University of North Carolina Wilmington
2009
Approved by
Advisory Committee
____________Ralph Mead____________ __________Jeremy Morgan___________
____________John Tyrell_____________ ___________Pam Seaton_____________
Chair
Accepted by
__________________________________
Dean, Graduate School
ii
TABLE OF CONTENTS
ABSTRACT ................................................................................................................................... iii
ACKNOWLEDGEMENTS ........................................................................................................... iv
LIST OF TABLES ...........................................................................................................................v
LIST OF FIGURES ....................................................................................................................... vi
INTRODUCTION ...........................................................................................................................1
RESULTS AND DISCUSSION ......................................................................................................7
Photoisomerization ............................................................................................................18
Solid State Photodimerization............................................................................................32
CONCLUSION ..............................................................................................................................56
EXPERIMENTAL .........................................................................................................................59
General ...............................................................................................................................59
Photoisomerization ............................................................................................................64
Photodimerization ..............................................................................................................64
UV-Vis Spectroscopy of Dimer .........................................................................................65
REFERENCES ..............................................................................................................................66
APPENDIX ....................................................................................................................................68

iii
ABSTRACT
Various styryl quinolines were synthesized by the condensation of a variety of substituted
benzaldehydes with quinaldine in the presence of acetic anhydride. The photoisomerization of
these compounds was studied in a methanol solution. The solution was irradiated with 365 nm
light to induce the trans to cis isomerization, and then the solution was irradiated with 254 nm
light to induce the cis to trans isomerization. The trans to cis isomerization was followed by
HPLC analysis after 10, 20, 30, 45, 60, 120, and 600 seconds of irradiation, and then the cis to
trans isomerization was analyzed by HPLC after 600 seconds of irradiation. It was found that
the extent of isomerization depends heavily on the λmax of the isomer and the wavelength of
irradiation. None of the compounds studied would completely convert to one isomer by
irradiation, because of overlap in the UV-Vis spectra of the trans and cis isomers.
The [2+2] photo-induced dimerization reaction involving a range of styryl quinoline
compounds was studied in the solid state as a thin polycrystalline film. The styryl quinoline
compound was dissolved in several solvents (acetonitrile, chloroform, and methanol) and applied
to a petri dish as a polycrystalline film; it was then irradiated with light from an incandescent
bulb (60 W). The samples were analyzed by NMR spectroscopy after 24, 48, and 72 hours. It
was determined that when chloroform is the solvent, the rate and extent of dimerization
increased for nearly all of the compounds studied. Halogen containing compounds also dimerize
in nearly 100% yields. By protonating the nitrogen atom of styryl quinoline with the addition of
acid (hydrochloric acid or trifluoro acetic acid), the extent of dimerization increased dramatically
for all compounds. It was proposed that the major factor in whether the monomer will dimerize,
is how the monomer stacks in the crystal structure.
iv
ACKNOWLEDGEMENTS
I would like to thank the following people who were instrumental in the completion of this
thesis:
Dr. Pamela J. Seaton (Department of Chemistry and Biochemistry, UNCW)
Dr. John A. Tyrell (Department of Chemistry and Biochemistry, UNCW)
Dr. Jeremy Morgan (Department of Chemistry and Biochemistry, UNCW)
Dr. Ralph Mead (Department of Chemistry and Biochemistry, UNCW)
Dr. Kraig A. Wheeler (Department of Chemistry, EIU)
UNCW and UNCW Department of Chemistry and Biochemistry for providing Teaching
Assistantships
UNCW Faculty, Staff, Graduate and Undergraduate students

v
LIST OF TABLES
Table Page
1. Name and substituents of all compounds synthesized……………………………………. 8
2. Percent yield, melting point, UV-Vis, and IR data compounds 1-9. ...................................9
3. The λmax and isobestic point for the trans and cis isomer for compounds 1-6 ..................26
4. HPLC data for compounds 1-6. The starting solution was mostly the trans
isomer, but after 600 seconds of 365 nm light irradiation the cis isomer was the
major isomer for compounds 1-5. ......................................................................................28
5. The percent of cis to trans isomers after 600 seconds of 365 nm irradiation, and
after 600 seconds of 254 nm irradiation ............................................................................31
6. The percentage of dimer formation for compounds 1, 3, 4, 5, 6, and 7 after 24, 48,
and 72 hours of irradiation. ................................................................................................46
7. The percentage of dimer formation for compounds 3, 7, 8, and 9 were analyzed by
NMR spectroscopy after 24, 48, and 72 hours of irradiation .............................................49
8. The percentage of dimerization in the neutral and acidified form of compounds
1,3,4, and 5 after 24 hours of irradiation............................................................................51

vi
LIST OF FIGURES
Figure Page
1. Basic structure of styryl quinoline and L-660,711…………………………………….......1
2. Photoisomerization of styryl quinoline ................................................................................2
3. Cis-trans isomerization of retinal in the vision process ......................................................3
4. Structure of the dimer of 2-(4’-chlorostyryl)quinoline (3).. ................................................4
5. Photo-induced dimerization of two monomer compounds ..................................................5
6. Chemical equation for the synthesis of 2-(4’-methylstyryl)quinoline (4) ...........................7
7. The 1H-NMR concentration dependence of 3 in CDCl3 0.0043 M, 0.051 M, and
0.23 M are labeled low conc., medium conc., and high conc., respectively ......................10
8. COSY of compound 3 shows 3-bond proton coupling and helps in distinguishing
signals with overlap. Some correlations have been left out for clarity. ............................11
9. HMQC shows direct correlation between proton and carbon signals. Some proton
carbon correlations have been omitted for clarity ..............................................................13
10. 13
C-NMR spectrum of compound 3, with all previously identified signals ......................14
11. HMBC spectrum that shows the correlation between proton 3, and the carbon
signal for 9. ........................................................................................................................15
12. A) 1H-NMR spectrum of 3 with all signals identified. B)
13C-NMR spectrum of
3 with all signals identified. ...............................................................................................16
13. UV-Vis spectra of compounds 4, 5, and 6. Compound 6 has a λmax at a longer
wavelength due to its increased conjugation .....................................................................17
14. The cis isomer has a smaller coupling constant due to less overlap between sp2
hybrid orbitals. The trans isomer has a larger coupling constant because the
orbitals are parallel and interact more intensely. ...............................................................19
15. A) The alkene protons have a coupling constant of 16.40 Hz for the trans isomer
of compound 4. B) The alkene protons have a coupling constant of 12.37 Hz for
the cis isomer of compound 4 ............................................................................................20
16. The UV-Vis spectra for the cis and trans isomers of compound 3. The trans
isomer has a λmax at a longer wavelength than the cis isomer ............................................22

vii
17. The isobestic point for compound 3 is the point where all spectra overlap. It was
determined by irradiating at 365 nm over time and observing the changes in the
UV-Vis spectrum ...............................................................................................................24
18. The starting chromatogram is mostly the trans isomer of compound 3. After 10
seconds of irradiation there is a mixture of cis and trans isomers, and after 120
seconds of irradiation the cis isomer is the major isomer ..................................................25
19. The percentage of trans to cis isomers vs. time as a solution of compound 3 is
irradiated with 365 nm light ...............................................................................................27
20. A) UV-Vis spectra of cis and trans isomers for compound 3 (approximately 10-5
M) have different absorbances at 365 nm. B) UV-Vis spectra of cis and trans
isomers for compound 6 (approximately 10-5
M) have different absorbances at
365 nm ...............................................................................................................................30
21. The X-ray crystal structure of the dimer of compound 3 ...................................................32
22. Two olefin molecules must be situated in parallel planes relative to each other and
"a" must be less than 4.2 angstroms for the photodimerization reaction to occur.
If the molecules are perpendicular to each other, then the photodimerization
reaction will not occur.12
....................................................................................................33
23. A) Head-to-Head stacking results in a centrosymmetric dimer. B) Head-to-Tail
stacking results in a dimer with a plane of symmetry. C) Different regioisomers
that can form as a result of photodimerization, rctt stands for regio cis, trans,
trans ...................................................................................................................................34
24. The crystal structure of the trans isomer for compound 3. The distance between
the alkene carbons is 3.7 angstroms ...................................................................................36
25. 1H NMR spectrum (4.7 - 5.25 ppm) of the dimer of compound 7. The structure
shows the rctt isomer; Q represents the quinoline ring and B represents the
benzene ring .......................................................................................................................37
26. A) The COSY spectrum for the dimer of compound 7. Showing coupling of 8 to
7 and 4 to 3. B) An expanded COSY of compound 7. Showing the coupling of 8
to 7, 4 to 3, 5 to 6, and 12 to 13. The contours show proton 7 is a triplet ........................39
27. A) HMQC spectrum for the dimer of 3. Aids in identifying cyclobutane carbon
resonaces. B) Expanded HMQC showing proton to carbon correlation. Some
correlations omitted for clarity...........................................................................................40

viii
28. A) 1H NMR spectrum for the dimer of 3 with all signals identified. B)
13C NMR
spectrum for the dimer of 3 with all signals identified. The signal at 129.3 ppm is
broadened due to the overlap of carbon 7 and 8 ................................................................42
29. The chemical structure of stilbene, styryl quinoline, and styryl pyridine with their
respective dimmers ............................................................................................................44
30. A) The X-ray crystal structure of 2-(4'-methylstyryl)quinoline (4) shows
unfavorable stacking for photodimerization. B) The X-ray crystal structure of 2-
(4'-chlorostyryl)quinoline (3) shows favorable photodimerization conditions ..................47
31. Cl···H-C interactions have been reported to align molcules in the crystal structure
so that photodimerization is favorable. These interactions are the reason
compound 3 undergoes photodimerization in high yields .................................................48
32. (A) The 1H-NMR spectrum of compound 4 in methanol after 24 hours of
irradiation; no dimer present. (B) The 1H-NMR spectrum of compound 4
(acidified form using HCl in CDCl3); dimer is forming after 24 hours of
irradiation ...........................................................................................................................50
33. After the addition of acid, the monomer molecules have an induced head-to-tail
stacking. This is due to the positive formal charge on the nitrogen atom ........................52
34. A) The 1H-NMR spectrum for the neutral dimer of compound 3 with the
cyclobutane proton signal at a lower ppm. B) The 1H-NMR spectrum for the
protonated dimer of compound 3 with the cyclobutane proton signal at a higher
ppm ....................................................................................................................................53
35. A) The normalized UV-Vis spectrum for the dimer of compound 3. B) The
normalized UV-Vis spectrum for the trans isomer of compound 3 ..................................55

1
INTRODUCTION
Styryl quinoline derivatives (Figure 1) have important uses that range from medicinal
purposes to organic dyes. Parasitic diseases such as Leishmaniasis and Trypanosomiases have
had a devastating effect on many tropical and sub-tropical countries. Both of these parasitic
diseases can be fatal if left untreated. Many of the treatments that are used today are toxic, or
can become less effective over time due to resistances.1 Leukotrienes are naturally produced
eicosanoid lipid mediators, which could be the cause of a variety of effects associated with
asthma and allergies. L-660,711 is a styryl quinoline based selective competitive inhibitor of
leukotriene (Figure 1). It has been tested as a possible therapeutic agent for these diseases.2
Styryl quinolines have a similar structure as 2-alkylquinolines and 2-arylquinolines, both of
which have been shown to have pharmacological properties such as antiprotozoal activity.3 A
better understanding of the properties of styryl quinolines could lead to better treatments for
some of these diseases.
N
NCl
S
S
O
OH
O
NMe2
Styryl Quinoline
L-660,711
Figure 1. Basic structure of styryl quinoline and L-660,711

2
Alzheimer’s disease is a neurodegenerative disease of the brain. The disease mostly
occurs in elderly people. With modern technology people are living much longer lives, and this
disease has become quite prevalent in today’s society. Observations of postmortem Alzheimer’s
disease brains show many plaques (containing β-amyloid mass) and neurofibrillary tangles. If it
were possible to see these amyloid plaques forming, a diagnosis could be given more quickly.
Styryl pyridines have been explored as possible imaging agents in patients with Alzheimer’s
disease.4 Styryl quinoline has a similar structure to styryl pyridine and might also have
applications as an imaging agent.
N
N
hv
trans cis
Figure 2. Photoisomerization of styryl quinoline.
Styryl quinolines undergo trans-cis isomerization under light irradiation (Figure 2). A
similar isomerization occurs in the human eye allowing us to see. Vision is a light-induced cis-
trans isomerization of an alkene moiety in a protein-bound retinal molecule (Figure 3). From
this simple change, a signal will ultimately be transmitted to the brain.5,6

3
OH
H3C CH3
H3C CH3
O
H
hv
Figure 3. Cis-trans isomerization of retinal in the vision process.
A molecular switch is a molecule that can be interconverted reversibly between two
forms. This change is induced by an external stimulus, which can be chemical, electrochemical,
or photochemical. The molecule must be stable in both forms and not switch back unless
another external stimulus is applied.5 The isomerization of styryl quinoline using light as a
photochemical external stimulus could be a molecular switch. Molecular switches can then be
used to make molecular motors, from these it could be possible to control mechanical movement
at the molecular level.5
Dimerization occurs when two olefin molecules cyclize to form a cyclobutane ring. This
type of reaction is commonly called a [2+2] dimerization. 2-(4’-chlorostyryl)quinoline was
synthesized during an undergraduate research project, and was found to have dimerized by x-ray
crystallography (Figure 4). The structure of the monomer was initially proven by NMR
spectroscopy. However, when the crystal structure was obtained using X-ray crystallography it
was the dimer instead of the monomer. The dimerization was unintentional but it is believed that
it was photo-induced, because the compound was not heated or subjected to any reactive
chemicals. One focus of this research will be to understand what factors induce the [2+2]
photodimerization of different styryl quinoline derivatives.

4
N
N
Cl
Cl
Figure 4. Structure of the dimer of 2-(4’-chlorostyryl)quinoline (3).
Very little is understood about the photodimerization reaction, even though it was
discovered at the beginning of the century. 7 The invention of X-ray crystallography has
stimulated a lot of new research in this area over recent years. Some of the criteria for the
reaction to occur has been explored by Schmidt et al.8 His work involved studying the
photochemistry of trans cinnamic acids. He found that the alkene portion of the two molecules

5
must be less than 4.2 angstroms apart for the dimerization to occur.8 This and other factors will
be explored and hopefully lead to a more complete understanding of the photodimerization of
styryl quinolines.
Dimerization could be used as a molecular switch if it is possible to break the C-C bond
in the cyclobutane ring. It is reported that a styryl pyrazine compound will dimerize under
irradiation of > 300 nm light and return to the monomer form when irradiated at 254 nm light.9
The same conditions were applied to a stilbene dimer but it did not undergo the reverse reaction.
We will explore the reverse reaction for the styryl quinoline dimer to see if it will return to the
monomer.
The synthesis of many styryl quinoline compounds is performed without solvent, with
acetic acid and water as by-products (Figure 5). This categorizes the reaction as a “green”
synthesis. The photodimerization of styryl quinoline would also be a “green” C-C bond
formation reaction, with no bi-products being produced.
N
Cl
N
Cl
N
N
Cl
Cl
hv
Figure 5. Photo-induced dimerization of two monomer compounds.
6
It is important to understand the physical properties of styryl quinoline to better
understand the processes described above. We will synthesize a number of styryl quinolines
varying by electron withdrawing and electron donating groups on the styryl benzene ring and/or
the quinoline ring. We will then characterize the products through UV-Vis, NMR, and IR
spectroscopy. The reversible trans-cis photo-induced isomerization of styryl quinoline will be
explored as a possible molecular switch, and the [2+2] photodimerization reaction will be
explored as a “green” C-C bond formation reaction and possible molecular switch.
7
RESULTS AND DISCUSSION
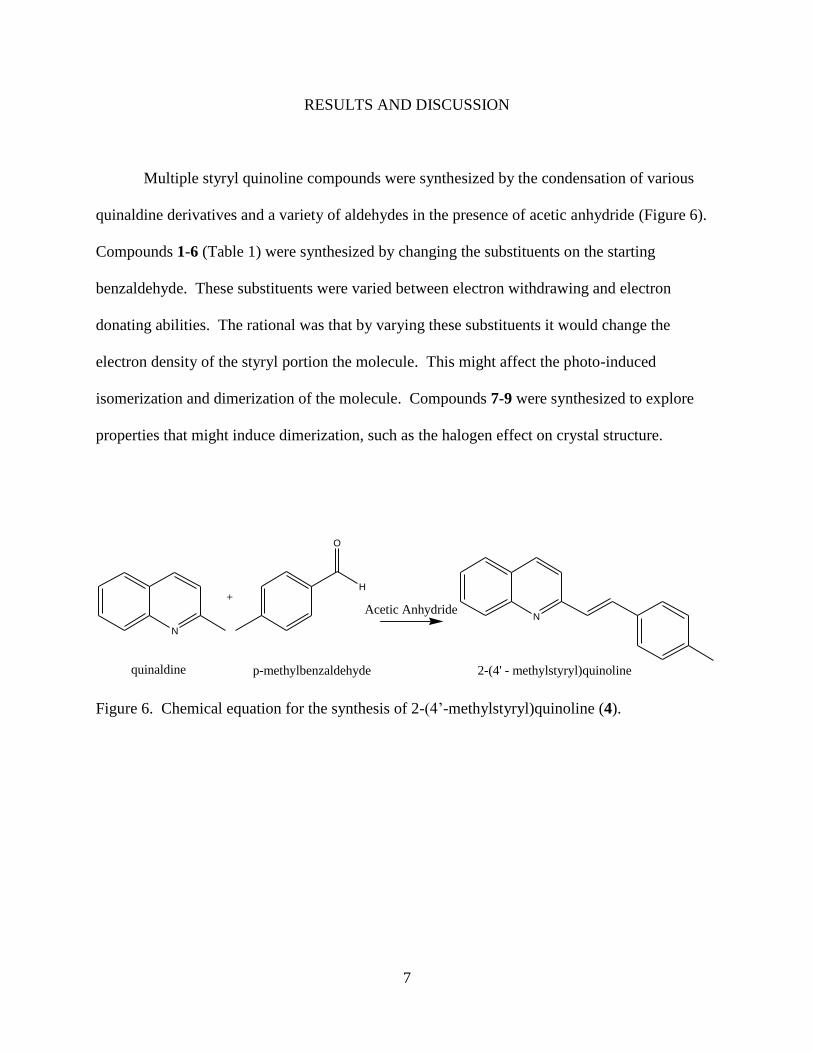
Multiple styryl quinoline compounds were synthesized by the condensation of various
quinaldine derivatives and a variety of aldehydes in the presence of acetic anhydride (Figure 6).
Compounds 1-6 (Table 1) were synthesized by changing the substituents on the starting
benzaldehyde. These substituents were varied between electron withdrawing and electron
donating abilities. The rational was that by varying these substituents it would change the
electron density of the styryl portion the molecule. This might affect the photo-induced
isomerization and dimerization of the molecule. Compounds 7-9 were synthesized to explore
properties that might induce dimerization, such as the halogen effect on crystal structure.
N
N
O
H+
Acetic Anhydride
quinaldine p-methylbenzaldehyde 2-(4' - methylstyryl)quinoline
Figure 6. Chemical equation for the synthesis of 2-(4’-methylstyryl)quinoline (4).

8
N
R1
R3
R2
Entry Compound Name R1 R2 R3
1 2-styryl quinoline H H H
2 2-(4'-nitrostyryl)quinoline NO2 H H
3 2-(4'chlorostyryl)quinoline Cl H H
4 2-(4'-methylstyryl)quinoline CH3 H H
5 2-(4'-methoxystyryl)quinoline OCH3 H H
6 2-(4'-dimethylaminestyryl)quinoline N(CH3)2 H H
7 2-(4'-bromostyryl)quinoline Br H H
8 2-(4’-chlorostyryl)6-methylquinoline Cl CH3 H
9 2-(3'-chlorostyryl)quinoline H H Cl
Table 1. Name and substituents of all compounds synthesized
Quinaldine, acetic anhydride, and the substituted benzaldehyde were mixed in a conical
vial under an argon atmosphere. The reaction was heated to approximately 120°C and then
monitored by TLC. When the reaction was complete, the product was dissolved in ethyl acetate
and washed with saturated sodium bicarbonate. After drying and concentrating, the product was
purified by column chromatography if needed. The product was further purified by
crystallization. NMR, UV-Vis, IR, and melting point data was then collected for all compounds
(Table 2 and Appendix A).
9
N
R1
R3
R2
Compound
%
Yield
Melting
Point (°C)
UV-Vis ε
(M-1
cm-1
)
UV-Vis
λmax (nm) IR Frequency (cm-1
)
1 (R1 = H, R2 = H,
R3 = H) 53 97-101 24500 338
966.58, 1503.73,
1595.19
2(R1 = NO2, R2 =
H, R3 = H) 42 162-165 31300 353
964.47, 1339,
1517.34, 1595.47
3(R1 = Cl, R2 = H,
R3 = H) 75 118-126 28200 339
968.60, 1503.84,
1590.96
4(R1 = CH3, R2 =
H, R3 = H) 71 135-138 24400 339
981.85, 1511.94,
1591.97
5(R1 = OCH3, R2 =
H, R3 = H) 68 120-123 32600 347
972.19, 1512.02,
1597.52
6(R1 = N(CH3)2,
R2 = H, R3 = H) 36 173-178 22400 393
966.49, 1525.17,
1595.56
7(R1 = Br, R2 = H,
R3 = H) 63 138-142 37200 339 968.43, 1592.64
8(R1 = Cl, R2 = H,
R3 = CH3) 25 198-203 30100 338
967.70, 1494.50,
1592.74
9(R1 = H, R2 = Cl,
R3 = H) 75 90-95 23800 338
962.80, 1504.10,
1560.87, 1593.23
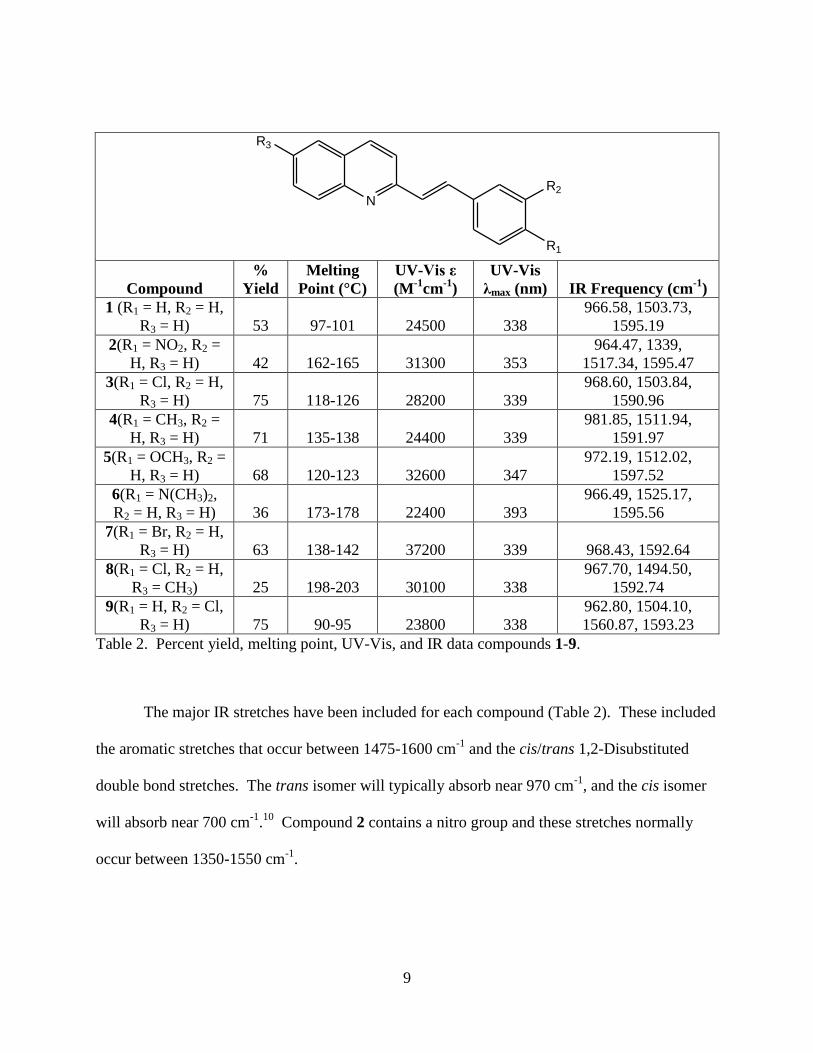
Table 2. Percent yield, melting point, UV-Vis, and IR data compounds 1-9.
The major IR stretches have been included for each compound (Table 2). These included
the aromatic stretches that occur between 1475-1600 cm-1
and the cis/trans 1,2-Disubstituted
double bond stretches. The trans isomer will typically absorb near 970 cm-1
, and the cis isomer
will absorb near 700 cm-1
.10
Compound 2 contains a nitro group and these stretches normally
occur between 1350-1550 cm-1
.
10
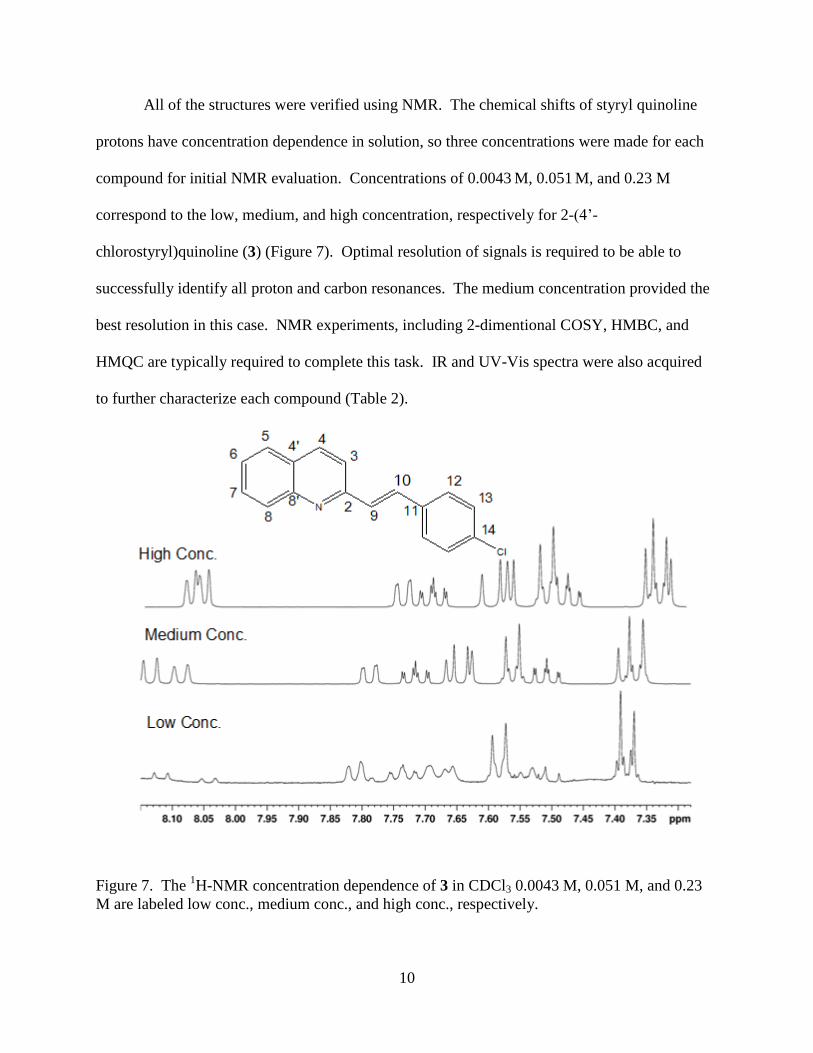
All of the structures were verified using NMR. The chemical shifts of styryl quinoline
protons have concentration dependence in solution, so three concentrations were made for each
compound for initial NMR evaluation. Concentrations of 0.0043 M, 0.051
M, and 0.23 M
correspond to the low, medium, and high concentration, respectively for 2-(4’-
chlorostyryl)quinoline (3) (Figure 7). Optimal resolution of signals is required to be able to
successfully identify all proton and carbon resonances. The medium concentration provided the
best resolution in this case. NMR experiments, including 2-dimentional COSY, HMBC, and
HMQC are typically required to complete this task. IR and UV-Vis spectra were also acquired
to further characterize each compound (Table 2).
Figure 7. The 1H-NMR concentration dependence of 3 in CDCl3 0.0043 M, 0.051 M, and 0.23
M are labeled low conc., medium conc., and high conc., respectively.

11
The protons 8 or 4 on the quinoline ring typically correspond to the signals that are at the
highest ppm for styryl quinoline compounds. The COSY experiment is an excellent way to
distinguish between these two. Proton 4 will couple most strongly with proton 3, which is a
doublet. Proton 8 will couple most strongly with proton 7, which is a triplet. Proton 5 is
normally at a lower ppm and it couples to the other triplet, proton 6 (Figure 8).
Figure 8. COSY of compound 3 shows 3-bond proton coupling and helps in distinguishing
signals with overlap. Some correlations have been left out for clarity.
12
The proton spectrum aids in identifying the remaining signals, by observing the
integration and coupling constants. The protons on the benzene ring (12 and 13) will each
integrate for 2H, but the alkene protons (9 and 10) only integrate for one each. Protons 9 and 10
can also be identified by their large trans coupling as seen in the COSY, but 9 cannot yet be
distinguished from 10. The COSY shows the overlap of two signals (9/10 and 3) at 7.65 ppm,
and two other signals (9/10 and 12/13) at 7.36 ppm. The contours in the COSY help distinguish
between the overlapping signals.
Some of the carbon resonances can now be identified using an HMQC proton carbon
correlation experiment. The HMQC shows direct correlation between a proton signal and the
carbon that it is bonded with (Figure 9). After identifying the carbon resonances from the
HMQC, the signals can be idenified on the 13
C NMR spectrum (Figure 10). Protons 12 and 13
are not equivalent, nor are protons 9 and 10, so it is necessary to obtain an HMBC, a proton
carbon long range correlation experiment, to identify them.

13
Figure 9. HMQC shows direct correlation between proton and carbon signals. Some proton
carbon correlations have been omitted for clarity.

14
Figure 10. 13
C-NMR spectrum of compound 3, with all previously identified signals.
The HMBC experiment shows 2 and primarily 3-bond proton to carbon correlations, and
will allow for identification of the remaining unknown resonances. Proton 3 will correlate to the
13C resonance of 9, this will distinguish which carbon signal is 9 and which is 10 (Figure 11).
The HMQC experiment can then be used to identify the proton signal of 9. This allows protons
9 and 10 to be distinguished.
15
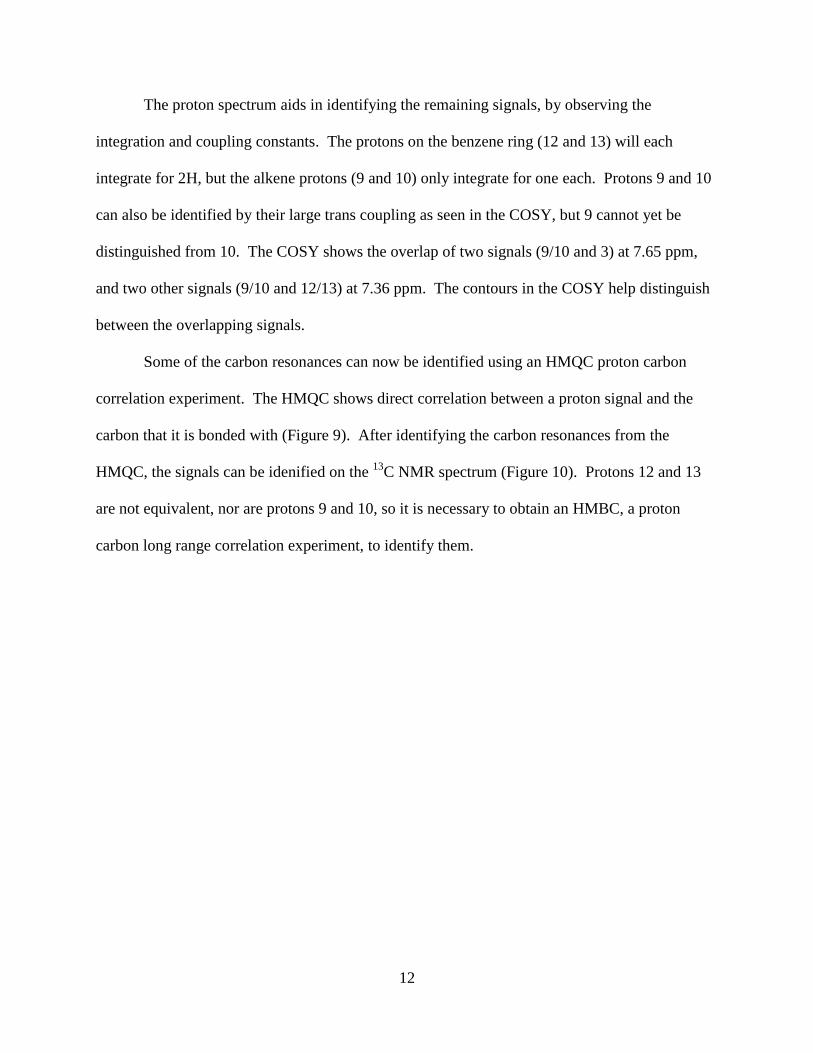
Figure 11. HMBC spectrum that shows the correlation between proton 3, and the carbon signal
for 9.
With proton 9 and 10 identified, it is possible to use the HMBC to see the correlation of
proton 10 and the C13
resonance of 12. This will distinguish between protons 12 and 13. When
all of the proton resonances have been identified it is possible to determine all carbon resonances
using a HMBC. This is accomplished by the same process used for identifying protons 9,10,12,
and 13. A resonance must be selectively choosen so that it only correlates with one of the
unknown signals. It is now possible to idenify all proton and carbon signals for compound 3
(Figure 12). This process was used in proving the structure of all the compounds that were
synthesized. All proton and carbon NMR signals are assigned in Appendix A.

16
Figure 12. A) 1H-NMR spectrum of 3 with all signals identified. B)
13C-NMR spectrum of 3
with all signals identified.
17
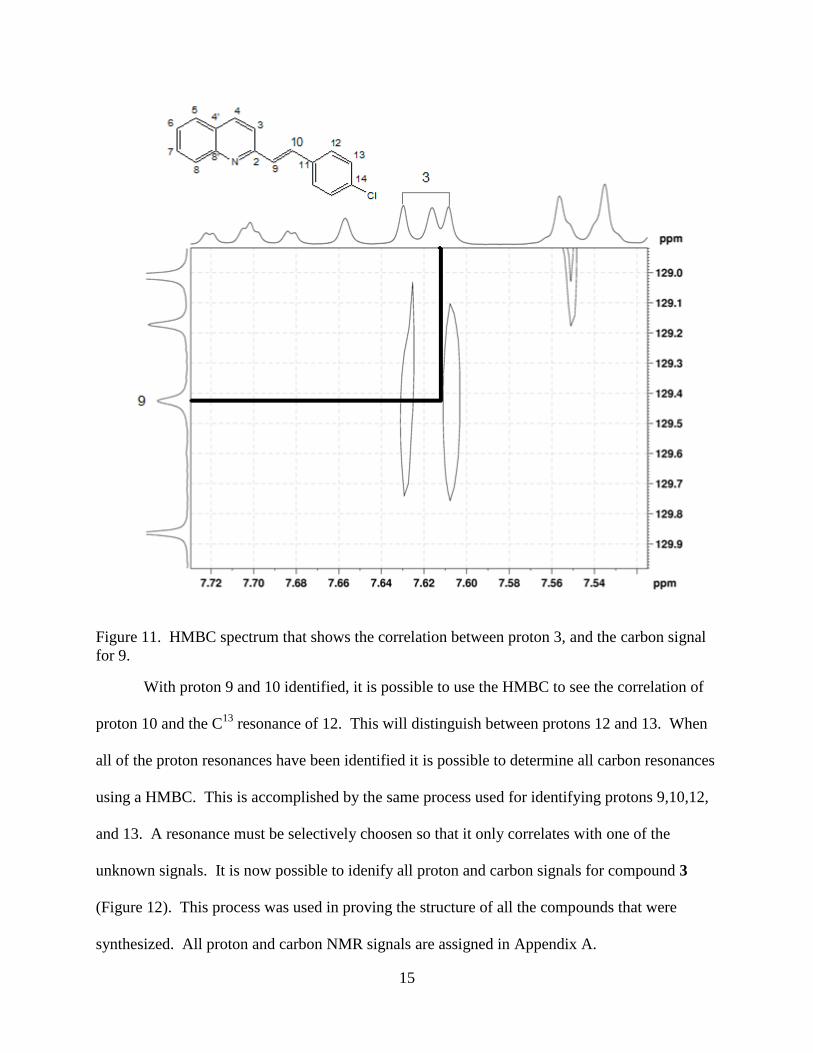
It should be noted that styryl quinolines are highly conjugated compounds. As a
consequence of their conjugation they have very interesting photochemistry. By varying the
substituents on the molecule, it is possible to change the λmax in the ultraviolet spectrum of the
compound. As the conjugation of the molecule increases, the λmax undergoes a bathochromic
shift. By comparing the UV-Vis spectra of compounds 4, 5, and 6, this shift resulting from more
electron donating substituents is obvious (Table 2). The amine causes a red shift of about 50 nm
compared to the methyl substituent. The more strongly the substituent can donate electrons,
correlates to an increase in the electron density of the conjugated system.11
Thus, the amine has
a λmax at a longer wavelength (Figure 13).
Figure 13. UV-Vis spectra of compounds 4, 5, and 6. Compound 6 has a λmax at a longer
wavelength due to its increased conjugation.
18
PHOTOISOMERIZATION
The first step in the photoisomerization of styryl quinoline occurs when light is absorbed
by the molecule. This excites an electron from the π bonding orbital to the π* anti-bonding
orbital. This allows free rotation around the former alkene bond. Alkenes are rigid before
excitation because the carbon atoms are sp2 hybridized. The excited molecule then adopts a
perpendicular conformation that has a dihedral angle of 90°. This conformer can go to the trans
isomer or the cis isomer, which have dihedral angles of 180° and 0° respectively.10
The excited
electron will relax into the π bonding orbital and restore the alkene.
The synthetic styryl quinolines were all isolated as their trans isomers, as proven by
NMR or x-ray crystallography. NMR provided a fast and efficient way of proving the
stereochemistry of the compound, because the coupling constant, J, of the two alkene protons in
the molecule is different for the trans and cis isomers. J is typically between 11-18 Hz for the
trans isomer, and normally between 6-15 Hz for the cis isomer.10
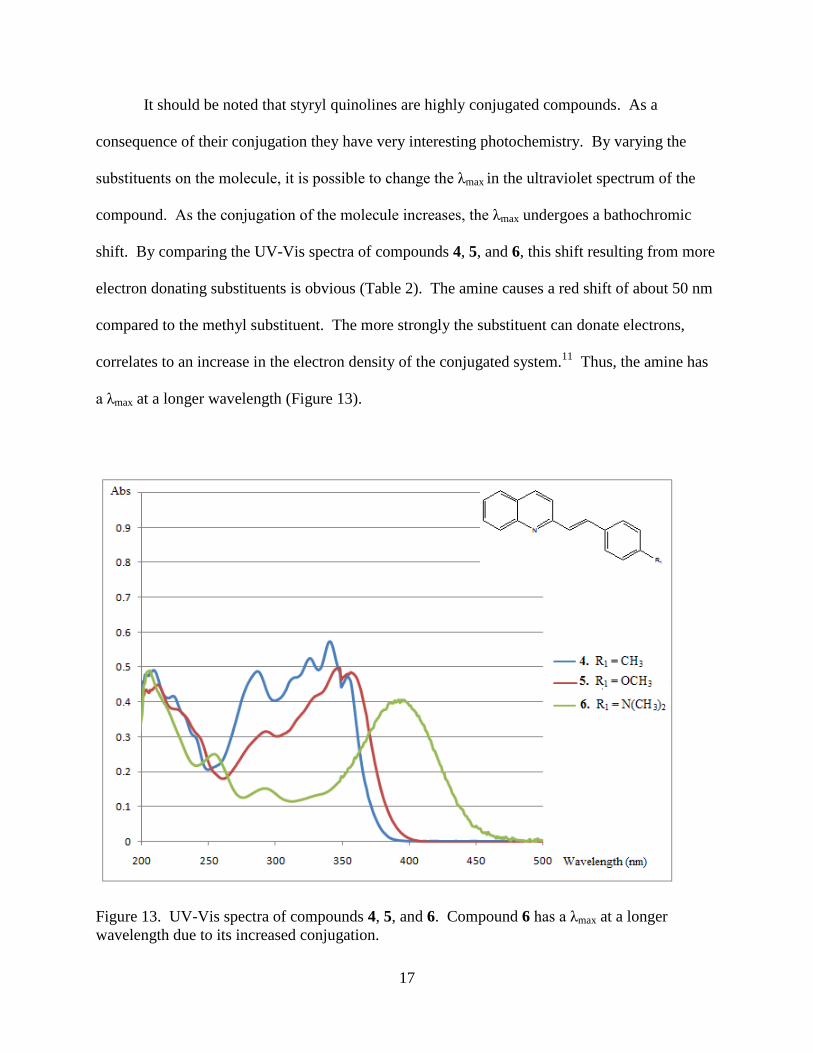
The larger coupling constant for the trans isomer can be explained by the different extent
of overlapping C-H orbitals compared to the cis isomer. When C-H orbitals have maximum
overlap, they are able to transfer spin information from one C-H bond to another. The trans
isomer has C-H orbitals parallel to each other (Figure 14). The cis isomer has less overlap
between these C-H bonds therefore it will have a smaller coupling constant relative to the trans
isomer.

19
Cis Trans
Figure 14. The cis isomer has a smaller coupling constant due to less overlap between sp2 hybrid
orbitals. The trans isomer has a larger coupling constant because the orbitals are parallel and
interact more intensely.

20
Figure 15. A) The alkene protons have a coupling constant of 16.40 Hz for the trans isomer of
compound 4. B) The alkene protons have a coupling constant of 12.37 Hz for the cis isomer of
compound 4.

21
The alkene protons 9 and 10, at 7.35 and 7.62 ppm respectively for the trans isomer have
a coupling constant of 16.40 Hz. The cis isomer spectrum shows an upfield shift of protons 9
and 10, to 6.84 and 6.96 ppm, respectively. The cis alkene protons have a coupling constant of
12.37 Hz. The difference between the coupling constants of the two spectra show a clear and
definite way to differentiate between the two isomers (Figure 15).
To produce the cis isomer of 2-(4’-methylstyryl)quinoline (4), a methanol solution of 4
(0.100 g in 15 mL) was transferred to a quartz tube and irradiated with 365 nm light. After 3
hours of irradiation the cis isomer could be observed by TLC. The solution was concentrated
under vacuum, and the isomers were separated using Flash Column Chomatography.
Approximately 40% of the cis isomer had been converted and separated from the trans isomer.
After obtaining the cis isomer, we thought it would be interesting to see if it is possible to
convert the cis isomer back to the trans isomer by irradiation. This would create a molecular
switch completely controlled by the wavelength of light. The majority of the trans isomers
studied had a λmax at approximately 340 nm, but the λmax of the cis isomer is much lower for all
compounds (Figure 16 and Table 3).

22
Figure 16. The UV-Vis spectra for the cis and trans isomers of compound 3. The trans isomer
has a λmax at a longer wavelength than the cis isomer.
The λmax of the trans isomer was relatively close to the TLC lamp’s irradiation
wavelength that initially induced the isomerization. It seemed reasonable to irradiate light close
to the λmax of the cis isomer to convert it back to the trans isomer. A solution of the cis isomer
was made, and irradiated with 254 nm light from a TLC lamp. The isomerization was followed
by observing the change in the UV-Vis spectrum. The preliminary data collected this way was
not very reliable. The peak at 338 nm did rise after the solution was irradiated, indicating an
increase in concentration of the trans isomer. However, it was impossible to tell if the solution
had isomerized completely to the trans isomer. It was decided that a more quantitative method
was necessary to follow the photoisomerization.
23
High pressure liquid chromatography (HPLC) with a diode array detector would make it
possible to obtain a percent ratio of cis to trans isomers. This is accomplished by simply
comparing the peak areas on the HPLC chromatogram after irradiation. However, a problem
arises when deciding which wavelength to observe with the diode array detector. If the
wavelength observed is too close to the trans λmax, and consequently to far from the cis λmax, the
trans isomer will absorb more strongly. This will make the trans isomer appear to be at greater
concentration than it actually is. The converse is also true if the wavelength observed is too
close to the cis λmax. To solve this problem the isobestic point needed to be determined. The
isobestic point is the wavelength at which both isomers absorb light equally. To observe the
photoisomerization without a bias, this point had to be determined.
The isobestic point was determined for all compounds studied by the following method.
A UV-Vis spectrum of the starting trans solution was taken. The solution was irradiated with
365 nm light for 10 seconds and another spectrum was taken. This was repeated after 20, 30, 45,
60, 120, and 600 seconds. After 600 seconds of irradiation the solution’s UV-Vis spectrum was
stable. The isobestic point is the point where all spectra overlap. This is the point where both
the trans and the cis isomer absorb light equally, which was at 263 nm for compound 3 (Figure
17).

24
Figure 17. The isobestic point for compound 3 is the point where all spectra overlap. It was
determined by irradiating at 365 nm over time and observing the changes in the UV-Vis
spectrum.
The diode array detector was set at the isobestic point for all isomerization studies (Table
3). The initial HPLC analysis showed that there was mostly one peak, this indicated the major
starting trans isomer. It is possible to get a UV-Vis spectrum from the diode array detector, and
this can be used to identify which isomer is being detected. After 10 seconds of irradiation, the
larger starting peak had decreased in peak area. A new peak began to increase in size at a shorter
retention time. This new peak was the cis isomer forming, and after approximately 60 seconds
of light irradiation the cis isomer is the major isomer (Figure 18).

25
Figure 18. The starting chromatogram is mostly the trans isomer of compound 3. After 10
seconds of irradiation there is a mixture of cis and trans isomers, and after 120 seconds of
irradiation the cis isomer is the major isomer.
26
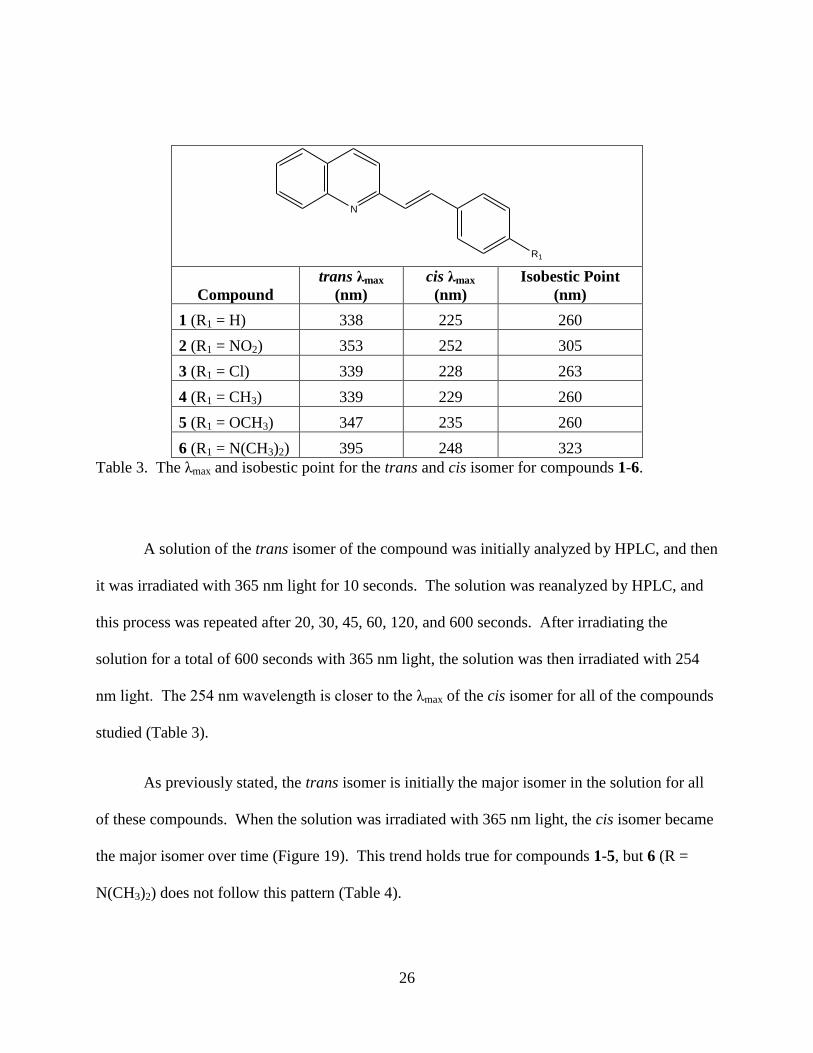
N
R1
Compound
trans λmax
(nm)
cis λmax
(nm)
Isobestic Point
(nm)
1 (R1 = H) 338 225 260
2 (R1 = NO2) 353 252 305
3 (R1 = Cl) 339 228 263
4 (R1 = CH3) 339 229 260
5 (R1 = OCH3) 347 235 260
6 (R1 = N(CH3)2) 395 248 323
Table 3. The λmax and isobestic point for the trans and cis isomer for compounds 1-6.
A solution of the trans isomer of the compound was initially analyzed by HPLC, and then
it was irradiated with 365 nm light for 10 seconds. The solution was reanalyzed by HPLC, and
this process was repeated after 20, 30, 45, 60, 120, and 600 seconds. After irradiating the
solution for a total of 600 seconds with 365 nm light, the solution was then irradiated with 254
nm light. The 254 nm wavelength is closer to the λmax of the cis isomer for all of the compounds
studied (Table 3).
As previously stated, the trans isomer is initially the major isomer in the solution for all
of these compounds. When the solution was irradiated with 365 nm light, the cis isomer became
the major isomer over time (Figure 19). This trend holds true for compounds 1-5, but 6 (R =
N(CH3)2) does not follow this pattern (Table 4).

27
Figure 19. The percentage of trans to cis isomers vs. time as a solution of compound 3 is
irradiated with 365 nm light.

28
N
R1
Compound
Irradiation
Length
(seconds)
%
trans
%
cis
Compound
Irradiation
Length
(seconds)
%
trans
%
cis
1
(R1 = H) 0 95 5
4
(R1 = CH3) 0 87 13
10 74 26
10 37 63
20 59 41
20 17 83
30 47 53
30 11 89
45 35 65
45 9 91
60 24 76
60 8 92
120 9 91
120 8 92
600 9 91
600 8 92
2
(R1 = NO2) 0 95 5
5
(R1 =
OCH3) 0 77 23
10 28 72
10 14 86
20 20 80
20 13 87
30 17 83
30 13 87
45 18 82
45 15 85
60 17 83
60 13 87
120 15 85
120 13 87
600 15 85
600 13 87
3
(R1 = Cl) 0 93 7
6
(R1 =
N(CH3)2) 0 75 25
10 59 41
10 80 20
20 35 65
20 80 20
30 23 77
30 81 19
45 15 85
45 81 19
60 11 89
60 80 20
120 9 91
120 80 20
600 9 91 600 78 22
Table 4. HPLC data for compounds 1-6. The starting solution was mostly the trans isomer, but
after 600 seconds of 365 nm light irradiation the cis isomer was the major isomer for compounds
1-5.
29
To understand why the photoisomerization of the compound 6 was different than the
others, the UV-Vis spectra of the trans and cis isomers of 6 must be compared to another
compound’s spectra. The UV-Vis spectra of 2-(4’-chlorostyryl)quinoline (3) shows a significant
difference in absorbance between the cis and trans isomer at 365 nm (Figure 20). The trans
isomer absorbs more strongly at this wavelength. Consequently, more of the trans isomer will
be excited when light of this wavelength is irradiated on the sample. This means there is a much
larger chance that the trans to cis photoisomerization will occur, relative to the cis to trans
photoisomerization.
The UV-Vis spectra of 2-(4’-dimethylaminestyryl)quinoline (6) is quite different from
UV-Vis spectra of compound 3. The difference between the spectra of the trans and cis isomers
at 365 nm is significantly less than what it was for compound 3 (Figure 20). This explains why
compound 6 does not undergo photoisomerization when the sample is irradiated with 365 nm
light.

30
Figure 20. A) UV-Vis spectra of cis and trans isomers for compound 3 (approximately 10-5
M)
have different absorbances at 365 nm. B) UV-Vis spectra of cis and trans isomers for
compound 6 (approximately 10-5
M) have different absorbances at 365 nm.
31
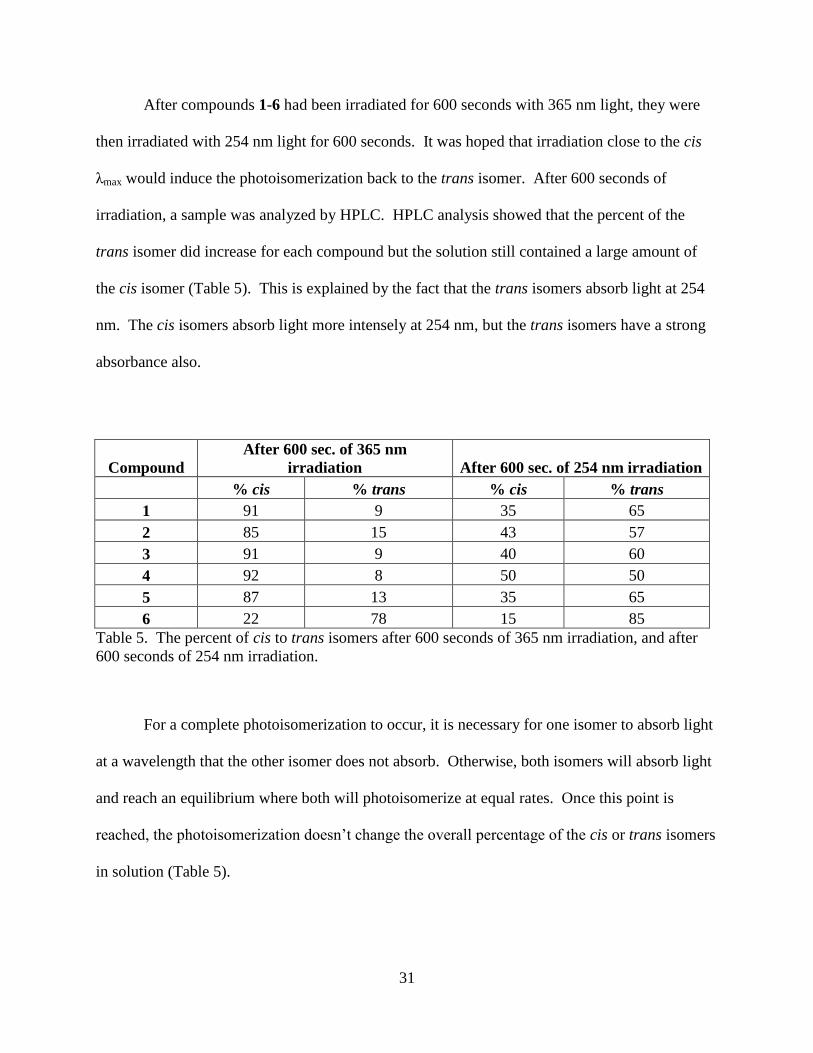
After compounds 1-6 had been irradiated for 600 seconds with 365 nm light, they were
then irradiated with 254 nm light for 600 seconds. It was hoped that irradiation close to the cis
λmax would induce the photoisomerization back to the trans isomer. After 600 seconds of
irradiation, a sample was analyzed by HPLC. HPLC analysis showed that the percent of the
trans isomer did increase for each compound but the solution still contained a large amount of
the cis isomer (Table 5). This is explained by the fact that the trans isomers absorb light at 254
nm. The cis isomers absorb light more intensely at 254 nm, but the trans isomers have a strong
absorbance also.
Compound
After 600 sec. of 365 nm
irradiation After 600 sec. of 254 nm irradiation
% cis % trans % cis % trans
1 91 9 35 65
2 85 15 43 57
3 91 9 40 60
4 92 8 50 50
5 87 13 35 65
6 22 78 15 85
Table 5. The percent of cis to trans isomers after 600 seconds of 365 nm irradiation, and after
600 seconds of 254 nm irradiation.
For a complete photoisomerization to occur, it is necessary for one isomer to absorb light
at a wavelength that the other isomer does not absorb. Otherwise, both isomers will absorb light
and reach an equilibrium where both will photoisomerize at equal rates. Once this point is
reached, the photoisomerization doesn’t change the overall percentage of the cis or trans isomers
in solution (Table 5).

32
SOLID STATE PHOTODIMERIZATION
The dimer of compound 3 was discovered accidently by x-ray crystallography (Figure
21). The structure of the trans isomer was expected, but the dimer was observed. These styryl
quinolines had already shown very interesting photochemistry, so it seemed reasonable that the
dimerization was photo-induced. The [2+2] photodimerization reaction has been observed for
similar compounds in solution and in the solid state.12,13,14
Figure 21. The X-ray crystal structure of the dimer of compound 3.

33
The exact mechanism of the [2+2] photodimerization reaction is unknown, but some of
the factors that influence the reaction have been studied. Schmidt8 stated in his influential work
on trans-cinnamic acid crystals that “solid state reactions are topochemically controlled with a
minimum amount of atomic or molecular movement.” This implies that one of the most
important factors in whether or not the reaction will occur is how the molecules stack in the
crystal structure. The alkene portion of the two molecules should be situated in parallel planes
with one above the other, and they should be within 4.2 angstroms of each other. This allows the
pz orbitals of the two monomers to overlap sufficiently and react upon excitation with light. If
the monomers are stacked perpendicular to each other then the dimer will not form (Figure 22).12
Figure 22. Two olefin molecules must be situated in parallel planes relative to each other and
"a" must be less than 4.2 angstroms for the photodimerization reaction to occur. If the molecules
are perpendicular to each other, then the photodimerization reaction will not occur.12

34
It is obvious that if R and R1 were reversed on one of the monomer units, and the other
monomer retained its position, the resulting dimer product would be different (Figure 22). If the
monomers have a head-to-tail arrangement in the crystal structure, then the dimer product is
centrosymmetric.15
The monomers could also have a head-to-head arrangement, which results in
a dimer that has a plane of symmetry (Figure 23).
R R
R1 R1
R R1
R1 R
R1
R
R1
R
R1
R
R
R1
Head-to-Head
Head-to-tail
A.
B.
hv
hv
R
R
R1
R1
R
R1
R1
R
R
R R1
R1
R
R
R1
R1
rctt rtct rcct rccc
C.
Figure 23. A) Head-to-Head stacking results in a centrosymmetric dimer. B) Head-to-Tail
stacking results in a dimer with a plane of symmetry. C) Different regioisomers that can form as
a result of photodimerization, rctt stands for regio cis, trans, trans.

35
Four different regioisomers can be obtained from the [2+2] cycloaddition reaction. Until
now only the rctt isomer has been considered, but other derivatives include rtct, rcct, and rccc.
The acronym rctt stands for regio cis, trans, trans. An initial group is set as a reference, and
each of the other groups attached to the cyclobutane ring are referenced in a clockwise manner,
relative to the initial group (Figure 23).
There are many tools that can be used to study the [2+2]-photocycloaddition reaction.
These include x-ray diffraction, NMR spectroscopy, Raman, calorimetric measurements, atomic
force, and optical microscopy.15
The techniques used in this study included NMR spectroscopy
and X-ray diffraction.
When compound 3 was submitted for x-ray crystallographic structure analysis, it revealed
the rctt-dimer, instead of the expected monomer (Figure 21). The [2+2] photocycloaddition
reaction has been studied extensively for some compounds such as stilbenes and styryl
pyridines7,12,13
, but styryl quinolines have received very little attention. The X-ray crystal
structure of the dimer for compound 3 shows that either two trans monomers or two cis
monomers reacted across the alkene portion of the molecule (Figure 21). The crystal structure of
the monomer is required to prove which isomer reacted. The crystal structure of the monomer
shows that the trans isomer stacks in a head-to-tail fashion and the distance between the alkene
carbons is 3.7 angstroms (Figure 24).

36
Figure 24. The crystal structure of the trans isomer for compound 3. The distance between the
alkene carbons is 3.7 angstroms.
To study this reaction for a variety of styryl quinolines in the solid state, about 15 mg of
the compound of interest was dissolved in approximately 2 mL of solvent. The sample was
applied to a small petri dish and the solvent was allowed to evaporate leaving an even film of
crystalline sample on the bottom of the plate. Once dry, the dish was placed under an
incandescent light (60 watts) at a distance of 12 cm, similar to conditions that induced the [2+2]
photocycloaddition of styryl pyridine and benzothiazole.13,16
The reaction was followed using
NMR spectroscopy. Samples were analyzed by NMR after 24, 48, and 72 hours of irradiation.
NMR spectroscopy provides a relatively fast method of following the formation of the
dimer. As the dimer is formed, the monomer alkene proton resonances that were in the aromatic
region disappear as two new signals between 4.5 - 5.5 ppm gradually increase in size. These
signals are doublet of doublets and correspond to the cyclobutane protons (Figure 25).16
37
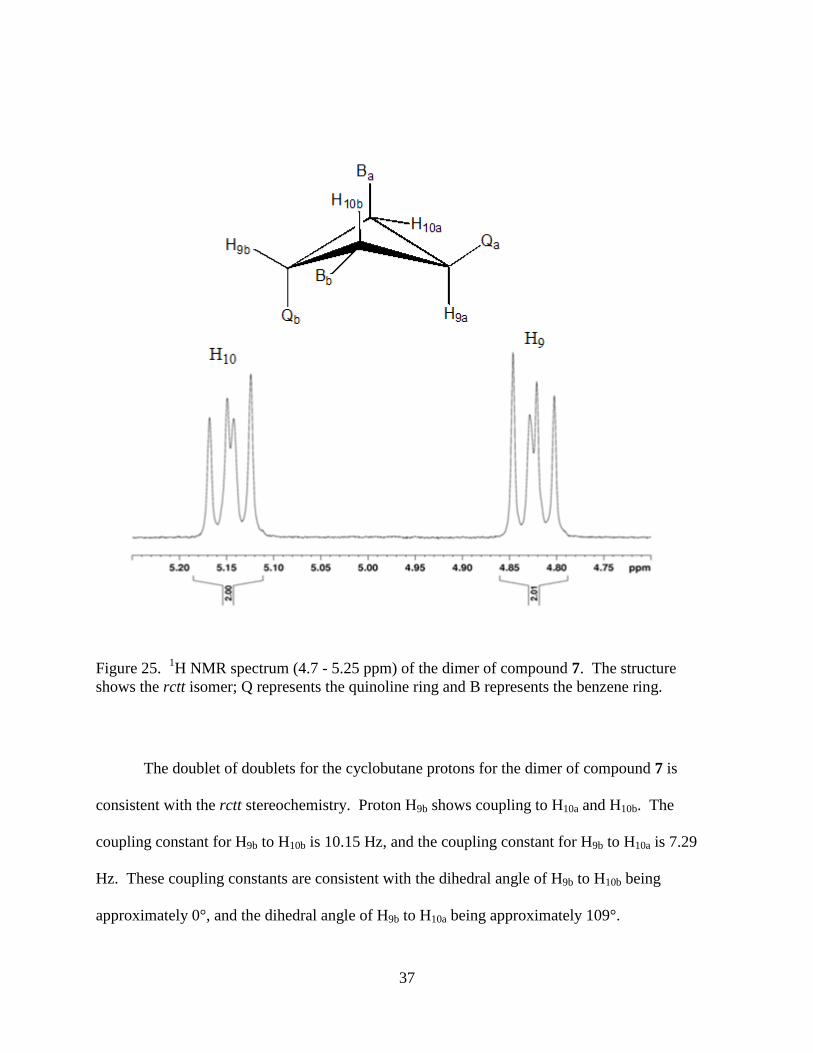
Figure 25. 1H NMR spectrum (4.7 - 5.25 ppm) of the dimer of compound 7. The structure
shows the rctt isomer; Q represents the quinoline ring and B represents the benzene ring.
The doublet of doublets for the cyclobutane protons for the dimer of compound 7 is
consistent with the rctt stereochemistry. Proton H9b shows coupling to H10a and H10b. The
coupling constant for H9b to H10b is 10.15 Hz, and the coupling constant for H9b to H10a is 7.29
Hz. These coupling constants are consistent with the dihedral angle of H9b to H10b being
approximately 0°, and the dihedral angle of H9b to H10a being approximately 109°.

38
The structure of the dimer for compound 3 was further confirmed and all 1H and
13C
resonances were assigned from NMR experiments such as COSY, HMQC, and HMBC. The
structure is centrosymmetric so the proton and carbon resonances for the two quinoline rings are
identical. The same is true for the substituted benzene rings. As mentioned before, protons 4
and 8 typically occur at the highest ppm for these compounds. The COSY aids in distinguishing
between these two signals. Proton 8 will couple with proton 7 which is a triplet, but proton 4
will couple with proton 3 which is a doublet. The COSY also shows the coupling between the
two cyclobutane signals at 4.8 and 5.2 ppm (Figure 26).
39
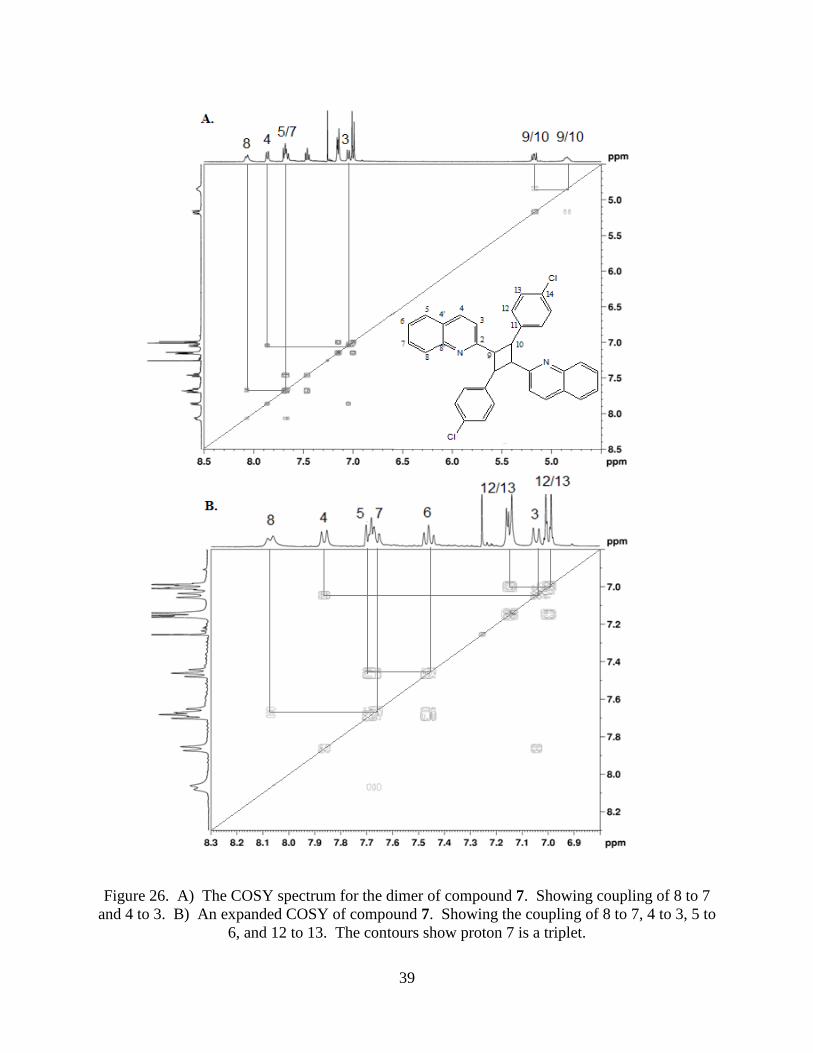
Figure 26. A) The COSY spectrum for the dimer of compound 7. Showing coupling of 8 to 7
and 4 to 3. B) An expanded COSY of compound 7. Showing the coupling of 8 to 7, 4 to 3, 5 to
6, and 12 to 13. The contours show proton 7 is a triplet.

40
Figure 27. A) HMQC spectrum for the dimer of 3. Aids in identifying cyclobutane carbon
resonaces. B) Expanded HMQC showing proton to carbon correlation. Some correlations
omitted for clarity.

41
Protons 5 and 7 overlap, but proton 7 should be a triplet and the COSY contours clearly
show this triplet signal (Figure 26). Protons 12 and 13 are not equivalent, so it is necessary to
obtain a HMBC. The HMBC will also aid in distinguishing between protons 9 and 10, but first it
is possible to identify some of the carbon signals using a HMQC (Figure 27). The carbon
resonance at 129.3 ppm is quite broad, because the signals for 7 and 8 overlap (Figure 28).
Proton 12 and 13 can be differentiated using the HMBC. Proton 12 correlates to carbon
10 by 3-bond coupling, but proton 13 shows no correlation to either of the cyclobutane carbon
resonances. Proton 13 does not correlate to those carbon resonances because the HMBC
experiment does not show 4 or 5 bond coupling. Using this information it is now possible to
identify proton and carbon resonances for 9, 10, 12, and 13.
Carbons 4’, 8’, 2, 11, and 14 do not have protons signals, so it is necessary to use a
HMBC to identify the carbon resonances. By selecting a signal that will only correlate to one of
the unknowns, it is possible to identify all of the unknown carbon signals. Figure 28 shows the
proton and carbon spectra with all of the signals identified (Appendix B).

42
Figure 28. A) 1H NMR spectrum for the dimer of 3 with all signals identified. B)
13C NMR
spectrum for the dimer of 3 with all signals identified. The signal at 129.3 ppm is broadened due
to the overlap of carbon 7 and 8.

43
The formation of the dimer was followed by simply comparing the integration of a dimer
peak to a monomer peak. The doublet of doublets were an excellent choice for the dimer. The
monomer peak had to be selected carefully, but typically one of the well resolved triplets (# 6 or
# 7) on the quinoline ring provided adequate data.
For the photodimerization study the compound was dissolved in approximately 2 mL of
solvent, and the sample was applied to a petri dish. When the solvent evaporated, the compound
formed a thin polycrystalline film. It seemed that the solvent of choice might be a variable in
how the molecules stack in the crystal structure. It has been reported that solvent molecules in
the film can give rise to a loose shell around the dimer pair, which could reduce the strain of the
atoms throughout the course of the photodimerization reaction.13
To further study the effect of
solvent on photodimerization chloroform, acetonitrile, and methanol were used because of
varying polarities and H-bonding properties.
It was believed that the photodimerization would be more favorable in the H-bonding
solvent compared to a solvent incapable of H-bonding such as acetonitrile. Methanol has been
shown to promote the dimerization in solution for stilbenes.17
When an electron-donating group
is attached to a stilbene molecule the percent of dimerization also increases dramatically.7
Conversely, when an electron-donating group is attached to a styryl pyridine molecule the
percent of dimerization is decreased.18
The structure of stilbene, styryl quinoline, and styryl
pyridine are similar, so it was of interest to see how varying the solvent would affect the
dimerization of various styryl quinolines (Figure 29).

44
N
Stilbene
Styryl Quinoline
N
Styryl pyridine
N
N
N
N
2
2
2
Figure 29. The chemical structure of stilbene, styryl quinoline, and styryl pyridine with their
respective dimers.
45
The extent of dimerization appears to be slightly solvent dependent (Table 6). When
acetonitrile is the solvent, only the halogenated compounds (3 and 7) dimerized. However, these
compounds dimerized in high yields with all solvents. Compounds 1 and 5 dimerize faster and
to a greater extent when chloroform is used rather than acetonitrile or methanol. It is unclear at
this point how chloroform allows the molecules to stack differently in the crystal structure, but it
does appear that chloroform helps induce the photodimerization.
Unfortunately, compound 2, the nitro derivative, was quite insoluble in acetonitrile,
chloroform, and methanol. This made it impossible to study the photodimerization of 2.
Compound 4 and 6 did not dimerize under any conditions, and the crystal structure aids in
understanding why (Figure 30).

46
N
R1
Compound 1 (R1 = H) Compound 5 (R1 = OCH3)
Acetonitrile Chloroform MeOH
Acetonitrile Chloroform MeOH
Starting 0 0 0
Starting 0 0 0
24 hr 1 1 4
24 hr 1 1 1
48 hr 5 13 11
48 hr 1 48 1
72 hr 37.5 89 58
72 hr 1 93 8
Compound 3 (R1 = Cl)
Compound 6 (R1 = N(CH3)2)
Acetonitrile Chloroform MeOH
Acetonitrile Chloroform MeOH
Starting 0 0 0
Starting 0 0 0
24 hr 63 78 94
24 hr 0 0 0
48 hr 100 100 100
48 hr 0 0 0
72 hr 100 100 100
72 hr 0 0 0
Compound 4 (R1 = CH3)
Compound 7 (R1 =Br)
Acetonitrile Chloroform MeOH
Acetonitrile Chloroform MeOH
Starting 0 0 0
Starting 0 0 0
24 hr 0 0 0
24 hr 17 45 17
48 hr 1 1 0
48 hr 91 83 94
72 hr 5 1 0 72 hr 96 93 95
Table 6. The percentage of dimer formation for compounds 1, 3, 4, 5, 6, and 7 after 24, 48, and
72 hours of irradiation.

47
Figure 30. A) The X-ray crystal structure of 2-(4'-methylstyryl)quinoline (4) shows unfavorable
stacking for photodimerization. B) The X-ray crystal structure of 2-(4'-chlorostyryl)quinoline
(3) shows favorable photodimerization conditions.
The difference in the stacking motifs of the monomers of 4 and 3 explain the
dimerization results. Compound 3 aligns head-to-tail with one molecule directly above the other,
but 4 did not follow this pattern. Compound 4 has a much greater distance between the alkene

48
carbons relative to 3, and the molecules do not align with one above the other (Figure 30). This
observation reinforces the previously mentioned requirements for [2+2] photodimerization.8
Compound 3 aligns in the crystal structure as a 1D ribbon like structure (Figure 31). This
type of arrangement in the crystal structure has been attributed to halogen-bond driven molecular
assembly, and has yielded 100% photodimerization for pentaerythritol ether and 4,4’-
bipyridylethylene pairs.19
It is also noted in the literature that Cl···Cl and Cl···H-C interactions
will align molecules in the crystal structure.8,20
It is still somewhat debated as to the exact reason
for this interaction, but it is thought to be similar to a very weak covalent bond. This interaction
is about 3% as strong as a normal covalent bond.21
Figure 31. Cl···H-C interactions have been reported to align molcules in the crystal structure so
that photodimerization is favorable. These interactions are the reason compound 3 undergoes
photodimerization in high yields.
Compound 7, 8, and 9 were synthesized to further explore this weak interaction.
Compound 7 has a bromo substituent instead of the chloro substituent, and it was synthesized to
explore the possibility of other halogens having a similar interaction as the Cl···H-C. Compound
8 contains a methyl group at the 6 position of the quinoline ring. It seemed reasonable that this
might induce a steric factor, and stop the dimerization reaction from occurring. Compound 9 has
the chloro substituent at the meta position instead of the para position on the benzene ring.

49
N
R1
R3
R2
Compound 3 (R1 = Cl, R2 = H, R3 = H) Compound 8 (R1 = Cl, R2 = H, R3 = CH3)
Methanol Chloroform Methanol Chloroform
Starting 0 0 Starting 0 0
24 hr 94 78 24 hr 11 50
48 hr 100 100 48 hr 75 70
72 hr 100 100 72 hr 75 93
Compound 7 (R1 = Br, R2 = H, R3 = H) Compound 9 (R1 = H, R2 = Cl, R3 = H)
Methanol Chloroform Methanol Chloroform
Starting 0 0 Starting 0 0
24 hr 17 45 24 hr 88 59
48 hr 91 83 48 hr 89 94
72 hr 96 93 72 hr 89 100
Table 7. The percentage of dimer formation for compounds 3, 7, 8, and 9 were analyzed by
NMR spectroscopy after 24, 48, and 72 hours of light irradiation.
Compounds 7, 8, and 9 were dissolved in methanol and chloroform to compare the rate
and extent of dimerization. All of these compounds dimerized with high yields in both solvents,
but as mentioned before chloroform increases the extent of dimerization (Table 7). The extent of
dimerization for compound 7 shows that other halogen substituents probably have similar crystal
structure interactions as the chloro substituent. Compound 8 dimerized in a high yield, so it
appears that the methyl substituent’s position does not affect the reaction. Compound 9 also
dimerized in a high yield in both solvents, so as long as the chloro substituent is at the para or
meta position on the benzene ring the photodimerization reaction will occur. Crystal structures
for these compounds are not yet available, but the crystal structure would aid significantly in
understanding the dimerization.

50
The quinoline ring contains an aromatic nitrogen which can be protonated by the addition
of acid. When the nitrogen is protonated it makes the quinoline ring electron deficient, and it
seemed reasonable that this would have an effect on the crystal structure. A small amount of
HCl or trifluoro acetic acid were used to protonate the quinoline nitrogen. Two different acids
were used because of the Cl- salt produced by the addition of HCl. It has been shown that the
chloro substituent can play a significant role in the crystal structure, and this could create an
unwanted bias in the data. The compound was first dissolved in methanol, then HCl or
trifluoroacetic acid was added until the solution had a pH of 1-2. The sample was applied to a
petri dish, and the methanol and excess acid was allowed to evaporate. The dish was placed 12
cm from an incandescent light bulb (60 W), and irradiated for 24 hours. After 24 hours of light
irradiation a 1H NMR spectrum was obtained.
Figure 32. (A) The 1H-NMR spectrum of compound 4 in methanol after 24 hours of irradiation;
no dimer present. (B) The 1H-NMR spectrum of compound 4 (acidified form using HCl in
CDCl3); dimer is forming after 24 hours of irradiation.

51
There is a significant difference in the 1H NMR spectra of compound 4 (R1 = CH3),
before and after the addition of acid (24 hours of light irradiation). When the nitrogen atom is
protonated, there is presumably a change in the way that the monomer molecules stack in the
crystal structure, compared to the neutral form. The appearance of two doublet of doublets
between 4.5 – 6.5 ppm, indicate the formation of the dimer (Figure 32).
N
R1
Compound 1 (R1 = H) Compound 4 (R1 = CH3)
Time
(hrs) Neutral HCl
Trifluoro
Acetic Acid Time (hrs) Neutral HCl
Trifluoro
Acetic Acid
0 0 0 0 0 0 0 0
24 58 73 89 24 0 88 64
Compound 3 (R1 = Cl) Compound 5 (R1= OCH3)
Time
(hrs) Neutral HCl
Trifluoro
Acetic Acid Time (hrs) Neutral HCl
Trifluoro
Acetic Acid
0 0 0 0 0 0 0 0
24 100 99 93.5 24 8 95 83
Table 8. The percentage of dimerization in the neutral and acidified form of compounds 1,3,4,
and 5 after 24 hours of irradiation.
Before the addition of acid, compounds 4 and 5 dimerized in negligible amounts (Table
8). The reason for the small amount of dimerization is proposed to be due to how the monomers
stack in the crystal structure. When acid is added and the nitrogen becomes protonated, causing
a significant change in the crystal structure. 8% of Compound 5 dimerized in the neutral form,
but upon the addition of acid it dimerized to a much greater extent after 24 hours of light
irradiation. Compound 2 (R1 = NO2) was not studied with acid because of solubility problems,

52
and compound 6 (R1 = (N(CH3)2) was not studied because it contains two basic sites on the
molecule.
It appears that the type of the acid used in these experiments does not play a large role in
the dimerization. The extent of dimerization did not increase or decrease significantly when
using HCl compared to trifluoro acetic acid (Table 8). This implies that the interaction between
two protonated nitrogen atoms is the strongest factor in how the monomer molecules stack in the
crystal structure. The molecules will most probably stack in such a way that the electron
deficient nitrogen atoms are far away from each other. It is reasonable to assume that the head-
to-tail stacking motif would align the molecules correctly for the [2+2] photodimerization
reaction to occur (Figure 33).
N+
N+
H
H
Figure 33. After the addition of acid, the monomer molecules have an induced head-to-tail
stacking. This is due to the positive formal charge on the nitrogen atom.
The 1H NMR spectra of compound 3 in the neutral and protonated form after irradiation
are different (Figure 34). This is because the protonated nitrogen atom is electron deficient and
it creates a dipole. The cyclobutane proton signal is deshielded in the acidic form of the dimer,
resulting in the signal appearing at a higher ppm compared to the neutral form.

53
H+
N
NH+
Cl
Cl
N
N
Cl
Cl
A.B.
Figure 34. A) The 1H-NMR spectrum for the neutral dimer of compound 3 with the cyclobutane
proton signal at a lower ppm. B) The 1H-NMR spectrum for the protonated dimer of compound
3 with the cyclobutane proton signal at a higher ppm.
The UV-Vis spectrum of a methanol solution of compound 3 (10-5
M) shows the λmax is
207 nm and compound does not absorb light strongly past 340 nm (Figure 35). It has been
54
reported in the literature that styryl pyrazine compounds will dimerize and then return to the
monomer upon irradiation at different wavelengths of light.9 Irradiation close to the λmax of the
dimer should induce a chemical change which could be followed by UV-Vis, because the trans
isomer of 3 is significantly different than the dimer. This implies that there is a strong possibility
of this being a molecular switch. Further experiments are necessary before any definite
conclusions can be made about the cleavage of the cyclobutane ring.

55
Figure 35. A) The normalized UV-Vis spectrum for the dimer of compound 3. B) The
normalized UV-Vis spectrum for the trans isomer of compound 3.

56
CONCLUSION
The ability of various styryl quinoline compounds to undergo photoisomerization and
photodimerization has been studied extensively. The photoisomerization occurs readily when
the compound is in solution, and the solution is irradiated with light close to the λmax of the
compound. The trans isomer typically has a λmax at a longer wavelength compared to the cis
isomer, therefore it is possible to induce photoisomerization for styryl quinolines by varying the
wavelength of irradiation. Unfortunately, the cis isomer absorbs some light near the λmax of the
trans isomer. This makes it impossible to convert 100% of the trans isomer to the cis isomer.
The cis isomer has a λmax at a shorter wavelength compared to the trans isomer, but the trans
isomer absorbs light fairly strongly at this wavelength. This makes it impossible to convert
100% of the cis isomer to the trans isomer.
Initially it was thought that changing the substituents on the molecule would change the
λmax and the rate of photoisomerization. Unfortunately, all of the compounds that were studied
reached a photo-stable state within 60 seconds of irradiation at 365 nm. This made it difficult to
reach any conclusions relating the substituent to the rate of isomerization.
To have a molecular switch based on the trans to cis photoisomerization, and vice versa,
one isomer needs have a strong absorption at a wavelength where the other isomer does not
absorb light, and the source must be able to produce light at the desired wavelength. One
method of changing the λmax is to change the substituents on the molecule. The λmax can be
shifted to a longer wavelength by increasing the conjugation of the compound. If it is possible to
separate the λmax of the trans and cis isomer enough, it would be possible to create a molecular
switch. Interestingly, the dimer and the trans isomer of compound 3 have a λmax at very different

57
wavelengths, and the dimer absorbs very weakly past 340 nm. If these two reactions can be
coupled, then this is a strong candidate for a molecular switch.
The photodimerization of various styryl quinoline compounds in the solid state was also
studied. For photodimerization to occur, the monomers in the crystal structure have to stack
correctly. Initially it was thought that stacking in the crystal structure might have some
dependence on electronic effects within the molecule. If this were true then it would be possible
to vary the extent of dimerization by varying the electron withdrawing or electron donating
ability of the substituent on the benzene ring. This does not appear to be a major factor in solid
state photodimerization. It is now apparent that stacking in the crystal structure depends mostly
on the geometry of the compound’s structure, and intermolecular forces between the monomers.
Halogens appear to play a major role in how the monomers stack in the crystal structure.
This is because Cl···H-C and Br···H-C interactions are the most significant force, with respect to
the dimerization, between the monomers. These interactions allow the monomers to stack in
such a way that the requirements for photodimerization are met. The addition of acid also
induces the photodimerization of styryl quinolines to occur, probably because of the effect of the
protonated nitrogen atoms on the crystal structure. It is possible that the charged nitrogen atoms
force a head-to-tail stacking motif, and monomers stack in such a way that the photodimerization
is favorable. The addition of acid induced the reaction to occur for compounds that previously
would not dimerize in the neutral form. To the best of my knowledge, this is the first time that
this has been reported for styryl quinoline compounds.

58
Crystal engineering is a field of study that has recently been receiving a lot of attention
due to the advances in X-ray crystallography. Crystal engineering is when the crystal structure
of a compound is selectively engineered to a desired template. From this template a number of
different photochemical changes can be studied, including photodimerization. Preliminary
studies involving the cleavage of the cyclobutane ring in the dimer of styryl quinoline
compounds have began. The UV-Vis spectra for the dimer and the trans isomer of compound 3
are significantly different. Another possibility is to introduce another molecule into the crystal
structure that will interact with the compound being studied. These interactions are mostly
through intermolecular forces such as H-bonding. This allows the stacking of molecules in the
crystal structure to be “controlled”. It will be very interesting to apply this practice to styryl
quinoline and similar compounds.

59
EXPERIMENTAL
GENERAL
All reagents and solvents were purchased from Sigma-Alrich or Acros Organics unless
otherwise noted. Reactions were monitored using aluminum backed silica gel 60 F254 thin layer
chromatography plates purchased from Merck. All compound structures were analyzed using
1H-NMR,
13C-NMR, UV-Vis, and FT-IR. NMR spectras were obtained in a CDCl3 solution
from a 400 MHz Bruker spectrospin. A Cary 100 Bio UV-Visable Spectrophotometer was used
to obtain the UV-Vis spectra. IR spectra were obtained from a Thermo Nicolet IR-100
spectrometer. All samples for IR were dissolved in chloroform and applied to KBr salt plates.
Solvents were removed under vacuum using a Heidolph Laborota 400 rotorevaporator and
Welch Duo-seal vacuum pump.
2-styrylquinoline (1). Acetic anhydride (2.2 mmol), quinaldine (2.0 mmol), and
benzaldehyde (2.0 mmol) were mixed in a conical vial under an argon atmosphere, and heated
while stirring at 115°C. The mixture was analyzed by TLC using a 15% ethyl acetate/hexane
solvent system over time. Upon completion of the reaction at 7 hours, the mixture was
transferred to a separatory funnel using approximately 15 mL of ethyl acetate. It was then
washed with saturated sodium bicarbonate (6 mL). The organic layer was dried over magnesium
sulfate. After recrystallization in ethanol/water the product was obtained as pale yellow crystals
(0.243 g, 53% yield). Melting point, UV-Vis, and IR spectroscopy data is shown in Table 2.
NMR spectroscopy data is shown in Appendix A.

60
2-(4’-nitrostyryl)quinoline (2). Acetic anhydride (2.2 mmol), quinaldine (2.0 mmol),
and 4-nitrobenzaldehyde (2.0 mmol) were mixed in a conical vial under an argon atmosphere,
and heated while stirring at 120°C. The mixture was analyzed by TLC using a 20% ethyl
acetate/hexane solvent system over time. Upon completion of the reaction at 1 ½ hours, the
mixture was transferred to a separatory funnel using approximately 15 mL of ethyl acetate. It
was then washed with saturated sodium bicarbonate (6 mL). The organic layer was dried over
magnesium sulfate. After recrystallization in chloroform/heptane, the product was obtained as a
yellow powder (0.230 g, 42% yield). Melting point, UV-Vis, and IR spectroscopy data is shown
in Table 2. NMR spectroscopy data is shown in Appendix A.
2-(4’-chlorostyryl)quinoline (3). Acetic anhydride (2.2 mmol), quinaldine (2.0 mmol),
and 4-chlorobenzaldehyde (2.0 mmol) were mixed in a conical vial under an argon atmosphere,
and heated while stirring at 110°C. The mixture was analyzed by TLC using a 20% ethyl
acetate/hexane solvent system over 3 hours. Upon completion of the reaction at 3 hours, the
mixture was transferred to a separatory funnel using approximately 15 mL of ethyl acetate. It
was then washed with saturated sodium bicarbonate (6 mL). The organic layer was dried over
magnesium sulfate. After recrystallization in ethanol/water, the product was obtained as pale
yellow crystals (0.400 g, 75% yield). Melting point, UV-Vis, and IR spectroscopy data is shown
in Table 2. NMR spectroscopy data is shown in Appendix A.
2-(4’-methylstyryl)quinoline (4). Acetic anhydride (2.2 mmol), quinaldine (2.0 mmol),
and p-tolualdehyde (2.0 mmol) were mixed in a conical vial under an argon atmosphere, and
heated while stirring at 145°C. The mixture was analyzed by TLC using a 10% ethyl
acetate/hexane solvent system over time. Upon completion of the reaction at 3 hours, the
mixture was transferred to a separatory funnel using approximately 15 mL of ethyl acetate. It
61
was then washed with saturated sodium bicarbonate. The organic layer was dried over
magnesium sulfate. After recrystallization in ethanol/water, the product was obtained as pale
yellow crystals (0.348 g, 71% yield). Melting point, UV-Vis, and IR spectroscopy data is shown
in Table 2. NMR spectroscopy data is shown in Appendix A.
2-(4’-methoxystyryl)quinoline (5). Acetic anhydride (2.2 mmol), quinaldine (2.0
mmol), and p-anisaldehyde (2.0 mmol) were mixed in a conical vial under an argon atmosphere,
and heated while stirring at 140°C. The mixture was analyzed by TLC using a 25% ethyl
acetate/hexane solvent system over time. Upon completion of the reaction after 3 ½ hours, the
mixture was transferred to a separatory funnel using approximately 15 mL of ethyl acetate. It
was then washed with saturated sodium bicarbonate. The organic layer was dried over
magnesium sulfate. After recrystallization in ethanol/water, the product was obtained as a pale
yellow powder (0.355 g, 68% yield). Melting point, UV-Vis, and IR spectroscopy data is shown
in Table 2. NMR spectroscopy data is shown in Appendix A.
2-(4’-dimethylaminestyryl)quinoline (6). Acetic anhydride (2.2 mmol), quinaldine (2.0
mmol), and 4-dimethyl-aminobenzaldehyde (2.0 mmol) were mixed in a conical vial under an
argon atmosphere, and heated while stirring at 115°C. The mixture was analyzed by TLC using
a 30% ethyl acetate/hexane solvent system over time. Upon completion of the reaction at 24
hours, the mixture was transferred to a separatory funnel using approximately 15 mL of ethyl
acetate. It was then washed with saturated sodium bicarbonate. The organic layer was dried
over magnesium sulfate. TLC analysis showed that the product was not pure, so it was purified
using column chromatography with an initial solvent system of 25% ethyl acetate/hexane. After
recrystallization in ethyl acetate/heptanes, the product was obtained as dark red crystals (0.210 g,

62
36% yield). Melting point, UV-Vis, and IR spectroscopy data is shown in Table 2. NMR
spectroscopy data is shown in Appendix A.
2-(4’-bromostyryl)quinoline (7). Acetic anhydride (2.2 mmol), quinaldine (2.0 mmol),
and 4-bromobenzaldehyde (2.0 mmol) were mixed in a conical vial under an argon atmosphere,
and heated while stirring at 100°C. The mixture was analyzed by TLC using a 15% ethyl
acetate/hexane solvent system over time. Upon the completion of the reaction at 4 hours, the
mixture was transferred to a separatory funnel using approximately 15 mL of ethyl acetate. It
was then washed with saturated sodium bicarbonate. The organic layer was dried over
magnesium sulfate. After recrystallization in ethanol/water, the product was obtained as pale
yellow crystals (0.430 g, 63% yield). Melting point, UV-Vis, and IR spectroscopy data is shown
in Table 2. NMR spectroscopy data is shown in Appendix A.
2-(4’-chlorostyryl)6-methylquinoline (8). Acetic anhydride (2.2 mmol), 2,6-
dimethylquinoline (2.0 mmol), and 4-chlorobenzaldehyde (2.0 mmol) were mixed in a conical
vial under an argon atmosphere, and heated while stirring at 110°C. The mixture was analyzed
by TLC using a 20% ethyl acetate/hexane solvent system over time. Upon completion of the
reaction at 3 hours, the mixture was transferred to a separatory funnel using approximately 15
mL of ethyl acetate. It was then washed with saturated sodium bicarbonate. The mixture was
dried over magnesium sulfate. After recrystallization in ethyl acetate/hexane, the product was
obtained as pale yellow crystals (0.142 g 25% yield). Melting point, UV-Vis, and IR
spectroscopy data is shown in Table 2. NMR spectroscopy data is shown in Appendix A.
2-(3’-chlorostyryl)quinoline (9). Acetic anhydride (2.2 mmol), quinaldine (2.0 mmol),
and 3-chlorobenzaldehyde (2.0 mmol) were mixed in a conical vial under an argon atmosphere,
and heated while stirring at 115°C. The mixture was analyzed by TLC using a 20% ethyl

63
acetate/hexane solvent system over time. Upon completion of the reaction at 4 hours the mixture
was transferred to a separatory funnel using approximately 15 mL of ethyl acetate. It was then
washed with saturated sodium bicarbonate. The organic layer was dried over magnesium sulfate.
After recrystallization in ethanol/water, the product was obtained as yellow crystals (0.400 g,
75% yield). Melting point, UV-Vis, and IR spectroscopy data is shown in Table 2. NMR
spectroscopy data is shown in Appendix A.
64
PHOTOISOMERIZATION
All solutions of the styryl quinoline derivatives were diluted to concentrations of
approximately 10-5
M in methanol. The solution was transferred to a quartz cuvette with a path
length of 1 cm, and placed directly beside the TLC lamp. The photoisomerization was induced
using an Entela TLC lamp. The photoisomerization of compounds 1, 2, 3, 4, 5, and 6 were
monitored using a Hewlett-Packard series 1100 High Pressure Liquid Chromatography with an
injection volume of 20 µL. A reverse phase C18 column (100 x 4.60 mm 3µ micron) was used
to separate the isomers in an 80/20 methanol/water solvent system (flow rate of 0.80 mL/min)
Injections were made after 10, 20, 30, 45, 60, 120, and 600 seconds of light irradiation.
SOLID STATE PHOTODIMERIZATION
Approximately 15 mg of compounds 1, 3, 4, 5, 6, 7, 8, and 9 were dissolved in the
minimum amount of solvent (acetonitrile, chloroform, or methanol). The solution was
transferred to a petri dish that has a 9 cm diameter. The solvent was then evaporated off, and the
dish was placed under the light source at a distance of 12 cm. All photodimerization reactions
were done using a 60 W incandescent light bulb. After 24, 48, and 72 hours the sample was
dissolved in CDCl3, and analyzed by NMR spectroscopy.
Hydrochloric acid or trifluoro acetic acid was added to a methanol solution of compounds 1, 3, 4,
and 5 until the pH was approximately 1-2. The solution was transferred to a petri dish that has a
9 cm diameter. The solvent was evaporated off, and the dish was placed under the light source at
a distance of 12 cm. After 24 hours the sample was dissolved in CDCl3, and analyzed by NMR
spectroscopy.
65
UV-VIS SPECTROSCOPY OF DIMER
A methanol solution of the dimer of 2-(4’-chlorostyryl)quinoline (3) was made
(approximately 10-5
) and was placed in a quartz cuvette and analyzed by UV-Vis spectroscopy.
66
REFERENCES
1. Soto J, Toledo JT.. "Oral miltefosine to treat new world cutaneous leishmaniasis". Lancet
Infect Dis. 7, 7-10
2. Macnamara, J.M., Leazer, J.L., Bhupathy, M., Amatto, J.S., Reamer R.A., Rieder, P.J.,
Grabowski, E.J. 1989 “Synthesis of Unsymmetrical Ditioacetals: An Effiecient Synthesis
of a Novel LTD4 Antagonist, L-600-711” J. Org. Chem., 54, 3718-3721
3. Alessandra Regina Pepe Ambrozin, Paulo Cezer Vieira, Joao Batista Fernandes, Maria
Fatima das Gracas da Silva, Sergio de Albuquerque. 2004 “Trypanocidal Activity of
Meliaceae and Rutaceae Plant Extracts” Mem Inst Oswaldo Cruz 99, 1-5
4. Wenchao Qu, Mei-Ping Kung, Catherine Hou, Tyler E. Benedum, Hank F. Kung ”Novel
Styrylpyridines as Probes for SPECT Imaging of Amyloid Plaques” J. Medicinal
Chemistry, 50(9), 2157-2165
5. Feringa L. Ben 2007 “The Art of Building Small: From Molecular Switches to
Molecular Motors” J. Org. Chem. 18, 6635-6652
6. Yoshikazu Imanishi, Matthew L. Batten, David W. Piston, Wolfgang Baehr, Krzysztof
Palczewski 2004 “Noninvasive two-photon imaging reveals retinyl ester storage
structures in the eye” Journal of Cell Biology 164, 373-383
7. Henri Ulrich, Durvasula V. Rao, F.A. Stuber, A.A.R. Sayigh 1969 “The
Photodimerization of Substituted Stilbenes” J. Org. Chem., 35 1121-1125
8. Schmidt, G. M. J. 1971 “The Photochemistry of trans-cinnamic Acids” Pure Appl. Chem.
27(4), 647-678
9. Jong-mok Park, Wanbin Zhang, Yohji Nakatsuji, Tetsuro Majima, and Isao Ikeda 1999
“The Fast Photochemical [2+2] Cycloaddition and Reverse Reaction of a Styrylpyrazine
Amphiphile in Aqeuous Dispersion.” Chemistry Letters 12, 1309-1310
10. Pavia, Lampman, Kriz 2001. Introduction to SPECTROSCOPY. 3rd
ed. USA: Thomson
Learning, Inc. 40
11. M. F. Budkya, N. I. Potashova, T.N. Gavrishova, and V.M Li 2008 “Photoisomerization
of 2-Styrylquinoline in Neutral and Protonated Forms” High Energy Chemistry 42, 220-
226

67
12. Mangayarkarasi Nagarathinam, Abdul Malik Puthan Peedikakkal, Jagadese J. Vittal 2008
“Stacking of double bonds for photochemical [2+2] cycloaddition reactions in the solid
state” Chem. Commun 5277-5288
13. A. I. Vedernikov, L.G. Kuz mina, S.K. Sazonov, N.A. Lobova, P.S. Loginoc, A.V.
Churakov, Yu. A. Strelenko, J.A.K. Howard, M.V. Alfimov, and S.P. Gromov 2007
“Styryl dyes. Synthesis and study of the solid [2+2] autophotocycloaddition by NMR
spectroscopy and X-ray diffraction” Russian Chemical Bulletin 56(9), 1860-1883
14. Tomislav Friscic and Leonard R. MacGillivray 2004 “Single-crystal-to-single-crystal
[2+2] photodimerizations: from discovery to design” Z. Kristallogr 220, 351-363
15. Ilona Turowska-Tyrk 2004 “Structural transformations in organic crystals during
photochemical reactions” Journal of Physical Organic Chemistry 17, 837-847
16. Lyudmila G. Kuz’mina, Artem I. Vedernikov, Natalia A. Lobova, Andrei V. Churakov,
Judith A.K. Howard, Michael V. Alfimov, Sergey P. Gromov 2007 “4-Styrylquinolines:
synthesis and study of [2+2]-photocyloaddition reactions in thin films and single
crystals” New Journal of Chemistry 31, 980-994
17. Yoshikatsu Ito, Toru Kajita, Kazuhiko Kunimoto, and Teruo Matsuura 1989
“Accelerated Photodimerization of Stilbenes in Methanol and Water” J. Org. Chem. 54,
587-591
18. Zhang W., Zhang Xi-Hui, Zheng Yan, Shen, Gang, Zhuang Jun-Peng 2000 “Studies on
the photodimerization of trans-4-(4-R-styryl)pyridine” Ganguang Kexue Yu Guang
Huaxue 18(2), 144-149
19. T. Caronna, R. Liantonio, T.A. Logothetis, P. Metrangolo, T.Pilati, and G. Resnati 2004
“Halogen bonding and pi···pi stacking control reactivity in the solid state” J. Am. Chem.
Soc. 126, 4500-4501
20. Jagarlapudi, A.R.P. Sarma, Gautam R. Desiraju 1986 “The Role of Cl···Cl and C-H···O
Interactions in the Crystal Engineering of 4-Angstom Short-Axis Structures” Acc. Chem.
Res. 19, 222-228
21. Williams, D.E.; Hsu L.-Y. 1985 “Transferability of nonbonded Cl···Cl potential energy
function to crystalline chlorine” Foundations of Crystallography 3, 296-301
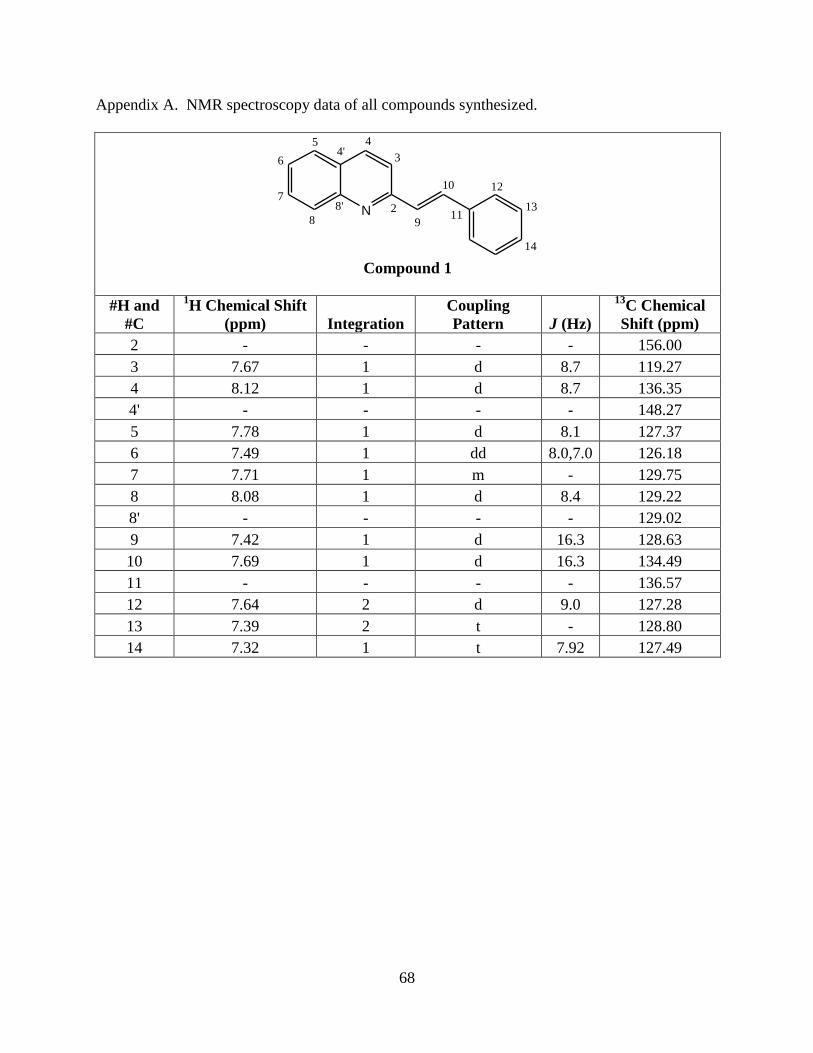
68
Appendix A. NMR spectroscopy data of all compounds synthesized.
N 2
3
44'
5
6
7
8
8'
9
10
11
12
13
14
Compound 1
#H and
#C
1H Chemical Shift
(ppm) Integration
Coupling
Pattern J (Hz)
13C Chemical
Shift (ppm)
2 - - - - 156.00
3 7.67 1 d 8.7 119.27
4 8.12 1 d 8.7 136.35
4' - - - - 148.27
5 7.78 1 d 8.1 127.37
6 7.49 1 dd 8.0,7.0 126.18
7 7.71 1 m - 129.75
8 8.08 1 d 8.4 129.22
8' - - - - 129.02
9 7.42 1 d 16.3 128.63
10 7.69 1 d 16.3 134.49
11 - - - - 136.57
12 7.64 2 d 9.0 127.28
13 7.39 2 t - 128.80
14 7.32 1 t 7.92 127.49
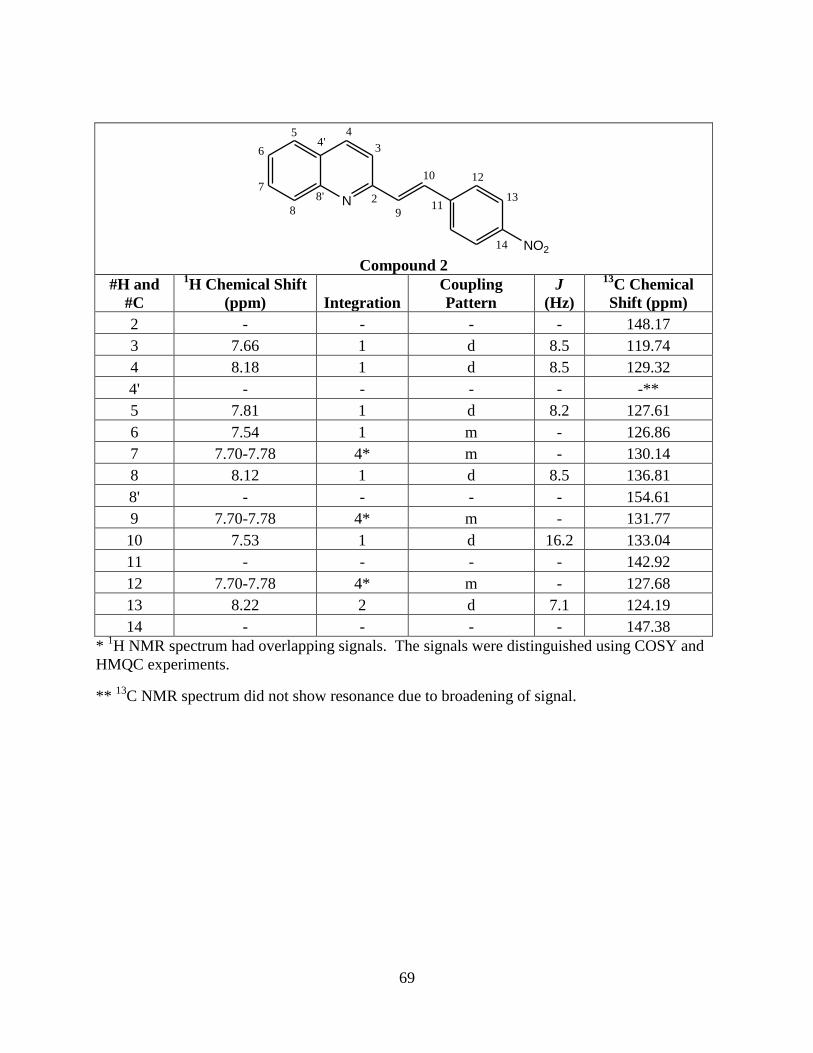
69
N 2
3
44'
5
6
7
8
8'
9
10
11
12
13
NO214
Compound 2
#H and
#C
1H Chemical Shift
(ppm) Integration
Coupling
Pattern
J
(Hz)
13C Chemical
Shift (ppm)
2 - - - - 148.17
3 7.66 1 d 8.5 119.74
4 8.18 1 d 8.5 129.32
4' - - - - -**
5 7.81 1 d 8.2 127.61
6 7.54 1 m - 126.86
7 7.70-7.78 4* m - 130.14
8 8.12 1 d 8.5 136.81
8' - - - - 154.61
9 7.70-7.78 4* m - 131.77
10 7.53 1 d 16.2 133.04
11 - - - - 142.92
12 7.70-7.78 4* m - 127.68
13 8.22 2 d 7.1 124.19
14 - - - - 147.38
* 1H NMR spectrum had overlapping signals. The signals were distinguished using COSY and
HMQC experiments.
** 13
C NMR spectrum did not show resonance due to broadening of signal.

70
N 2
3
44'
5
6
7
8
8'
9
10
11
12
13
Cl14 Compound 3
#H and
#C
1H Chemical Shift
(ppm) Integration
Coupling
Pattern
J
(Hz)
13C Chemical
Shift (ppm)
2 - - - - 155.56
3 7.61 1 d 8.6 119.35
4 8.11 1 d 8.6 136.50
4' - - - - 127.41
5 7.77 1 d 8.0 127.51
6 7.49 1 dd
8.0,
7.1 126.33
7 7.70 1 dd
8.5,
7.1 129.87
8 8.08 1 d 8.5 129.17
8' - - - - 148.17
9 7.37 1 d 16.1 129.43
10 7.62 1 d 16.1 133.14
11 - - - - 135.07
12 7.55 2 d 8.6 128.41
13 7.35 2 d 8.6 129.01
14 - - - - 134.35

71
N 2
3
44'
5
6
7
8
8'
9
10
11
12
13
CH314
15
Compound 4
#H and
#C
1H Chemical Shift
(ppm) Integration
Coupling
Pattern
J
(Hz)
13C Chemical
Shift (ppm)
2 - - - - 156.30
3 7.58 1 d 8.6 119.31
4 8.20 1 d 8.6 136.40
4' - - - - 127.39
5 7.71 1 d 8.0 127.64
6 7.44 1 t
8.0,
7.0 126.17
7 7.66 1 t
8.4,
7.0 129.83
8 8.07 1 d 8.4 129.24
8' - - - - 148.35
9 7.35 1 d 16.4 128.13
10 7.62 1 d 16.4 134.56
11 - - - - 133.86
12 7.51 2 d 8.0 127.36
13 7.17 2 d 8.0 129.67
14 - - - - 138.86
15 2.48 3 s 0.00 21.52

72
N 2
3
44'
5
6
7
8
8'
9
10
11
12
13
OCH314
15
Compound 5
#H and
#C
1H Chemical Shift
(ppm) Integration
Coupling
Pattern
J
(Hz)
13C Chemical
Shift (ppm)
2 - - - - 127.06
3 7.60 1 d 8.4 119.00
4 8.05 1 d 8.4 136.06
4' - - - - 156.18
5 7.74 1 d 8.1 127.37
6 7.46 1 m - 125.78
7 7.68 1 t
8.4,
7.2 129.52
8 8.07 1 d 7.2 129.14
8' - - - - 148.13
9 7.27 1 d 16.3 126.70
10 7.63 1 d 16.3 133.91
11 - - - - 128.93
12 7.57 2 d 8.8 128.51
13 6.92 2 d 8.8 114.11
14 - - - - 159.96
15 3.82 3 s 0.00 55.16
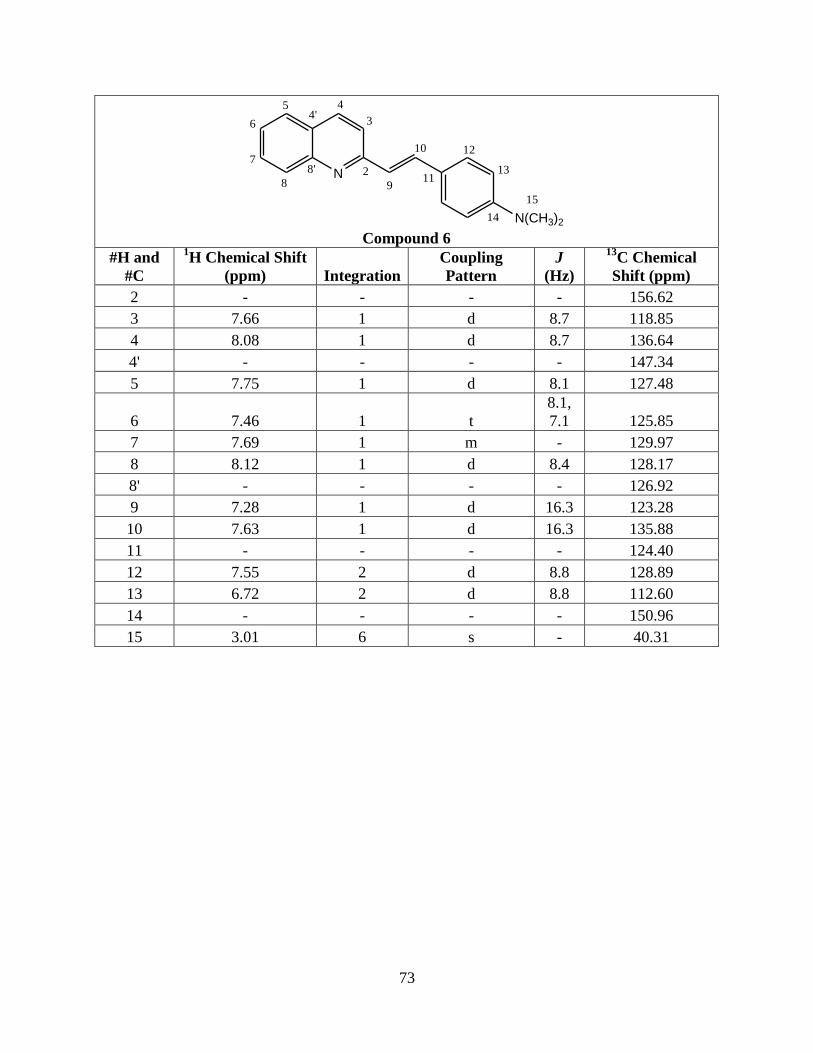
73
N 2
3
44'
5
6
7
8
8'
9
10
11
12
13
N(CH3)214
15
Compound 6
#H and
#C
1H Chemical Shift
(ppm) Integration
Coupling
Pattern
J
(Hz)
13C Chemical
Shift (ppm)
2 - - - - 156.62
3 7.66 1 d 8.7 118.85
4 8.08 1 d 8.7 136.64
4' - - - - 147.34
5 7.75 1 d 8.1 127.48
6 7.46 1 t
8.1,
7.1 125.85
7 7.69 1 m - 129.97
8 8.12 1 d 8.4 128.17
8' - - - - 126.92
9 7.28 1 d 16.3 123.28
10 7.63 1 d 16.3 135.88
11 - - - - 124.40
12 7.55 2 d 8.8 128.89
13 6.72 2 d 8.8 112.60
14 - - - - 150.96
15 3.01 6 s - 40.31

74
N 2
3
44'
5
6
7
8
8'
9
10
11
12
13
Br14 Compound 7
#H and
#C
1H Chemical Shift
(ppm) Integration
Coupling
Pattern
J
(Hz)
13C Chemical
Shift (ppm)
2 - - - - 155.43
3 7.63 1 d 8.4 119.33
4 8.14 1 d 8.4 136.68
4' - - - - 122.66
5 7.79 1 d 8.2 127.53
6 7.48-7.56 5* m - 126.42
7 7.72 1 dd
8.4,
7.0 129.99
8 8.08 1 d 8.4 129.00
8' - - - - 147.93
9 7.38 1 d 16.4 129.27
10 7.63 1 d 16.4 133.42
11 - - - - 135.43
12 7.48-7.56 5* m - 128.72/131.97**
13 7.48-7.56 5* m - 128.72/131.98**
14 - - - - 127.41
* 1H NMR spectrum had overlapping signals. The signals were distinguished using COSY and
HMQC experiments.
** Due to overlap in the 1H NMR spectrum, it was impossible to distinguish between the
13C
signals.

75
N
H3C
Cl
2
3
44'
56
7
88'
9
10
11
12
13
14
15
Compound 8
#H and
#C
1H Chemical Shift
(ppm) Integration
Coupling
Pattern
J
(Hz)
13C Chemical
Shift (ppm)
2 - - - - 154.40
3 7.64 1 d 8.7 119.20
4 8.07 1 d 8.7 136.46
4' - - - - 127.41
5 7.55 4* s - 126.50
6 - - - - 136.67
7 7.52-7.58 4* m - 132.55
8 8.04 1 m - 128.20
8' - - - - 145.92
9 7.42 1 d 15.7 128.65
10 7.63 1 d 15.7 133.35
11 - - - - 134.90
12 7.52-7.58 4* m - 128.48
13 7.35 2 d 8.5 129.04
14 - - - - 134.45
15 2.53 3 s - 21.64
* 1H NMR spectrum had overlapping signals. The signals were distinguished using COSY and
HMQC experiments.
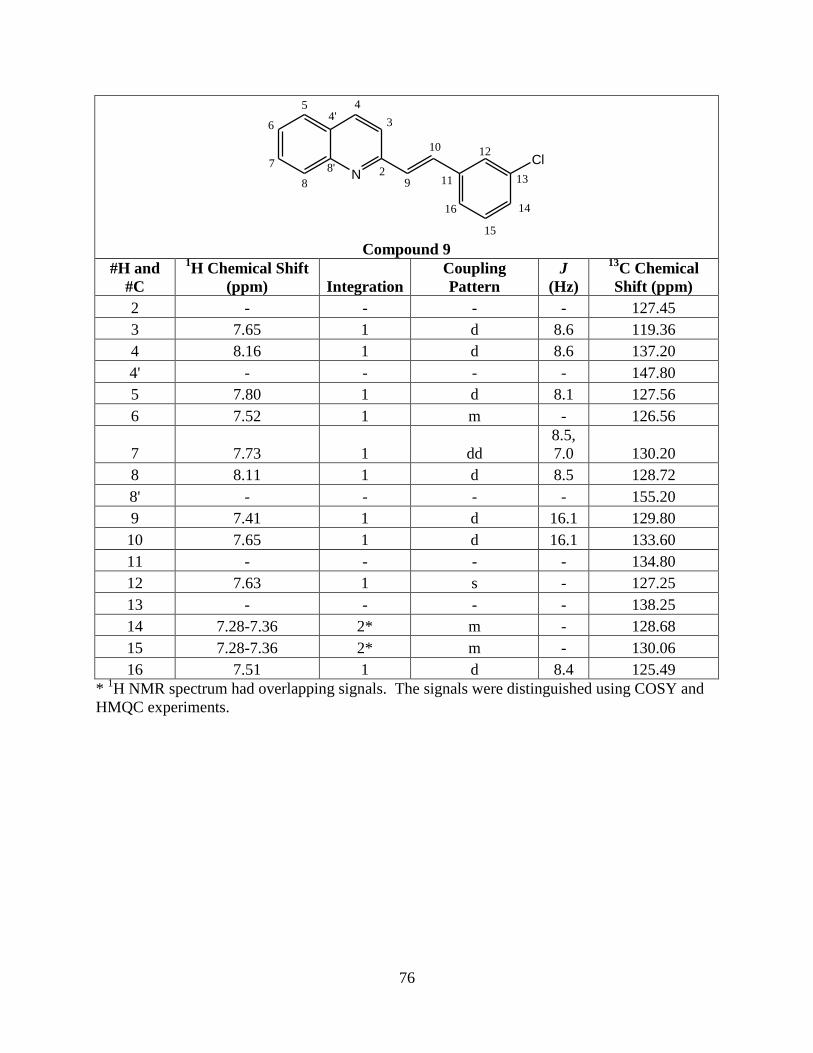
76
NCl
2
3
44'
5
6
7
8
8'
9
10
11
12
13
14
15
16
Compound 9
#H and
#C
1H Chemical Shift
(ppm) Integration
Coupling
Pattern
J
(Hz)
13C Chemical
Shift (ppm)
2 - - - - 127.45
3 7.65 1 d 8.6 119.36
4 8.16 1 d 8.6 137.20
4' - - - - 147.80
5 7.80 1 d 8.1 127.56
6 7.52 1 m - 126.56
7 7.73 1 dd
8.5,
7.0 130.20
8 8.11 1 d 8.5 128.72
8' - - - - 155.20
9 7.41 1 d 16.1 129.80
10 7.65 1 d 16.1 133.60
11 - - - - 134.80
12 7.63 1 s - 127.25
13 - - - - 138.25
14 7.28-7.36 2* m - 128.68
15 7.28-7.36 2* m - 130.06
16 7.51 1 d 8.4 125.49
* 1H NMR spectrum had overlapping signals. The signals were distinguished using COSY and
HMQC experiments.

77
Appendix B. NMR spectroscopy data for the dimer of compound 3.
N
N
Cl
Cl
2
3
44'
5
6
7
88'
910
11
12
13
14
Dimer of compound 3
#H and
#C
1H Chemical
Shift (ppm) Integration
Coupling
Pattern J (Hz)
13C Chemical
Shift (ppm)
2 - - - - 159.95
3 7.05 2 d 8.5 121.54
4 7.87 2 d 8.5 135.58
4' - - - - 126.70
5 7.70 2 d 7.9 127.46
6 7.47 2 m - 125.87
7 7.67 2 m - 129.23*
8 8.08 2 d 8.0 129.23*
8' - - - - 147.89
9 4.84 2 dd 7.4, 10.1 49.80
10 5.17 2 dd 7.4, 10.1 44.95
11 - - - - 139.19
12 7.15 4 d 8.4 129.60
13 7.00 4 d 8.4 127.99
14 - - - - 131.79
* Carbon resonances for 7 and 8 overlap to form one signal at 129.23.