
Photo Courtesy of Annie Clark for PolicyLink. Acknowledgments PolicyLink is grateful to the...
62
to Courtesy of Annie Clark for PolicyLink
-
date post
19-Dec-2015 -
Category
Documents
-
view
214 -
download
0
Transcript of Photo Courtesy of Annie Clark for PolicyLink. Acknowledgments PolicyLink is grateful to the...

Photo Courtesy of Annie Clark for PolicyLink

AcknowledgmentsPolicyLink is grateful to the Louisiana Recovery Authority, particularly David Bowman and Kimon Ioannides,
for their collaboration in sharing data and supporting the development of this report. Additional thanks to Wil Jacobs, Bradley Sweazy, and Mark Maier.
PolicyLink would also like to thank the Louisiana Housing Finance Agency for sharing data, especially Milton Bailey, Brenda Evans, and Urshala Hamilton.
Many thanks to our community partners for their ideas and input:
ACORNAcadiana Outreach ACT/PICO-LIFTCharles Allen, Holy Cross Neighborhood AssociationKate Barron, Oxfam AmericaWestley Bayas, Phoenix of New OrleansNell Bolton, Amanda Davis, and Katie Mears, Episcopal Diocese of LouisianaDon Boutte, Churches Supporting ChurchesKevin Brown, Trinity Christian CommunityPeg Case, TRAC Catholic Charities Johnell Colbert, First Pilgrims Baptist Church Common GroundDeborah Cotton, LouisianaRebuilds.info Mai Dang, Mary Queen of Vietnam CDCHamady Diop, Southern University Melanie Ehrlich, Citizen Road Home Action Team (CHAT)Debby Goldberg, National Fair Housing Alliance Diocese of LafayetteJackie Jones, JeremiahPatricia Jones, NENA Jessica Knox, Institute of Community Development Debbie Koheler, Operation Helping Hands
Reggie Lawson, Crescent City Peace AllianceLower Ninth Ward Neighborhood Empowerment Network Association (NENA) Revonda McCray, Odyssey HouseKristin Gisleson Palmer, Rebuilding TogetherJames Perry, Lucia Blacksher, and Seth Weingart, Greater New Orleans Fair Housing Action CenterCathy Puett, Qatar Treme Renewal ProjectZach Rosenburg, St. Bernard ProjectJames Ross, NeighborWorksNeighborhood Housing ServicesRosalind Peycheaud, Neighborhood Development FoundationEllenor Simmons and Tonya Gatt, Crescent Alliance Recovery Effort (CARE)Dr. Monteic Sizer, Louisiana Family Recovery Corps (LFRC)Southern Mutual Help Association Southwest Family ServicesTrinity Episcopal ChurchLaura Tuggle, New Orleans Legal Assistance CorporationUMCORUNITY of Greater New OrleansVolunteers of AmericaMichelle Whetten, Enterprise Community Partners
2
We are grateful to our funders the Marguerite Casey Foundation, Louisiana Disaster Recovery Foundation, the Bill & Melinda Gates Foundation, and the Rockefeller Foundation for helping to make this work possible.

Table of Contents
• Executive Summary – page 3
• Rental Housing Programs – page 14 – Large Rental/Low Income Housing Tax Credit Program– Small Rental Repair Program
• Homeowner Recovery Program – page 36
3

Overview of Housing RecoveryOn the cusp of the third anniversary of Hurricanes Katrina and Rita, Louisiana residents trying to recover continue to be battered by storms beyond their control.
A Long Way Home reviews the housing recovery progress made by the State of Louisiana to implement the major, federally-funded housing recovery programs to restore storm-damaged housing. Those include the Large Rental and the Small Rental Repair programs, and the homeowners’ Road Home program.
There is no objective measure for how fast such a massive housing recovery should move. But the challenges facing homeowners who confront ever-changing program rules and who are left without sufficient resources to complete repairs—and the Catch-22 of ending temporary housing help before rental replacement units are available—continues to place a significant burden on impacted residents.
Local, state, and federal governments must work with community leaders to address the unfinished and underfunded work of bringing Louisianans home.
4

The Good News
• Since the second anniversary, the pace of housing repair grant closings has greatly increased—with almost three-fourths of applicants receiving their awards by early August 2008. Of the 116,000 applicants who have closed, 93 percent have chosen to rebuild in place.
• Local nonprofit, sweat equity, and faith-based recovery groups are continuing to channel national resources—including volunteers, materials, funds, and expertise—to help recover thousands of homes for some of the most vulnerable seniors and families.
• Activity grew exponentially in the neighborhoods most devastated or most reliant on federal recovery funds—due largely to the rise of local resident leadership that galvanized their neighbors in common, determined purpose.
• UNITY of Greater New Orleans and partners helped house almost all of the homeless residents living under Interstate 10, and won $75 million in additional funds from Congress to support homeless and disabled residents with housing recovery needs.
• Road Home Additional Compensation Grants, designed to help low-income homeowners, played an important role in increasing resources for some lower income families.
• Funds for rental housing recovery were mostly allocated to New Orleans’ most flooded neighborhoods, particularly where the highest percentage of renters lived.
• Senator Mary Landrieu won an extra $3 billion in Congress to prevent a funding shortfall for homeowners.
• Advocates won passage of state legislation allowing Road Home applicants additional rights to appeal their awards.
5

The Tough News for Renters
• Renters are still out of luck: in hurricane affected areas across the state, only 2 in 5 affordable damaged rental units will be repaired or replaced with recovery assistance. In New Orleans, just over 1 in 3 will receive recovery assistance—leaving displaced renters critically vulnerable. Of the approximately 24,600 rental homes projected to receive assistance, only eleven percent (2,600) are open for occupancy.
• The 17,000 residents still living in FEMA trailers in May became subject to moves by FEMA and local parishes to actively close all trailers this summer—although only 8 percent of the rental homes assisted by recovery funds are open, a quarter of homeowners still await their recovery grants, and tens of thousands of households have not receiving sufficient funding to complete rebuilding.
• The ranks of homeless residents doubled across affected parishes in southern Louisiana, with the New Orleans metro homeless population reaching 12,000 residents—a painful reminder of the continuing housing losses in the community.
• Financial vulnerability of small property owners, combined with tightening national credit markets, has stalled the small rental repair program. Meant to restore over 10,000 rental homes in damaged neighborhoods, only 82 had been completed and occupied under the program as of August—leaving neighborhoods unrepaired and renters far from home.
• The national economic downturn means fewer investors in Low Income Housing Tax Credits, jeopardizing the financing for as many as 4,600 of the planned 13,100 units of multifamily rental housing in southern Louisiana.
• The impending March 2009 end to the Disaster Housing Assistance Program (DHAP) threatens to displace 28,000 residents across the nation (including 14,000 in the New Orleans metro region) who are receiving rental assistance although affordable housing units are not yet ready for occupancy.
Source: “Katrina and Rita Direct and Financial Assistance as of 5/24/08,” FEMA, http://www.fema.gov/pdf/hazard/hurricane/2005katrina/d_f_ha_breakdown_state.pdf
6

• 81 percent of Road Home recipients rebuilding in place in New Orleans had insufficient resources to cover their damages, while 69 percent of recipients in other parishes had such gaps.
• Homeowners continue to face changing rules and arbitrary practices, including long payment delays, reduced grant awards at the time of closing, and deadlines for owners of family property trying to resolve legal title.
• Statewide, the average Road Home applicant fell about $35,000 short of the money they need to rebuild their home. The shortfall hit highly flooded, historically African-American communities particularly hard.
• Few financing options exist for families facing resource gaps: three years of owing mortgages on uninhabitable property and the resulting additional living expenses has left many households not creditworthy to secure private financing to finish their homes.
The Tough News for Homeowners7

Homeowner and Rental Units: New Orleans Metro Region
•Housing recovery is moving much slower for renters than homeowners across the New Orleans metro region.
•Recovery funds will only restore 27 percent of the rental units destroyed in the metro region.
•Though three-quarters of home-owner applicants have closed their grants, 81 percent of those rebuilding in place in New Orleans did not have sufficient resources to rebuild their homes.
Source: Homeowner data based on data obtained from the Louisiana Recovery Authority. Includes only applicants deemed eligible by program. Data good for June 26, 2008. Tax credit data based on Louisiana Housing Finance Agency Pipeline Report. Data good for July 18, 2008. Small Rental data based on data obtained from the Louisiana Recovery Authority. Data good for June 17, 2008. FEMA Damage Estimates, February 2006.
8

Homeowner and Rental Units: New Orleans Metro Region
Parish Damaged Homes (FEMA
Estimate)
Road Home Applicants
Road Home Closings
Percent of Applicants Compared to Estimated Damage *
Damaged Rental Units (FEMA
Estimate)
Potential Rental
Units with Funding
Allocation**
Rental Units
Currently in
Pipeline **
Percent of Rental
Potentially Replaced
Compared to Estimated Damage
Jefferson 20,339 30,432 21,373 150% 13,972 1,840 704 13%
Orleans 53,474 53,913 35,051 101% 51,681 17,099 5,819 33%
Plaquemines 3,722 3,992 1,849 107% 1,457 27 10 2%
St. Bernard 13,736 14,517 6,474 106% 5,936 924 235 16%
St. Tammany 13,689 12,857 9,538 94% 3,931 975 729 25%
Total NOLA Metro
104,960 115,711 74,285 110% 76,977 20,865 7,497 27%
State Wide 122,592 150,617 84,114 123% 82,145 24,621 10,058 30%
Road Home applicants in Orleans, St. Bernard, and Plaquemines parishes have closed more slowly than those in Jefferson and St. Tammany parishes.
Resources to recover rental housing are woefully inadequate in relation to overall loss, locking residents out of housing and workforce opportunity. Funding is allocated to repair or build only 1 of 3 damaged rental homes statewide (24,600). As of July, 2008, about 2,600 of the homes were ready to occupy. Jefferson parish’s meager replacement is partially due to efforts by parish officials to reduce rental housing opportunities—despite job growth and housing need in the parish.
Source: Homeowner data based on data obtained from the Louisiana Recovery Authority. Includes only applicants deemed eligible by program. Data good for June 26, 2008. Tax credit data based on Louisiana Housing Finance Agency Pipeline Report. Data good for July 17, 2008. Small rental data based on data obtained from the Louisiana Recovery Authority. Data good for June 17, 2008. FEMA Damage Estimates, February 2006. Damage refers to major and severe damage.
* High percentages of applicants compared to damage estimates reflect FEMA underestimates. **Represents units with funding allocations from either the Gulf Opportunity (GO) Zone LIHTC Program or the Small Rental Property Program (SRPP). Does not include units repaired by other means (such as private insurance.)***Represents units from GO Zone Tax Credit Program that are completed, under construction, or have closed financing and units from the SRPP that have closed or are in either the construction or pre-closing stage.
9

10
Homeowner and Rental Units: Western Louisiana•Many more homeowners affected by Hurricane Rita applied to the Road Home than were originally estimated in western Louisiana due to extreme underestimates of damage by FEMA. 57 percent of those rebuilding in place in Calcasieu parish did not receive sufficient funds to rebuild, and 70 percent fell short in Cameron parish.
•If rental damage is as underestimated as homeowner damage, it is impossible to gauge the state of recovery.
Source: Homeowner data based on data obtained from the Louisiana Recovery Authority. Includes only applicants deemed eligible by program. Data good for June 26, 2008. Tax Credit data based on Louisiana Housing Finance Agency Pipeline Report. Data good for July 18, 2008. Small rental data based on data obtained from the Louisiana Recovery Authority. Data good for June 17, 2008. FEMA Damage Estimates, February 2006.
Parish Damaged Homes (FEMA
Estimate)
Road Home Applicants
Road Home
Closings
Percent of Applicants Compared
to Estimated Damage
Damaged Rental Units (FEMA
Estimate)
Potential Rental Units with
Funding Allocatio
n
Rental Units
Currently in
Pipeline
Percent of Rental
Potentially Replaced
Compared to Estimated Damage
Calcasieu 4,428 14,514 11,213 328% 1,953 1,391 1,066 71%
Cameron 2,025 2,075 1,211 102% 551 47 1 9%

Federal Policy Recommendations
Policy recommendations for federal government:
• Homeowner recovery: Allocate funds to close the gaps created by Road Home formula for approximately 58,000 homeowners whose damage estimates were higher than their pre-storm or assessed value. (Congress)
• Homeowner recovery: Increase flexibility of rules and provide relevant waivers to ease low income, vulnerable applicants through the program. (HUD)
• Temporary housing: Extend Disaster Housing Assistance Program for rental assistance through 2010 when new rental units will become available. (HUD/Congress)
• Speed repair: Waive CDBG rules that make Small Rental Repair Program a reimbursement program so that funds can move immediately to grants for repairs. (President/HUD/Congress)
• Rental homes: Direct and fund HUD to replace all pre-storm HUD-assisted homes (over 6,000 senior and workforce HUD units are currently languishing unopened; approximately 1,700 former units recently demolished in the Big Four public housing developments are without replacement funding.)
• Rental homes: Allocate Low Income Housing Tax Credits to replace another 10,000 damaged rental units over the next five years. (Congress)
• Rental homes: Extend to 2012 the current placed-in-service date for larger Low Income Housing Tax Credit developments. (Congress)
• Accountability: Improve oversight and transparency of federally-funded housing programs to ensure that vulnerable households do not fall through the cracks. (HUD)
These recommendations are drawn from interviews with diverse community leaders, including construction and case management groups, legal services representatives, advocacy groups, agency leaders, and elected officials.
(Continued on next slide)
11

State Policy Recommendations
Policy recommendations for state:
• Neighborhood rentals: Ensure spending of all small rental repair funds currently allocated for neighborhood recovery and affordable housing for renters. Ease rules to speed funds to repairs. (LRA)
• Deeply affordable apartments: Address the needs of most vulnerable renters by prioritizing deeply affordable and permanent supportive housing in reallocation of tax credits from projects that have been unable to secure financing. (LHFA)
• Sufficient homeowner grants: Fairly value properties for homeowner grant calculations by utilizing higher of assessment value or damage estimate. (LRA)
• Protection of homeowner rights: Rescind arbitrary September 5th deadline for Road Home applicants still resolving legal title on family properties.
• Contractor fraud: Investigate all reports and prosecute criminals; fund robust anti-fraud training program for 20,000 grant recipients. (Attorney General and LRA)
• Gap funds: Serve homeowners and others victimized by unscrupulous contractors or short of funds through: contracts with housing rehab groups; supplemental grants to escrow accounts; or creation of a low cost loan pool with generous credit scoring to help homeowners bridge gaps. (LRA)
• Repair help: Fund construction management expansion among rebuilding organizations for homeowners and mom and pop landlords. (LRA) See www.policylink.org/ThreeYearsLater/RecoveryGroups.html for list of effective groups helping homeowners.
• Insurance relief: Fund an insurance subsidy pool available on sliding scale for people at median income or below to help address the increased burden of insurance. (Legislature, LRA, Insurance Commissioner, LHFA)
(Continued on next slide)
12

New Orleans Policy Recommendations
Policy recommendations for New Orleans:
• Temporary housing: Extend deadline to vacate trailers until Road Home applicants have closed and half of rental homes currently in the pipeline are completed. (ORDA, City Council)
• Expand rehab help: Increase capacity of construction management groups through grants and contracts. (ORDA, City Council) See effective rehab groups: www.policylink.org/ThreeYearsLater/RecoveryGroups.html
• Financial resources: Establish small grants or loan pool to cover gaps and prioritize in-progress rebuilds and those in final completion stage. (ORDA, FANO)
• Financial resources: Help high credit risk homeowners and rental owners by guaranteeing loans. (ORDA, City Council)
• Land use priorities: Utilize Louisiana Land Trust Properties to create more equitable housing occupancy patterns—prioritizing first time ownership in high-rental neighborhoods, and affordable rental homes in high ownership neighborhoods. (NORA)
13

Photo Courtesy of Annie Clark for PolicyLink
14

Rental Program Overview
The 82,000 units of rental housing lost in hurricanes Katrina and Rita are being primarily replaced by two programs: Large Rental Program, financed by Low Income Housing Tax Credits, and Community Development Block Grant (CDBG) ‘Piggyback’ funds, aimed at multi-family housing developers; and the Small Rental Repair Program, aimed at neighborhood homes owned by mom and pop landlords. The majority, but not all of the homes generated by these programs are affordable; both programs gave bonuses for creating mixed income developments.
The piggyback portion of the tax credit program addresses the needs of seniors and people at risk of homelessness. The program provides incentives for providing deeper affordability and the economic integration of different income groups into new housing developments. These funds also provided for the partial replacement of lost public housing developments.
Statewide, current allocations will only replace 2 of every 5 affordable units lost, while only 1 in 3 affordable rentals in the New Orleans area will be replaced. Parishes particularly far behind in the metro region are St. Bernard, Jefferson, and Plaquemines. (Continued on next slide)
15

Rental Program Overview (cont.)
Within New Orleans, funds for rental housing recovery were allocated to the most flooded neighborhoods with high percentages of pre-Katrina rentals.Yet both programs are affected by changes in the national economy. Almost half of the Low Income Housing Tax Credit developments in New Orleans are still struggling to complete their financing in a national market with fewer investors. If they do not get investors, they are at risk of losing their tax credits and not moving forward. Additionally, the small rental program is reliant on owners securing their own financing up front. With a national credit squeeze, and financially vulnerable post-disaster owners, only 370 units* (4%) have been able to reach the final stages of the small rental program.
The vast majority of rental housing in New Orleans prior to Katrina was comprised of smaller 1-4 unit houses targeted by the Small Rental Repair Program. About half of 17,000 units funded for replacement will be these smaller scale units. This very limited funding means a great deal of blight could remain in neighborhoods.
A major concern has been the mismatch between available affordable units and the end of temporary housing programs, leaving tenants without options. Currently across the state, fewer than 2,600 of the 24,600 rental units funded for recovery are open for occupancy.
*Includes units in pre-closing and those that have closed.
16

Affordable Rental Replacement in Select Heavily Damaged Parishes
Note: For Small Rental Repair Program, numbers only include units under 80% of AMI, not market rate units. For Tax Credit Program, numbers only include units under 60% of AMI, not Market Rate units. Overall 82,000 rental units were heavily damaged or destroyed.
Metro New Orleans parishes are far behind in replacing affordable rental units, especially in St. Bernard, Jefferson, and Plaquemines.
Overall, current allocations will only replace 2 of every 5 affordable units lost.
Source: Tax credit data based on Louisiana Housing Finance Agency Pipeline Report. Data good for July 17, 2008. Small rental data based on data obtained from the Louisiana Recovery Authority. Data good for June 17, 2008. FEMA Damage Estimates, February 2006. HUD CHAS Data 2005.
Parish
Affordable Rental Units with Severe or Major Damage
Affordable Units in Small Rental Pipeline
Affordable Rental Units in
Tax Credit Pipeline
Total Affordable Units in Pipeline
Affordable Rental Need to Match Pre-K
Percent Replaced
Calcasieu 1,333 247 946 1,193 140 89%
Jefferson 8,515 808 606 1,414 7,101 17%
Orleans 37,790 7,736 6,268 14,004 23,786 37%
Plaquemines 759 25 0 25 734 3%
St. Bernard 3,935 869 0 869 3,066 22%
St. Tammany 2,211 200 600 800 1,411 36%
Other Heavily Damaged Parishes 1,453 125 1,198 1,323 130 91%
Other Parishes w/New Units n/a n/a 849 849 n/a n/a
Total 54,477 10,010 10,467 20,477 36,368 38%
17

Where are Rentals Recovering?
Source: Tax credit data based on Louisiana Housing Finance Agency Pipeline Report. Data good for July 17, 2008. Small Rental data based on data obtained from the Louisiana Recovery Authority. Data good for June 17, 2008. Census 2000 SF-1. FEMA (Sept 11, 2005 Flood Extent).
Heavily flooded neighborhoods that had greatest numbers of renters are absorbing the greatest number of new and rehabbed rental units.
18

Photo Courtesy of Annie Clark for PolicyLink
19
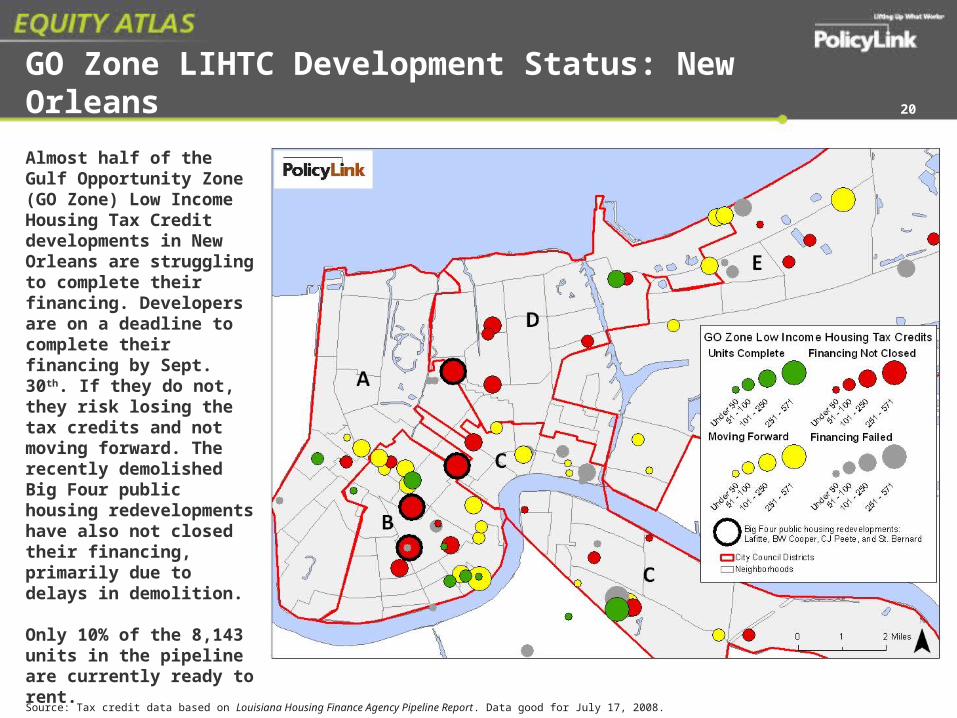
GO Zone LIHTC Development Status: New Orleans
Almost half of the Gulf Opportunity Zone (GO Zone) Low Income Housing Tax Credit developments in New Orleans are struggling to complete their financing. Developers are on a deadline to complete their financing by Sept. 30th. If they do not, they risk losing the tax credits and not moving forward. The recently demolished Big Four public housing redevelopments have also not closed their financing, primarily due to delays in demolition.
Only 10% of the 8,143 units in the pipeline are currently ready to rent. Source: Tax credit data based on Louisiana Housing Finance Agency Pipeline Report. Data good for July 17, 2008.
20

Mixed-Income Developments at Work: Tulane Ave Corridor
Development Name Income for a Family of 4
Less Than $23,920 (Less
than 40% AMI)
Between $23,920-
35,880 (40-60% AMI)
Over $35,880(over
60% AMI)
The Preserve 37 Units 37 109
The Crescent Club 50 42 136
Falstaff Brewery 0 93 63
St. Michael’s 0 60 0
The Terraces 200 0 0
The Marquis 50 50 50
Jefferson Davis Apts
0 56 16
TOTAL UNITS 337 338 374
Percent of TOTAL UNITS 32% 32% 36%
Seven developers targeted the corridor along Tulane Avenue for new Low Income Housing Tax Credit developments. All the developments except for St. Michael’s and The Terraces (both for seniors) will be mixed income and provide housing for a range of working families. Developers initially resisted Louisiana’s first-time requirements for mixed income apartments, but these developments have been among the first to successfully secure financing and begin building. The developments demonstrate positive development principles: they did not displace any residents to be built, created economically integrated communities that included very low-income households, and used former industrial buildings or under utilized land.
Source: Tax credit data based on Louisiana Housing Finance Agency Pipeline Report. Data good for July 17, 2008.
Note: AMI is Area Median Income, $59,800 for a family of 4 in the New Orleans Metro Region.
Photos Courtesy of Annie Clark for PolicyLink
21

When Mixed-Income Doesn’t Work: Displacement at St. Bernard
Since Katrina, four of the ten New Orleans public housing develop-ments are being torn down and replaced with mixed-income tax credit funded developments. While the Lafitte developers plan to redevelop every pre-Katrina afford-able unit on a larger footprint, St. Bernard is replacing the fewest of any of these redevelopments. Where St. Bernard’s 963 deeply affordable homes stood pre-Katrina, 465 new homes will be rebuilt—with only 153 of them affordable to the families who used to live there. The other 810 families will be displaced. Local residents and housing advocates continue to call on HUD and the Housing Authority of New Orleans to develop a plan that replaces all the lost federally-assisted homes.
Two Tales of Mixed-Income Housing:
Source: Tax credit data based on Louisiana Housing Finance Agency Pipeline Report. Data good for July 17, 2008.
Note: St. Bernard’s redevelopment plan calls for an additional unfunded stage that will produce 164 units.
Photo Courtesy of Annie Clark for PolicyLink
22

LIHTC Development Status by Parish
Despite the national credit crisis undermining Low Income Housing Tax Credit developments from coast to coast, developments funded by tax credits in southern Louisiana are doing fairly well.
Source: Tax credit data based on Louisiana Housing Finance Agency Pipeline Report. Data good for July 17, 2008.
Parish
Units
Original Allocations in Three Rounds in
2006Currently in Pipeline
Percent of Original in Pipeline
Returned to the LHFA for Re-Distribution
Calcasieu 1,408 1,130 80% 278
Jefferson 1,227 851 69% 281
Orleans 9,157 8,143 89% 1,675
St. Tammany 802 750 94% 48
Other Parishes 2,363 2,262 96% 126
TOTAL Units 14,957 13,136 88% 2,408
Total Developments 179 159 89% 30
The Louisiana Housing Finance Agency (LHFA) allocated Gulf Opportunity Zone (GO Zone) tax credits in 2006, and some developers since then have been unable to secure the remaining financing to make their projects viable. Investor concerns in southern Louisiana include increased risk of investing in a recovery area with more unknowns, a federal deadline to have units ready to be occupied by 2010, local opposition to multifamily/rental developments, increased insurance costs, and lowered demand for tax credits in a down economy.
The LHFA has taken several corrective steps to keep projects moving forward. The agency: •delivered LRA-CDBG dollars to developments with shortfalls (adding some additional affordability or disability requirements);•reallocated tax credits from failed developments to others ready to proceed;•offered flexibility with the financing deadline; and•utilized a current ‘lightning round’ to reallocate the remaining $11 million in GO Zone credits.
23

Development Status for LIHTC
New Orleans and Jefferson parishes are struggling more than others to secure investors for tax credit developments. Both parishes have almost half of their developments in limbo. The final deadline for closing financing is September 30, 2008.
Note: Units in pipeline include those whose financing has not closed. Units underway include units ready/open for occupancy, under construction, and with financing closed. Units that have not yet secured financing are in jeopardy and may not open.
Source: Tax credit data based on Louisiana Housing Finance Agency Pipeline Report. Data good for July 17, 2008.
Parish
Projectsin
pipeline
Units
Percent underway
Percent of financing not closed
Total in pipeline
Ready/ Open for
OccupancyUnder
ConstructionFinancing closed
Financing not closed
Calcasieu 19 1,130 341 196 529 64 94% 6%
Jefferson 12 851 210 180 100 361 58% 42%
Orleans 61 8,143 849 2,357 1,193 3,744 54% 46%
St. Tammany 9 750 116 418 156 60 92% 8%
Other Parishes 58 2,262 660 493 702 407 82% 18%
TOTAL 159 13,136 2,176 3,644 2,680 4,636 65% 35%
24

Photos Courtesy of Annie Clark for PolicyLink
25

Small Rental Repair Program Overview
Rental housing stock in New Orleans prior to Katrina was made up primarily of units in smaller buildings; nearly 70 percent were in buildings with four units or less. The Small Rental Repair Program was designed to give a forgivable loan to the owners of these small rental houses in thirteen of the most heavily damaged parishes* to rehab their units in exchange for providing much needed affordable rental units. Since New Orleans carried the vast number of damaged rental units, the majority of the funding was allocated there to restore units.
The program also aims to reduce blight in heavily damaged neighborhoods, where rental units in traditional housing stock existed side-by-side with those occupied by homeowners.
While the goals of the program are laudable, the program has hit innumerable roadblocks. Unlike the upfront grants of the homeowners program, federal rules steered the state toward a complex program that reimbursed landlords after repairs were finished and a tenant was in place. This required landlords to get private financing for their repairs, which has become increasingly difficult as the national credit market tightened and landlords continued to carry mortgages on properties without any rental income. *Acadia, Calcasieu, Cameron, Iberia, Jefferson, New Orleans, Plaquemines, St. Bernard, St. Tammany, Tangipahoa, Terrebonne, Vermilion, and Washington.
26

Small Rental Overview (cont.)
The program suffered from a complex application process and a series of rule changes for eligibility. This programmatic confusion was exacerbated by applicants being unable to access their files and or receive the technical assistance they needed to complete program requirements. Applicants also experienced many problems similar to Road Home applicants in accessing their files and repeatedly having to verify their documentation. The state has made many improvements in this arena, and is now holding regular sessions to work with landlords, but the number of applicants who were lost in the system are unquantifiable.
Unless HUD acts to help the state by easing the rules, the program’s great potential could be lost—leaving homes in neighborhoods blighted, fewer affordable units available, and families who rent part of their home unable to rebuild.
27

Small Rental Repair Status: New Orleans
StageAs of June 18
Units Applicants
Percent of Total
Applicants
Stage 1: Verification
4,616 2,378 52%
Stage 2: Loan Approval
2,920 1,493 33%
Stage 3: Construction
1,056 521 11%
Stage 4: Pre-Closing
356 159 3%
Stage 5: Closing
8 6 Less than 1%
Total 8,956 4,557 100%
85% of New Orleans Small Rental Repair applicants have NOT begun the construction stage.
Note: Description of program stages on Slide 30
Source: Small rental data based on data obtained from the Louisiana Recovery Authority. Data good for June 17, 2008.
28

Small Rental Applicant Stages – New Orleans
The vast majority of applicants in New Orleans and other heavily damaged parishes are still in the initial stage of the program, where there is significant risk of applicants dropping out—meaning the house would likely stand unrepaired.
Note: Description of program stages on Slide 30Source: Small rental data based on data obtained from the Louisiana Recovery Authority. Data good for June 17, 2008.
29

Stages of Small Rental Program
• Verification: Applicant undergoes underwriting review, Office of Community Development (OCD) checks documents.
• Loan Approval: Applicant receives loan summary, commitment letter.
• Construction: Applicant is making repairs, getting certificate of occupancy, self-reported by applicant that all items in application are completed.
• Pre-Closing: OCD completes lead paint assessment, final inspection of scoring items, tenant income verification.
• Closing: Final inspection passed, applicant receives the forgivable loan.
30

Small Rental Program Applicants Dependent On Rental Income
ParishNumber of Applicants
Percent Reliant on Rental Income
Percent Senior and Reliant on
Income
Calcasieu 204 62% 28%
Jefferson 462 62% 9%
Orleans 4,557 64% 14%
St. Bernard 547 71% 15%
St. Tammany 169 62% 6%
Other Parishes 120 64% 28%
Total 6,059 65% 14%
•Two-thirds of the small rental repair program participants were reliant on rental income, one of the program’s key target demographics.
•The loss of rental income fell particularly hard on senior landlords—about 1 in 7 of the program applicants—for whom delays in the program exacerbated the hardships they already faced.
Note: Applicants reported that rental income was over 30% of total income; 521 applicants did not disclose their age and are not included.
Source: Small rental data based on data obtained from the Louisiana Recovery Authority. Data good for June 17, 2008.
31
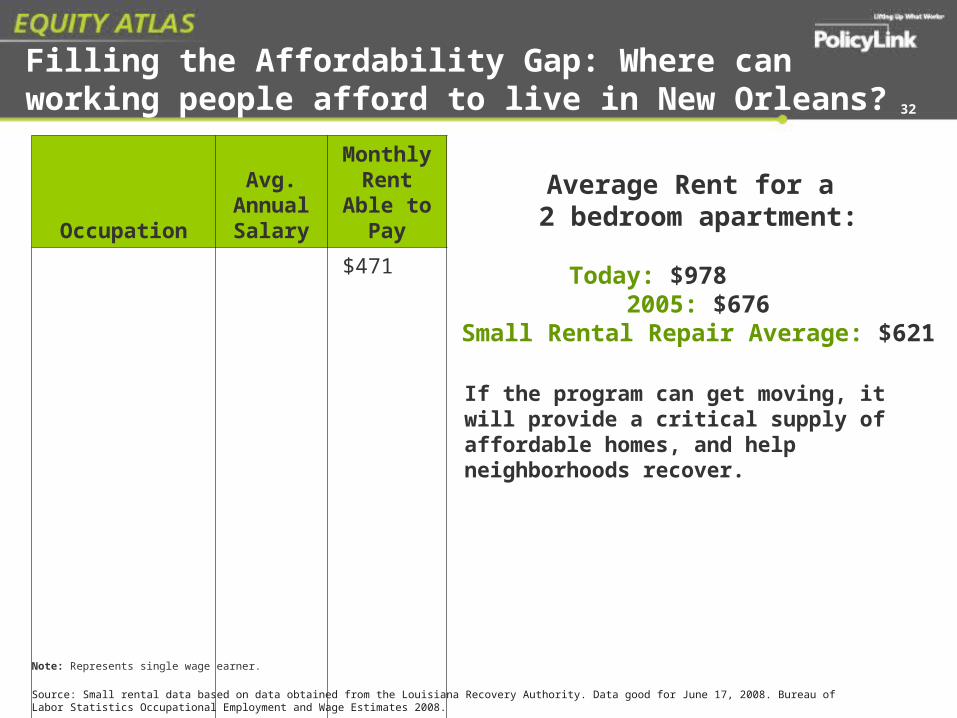
Filling the Affordability Gap: Where can working people afford to live in New Orleans?
Occupation
Avg. Annual Salary
Monthly Rent
Able to Pay
Short Order Cook $16,970
$471
Bank Teller $21,960 $504
Home Health Aide $19,060 $524
Firefighter $27,180 $747
Medical Lab Tech $29,720 $817
Police Officer (Patrol) $34,680 $954
Plumber $38,540 $1,071
Teacher $42,660 $1,173
Note: Represents single wage earner.
Average Rent for a 2 bedroom apartment:
Today: $978 2005: $676
Small Rental Repair Average: $621
Source: Small rental data based on data obtained from the Louisiana Recovery Authority. Data good for June 17, 2008. Bureau of Labor Statistics Occupational Employment and Wage Estimates 2008.
If the program can get moving, it will provide a critical supply of affordable homes, and help neighborhoods recover.
32

Federal Policy Recommendations
Policy Recommendations for federal government:
• Temporary housing: Extend Disaster Housing Assistance Program for rental assistance through 2010 when new rental units will be available. (HUD/Congress)
• Speed repair: Waive CDBG rules that make Small Rental Repair Program a reimbursement program so that funds can move immediately to grants for repairs. (President/HUD/Congress)
• Rental homes: Direct and fund HUD to replace all pre-storm HUD-assisted homes (over 6,000 senior and workforce HUD units are currently languishing unopened; and approximately 1,700 former units recently demolished in the Big Four public housing developments are without replacement funding.)
• Rental homes: Allocate Low Income Housing Tax Credits to replace another 10,000 damaged rental units over next five years. (Congress)
• Rental homes: Extend current placed in service date for Low Income Housing Tax Credits to 2012. (Congress)
• Accountability: Improve oversight and transparency of federally-funded housing programs to ensure that vulnerable households do not fall through the cracks.
These recommendations are drawn from interviews with diverse community leaders, including construction and case management groups, legal services representatives, advocacy groups, agency leaders, and elected officials.
(Continued on next slide)
33

State Policy Recommendations
Policy Recommendations for state: • Neighborhood rentals: Ensure spending of all small rental repair funds currently
allocated to ensure neighborhood recovery and affordable housing for renters. (LRA)
• Speed Repair: Ease rules in Small Rental Repair Program to speed funds to repairs. (LRA)
• Speed Repair: Loan state general funds to Small Rental Repair Program to give landlords money upfront. Reimburse state with federal dollars already allocated to this program. (Legislature)
• Deeply affordable apartments: Address most vulnerable renters by prioritizing deeply affordable and permanent supportive housing in reallocation of tax credits from projects unable to secure their financing. (LHFA)
• Repair help: Fund construction management expansion in rebuilding organizations for mom and pop landlords. (LRA)
• Insurance relief: Fund an insurance subsidy pool available on a sliding scale for low-income landlords in the Small Rental Repair Program to help address the increased burden of insurance. (Legislature, LRA, Insurance Commissioner, LHFA)
(Continued on next slide)
34

New Orleans Policy Recommendations
Policy Recommendations for New Orleans:
• Temporary housing: Extend trailer-vacancy deadlines until half of rental homes currently in pipeline are completed. (ORDA, City Council)
• Expand rehab help: Increase capacity of construction management groups through grants and contracts. (ORDA, City Council)
• Financial resources: Establish small grants or loan pool for those repairing rental properties. (ORDA, FANO)
• Financial resources: Help high credit risk rental owners by guaranteeing loans. (ORDA, City Council)
• Land use priorities: Utilize Louisiana Land Trust Properties to create more equitable housing occupancy patterns—prioritizing first time ownership in high-rental neighborhoods, and affordable rental homes in high ownership neighborhoods. (NORA)
35

Photo Courtesy of Annie Clark for PolicyLink
36

Applicants Rebuilding in Place
DemographicCategory Number
Percent of RH Apps.
Closed
RH Apps. Closed 84,114 100%
Race
African American 37,159 44.2%
Asian 1,719 2.0%
White 31,438 37.4%
Income
Low Income(Below 80% AMI) 35,554 42.3%
Above 80% AMI 41,098 48.9%
Other Groups
Elderly 6,483 7.7%
Flooded 49,140 58.4%
The Road Home Homeowner Assistance program provides grants for the uninsured losses of homeowners to repair their homes or relocate.
FEMA estimated that about 330,000 homeowners suffered from minor to complete damage of their homes across the storm affected areas in Louisiana. Road Home officials expect more than 150,000 homeowners will receive grants from the program—with nearly three-fourths of those paid out as of early August 2008. This report looks at how those who chose to rebuild in place fared in relation to the resources needed to rebuild their homes.
Families that had sufficient insurance (flood, wind, and homeowners), and those that could rely on their own assets, generally moved into repair mode in the first year after the storm. Repopulation maps of damaged areas show a correlation between higher incomes and faster reoccupancy. (See http://www.gnocdc.org/repopulation/) Those that depended solely on the Road Home program generally have moved more slowly due to insufficient funds and the pace of the program.
Note: AMI = Area Median Income
Road Home Applicants Rebuilding in Place
Significant challenges remain for those who have received their grants and those who have yet to close. Nonprofit groups working with homeowners report that many recipients face insufficient rebuilding grants, contractor fraud, a high-cost environment, inability to access additional credit, and home-title succession challenges that delay or deny funding for the home repair. This report found that the majority of homeowners choosing to rebuild in place did not have sufficient resources to fully recover their homes.Source: Homeowner data based on data obtained from the Louisiana Recovery Authority. Data for 84,114 closed applicants rebuilding in place and
are good for June 26, 2008.
37

Applicants Rebuilding in Place (cont.)
General trends in the data show that:• African American households and low-income households had lower
pre-storm home values than the average for closed applicants rebuilding in place.
• African American and elderly households received higher average grants because a higher percentage of them received additional compensation grants, which were available to low-income individuals.
• Low-income households and African Americans had less insurance on average than any other demographic group.
A change was made to the Road Home grant calculation formula in August 2006. The original formula allowed for meeting rebuilding/repair costs up to $150,000 and the changed formula relied on the pre-storm assessment of the home. This change left 81 percent of New Orleans homeowners and 69 percent of other parish homeowners who are rebuilding in place with insufficient funds to rebuild. Those with significant damage and low pre-storm home values were particularly hard hit by this change.
Source: Based on data obtained from the Louisiana Recovery Authority. Data represent 84,114 closed applicants rebuilding in place and are good for June 26, 2008.
38

Available Rebuilding Funding
Forty-two percent of Road Home applicants who closed and are rebuilding in place are low income. The Road Home’s additional compensation grant, offered only to low-income households, increased the average amount of total rebuilding resources for these households.
Source: Homeowner data based on data obtained from the Louisiana Recovery Authority. Data represent 84,114 closed applicants rebuilding in place and are good for June 26, 2008. **Damage estimate is the figure used in the grant calculation.
39
Average Amount of Rebuilding Funding
Above 80% AMI Below 80% AMI
Non-RH Rebuilding Resources $54,098 $37,343
RH Compensation Grant $47,233 $42,748
RH Additional Compensation Grant - $26,776
Total RH Grant* $50,723 $73,938
Total Rebuilding Resources (incl. RH, insurance, and FEMA) $104,822 $111,282
Average Pre-Storm Home Value $163,090 $114,042
Average Damage Estimate** $145,323 $139,741
*Total RH Grant is not the total of two former cells—it also includes some elevation grants for early applicants.

Applicants Dependent on Road Home
Applicants who depended solely on Road Home grants—they had no other insurance or compensation funds—were predominately low income and African American households. These homeowners bore a greater financial burden because of time delays than those who had other resources. These individuals had an average gap of $46,000 in the resources needed to rebuild their homes.
Not Low
Income36%
Low Income
64%
3,800 Applicants Depended Solely on Road Home Resources
Source: Homeowner data based on data obtained from the Louisiana Recovery Authority. Data represent 84,114 closed applicants rebuilding in place and are good for June 26, 2008.
40

Road Home Formula Explained
For homeowners rebuilding in place, the grant calculation formula leaves homeowners with low pre-storm home values short of the funds they need to rebuild. For example:
Estimated cost of damage*: $160,000 Pre-storm value: $ 90,000 Insurance received: $50,000 The compensation grant is the lesser of: $160,000 $90,000 -$50,000 OR -$50,000$110,000 $40,000
Compensation Grant = $40,000
Note: *Depending on the amount of damage to a home, one of two damage estimates are used in the formula: Type 1 estimate ($130/sq ft + other fees) or Type 2 damage estimate (the cost to repair, component by component).
A homeowner who earns less than 80% of area median income could qualify for an additional compensation grant up to $50,000 to partially close the gap.
In the example used here, a low-income homeowner could receive $90,000—still $20,000 short of the repair costs to the home.
Comp. GrantCompensation
Needed
41

Note: These estimates were calculated using total resources (excluding SBA Loans) minus the damage estimate for the structure (this is the figure used in the grant calculation). Estimates are likely to underestimate the gaps as they do not include elevation grant amounts or damage estimates due to the program’s recent policy changes that are not fully reflected in the data.
$(45,000)
$(40,000)
$(35,000)
$(30,000)
$(25,000)
$(20,000)
$(15,000)
$(10,000)
$(5,000)
$-
African American White
Average Estimated Gap
Nearly three-fourths of Road Home applicants had gaps between their rebuilding resources and the cost to rebuild. The gap was larger for African American applicants than their white counterparts.
Gap = $39,082 Gap = $30,863
Gap for all apps.= ($35,865)
Source: Homeowner data based on data obtained from the Louisiana Recovery Authority. Data represent 84,114 closed applicants rebuilding in place and are good for June 26, 2008.
42

Formula Driven Gap Estimates
Applicants whose damage estimates were higher than pre-storm
value
The grant formula had a more negative effect on those whose homes were valued less than their damage estimates. Those whose damages were greater than their pre-storm home value—46.7% of all applicants rebuilding in place—experienced a gap of nearly $50,000. All the rest had a much lower gap—an average of about $14,000 (53.3% of all applicants rebuilding in place).
39,296 Applicants 44,818 Applicants
Source: Homeowner data based on data obtained from the Louisiana Recovery Authority. Data represent 84,114 closed applicants rebuilding in place and are good for June 26, 2008.
All other applicants
43

Rule Changes and Program Errors
Homeowners continue to face changing rules and arbitrary practices, including long payment delays, reduced grant awards at the time of closing, and deadlines for owners of family property trying to resolve legal title.
Substantial problems remain for people who are still struggling through the program. Households whose applications were deemed ineligible or who are inactive total nearly 30,000.
Program deadlines such as the September 5, 2008 deadline for applicants who have ‘failed’ to provide documents place additional burdens on homeowners. Advocates are working to eliminate these burdens by circulating petitions and working to secure an Orleans Parish Council resolution to the state to repeal the deadline. See http://justiceforneworleans.org/roadhome/.
Homeowners continue to fight for correct grant amounts. As of July 31, 2008, 35% of the 9,500 resolved appeals cases (3,315 applicants) received an average additional disbursement of $25,000. There are many, however, who have unsuccessfully attempted to navigate the confusing and changing appeals process.
Advocates continue to work to address program problems in legislation, administrative advocacy, and legal appeals. See http://www.legis.state.la.us/billdata/streamdocument.asp?did=504663.
Efforts to document the continuing challenges faced by applicants include a new survey distributed by the Citizen’s Road Home Action Team (CHAT). See CHAT Road Home Survey:http://www.surveymonkey.com/s.aspx?sm=hdEchbm8Vl_2bWFDmxi7E_2f7w_3d_3d
Source: Based on data obtained from the Louisiana Recovery Authority. Data are good for June 26, 2008.
44

Photo Courtesy of Annie Clark for PolicyLink
45
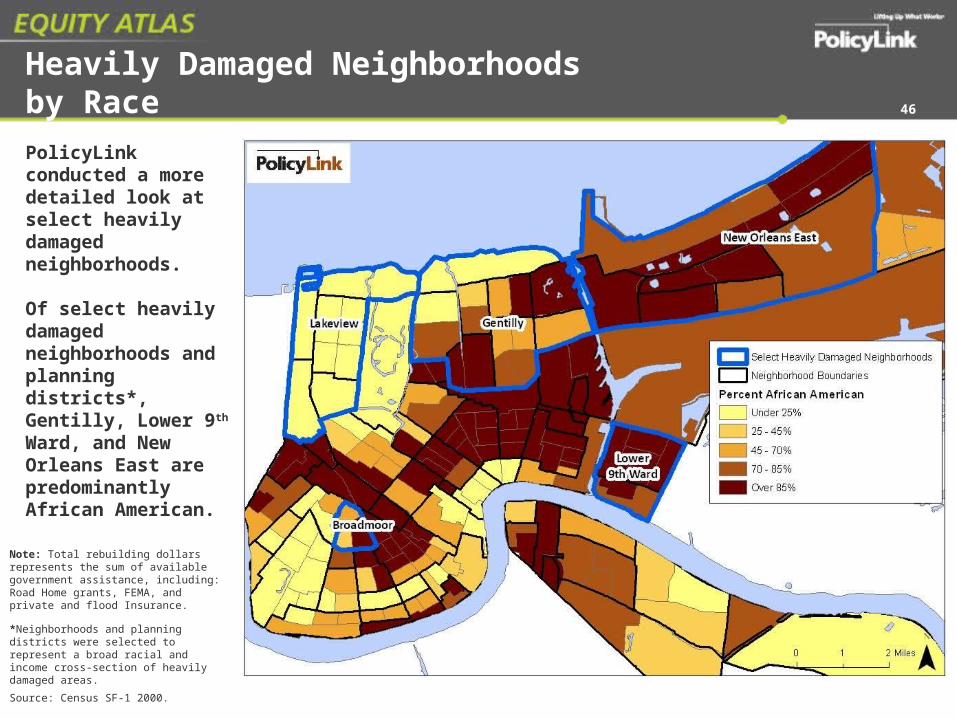
Heavily Damaged Neighborhoods by RacePolicyLink conducted a more detailed look at select heavily damaged neighborhoods.
Of select heavily damaged neighborhoods and planning districts*, Gentilly, Lower 9th Ward, and New Orleans East are predominantly African American.
Source: Census SF-1 2000.
*Neighborhoods and planning districts were selected to represent a broad racial and income cross-section of heavily damaged areas.
46
Note: Total rebuilding dollars represents the sum of available government assistance, including: Road Home grants, FEMA, and private and flood Insurance.

Road Home Resources for Select Heavily Damaged Neighborhoods
Note: Average amounts of resources are presented only for closed applicants rebuilding in place. These figures reflect only applicants for which a neighborhood was indicated. Average damage estimate represents the damage amount used in the grant calculation by RH administrators.
Citywide Broadmoor Gentilly LakeviewLower 9th
Ward
New Orleans East
Total Applicants 53,913 1,006 9,657 4,735 3,382 13,908
Percent Closed 58.1% 65.1% 66.6% 56.9% 53.9% 62.3%
# Closed Rebuilding in Place 31,347 635 5,759 2,286 1,482 8,123
Avg Total Resources $144,196 $167,889 $155,749 $237,132 $128,242 $155,107
Avg RH Grant $77,799 $89,960 $82,998 $109,777 $93,401 $67,289
Avg Pre-storm Value $164,375 $208,975 $154,411 $336,064 $100,739 $146,216
Avg Damage Estimate $198,782 $220,562 $210,458 $281,537 $203,597 $224,303
Gap between Avg. Damage Est. and Avg. Total Resources $54,586 $52,673 $54,709 $44,405 $75,355 $69,196
Across the city in heavily damaged neighborhoods, residents relying on Road Home grants faced insurmountable gaps in rebuilding resources. The most severe community-wide impacts are revealed in New Orleans East and the Lower 9th Ward.
Source: Homeowner data based on data obtained from the Louisiana Recovery Authority. Data represent 84,114 closed applicants rebuilding in place and are good for June 26, 2008.
47

Rebuilding Cost Gaps by Select Heavily Damaged Neighborhoods
Note: These figures only reflect applicants for which a neighborhood was indicated.
New Orleans’ Road Home applicants are more likely to have a gap than all applicants statewide. More than 60% of households in New Orleans East and the Lower 9th Ward have gaps over $40,000.
Neighborhood
Total Households
(HHs) rebuilding in
place
Total Households with Gaps
Households with Gap >$10K
Households with Gap >$40K
Percent Percent of All HHs
Percent of All HHs
New Orleans East 8,123 7,125 87.7% 6,032 74.3% 4,940 60.8%
Gentilly 5,759 4,839 84.0% 3,908 67.9% 2,842 49.3%
Broadmoor 635 475 74.8% 339 53.4% 256 40.3%
Lower 9th Ward 1,482 1,352 91.2% 1,247 84.1% 980 66.1%
Lakeview 2,286 1,667 72.9% 1,143 50.0% 805 35.2%
Orleans Parish 31,347 25,228 80.5% 19,272 61.5% 14,863 47.4%
All Other Parishes 52,767 36,220 68.6% 29,992 56.8% 11,105 21.0%
All Applicants 84,114 61,448 73.1% 49,264 58.6% 25,968 30.9%
Source: Homeowner data based on data obtained from the Louisiana Recovery Authority. Data represent 84,114 closed applicants rebuilding in place and are good for June 26, 2008.
48

Average Pre-Storm Value: New Orleans
Of select heavily damaged neighborhoods and planning districts, Gentilly, Lower 9th Ward, and New Orleans East had lower pre-storm value.
Source: Homeowner data based on data obtained from the Louisiana Recovery Authority. Data represent 84,114 closed applicants rebuilding in place and are good for June 26, 2008.
49

Average Total Rebuilding Dollars: New OrleansOf select heavily damaged neighborhoods and planning districts, Gentilly, Lower 9th Ward, and New Orleans East had lower total rebuilding funds.
Note: Total rebuilding dollars represents the sum of available government assistance, including: Road Home grants, FEMA, and private and flood Insurance.Source: Homeowner data based on data obtained from the Louisiana Recovery Authority. Data represent 84,114 closed applicants rebuilding in place and are good for June 26, 2008.
50

Average Estimated Gap: New Orleans
Of select heavily damaged neighborhoods and planning districts, Lower 9th Ward, and New Orleans East had higher average gaps.
Source: Homeowner data based on data obtained from the Louisiana Recovery Authority. Data represent 84,114 closed applicants rebuilding in place and are good for June 26, 2008.
51
Note: Total rebuilding dollars represents the sum of available government assistance, including: Road Home grants, FEMA, and private and flood Insurance.

Federal Policy Recommendations
These policy recommendations are drawn from PolicyLink data analysis findings and from interviews with diverse community leaders, including rebuilding and case management groups, legal services representatives, agency leaders, and elected officials.
Policy recommendations for federal government:
• Homeowner recovery: Allocate funds to close the gaps created by Road Home formula for approximately 58,000 homeowners whose damage estimates were higher than their pre-storm or assessed value. (Congress)
• Homeowner recovery: Increase flexibility of rules and provide relevant waivers to ease low income, vulnerable applicants through the program. (HUD)
• Accountability: Improve oversight and transparency of federally-funded housing programs to ensure that vulnerable households do not fall through the cracks. (HUD)
(Continued on next slide)
52

State Policy Recommendations
Policy recommendations for state:
• Sufficient homeowner grants: Fairly value properties for homeowner grant calculations by utilizing higher of assessment value or damage estimate. (Governor, LRA, Legislature)
• Protection of homeowner rights: Rescind arbitrary September 5th deadline for Road Home applicants still resolving legal title on family properties and implement Road Home Bill of Rights. (Governor, LRA, Legislature)
• Contractor fraud: Investigate all reports and prosecute criminals; fund robust anti-fraud training program for 20,000 grant recipients. (Attorney General and LRA)
• Gap funds: Serve homeowners victimized by unscrupulous contractors or short of funds through: contracts with housing rehab groups; supplemental grants to escrow accounts; or creation of a low-cost loan pool with generous credit scoring to help homeowners bridge gaps. (LRA)
• Repair help: Fund construction management expansion in rebuilding organizations that leverage volunteer labor and private donations to cover gaps for homeowners. (LRA) See www.policylink.org/ThreeYearsLater/RecoveryGroups.html for list of effective groups helping homeowners.
• Insurance relief: Fund an insurance subsidy pool available on a scale for people at median income or below to help address the increased burden of insurance. (Legislature, LRA, Insurance Commissioner, LHFA)(Continued on next slide)
53

New Orleans Policy Recommendations
Policy recommendations for New Orleans:
• Temporary housing: Extend trailer-vacancy deadlines until Road Home applicants have closed and half of rental homes currently in pipeline are completed. (ORDA, City Council)
• Expand rehab help: Increase capacity of construction management groups through grants and contracts (ORDA, City Council). See effective rehab groups: www.policylink.org/ThreeYearsLater/Recoverygroups.pdf
• Financial resources: Establish small grants or loan pool and prioritize ‘in progress’ rebuilds and those in final completion stage.(ORDA, FANO)
• Financial resources: Help high credit risk homeowners and rental owners by guaranteeing loans. (ORDA, City Council)
• Land use priorities: Utilize Louisiana Land Trust Properties to create more equitable housing occupancy patterns—prioritizing first time ownership in high-rental neighborhoods, and affordable rental homes in high ownership neighborhoods. (NORA)
54

For more information contact:Annie Clark, Program Associate
PolicyLink1515 Poydras Street, Suite 105
New Orleans, LA [email protected] x26
Dominique Duval-Diop, Senior AssociatePolicyLink
1515 Poydras Street, Suite 105New Orleans, LA 70119
[email protected] 225-615-4243
55

Methodology and Sources: Executive Summary
All data was analyzed using statistical software package, SAS, produced by the SAS Institute based in Cary, North Carolina, and ArcGIS produced by ESRI in San Bernardino, California, and Microsoft Excel.
Executive Summary
Slide 6Small Rental ClosingsICF Small Rental Property Program, Operations Status Report, August 11, 2008. http://www.road2la.org/rental-docs/OperationStatusReport_081108.pdfAll other Small Rental Program numbers referenced in this report based on June 17, 2008 data.
Slides 8, 9 and 10Damage EstimatesU.S. HUD. CURRENT HOUSING UNIT DAMAGE ESTIMATES HURRICANES KATRINA, RITA, AND WILMA. February 12, 2006. Revised April 7, 2006. Analysis by the U.S. Department of Housing and Urban Development’s Office of Policy Development and Research.
Road Home Applicants only include applicants deemed eligible as of June 26, 2008.Rental units with funding allocations includes units from the Gulf Opportunity Zone Low Income Tax Credit Program and Small Rental Repair Programs.Rental units built or underway includes tax credit developments that are placed in service, are under construction or have closed their financing as of July 17, 2008. Also includes Small Rental Repair Units that are in the construction stage, are in pre-closing or have closed as of June 18, 2008.
56

Renters Analysis
Slide 4 (Slide 17 in Full Document)Damage EstimatesU.S. HUD. CURRENT HOUSING UNIT DAMAGE ESTIMATES HURRICANES KATRINA, RITA, AND WILMA. February 12, 2006. Revised April 7, 2006. Analysis by the U.S. Department of Housing and Urban Development’s Office of Policy Development and Research. In this report, damaged buildings will refer to major damage and destroyed will refer to those classified as having severe damage or total destruction. Unless specified, those buildings and units that had minor damage will not be included in damage numbers. Affordability of units damaged was extrapolated using HUD CHAS data. The 2005 percentage of affordable units (under 80% of local AMI) in each parish was calculated. This percentage was used to estimate the percentage of damaged units in a parish. Given patterns of damage, particularly in New Orleans, these numbers are likely underestimates.
Slide 5 (Slide 18 in Full Document)Tax Credit Data Generated from Louisiana Housing Finance Agency Pipeline Report. Data good for July 17, 2008. Small Rental Data Data obtained from the Louisiana Recovery Authority. Data good for June 17, 2008. Flood ExtentFEMA (Sept 11, 2005 Flood Extent). Downloaded from: http://www.gismaps.fema.gov/2005pages/rsdrkatrina.shtm Pre-Storm RentersCensus 2000 Summary File 1
57
Methodology and Sources: Renters Analysis

58
Methodology and Sources: Renters Analysis (cont.)
Slide 6 (Slide 19 in Full Document)Number of pre-storm occupied units in St. Bernard: Housing Authority of New Orleans, Redevelopment Plan Summary, Attachment 5, (New Orleans, LA, November 8, 2007.)
Slide 7 (Slide 20 in Full Document)Status as of July 17, 2008.‘Units Complete’ refers to units placed in service.Units Underway’ refers to units under construction or units in developments with closed financing. ‘Financing Not Closed’ refers to units without closed financing.‘Financing Failed’ refers to units that received an allocation of tax credits but are not being built. Credits were returned to the Louisiana Housing Finance Agency for re-distribution to other developments. Slide 9 (Slide 22 in Full Document)Number of pre-storm occupied units in St. Bernard: Housing Authority of New Orleans, Redevelopment Plan Summary, Attachment 5, (New Orleans, LA, November 8, 2007.)
Slide 10 (Slide 23 in Full Document)Original allocations of developments and units to be produced by the Gulf Opportunity Low Income Tax Credit and CDBG Piggyback Program took place over three rounds in the summer and fall of 2006. For various reasons, some developments have been unable to go forward. These developments turned their tax credits into the LHFA. In some cases, the LHFA redistributed credits to developments that had applied in the 2006 rounds but had not been awarded credits. As of August 2008 the agency has $11 million in returned credits and is conducting an allocation round to distribute these credits.
Slide 13 (Slide 26 in Full Document)Percentage of units in buildings with 4 units or less: Jeffrey Meitrodt, “Rising Rents,” The Times-Picayune 15 Oct. 2006. Small Rental Repair Program was only available to landlords in Acadia, Calcasieu, Cameron, Iberia, Jefferson, New Orleans, Plaquemines, St. Bernard, St. Tammany, Tangipahoa, Terrebonne, Vermilion, and Washington parishes. Slide 14 (Slide 27 in Full Document)http://www.bestofneworleans.com/dispatch/2008-03-18/news_feat2.php

Slide 15 (Slide 28 in Full Document)Stages of the program are explained on Slide 17 (30 in Full Document). Because this program was an incentive and reimbursement program, landlords in the same stage of the program can be in very different stages of repair of their units. It is possible, but rare, for a landlord to have completed all repair prior to applying for the program. It is likely that landlords in the verification and loan approval stages to have done some repairs, but not the majority of the work needed.
Slide 18 (Slide 31 in Full Document)Percent Reliant on Rental IncomeThis refers to landlords who have rental income represent 30% or more of their total income. Seniors are applicants who are 65 years old or older. There were some applicants who did not disclose their age, they were excluded from the sample. Slide 19 (Slide 32 in Full Document)Average Rent Today U.S. Department of Housing and Urban Development, County Level Data File available at http://www.huduser.org/datasets/fmr.html. MSA refers to the Metropolitan Statistical Area, which includes the parishes of Orleans, Jefferson, Plaquemines, St. Bernard, St. Charles, St. James, St. John, and St. Tammany. Average Rent in 2005Source (2000-2005): U.S. Department of Housing and Urban Development, Fair Market Rent History 2000 to 2005 for New Orleans, LA MSA available at http://www.huduser.org/datasets/fmr/fmrs/histsummary.odb?inputname=5560.0*New+Orleans%2C+LA+MSA
WagesBureau of Labor Statistics Occupational Employment and Wage Estimates 2008.
59
Methodology and Sources: Renters Analysis (cont.)

Methodology and Sources: Homeowners AnalysisHomeowners Analysis
Slide 2 (Slide 37 in Full Document)Damage EstimatesU.S. HUD. CURRENT HOUSING UNIT DAMAGE ESTIMATES HURRICANES KATRINA, RITA, AND WILMA. February 12, 2006. Revised April 7, 2006. Analysis by the U.S. Department of Housing and Urban Development’s Office of Policy Development and Research. Data cited from Road Home officials was obtained from the website www.road2la.org last accessed on August 8, 2008. Road Home (RH) Applicants Rebuilding in Place Represents the total closed option 1 applicants in the data set provided by the Louisiana Recovery Authority for June 26, 2008. For each demographic category, there were missing cases. Therefore, figures presented throughout the report represent only those cases for which complete information was available. RaceThe race variable includes the following categories:African American = African American, African American & White, American Indian/Alaska Native/BlackNative American = American Indian/Alaska Native, American Indian/Alaska Native & White. Asian = Asian, Asian & White, Native Hawaiian/Other Pacific IslanderWhite = WhiteOther = Other Multi-Racial
Low to Moderate IncomeThis classification is determined by the proxy variable provided by the Louisiana Recovery Authority that indicates whether an applicant is eligible for the Additional Compensation Grant. A specific indication of income status was not available due to data limitations in the data set provided by the Road Home administrator, ICF International.
Slide 3 (Slide 38 in Full Document)The formula changes were implemented by two Community Development Block Grant action plan amendments. The original formula was described in Amendment 1 - The Road Home approved by the U.S. Housing and Urban Development (HUD) department on May 30, 2006. The formula was changed in the amendment entitled Substantial Clarifications to Road Home approved by HUD on August 22, 2006.
60

Slide 4 (Slide 39 in Full Document)Non-RH Rebuilding Resources This includes the sum of private and national flood insurance payments, and FEMA assistance payments. Total rebuilding resources includes Road Home grants as well.
Slide 5 (Slide 40 in Full Document)Applicants Dependent Solely on the Road Home This was determined by creating a binary variable that assigned a value of “1” to a grant recipient that applicant received that particular non-Road Home resource. A value of “0” was assigned if this was not true. These variables were created for FEMA assistance payments, private insurance, National Flood Insurance, and SBA Loans. The sum of these variables was calculated and applicants who had zero were defined as being completely dependent on the Road Home. For an explanation of how the gap was calculated, see notes for Slide 7.
Slide 6 (Slide 41 in Full Document)The formula description was adapted from the explanation found on the program’s website under Frequently Asked Questions. The website, http://www.road2la.org/homeowner/faqs.htm last accessed on August 8, 2008. Slide 7 (Slide 42 in Full Document)Average Estimated GapThis was calculated by subtracting the damage estimate used in the grant calculation from the total resources available to the recipient including the total Road Home grant. This formula was developed in collaboration with the LRA. The total grant includes a combination of the Compensation grant and the Additional Compensation grant. The damage estimate used in the grant calculation was either the Type 1 damage estimate ($130/ sq. ft. plus other costs) or Type 2 damage estimate (component by component cost to repair). These figures were provided by the Road Home program administrator, ICF International.
61
Methodology and Sources: Homeowners Analysis (cont.)

Slide 8 (Slide 43 in Full Document)Formula driven gapThis was first determined by creating a binary variable for applicants for whom the repair/rebuild ratio used in the grant determination was greater than 51% AND who had a grant calculation damage estimate that was greater than the pre-storm home value. These individuals were assigned a value of “1”, all other applicants were assigned a value of “0”. The average gap was then calculated for both categories. Slide 9 (Slide 44 in Full Document)The 30,000 ineligible and inactive applicants were based on the dataset obtained from the Louisiana Recovery Authority that included 165,419 cases. This dataset already excluded duplicate applications and other applicants who were deemed ineligible and so does not represent the full number of those that fall in this category. Program appeals statistics were drawn from the The Road Home Week 109 Situation & Pipeline Report published on August 5, 2008.
Neighborhood Profile Slides Heavily Damaged Neighborhoods and Planning DistrictsNew Orleans East = Little Woods, Pines Village, Plum Orchard, Read Blvd East, Read Blvd West, West Lake ForestGentilly = Gentilly Woods, Gentilly Terrace, St. Anthony, Pontchartrain Park, Milneburg, Lake Terrace & Oaks, Fillmore, DillardLakeview = Navarre, West End, Lakewood, Lakeview, and Lakeshore/Lake VistaLower 9th Ward = Lower 9th Ward and Holy Cross
Slide 17 (Slide 52 in Full Document)The estimated 58,000 homeowners whose damage is higher than their pre-storm home value was extrapolated using the percent of these individuals (46.7%) in this situation that was found when analyzing the 84,114 closed applicants rebuilding in place. This percent was multiplied by the total number of people who selected Option 1 (124,485) found on the Road Home website, www.road2la.org accessed on August 17, 2008.
62
Methodology and Sources: Homeowners Analysis (cont.)