
Phosphorus and Potassium Dorivar Ruiz Diaz Soil Fertility and Nutrient Management Kansas State Univ....
40
Phosphorus and Potassium Dorivar Ruiz Diaz Soil Fertility and Nutrient Management Kansas State Univ. Harper Co, Feb. 25
-
Upload
nancy-mcbride -
Category
Documents
-
view
216 -
download
0
Transcript of Phosphorus and Potassium Dorivar Ruiz Diaz Soil Fertility and Nutrient Management Kansas State Univ....
Phosphorus and Potassium
Dorivar Ruiz DiazSoil Fertility and Nutrient Management
Kansas State Univ.
Harper Co, Feb. 25
ISU
VE (0) V6 (18)
V12 (32)
V18 (47)
R1 (60)
R2 (75)
R3 (87)
R4 (98)
R5 (110)
R6 (120)
0
10
20
30
40
50
60
70
80
90
100
Growth Stage (Days After Emergence)
Per
cent
of T
otal
Upt
ake
0
20
40
60
80
100
VE(0)
V6(18)
V12(32)
V18(47)
R1(60)
R2(75)
R3(87)
R4(98)
R5(110)
R6(120)
Growth Stage (Days After Emergence)
Perc
ent o
f Tot
al U
ptak
e
GrainCobStalkLeaves
P K
P and K uptake, Corn
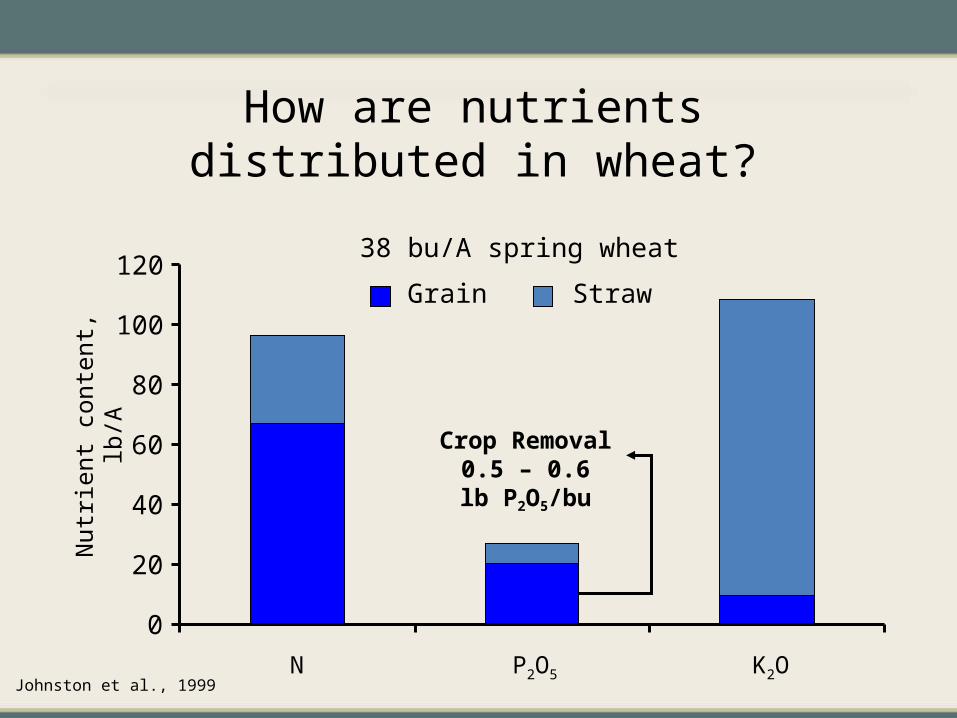
How are nutrients distributed in wheat?
Grain Straw
0
20
40
60
80
100
120
N P2O5 K2O
Nut
rient
con
tent
, lb/
A
Crop Removal 0.5 – 0.6
lb P2O5/bu
38 bu/A spring wheat
Johnston et al., 1999

Phosphorus
Functions of P in the plant
• Energy storage and transfer• ATP and ADP• Processes: respiration, photosynthesis,
active ion uptake.• DNA constituent• Required for cell division• Development of meristematic tissue• Critical early in the life of the plant
Inorganic solid-phase soil P
• Fe- Al phosphates– Occur in acid soils
• Ca phosphates– Occurs in neutral and calcareous soils
P availability in the soil
• Greater P sorption with 1:1 clay than with 2:1– Greater potential for positive charge– Presence of Fe and Al oxides.
• Soil pH– P most available at 5.5-6.5
• Organic matter– Higher P availability w/ high OM
(organophosphates complex, Al and Fe coated w/ humus)
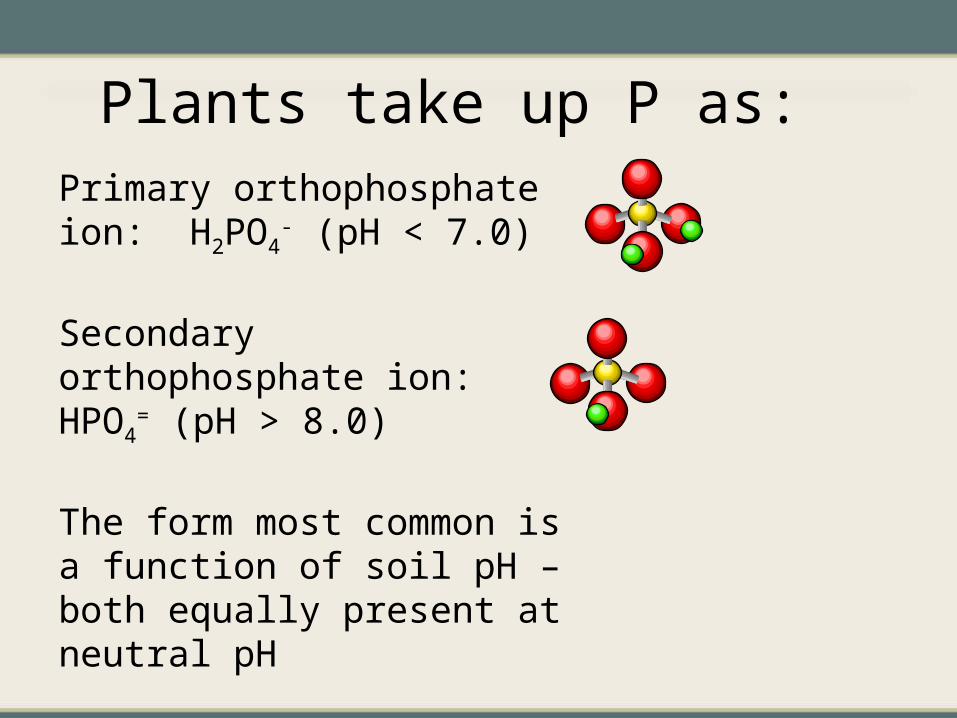
Plants take up P as:Primary orthophosphate ion: H2PO4
- (pH < 7.0)
Secondary orthophosphate ion: HPO4
= (pH > 8.0)
The form most common is a function of soil pH – both equally present at neutral pH
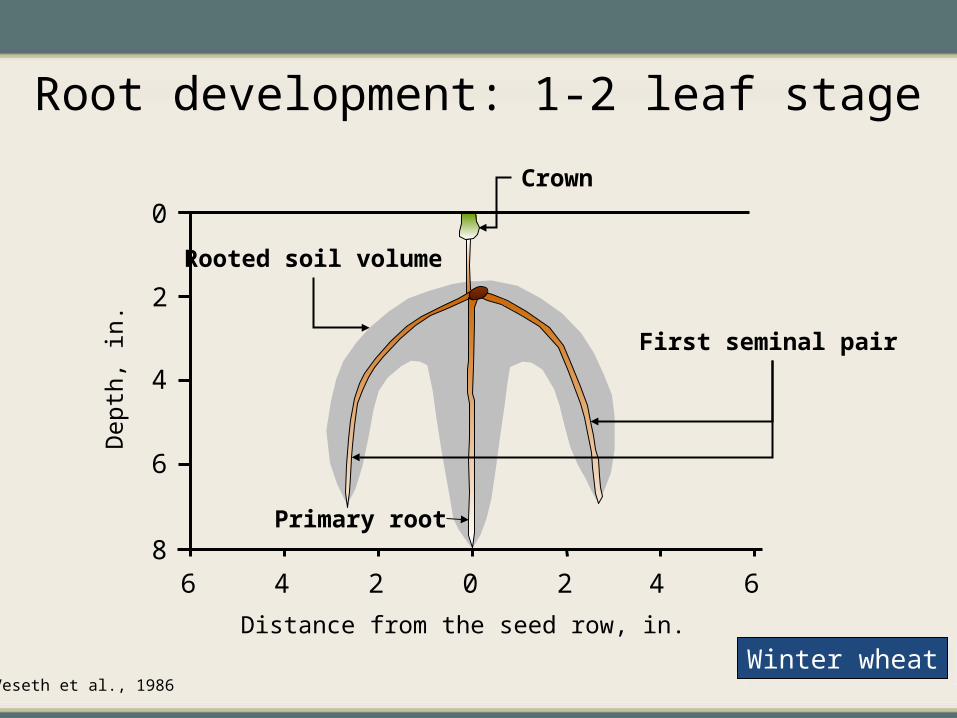
Root development: 1-2 leaf stage
Winter wheatWinter wheatVeseth et al., 1986
0
2
4
6
80246 2 4 6
Distance from the seed row, in.
Dep
th, i
n.
Primary root
First seminal pair
Crown
Rooted soil volume
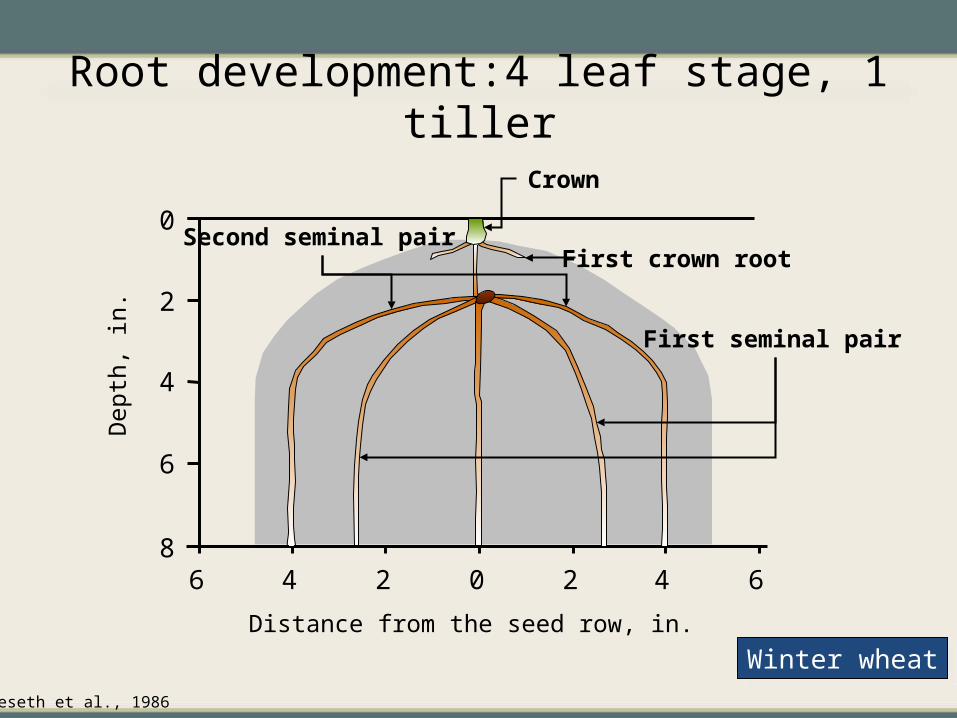
Root development:4 leaf stage, 1 tiller
0
2
4
6
80246 2 4 6
Distance from the seed row, in.
Dep
th, i
n.
Crown
Second seminal pairFirst crown root
First seminal pair
Winter wheatWinter wheatVeseth et al., 1986
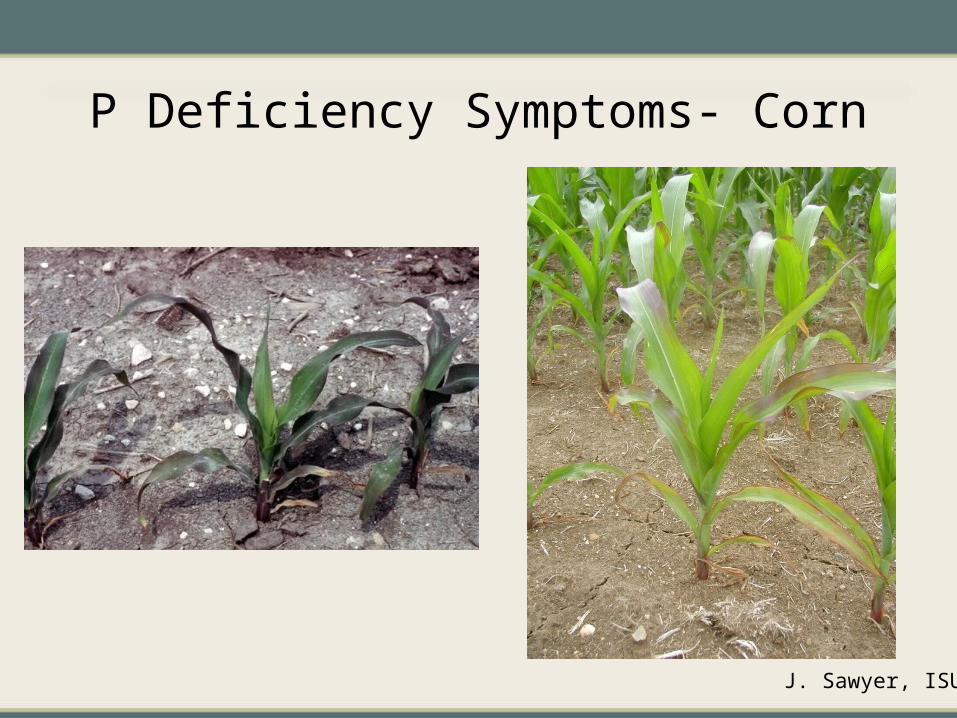
P Deficiency Symptoms- Corn
J. Sawyer, ISU
Soil Test P Soil test to know what P application rate are really
needed.
Avoid applications to fields or field areas that do not need the nutrients or lime.
Compared to the cost of nutrient and lime inputs, soil testing is inexpensive and provides a good return on investment.
Evaluate soil test results to determine Phosphorus requirements.
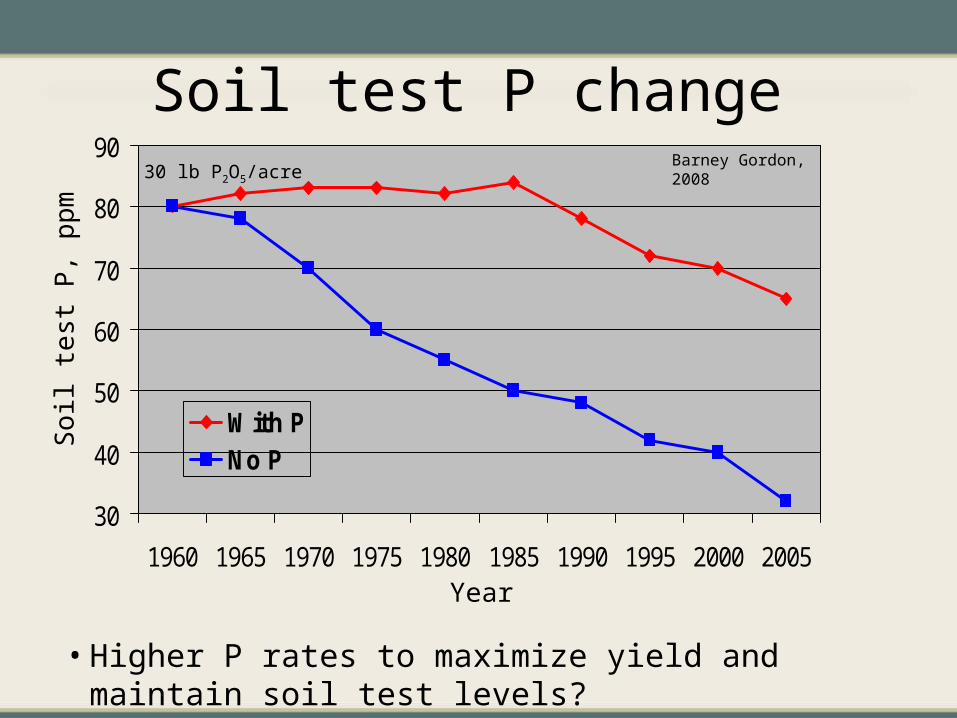
Soil test P change
• Higher P rates to maximize yield and maintain soil test levels?
30
40
50
60
70
80
90
1960 1965 1970 1975 1980 1985 1990 1995 2000 2005
With PNo P
Year
Soil
test
P, p
pm
Barney Gordon, 2008 30 lb P2O5/acre
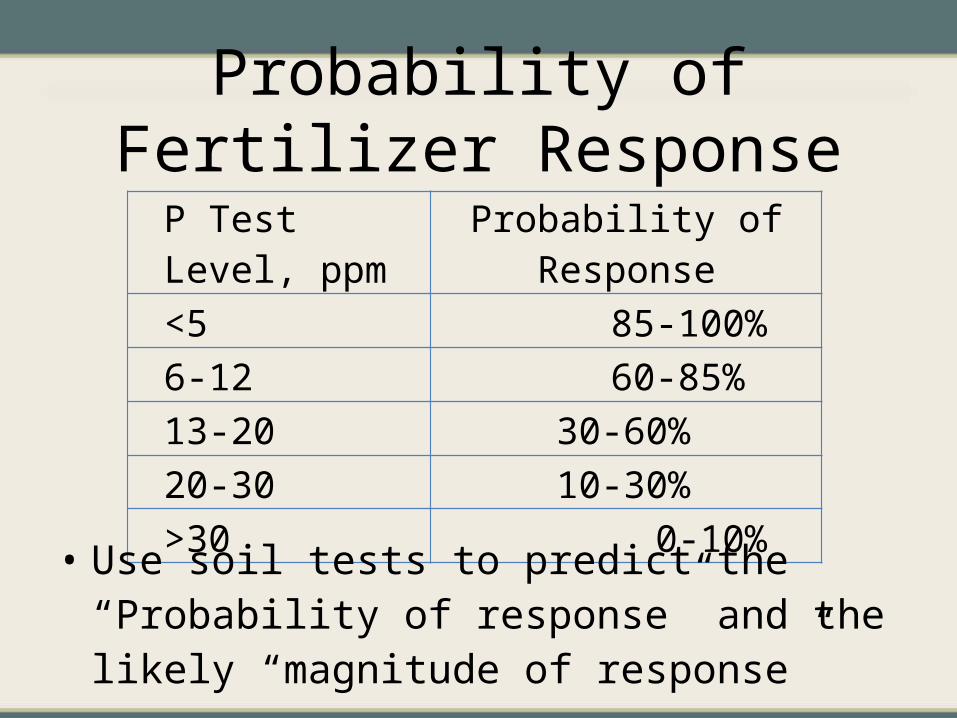
Probability of Fertilizer Response
P Test Level, ppm Probability of Response<5 85-100%6-12 60-85%13-20 30-60%20-30 10-30%>30 0-10%
• Use soil tests to predict the “Probability of response” and the likely “magnitude of response”
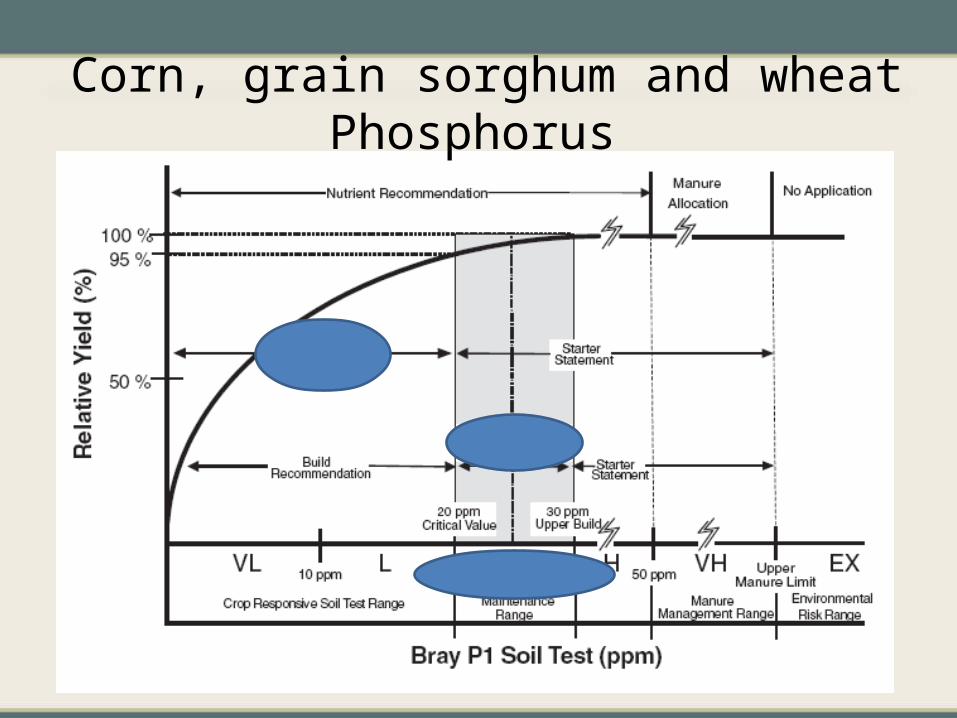
Corn, grain sorghum and wheat Phosphorus
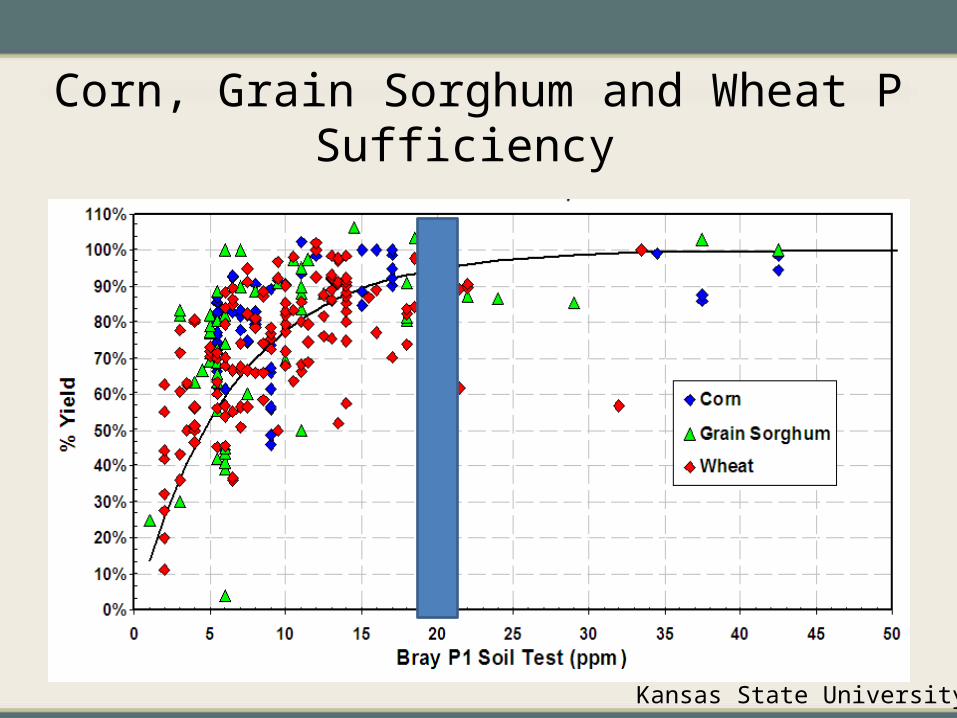
Corn, Grain Sorghum and Wheat P Sufficiency
Kansas State University

Approaches to P fertilization
• Sufficiency approach:Apply P to maximizenet returns to fertilizationin the year of application– Strategy: fertilize only
when there is a goodchance that a profitableyield response will be realized
– Soil test levels kept in lower,responsive ranges
– Normally adopted on land leasedfor short periods of time or when cash flow is limited
Rela
tive
yiel
d, %
Soil test P level
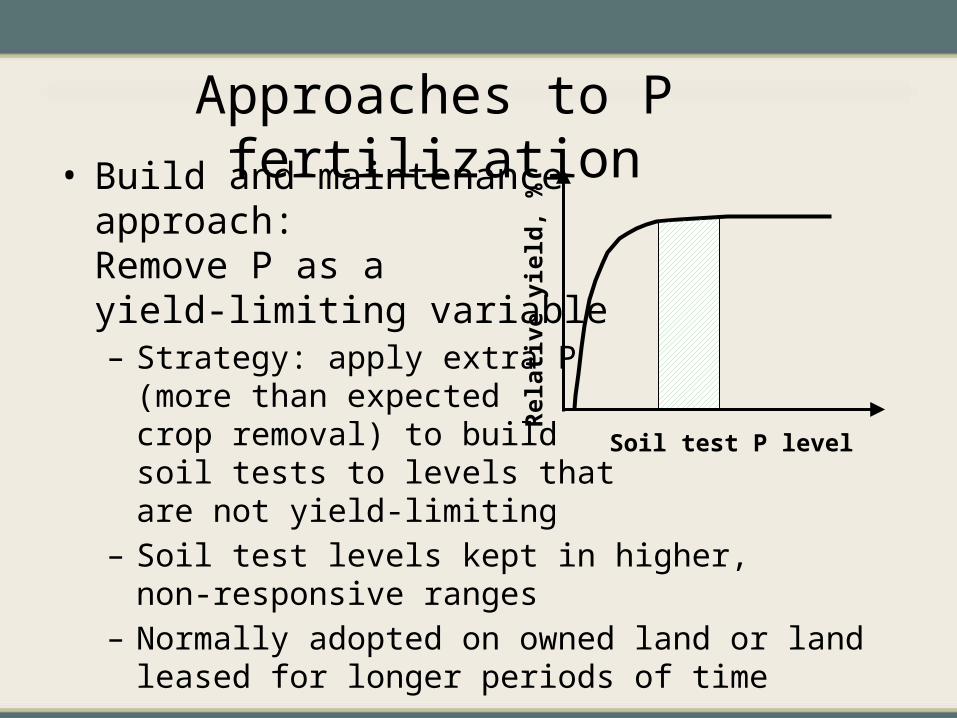
Approaches to P fertilization• Build and maintenance
approach:Remove P as ayield-limiting variable – Strategy: apply extra P
(more than expectedcrop removal) to buildsoil tests to levels thatare not yield-limiting
– Soil test levels kept in higher,non-responsive ranges
– Normally adopted on owned land or land leased for longer periods of time
Rela
tive
yiel
d, %
Soil test P level
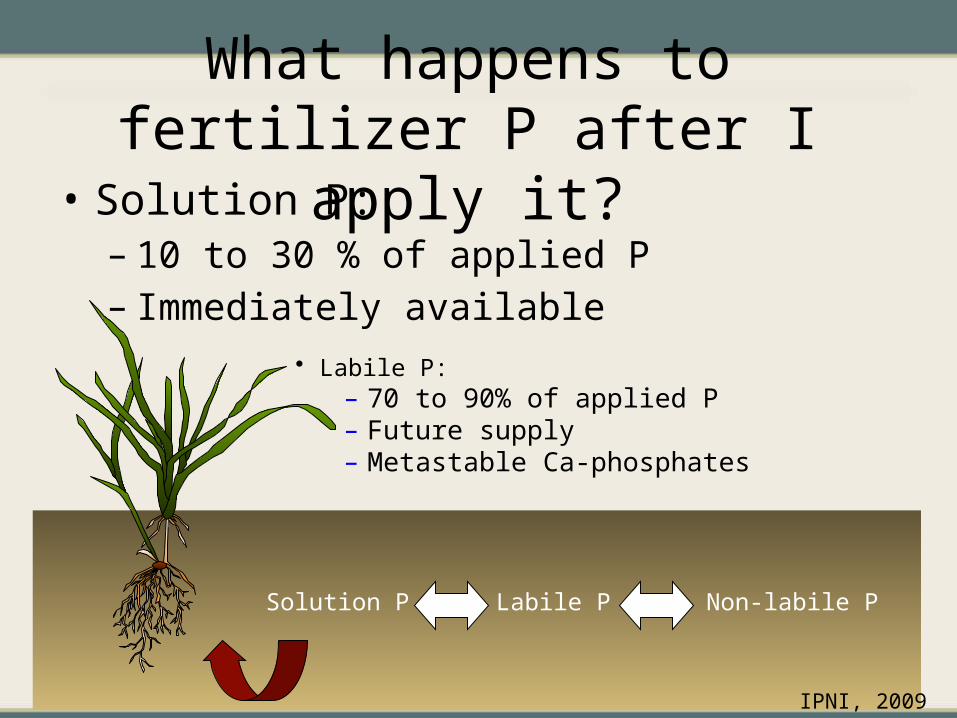
What happens to fertilizer P after I apply it?
• Solution P:– 10 to 30 % of applied P– Immediately available
Solution P Labile P Non-labile P
• Labile P:– 70 to 90% of applied P– Future supply– Metastable Ca-phosphates
IPNI, 2009
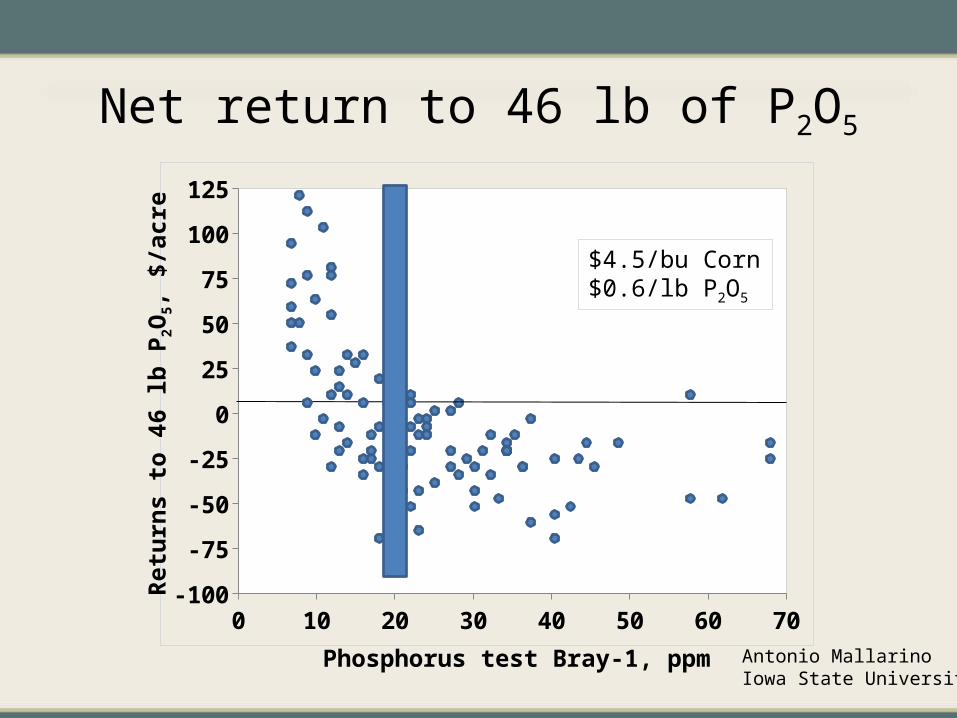
Net return to 46 lb of P2O5
0 10 20 30 40 50 60 70-100
-75
-50
-25
0
25
50
75
100
125
Antonio MallarinoIowa State University
Phosphorus test Bray-1, ppm
Retu
rns
to 4
6 lb
P2O
5, $/
acre $4.5/bu Corn
$0.6/lb P2O5
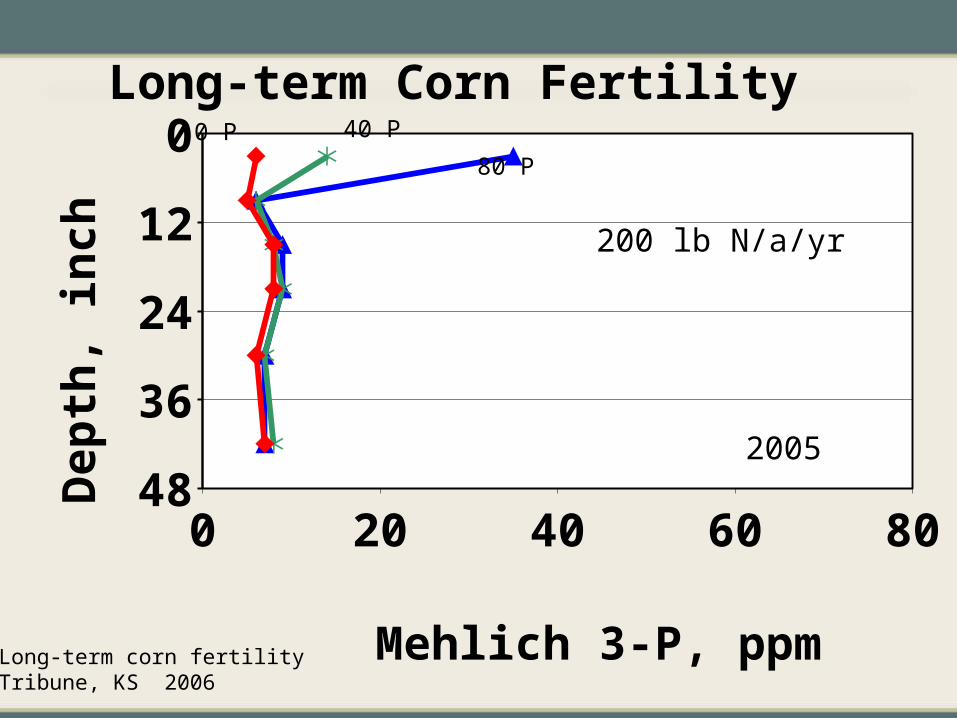
Long-term Corn Fertility
0 20 40 60 80
0
12
24
36
48
Mehlich 3-P, ppm
Dep
th, i
nch
40 P
80 P
0 P
200 lb N/a/yr
2005
Long-term corn fertilityTribune, KS 2006
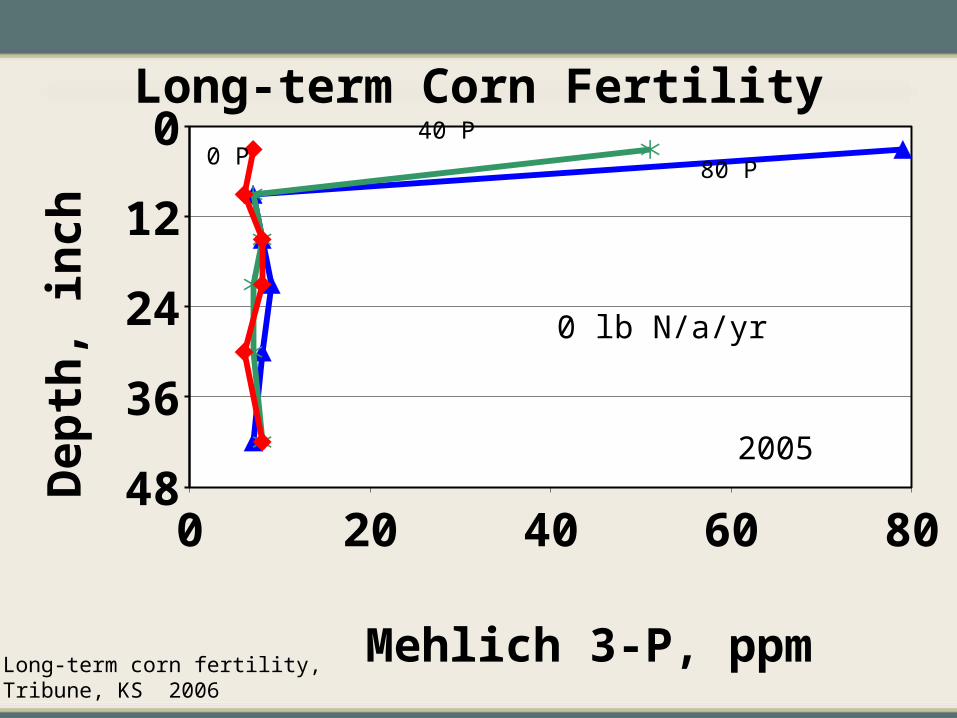
Long-term Corn Fertility
0 20 40 60 80
0
12
24
36
48
Mehlich 3-P, ppm
Dep
th, i
nch
40 P
80 P0 P
Long-term corn fertility,Tribune, KS 2006
0 lb N/a/yr
2005
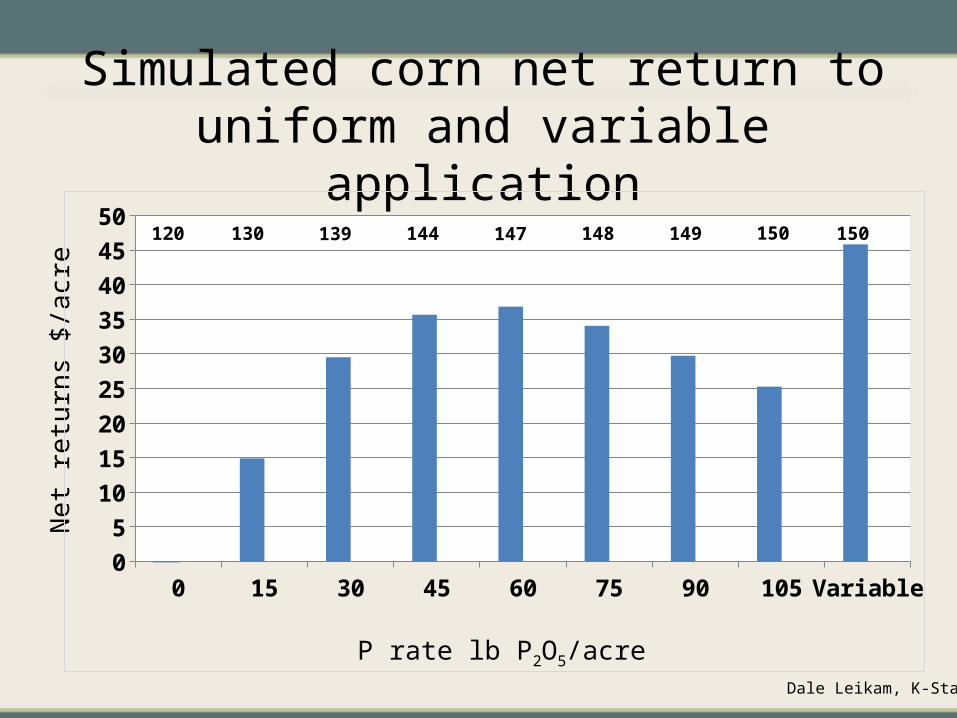
Simulated corn net return to uniform and variable application
Net
retu
rns
$/ac
re
Dale Leikam, K-State
0 15 30 45 60 75 90 105 Variable05
101520253035404550
P rate lb P2O5/acre
120 130 139 144 147 148 149 150 150
Variable rate application?Precision in the application of fertilizer is highly
dependent on the information derived soil test.
Intensive sampling program represents an increased cost over conventional sampling.
There must be an economic advantage from either increased crop yields, or reduced fertilizer costs.
Variable rate application?Identify parts of a field that could respond to higher rates
of fertilizer.
Savings from reduced fertilizer application: only if non-responsive areas of a field are identified.
Benefits can only be determined on a field-by-field basis.
The challenge is to identify opportunities for increased net income with sufficient precision without excessive cost.
Making P fertilization decisions P should be applied where the chance of yield
increase is large.
Expected yield increase is sufficient to at least pay for the applied fertilizer.
Consider, manure can supply P and K (as well as N and other nutrients)… market value has also increased with high fertilizer and fuel prices.
Manure maybe is not not available in some areas.
Potassium• Absorbed by plant as K+ ion
• Unique nutrient - not a part of any plant compound - exists in plant sap
• Functions in plant– Activation of > 60 different enzymes– Role in photosynthesis and metabolism– Conversion of N to protein (high levels required for high
protein crops)– Reduces plant disease
Potassium
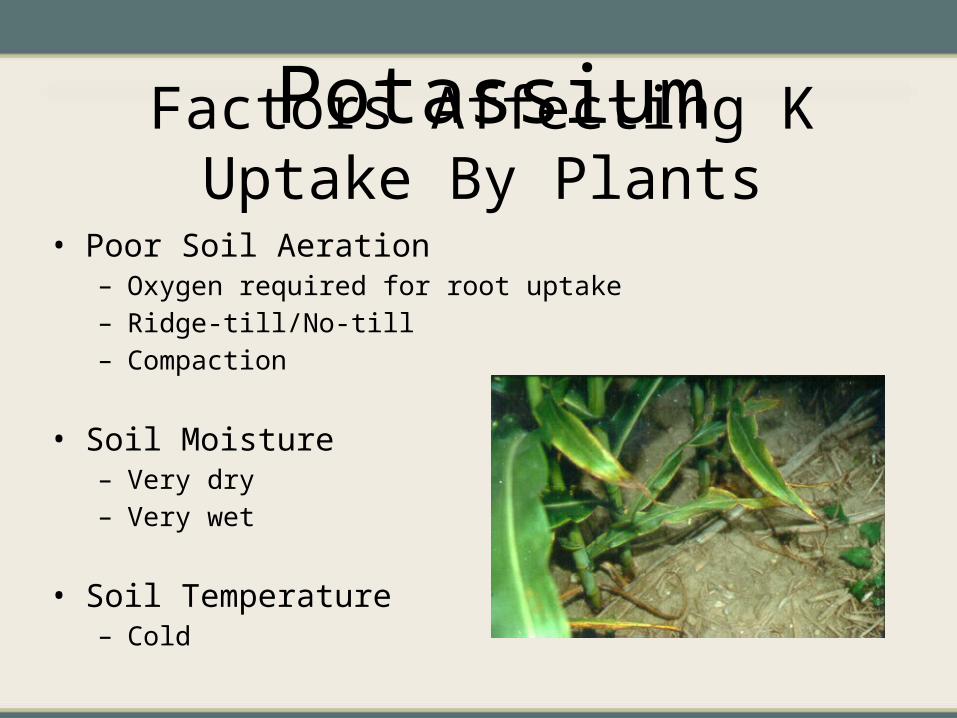
• Poor Soil Aeration– Oxygen required for root uptake– Ridge-till/No-till– Compaction
• Soil Moisture– Very dry– Very wet
• Soil Temperature– Cold
Factors Affecting K Uptake By Plants
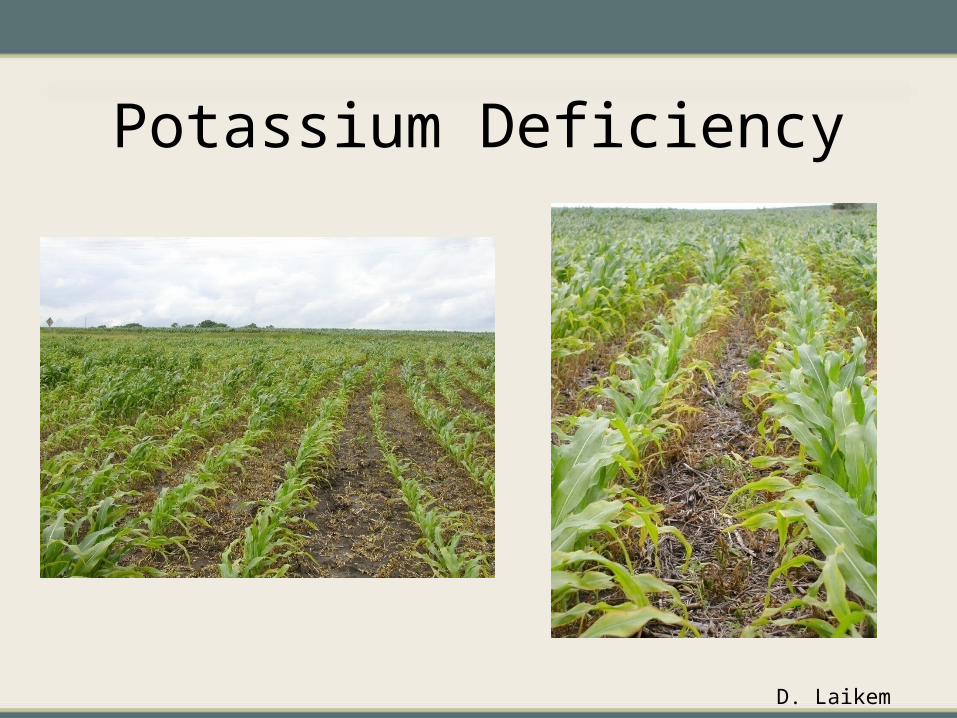
D. Laikem
Potassium Deficiency
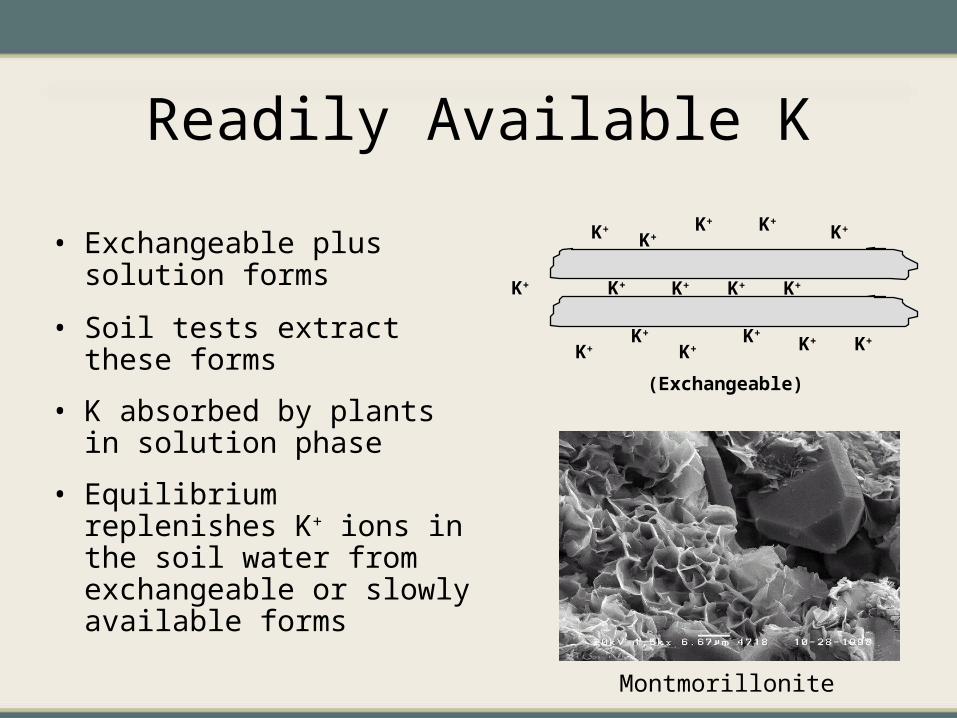
Readily Available K
• Exchangeable plus solution forms
• Soil tests extract these forms
• K absorbed by plants in solution phase
• Equilibrium replenishes K+ ions in the soil water from exchangeable or slowly available forms
K+K+
K+K+
K+ K+
K+
K+K+
K+ K+K+
(Exchangeable)
Montmorillonite
K+ K+ K+ K+
Unavailable K
• Mica, feldspar and clay minerals contain 90% to 98%
• Decompose releasing K+ ions
• Great Plains rich in K compared to eastern states with precipitation >30 inches

Potassium Recommendation
Corn Suffi ciency K Rec = [ 73 + (Exp. Yield × 0.21) + (Exch K × -0.565) + (Exp Yield × Exch K × -0.0016) ]

• If K is greater than 130 ppm then only a NPK or NPKS starter fertilizer is suggested
• If K is less than 130 ppm then the minimum K Recommendation = 15 Lb K2O/A
Manure vs Fertilizer NutrientsLarge concentration variability.N-P-K content and crop needs.Amount of N and P availability shortly after
application.Expensive storage and handling, difficulty for
uniform application.Large soil-test variability.Producer's doubts about its value.
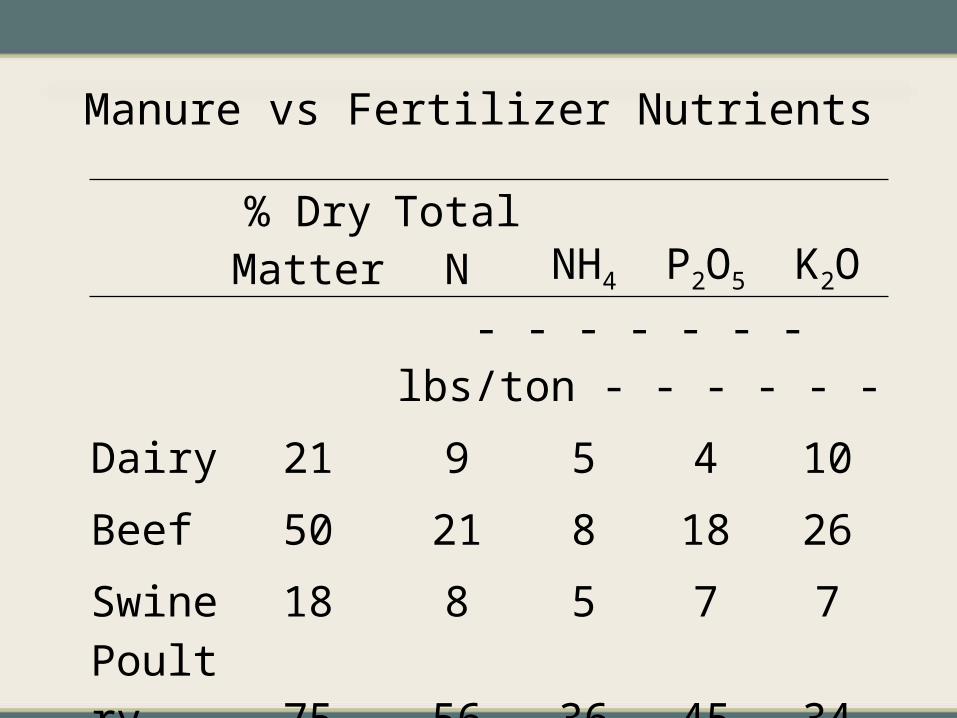
% Dry Matter Total N NH4 P2O5 K2O
- - - - - - - lbs/ton - - - - - -
Dairy 21 9 5 4 10
Beef 50 21 8 18 26
Swine 18 8 5 7 7
Poultry 75 56 36 45 34
Manure vs Fertilizer Nutrients
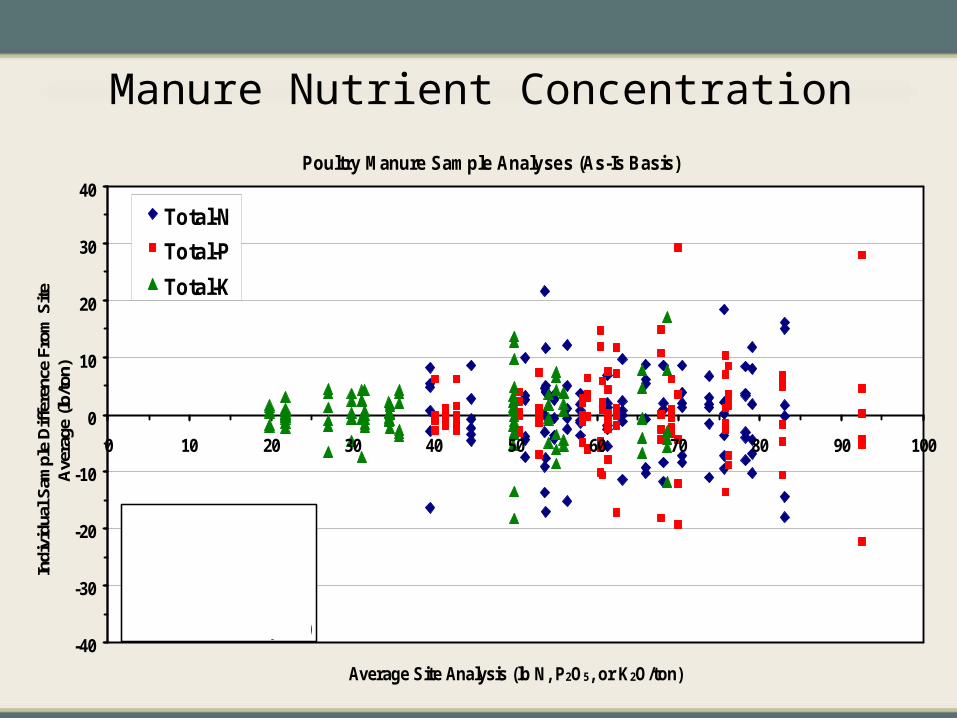
Manure Nutrient ConcentrationPoultry Manure Sample Analyses (As-Is Basis)
-40
-30
-20
-10
0
10
20
30
40
0 10 20 30 40 50 60 70 80 90 100
Average Site Analysis (lb N, P2O5, or K2O/ton)
Indi
vidu
al S
ampl
e D
iffe
renc
e Fr
om S
ite
Ave
rage
(lb
/ton
)
Total-N
Total-P
Total-K
All Site AverageN: 63 lb N/tonP: 63 lb P2O5/ton
K: 41 lb K2O/ton(18 sites, 108 samples)
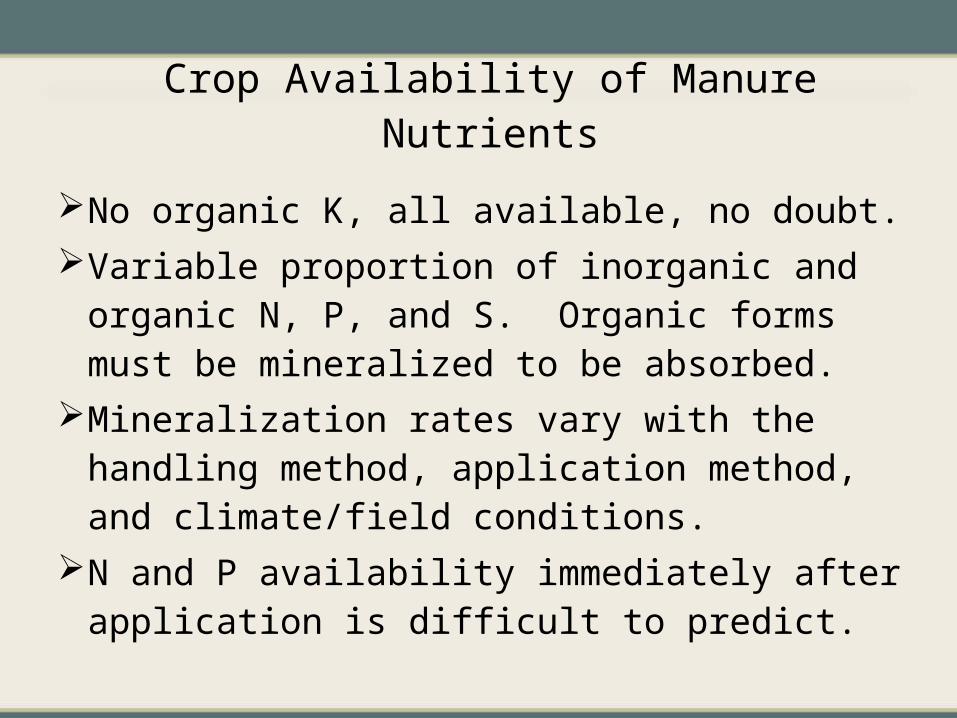
Crop Availability of Manure Nutrients
No organic K, all available, no doubt.Variable proportion of inorganic and organic N,
P, and S. Organic forms must be mineralized to be absorbed.
Mineralization rates vary with the handling method, application method, and climate/field conditions.
N and P availability immediately after application is difficult to predict.
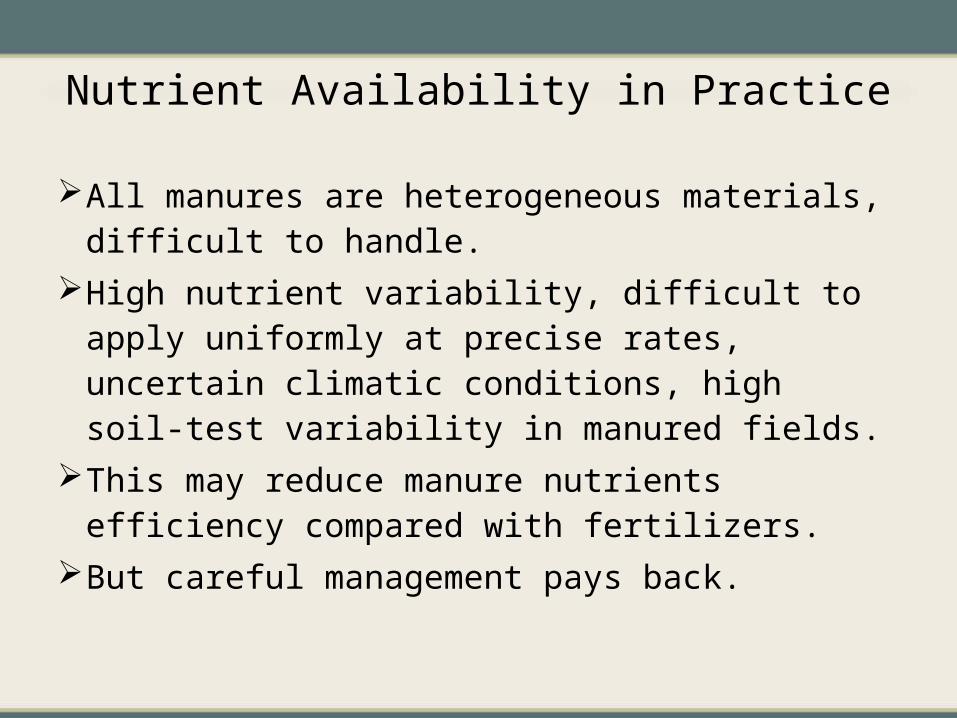
Nutrient Availability in Practice
All manures are heterogeneous materials, difficult to handle.
High nutrient variability, difficult to apply uniformly at precise rates, uncertain climatic conditions, high soil-test variability in manured fields.
This may reduce manure nutrients efficiency compared with fertilizers.
But careful management pays back.
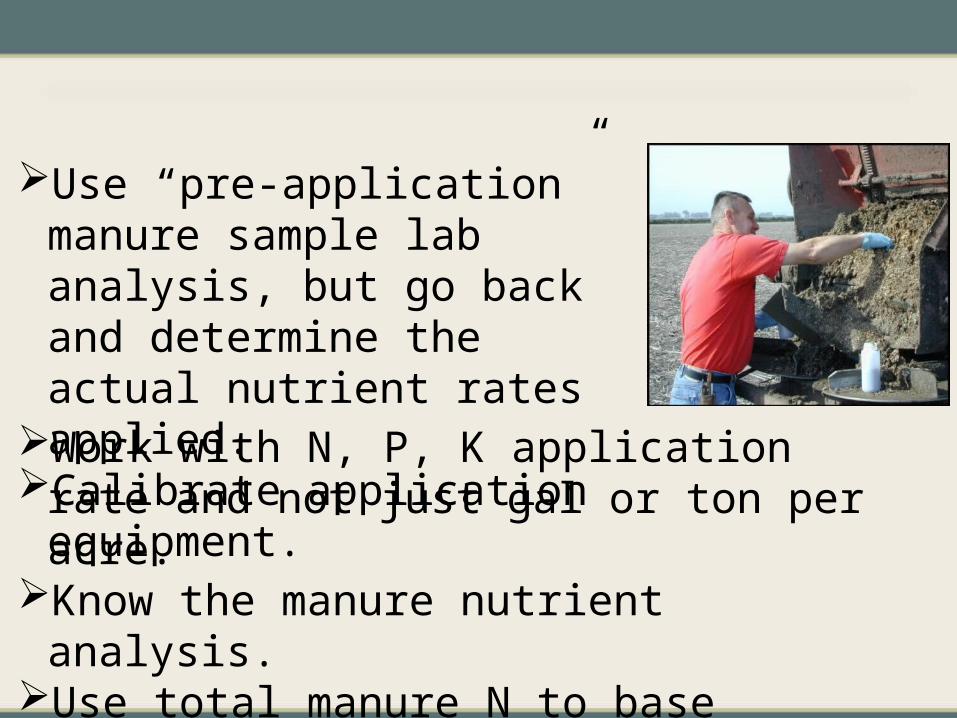
Use “pre-application” manure sample lab analysis, but go back and determine the actual nutrient rates applied.
Calibrate application equipment.Work with N, P, K application rate and not just
gal or ton per acre.Know the manure nutrient analysis.Use total manure N to base application rate.