Philippines Conditional Cash Transfer Program Impact ... · Pantawid Pamilya program implementation...
80
Document of The World Bank Report Number 75533-PH Philippines Conditional Cash Transfer Program Impact Evaluation 2012 January 22, 2013 (revised April 2014) Human Development Sector Unit East Asia and Pacific Region
Transcript of Philippines Conditional Cash Transfer Program Impact ... · Pantawid Pamilya program implementation...

Document of
The World Bank
Report Number 75533-PH
Philippines Conditional Cash Transfer Program
Impact Evaluation 2012
January 22, 2013 (revised April 2014)
Human Development Sector Unit
East Asia and Pacific Region

2
This study reports findings from the impact evaluation study conducted jointly by the Philippines
Department of Social Welfare and Development (DSWD) and the World Bank.
The team was led by Junko Onishi (WB). The team members were: Christian Deloria, Marlowe
Popes, Jennylyn Villena (DSWD) and Kirby Tardeo (WB) who worked on survey design and
field supervision; Yuko Okamura and Rashiel Velarde (WB) worked on field supervision and
provided detailed comments on several versions of the final report; Jorge Avalos (WB)
performed data cleaning and analyzed the Impact Evaluation(IE) survey data, Nazmul
Chaudhury (WB) provided oversight of data analysis and contributed to the writing of the final
report; Deon Filmer and Jed Friedman (WB) provided technical oversight throughout. Social
Weather Stations was contracted by DSWD to conduct the data collection and encoding.
Secretary Dinky Soliman of DSWD, and Jehan Arulpragasam and Nazmul Chaudhury of WB
provided overall guidance and leadership. The analysis was conducted by Junko Onishi, Jorge
Avalos, and Jed Friedman, and the final report based on all contributions was prepared by Junko
Onishi with significant inputs from Jed Friedman and Nazmul Chaudhury. Staff and consultants
of ADB and AusAID provided valuable inputs at various stages of this study.
The findings, interpretations, and conclusions expressed in this paper are entirely those of the authors and should not be attributed in any manner to the World Bank, to its affiliated organizations, or to members of its Board of Executive Directors, or the countries they represent.

3
Table of Contents
List of Tables ........................................................................................................................................ 4
List of Figures ....................................................................................................................................... 6
Acknowledgements ............................................................................................................................... 7
Glossary ................................................................................................................................................ 8
Executive Summary .............................................................................................................................. 9
Introduction ......................................................................................................................................... 14
Background ..................................................................................................................................... 14
Overview of the Pantawid Pamilya Program ................................................................................. 15
Beneficiary Selection ................................................................................................................... 15
Conditionalities and Transfers ..................................................................................................... 15
Evaluation Methodology ..................................................................................................................... 17
Evaluation Design ........................................................................................................................... 17
Survey Design and Implementation ................................................................................................ 18
Main Findings ..................................................................................................................................... 20
Program Impact on Targeted Indicators .......................................................................................... 20
Is the Program Keeping Children in School? - Program Impact on Targeted Education
Indicators ............................................................................................................................... 20
Is the Program Keeping Children Healthy? - Program Impact on Targeted Health Indicators ... 23
Is the Program Increasing Investments for the Future of the Children? - Program Impact on
Targeted Socio-Economic Indicators .................................................................................... 26
Program Impact on Non-Targeted Indicators.................................................................................. 27
Differential Impacts ..................................................................................................................... 29
Regional/Provincial Differences.................................................................................................. 29
Población versus Non-Población ................................................................................................ 31
Relative Poverty, Indigenous Peoples Status, and Gender .......................................................... 31
Summary of Conclusions and Policy Implications ............................................................................. 31
References ........................................................................................................................................... 34
Annexes............................................................................................................................................... 35
Annex 1: Sample Areas ................................................................................................................... 35
Annex 2: Sample Size Estimation ................................................................................................... 41

4
Annex 3: Evaluation Methodology ................................................................................................. 42
A. Evaluation Design ..................................................................................................................... 42
B. Survey Design and Implementation .......................................................................................... 43
Sample Size and Sample Selection .............................................................................................. 43
Timeframe of the Study................................................................................................................... 45
Annex 4: Description of the RCT Analysis and Sample ................................................................ 46
Statistical Specifications ................................................................................................................. 46
Balance Test .................................................................................................................................... 47
Robustness of Results .................................................................................................................. 48
The RCT Sample ......................................................................................................................... 48
Pantawid Pamilya Program Coverage in the RCT Sample ......................................................... 49
Characteristics of the Study Population ....................................................................................... 50
Annex 5: Description of Impact Evaluation Survey Modules ........................................................ 51
Annex 6: Items on the Consumption Module ................................................................................. 52
Annex 7: Environmental and Supply-Side Factors in the Study Areas .......................................... 54
Municipality Characteristics ........................................................................................................ 54
Barangay Characteristics ............................................................................................................. 55
Health Facility Characteristics..................................................................................................... 56
School Characteristics ................................................................................................................. 57
Annex 8: Tables .............................................................................................................................. 59
List of Tables
Table 1: Characteristics of the Sampled Households at the Time of the Household Assessment in
2008 (Sample Group 1) ................................................................................................................. 19
Table 2: Households Sampled, by Sample Group and by Province ................................................... 19
Table 3: Program Impact on Estimated Per Capita Income and Estimated Levels of Poverty .......... 27
Table 4: Comparison of Proportion of Poor Households in Set 1 Areas according to PMT and RCT
Sample Areas ................................................................................................................................ 35
Table 5: Randomized Evaluation Areas ............................................................................................. 36
Table 6: Estimated Power for Selected Outcomes in the RCT Subcomponent .................................. 41
Table 7: Balance Test Household Characteristics .............................................................................. 47
Table 8: Households Sampled, by Sample Category .......................................................................... 49
Table 9: Program Beneficiary Status Among the Poor Eligible Population ....................................... 49

5
Table 10: Households Sampled, by Sample Group and by Province ................................................. 50
Table 11: Number of Municipalities Implementing Social Programs ................................................ 54
Table 12: Village Characteristics ........................................................................................................ 55
Table 13: Characteristics of Rural Health Units ................................................................................. 56
Table 14: Services Provided by Midwives in the Villages ................................................................. 57
Table 15: Types and Numbers of School Surveyed ............................................................................ 57
Table 16: Conditions and Performance of Schools Surveyed ............................................................ 58
Table 17: Program Impact on Pre-School/Daycare Enrollment and Attendance ............................... 59
Table 18: Program Impact on Education (6 to 17 years old) .............................................................. 60
Table 19: Program Impact on Use of Maternal Health Services (for pregnancies in the previous three
years) ............................................................................................................................................. 60
Table 20: Program Impact on Maternal and Neonatal Health (for pregnancies in the previous three
years) ............................................................................................................................................. 61
Table 21: Program Impact on Malnutrition ........................................................................................ 61
Table 22: Program Impact on Feeding Practices ................................................................................ 62
Table 23: Program Impact on Use of Child Health Services .............................................................. 62
Table 24: Program Impact on Deworming of School-Aged Children ................................................ 63
Table 25: Program Impact on Household Expenditures 1 .................................................................. 63
Table 26: Program Impact on Household Expenditures 2 .................................................................. 64
Table 27: Program Impact on Expenditures on Schooling per Child ................................................. 65
Table 28: Program Impact on Social Services .................................................................................... 66
Table 29: Program Impact on Assets 1 ............................................................................................... 66
Table 30: Program Impact on Assets 2 ............................................................................................... 67
Table 31: Program Impact on Savings and Having a Bank Account ................................................. 67
Table 32: Program Impact on Savings and Having a Bank Account (Provincial Heterogeneity) ...... 68
Table 33: Program Adult Labor .......................................................................................................... 69
Table 34: Fertility Rates in the Last Three Years by Age Group, by Treatment and Control ............ 69
Table 35: Program Impact on Household Expenditures 1 (Provincial Heterogeneity) ...................... 70
Table 36: Program Impact on Household Expenditures 2 (Provincial Heterogeneity) ...................... 71
Table 37: Program Impact on Child Health (Provincial Heterogeneity) ............................................ 72
Table 38: Program Impact on Education Indicators (Provincial Heterogeneity) ............................... 73
Table 39: Program Impact on Access to Bank Account (Heterogeneity for Location of Residence) 74
Table 40: Robustness Test Applying Instrumental Variables (Reported Beneficiary Status) ............ 75

6
Table 41: Robustness Test Applying Instrumental Variables (Beneficiary Status According to
Program Database) ........................................................................................................................ 76
Table 42: Robustness Test Applying Instrumental Variables (Reported Beneficiary Status) ............ 77
Table 43: Robustness Test Applying Instrumental Variables (Reported Beneficiary Status) ............ 78
Table 44: Robustness Test Applying Instrumental Variables (Reported Beneficiary Status) ............ 79
Table 45: Robustness Test Applying Instrumental Variables (Beneficiary Status According to
Program Database) ........................................................................................................................ 80
List of Figures
Figure 1: Percentage of Children Enrolled in School by Age Group ................................................. 20
Figure 2: Percentage of Children Regularly Attending School by Age Group .................................. 21
Figure 3: Percentage of Children Enrolled in School by Age ............................................................ 22
Figure 4: Proportion of Poor Mothers Using Antenatal and Postnatal Care....................................... 23
Figure 5: Proportion of Poor Mothers Using Delivery Services......................................................... 24
Figure 6: Proportion of Malnourished among 6-36 Month Olds ........................................................ 25
Figure 7: Proportion Used Child Health Services by Province .......................................................... 30
Figure 8: Illustration of RCT Approach to Impact Evaluation ........................................................... 43

7
Acknowledgements
This study reports findings from the impact evaluation study conducted jointly by the Philippines
Department of Social Welfare and Development (DSWD) and the World Bank.
DSWD invested tremendous effort and resources into the impact evaluation and it ensured that
Pantawid Pamilya program implementation adhered to the randomization design and postponed
phasing in of the program in control areas until after the evaluation survey was completed.
DSWD Secretary, Corazon Juliano-Soliman, Undersecretaries Alicia R. Bala, Mateo G. Montaño,
Parisya Taradji, and their dedicated teams including those at the Pantawid Pamilya National
Program Management Office (NPMO) and its Monitoring and Evaluation Unit contributed
significantly to the IE study design and implementation.
This is report presents analysis of data collected through the impact evaluation. This is first of a
three part Impact Evaluation series, coordinated jointly with the Department of Social Welfare
and Development (DSWD), the World Bank, AusAID, and the Asian Development Bank (ADB).
Special thanks go to the members of the Social Protection Team in the Philippines, including
Luisa Patricia Fernandez Delgado, Shanna Elaine Rogan, Yuko Okamura, and Rashiel Velarde,
for their feedback throughout the study, as well as the EXT team in the Philippines including
Leonora Aquino Gonzales, Moira Enerva, and David Llorico Llorito who provided valuable
support throughout.
Social Weather Stations implemented the field survey, deploying around 180 enumerators and
researchers for this tremendous data collection effort. DSWD, the World Bank and AusAID
extend thanks to the respondents from the 3,472 interviewed households, as well as to mayors,
barangay captains, school principals, doctors, and midwives who spent time with the
interviewers and provided valuable information for the survey.
This report benefited tremendously from the comments of peer reviewers, including Margaret
Grosh, Emmanuel Skoufias, and Owen Ozier (World Bank). Comments were also received from
Tarcisio Castañeda, Andrew Parker (AusAID), Vic Paqueo, Hyun H. Son, and Chris Spohr
(Asian Development Bank).
Editorial assistance for this report was provided by Minna Hahn Tong. Kristine May San Juan-
Ante, Corinne Bernaldez, and Rebecca Aquino provided valuable administrative support.

8
Glossary
ADB Asian Development Bank
ANC Antenatal Care
APIS Annual Poverty Indicator Survey
ARI Acute Respiratory Infection
AusAID Australian Aid
BCG Bacillus Camette-Guerin, vaccine for tuberculosis
BHS Barangay Health Station
BHW Barangay Health Worker
CCT Conditional Cash Transfer
CVS Compliance Verification System
DepEd Department of Education
DOH Department of Health
DSWD Department of Social Welfare and Development
FDS Family Development Session
FIES Family Income and Expenditure Survey
FY Fiscal Year
IE Impact Evaluation
IP Indigenous People
NAPC National Anti-Poverty Commission
NDHS National Demographic and Health Survey
NFA National Food Authority
NHTS-PR National Household Targeting System for Poverty Reduction
NSCB National Statistics Coordination Board
MDGs Millennium Development Goals
MIS Management Information System
MNCH Maternal, Neonatal, and Child Health
M&E Monitoring and Evaluation
Pantawid Pamilya
Pilipino Program
Philippines CCT program, the Pantawid Pamilya program formerly known
as 4Ps
PhilHealth Philippines Health Insurance Corporation
PhP Philippine Peso
PMT Proxy Means Test
PNC Postnatal Care
RCT Randomized Control Trial
RD Regression Discontinuity
RHU Rural Health Unit
SWS Social Weather Stations
WB World Bank

9
Executive Summary
The Pantawid Pamilyang Pilipino Program provides cash transfers to poor households,
conditional upon investments in child education and health as well as use of maternal
health services. The objective of the program is to promote investments in the education
and health of children to help break the intergenerational transmission of poverty, while
providing immediate financial support to the household. Poor households are identified by
the National Household Targeting System for Poverty Reduction (NHTS-PR) based on a
transparent poverty targeting mechanism, using a statistical model1
to estimate income.
Households with estimated income below the poverty line are classified as poor. From that
database of poor households, Pantawid Pamilya identifies and selects eligible households who
have children 0-14 years of age and/or a pregnant woman. These households then receive cash
grants every two months ranging from PhP 500 to PhP 1,400 per household per month,
depending on the number of eligible children.
Since its launch in 2008, Pantawid Pamilya has been scaled up rapidly and has become the
cornerstone of the Government’s social protection efforts. This conditional cash transfer
(CCT) program has been an important part of a renewed effort to address chronic poverty and
meet the Millennium Development Goals (MDGs) to eradicate extreme poverty and hunger,
achieve universal primary education, promote gender equality, reduce child mortality, and
improve maternal health (DSWD, 2009). By May 2012, the program covered approximately 3
million households. It accounted for half of the Government’s expenditures on national social
protection programs in 2011.
The specific objectives of the program are to: (i) keep children in school, (ii) keep children
healthy, and (iii) invest in the future of children. It reflects the Government’s commitment to
promoting inclusive growth by investing in human capital to improve education and health
outcomes for poor children and pregnant women. The program is based on the premise that
poverty is not about income alone but is multi-dimensional, and factors such as access to basic
social services and social environments matter.
A carefully designed, comprehensive, and rigorous impact evaluation was conducted, as the
first of a three-wave evaluation study to assess the program’s initial effectiveness in
achieving its objectives. As part of the Government’s commitment to evaluating its
development programs, an impact evaluation for Pantawid Pamilya was designed and
implemented from the very initial stages of program planning. The study was designed to
represent the first implementation phase (known as Set 1 which took place between June 2008
and April 2009) of the program, since the program’s scale-up plan was not yet in place at the
time of study design.
This report presents the findings from an analysis that assessed program impact by
comparing outcomes in areas that received Pantawid Pamilya with outcomes in areas that
did not receive the program. The impact evaluation applied two analytical methods: (i)
Randomized Control Trial (RCT), which compared randomly assigned program areas and non- 1 Known as Proxy Means Testing (PMT).

10
program areas to assess program impact, and (ii) Regression Discontinuity Design, which
compared the outcomes of poor households who received the program with similar poor
households just above the poverty line. This report presents the findings from the RCT
component only. It should be noted that although 2.5 years of program implementation is
generally considered enough time to observe impacts on short-term outcomes, it is not long
enough to assess impacts on long-term outcome measures.
The findings of the impact evaluation support administrative and other assessments2 that
have found that Pantawid Pamilya is reaching most of its key objectives. The impacts found
through this study are comparable to the levels of impact found in other CCT programs around
the world at this stage of program maturity, particularly in terms of the program’s achievements
in improved health service use and school enrollment.
Findings of the study indicate that, overall, the program is meeting its objective of helping
to keep poor children in school, by increasing enrollment among younger children (3-11
years old) and increasing attendance among 6-17 year olds. The study found higher rates of
school enrollment among children 3-11 years of age in the beneficiary households (by 10
percentage points for 3-5 year olds and by 4.5 percentage points for 6-11 year olds), compared to
poor households who did not receive the program. In particular, the program has been successful
in boosting the enrollment of primary-aged children (6-11 years old), helping to bring about near
universal enrollment of 98 percent enrolled in school among this age group3. Considering that
this study group only includes poor children, this achievement is highly commendable. School
attendance improved for all age groups across the beneficiary households, except for the
youngest preschool/daycare age group.
However, the findings suggest that the program has not had a significant impact on
increasing enrollment among older children aged 12-17 years old. The program was not
explicitly designed to improve schooling of children above age 14, given that is the age limit for
education grants. However, the program was unable to even improve enrollment of children 12-
14 years of age, who are currently covered under Pantawid Pamilya. Thus, the program as
currently designed is unable to keep older children in school, although it is also likely that
subsequent waves of the impact evaluation may find improvements in school enrollment among
children of 15 years old and above as the cohorts of Pantawid beneficiaries grow older. At the
same time, the finding also implies that program should consider expanding coverage to older
children, and also reconsider the current five year limit of program eligibility, if long term
human capital investments are to be sustained.
The program was found to be meeting its objective of helping to keep poor children healthy.
The program has helped improve the long-term nutritional status of younger children (6-36
months old), a positive impact not seen in other CCT impact evaluations at such an early stage of
2 Studies include those that looked at program impact on education by Chaudhury and Okamura (Chaudhury &
Okamura, 2012) and Manasan (Manasan, 2011). 3 In this study, school enrollment is defined by age group and not by DepEd normative age as the CCT program
monitors school attendance of children 3 years old to 14 years old receiving the education grants, regardless of the
level of school or grade the child is attending.

11
program implementation. The improvement was a 10 percentage point reduction in severe
stunting4
(which may reflect a combination of factors such as better maternal care and
environment during pregnancy and after delivery as a result of increased antenatal and postnatal
care) compared to barangays that did not receive the program, where 24 percent of young
children (6-36 months old) were severely stunted. This improved long-term nutritional status was
achieved through the program enabling parents to provide better care for their children in a
consistent manner and feed their children more protein-rich food such as eggs and fish.
Reduction in severe stunting among this young age group is expected to have strong long-term
benefits, as stunting in the first two years of life is known to lead to irreversible damage
including lower educational attainment, reduced adult income, and decreased offspring birth
weight (Cesar G Victora, 2008). The program has also encouraged poor women to use maternal
and child health services such as antenatal care, postnatal care, regular growth monitoring, and
receipt of Vitamin A and deworming pills. In addition, it has helped increase healthcare-seeking
behaviors among beneficiaries when their children become ill.
The program is also achieving its objective of enabling poor households to increase their
investments in meeting the health and education needs of their children. Pantawid Pamilya
is changing the spending patterns of poor households, with beneficiary households spending
more on health and education than poor households who had not received the program. The
study also found that beneficiary households spent less on adult goods such as alcohol and that
the program may have contributed to increased savings among beneficiary households.
Although the study found that the cash grants were reaching beneficiaries, the study did
not find an overall increase in per capita consumption among the poor benefiting from the
program, although there was some evidence that poor households are saving more in
certain provinces. The lack of impact on mean consumption is not unusual for CCT programs at
a relatively early stage of implementation with programs finding impact on mean consumption as
the program matures. The estimated per capita consumption per day reported by the sampled
households was PhP 46 per day in both program and non-program barangays, while program
beneficiaries in the study reported receiving PhP 5 per day (equivalent to US$ 0.11 a day)5,
representing approximately 11 percent of the households’ per capita consumption.
Internationally, the largest transfer amount was in Nicaragua with the transfer representing about
30 percent of consumption, Mexico about 20 percent of consumption, and Brazil about 8 percent
of consumption (Fiszbein, et al., 2009). Therefore, there is a wide gap between the benefit
amounts beneficiaries are eligible for—an estimated 23 percent of income, which is relatively
generous—and the amounts that beneficiary households actually receive, which are relatively
small compared to those in most other CCT programs around the world. This gap could be
minimized by working on three areas: improving beneficiaries’ compliance rates to program
conditionality; regularly updating program database to reflect schools and health facilities
4 Measured as height-for-age <-3SD applying the WHO Child Growth Standard
(http://www.who.int/childgrowth/software/en/) accessed March 9, 2012 5 The reported amounts received from Pantawid Pamilya by beneficiary households are approximately the same as
those reported by the program’s operational process evaluation called Spot Checks (Social Weather Stations, July
2012).

12
beneficiaries attend to be effectively link meeting of conditionality to payments; and ensuring
that all schools and health facilities report on compliance verification to the program.
The study found that Pantawid Pamilya has had positive impacts beyond its originally
targeted objectives. For example, the program has contributed to increased coverage of the
PhilHealth health insurance program. More poor households in areas that received Pantawid
Pamilya reported that they were covered by PhilHealth, compared to their counterparts in non-
Pantawid areas.
The findings of the impact evaluation also indicate that the program has not affected
decisions to work or fertility rates. Despite the additional household income provided to poor
families under Pantawid Pamilya, the impact evaluation did not find any evidence that
beneficiary households worked less or made less effort to obtain more work. The study also
found that women in the beneficiary households are not having any more children than women in
non-beneficiary households.
Although the sampling was not designed to be statistically representative at the provincial
level, the findings suggest that program impacts differ by province. The study found
considerable differences in program impact on household socioeconomic, child health, and
education outcomes across the four provinces. Across most outcomes, Negros Oriental
consistently showed the most positive and strongest program impacts, while Lanao del Norte
consistently showed weaker impacts than other provinces. Although there are several potential
reasons for such differences such as effectiveness in program implementation, supply-side
differences, and other socio-environmental factors, further research is needed to better
understand the reasons behind these differences.
Although the impact evaluation found evidence of success on a broad range of outcomes,
the results also revealed a number of challenges for Pantawid Pamilya going forward.
Pantawid Pamilya is designed primarily to increase demand among poor families for education
and health services. To achieve overall improvements in education and health outcomes,
however, the study findings highlight the need to intensify efforts to improve access to and
quality of health and education services for CCT beneficiaries. For example, although more
children are visiting health centers to meet the program conditionality of regular growth
monitoring, the study did not find an increase in childhood immunization coverage—although
not uncommon in impact evaluations around the world—which suggests that health providers are
not yet able to fully capitalize on the opportunities to provide basic child health services to CCT
families.
The study findings point to a number of policy implications:
To improve educational outcomes for older children, additional measures such as
expanding the age of coverage of Pantawid Pamilya, increasing the grant amount for
older children, and parallel supply-side interventions in the education sector are required;

13
Currently households can be enrolled in the program for a maximum of five years.
Expanding the duration of coverage will not only help to keep children in school longer,
it will also help to increase household consumption;
Linkages and coordination with health service providers need to be strengthened to
ensure that beneficiary mothers and children receive the services they require and to
ensure a continuum of care;
It is important to consider ways in which other social programs that may have a long-
term impact on the welfare of the poor could take advantage of Pantawid Pamilya’s
strong and effective social mobilization structure; and
To ensure more efficient program implementation, the reasons for differences in program
impact across geographical areas must be better identified and understood.

14
Introduction
Background
1. Despite a modicum of economic growth (average 4 percent) over the past decade,
the Philippines has not seen a reduction in the poverty rate. In this regard, the Philippines is
an outlier in the region, which has experienced a rapid decline in poverty. According to the latest
available poverty data from the 2009 poverty estimates from the Family Income and Expenditure
Survey (FIES), the Philippines is home to around 23.1 million poor people.6 This figure is
equivalent to over a quarter of the country’s total population.
2. The Philippines also lags in progress toward key Millennium Development Goal
(MDG) targets, primarily due to large inequalities in health and education outcomes
between income groups and across regions. Although the Philippines is currently on target to
achieve the child mortality MDG, the poverty, universal primary education, and maternal and
reproductive health goals are not likely to be achieved by 2015. In education, almost one-fifth of
school-aged children in the lowest income quintile are not in school, compared to only 2 percent
for the highest income quintile. Evidence also indicates that the geographic inequity observed in
the 1990s has persisted into the 2000s and possibly worsened (World Bank; AusAID, 2012).
Similarly, large income-related disparities can be seen in health. The skilled birth attendance rate
among the highest income quintile is 94 percent, with 84 percent occurring in a health facility,
compared to only 25 percent and 13 percent, respectively, among the lowest income quintile.
Coverage of childhood immunization is only 70 percent among the lowest quintile, compared to
84 percent for the highest quintile (World Bank, 2011).
3. To help address these issues, the Government launched a conditional cash transfer
(CCT) program called the Pantawid Pamilyang Pilipino Program (or Pantawid Pamilya),
which has become the cornerstone of the Government’s social protection efforts. The
program provides cash transfers to supplement the income of poor households in selected
municipalities, subject to their compliance with conditionality related to education and health.
The program was launched in February 2008 with 6,000 household beneficiaries in four pilot
municipalities and two cities. Since then, the program has been scaled up rapidly, covering
approximately 3 million households by May 2012. As of 2011, Pantawid Pamilya accounted for
half of the Government’s expenditures on national social protection programs, equivalent to 1.64
percent of total government spending net of debt financing (World Bank, forthcoming).
4. The overall objective of this CCT program is to help poor households with short-
term consumption needs, while promoting investments in the education and health of their
children to help break the intergenerational transmission of poverty. The specific objectives
of the program are to: (i) keep children in school, (ii) keep children healthy, and (iii) invest in the
future of children. The program has been an important part of a renewed effort to address chronic
poverty and meet the MDGs to eradicate extreme poverty and hunger, achieve universal primary
6 National Statistical Coordination Board website http://www.nscb.gov.ph/poverty/2009/table_7.asp (accessed
December 5, 2012)

15
education, promote gender equality, reduce child mortality, and improve maternal health (DSWD,
2009), with the premise that poverty is multidimensional and not just about income alone. It
embodies the Government’s commitment to promoting inclusive growth by investing in human
capital to improve education and health outcomes for poor children and pregnant women.
5. A rigorous impact evaluation was conducted to assess the program’s effectiveness in
achieving the program’s specific objectives to date. This study aims to address the question: is
Pantawid Pamilya enabling poor households to (i) keep their children in school; (ii) keep their
children healthy; and (iii) increase investments in their children? As part of the Government’s
commitment to evaluating its development programs, a three-wave impact evaluation for
Pantawid Pamilya was designed and implemented from the very initial stages of program
planning. The impact evaluation applies two analytical methods: Randomized Control Trials
(RCT) and Regression Discontinuity Design. This report presents the findings from the RCT
component of the study, which compared outcomes in areas that received Pantawid Pamilya
with outcomes in areas that did not receive the program.7
Overview of the Pantawid Pamilya Program
Beneficiary Selection
6. Beneficiaries for Pantawid Pamilya are selected through a combination of
geographical targeting and the proxy means testing (PMT) method, known as the National
Household Targeting System for Poverty Reduction (NHTS-PR). Once program
municipalities are defined, beneficiary households are selected through the PMT. The PMT,
centrally designed in 2007 and implemented starting in 2008 by DSWD, predicts household
income using observable and verifiable variables that are highly correlated with household
income. Relevant variables for the PMT model were selected based on an analysis of two
household surveys in the Philippines, the Family Income and Expenditure Survey (FIES) and
Labor Force Survey (LFS) of 2003. Through NHTS-PR, households are categorized as poor if
the predicted income is below the official provincial poverty threshold (Fernandez, 2012).
Among the poor households in program areas, eligible households—those with a pregnant
mother at the time of the Household Assessment by NHTS-PR and/or children between 0-14
years of age—are invited to enroll in the program by attending the community assembly.
Conditionality and Transfers
7. Beneficiary households must comply with specific health and education
conditionalities in order to receive cash transfers through the program. The conditionality,
applicable to poor households with children 0-14 years of age or pregnant women, as well as the
corresponding transfers are as follows:
7 The RD study covered an additional 4,156 households in five provinces and 23 municipalities, with the view that
RD will be the main analytical method applied for Pantawid Pamilya in the future. The findings of the RD study
will be presented separately.

16
8. Health Grants. The health grant is aimed at promoting healthy practices, improving the
nutritional status of young children, and increasing the use of health services. Poor households
with children 0-14 years old and/or pregnant women receive a lump sum amount of PhP 500
(about US$ 11) per household per month. Households must fulfill the following conditions for
the health transfer: (i) all children under the age of five follow the Department of Health (DOH)
protocol by visiting the health center or rural health unit regularly; (ii) pregnant women attend
the health center or rural health unit according to DOH protocol; (iii) all school-aged children (6-
14 years old) comply with the de-worming protocol at schools; and (iv) for households with
children 0-14 years old, the household grantee (mother) and/or spouse shall attend Family
Development Sessions at least once a month.
9. Education Grants. The education grant is aimed at improving school attendance of
children 6-14 years old living in poor households in selected areas. The education transfer is PhP
300 (about US$ 6.50) per child per month (for a period of 10 months/year), for up to a maximum
of three children. Beneficiary households receive the education transfer for each child as long as
they are enrolled in primary or secondary school and attend 85 percent of the school days every
month.8
10. Benefit levels for Pantawid Pamilya are relatively generous compared to those of
other CCT programs around the world. If a beneficiary household meets all the program
conditions, the maximum amount of monthly household grants to which they are entitled is PhP
1,400 (US$ 32), estimated to be about 23 percent of the beneficiaries’ income. Whether the
beneficiaries will receive the full entitled amount is contingent on three factors: on the
beneficiaries’ meeting of program conditionalities; on schools and health facilities reporting their
compliance; and on the program’s ability to effectively capture the information through regularly
updating the program database. The benefit levels of CCT programs in Latin America range
from 5 percent of household income for Brazil’s Bolsa Familia program in 2004 to 29 percent
for Nicaragua’s Red de Protección Sosial in 2000. The Pantawid Pamilya’s 23 percent level is
similar to that of Mexico’s Opportunidades Program in 2004 (Grosh, Ninno, Tesliuc, & A.,
2008).
11. Once compliance with program conditions is verified, cash grants are distributed on
a bimonthly basis through different modes of payment. The disbursement of the cash subsidy
depends on compliance with program conditions as verified through the Compliance Verification
System (CVS). On a bimonthly basis, CVS forms are distributed to schools and health facilities
where beneficiary children and mothers are enrolled and registered with the program.
Schoolteachers and health facilities identify beneficiary mothers and children who have not
complied with the conditionality for the reporting period. These forms are collected, then data is
entered at the regional level and submitted to the national office where it is linked with the
payment system. As of July 2011, in areas covered by the impact evaluation study, 43 percent of
beneficiaries received their cash grants through ATM cash cards; 30 percent through Globe G-
Remit merchants; 18 percent through Rural Bank; and 9 percent through over-the-counter
payments at Land Bank branches.9
8 This translates into no more than three days of unjustified school absence per month.
9 Social Welfare Development Reform Project, Aide Memoire, November 2011

17
Evaluation Methodology10
Evaluation Design
12. The Pantawid Pamilya was purposely designed to facilitate impact evaluation. Given
the centrality of Pantawid Pamilya as the pioneer social safety net intervention for the
Philippines, it is critical to have rigorous empirical evidence on the causal impacts of the
program on key outcomes. Monitoring and evaluation (M&E) has been embedded in the fabric
of the CCT program in order to monitor the process regularly and improve the quality of
program implementation. With the impact evaluation in mind, program intervention was rolled
out in phases (Sets), and in some priority areas, intervention was postponed purposely so they
could serve as ―control‖ areas for the study. Several rounds of surveys were planned to allow for
a rigorous impact evaluation.
13. The Pantawid Pamilya used the Randomized Control Trials (RCT) evaluation
approach, which is considered to be the “gold standard” of evaluation methods.11
For social
programs like Pantawid Pamilya, the most rigorous approach to impact evaluation assigns
treatment/control status on a randomized basis.12
An RCT estimates program impact by
comparing outcomes among eligible households in the ―treatment‖ localities—meaning those
that received the program—with outcomes among households in the ―control‖ localities who
would have been eligible if the program had been in operation there. A prior statistical
assessment ensured that the evaluation study included enough households to assess the impact of
the program effectively (see Annex 2: Sample Size Estimation).
14. This evaluation examines the impact of Pantawid Pamilya on implementation sites in
the first phase of the program, known as “Set 1” areas. The Set 1 areas (see Annex 1: Sample
Areas), which targeted about 376,000 households in 148 municipalities and 12 cities in 34
provinces, were among the first municipalities where Pantawid Pamilya was scaled up in 2008
and 2009.13
10
A more detailed description of the evaluation methodology used is provided in Annex 3: Evaluation Methodology. 11
The targeting design of Pantawid Pamilya also enabled the use of another evaluation method known as
Regression Discontinuity (RD), which could be applied to a wider population than the RCT localities. As mentioned
above, this report presents the findings from the RCT method only, and the findings of the RD analysis are presented
in a separate report (forthcoming). 12
Rigorous evaluation demands that change in outcomes observed in study units (households, communities, or
regions) that receive the program must be compared with a valid counterfactual that represents the status of the
program beneficiaries had they not received the program. Randomization in the case of this evaluation ensured that
all barangays in the study had equal chance of control or treatment status; therefore, the control barangays satisfied
the conditions of a valid counterfactual comparison. 13
Set 1 municipalities included the poorest municipalities according to the Small Area Estimates (2000) in the
poorest provinces, according to poverty incidence estimated based on 2006 FIES data.

18
Survey Design and Implementation
15. The RCT impact evaluation survey was conducted in eight municipalities, covering
a total of 3,742 households. Households were selected based on four Sample Groups, according
to their eligibility status. The four Sample Groups were defined using the NHTS-PR database as
follows:
1,418 Sample Group 1 households that were the poor households (below the PMT score)
with children aged 0-14 or a pregnant mother at the time of the household assessment
(the eligible group for Pantawid Pamilya);
1,137 Sample Group 2 households that were the non-poor households (above the PMT
score) with children aged 0-14 or a pregnant mother;
556 Sample Group 3 households that were the poor households without children aged 0-
14 or a pregnant mother; and
631 Sample Group 4 households that were the non-poor without children aged 0-14 or a
pregnant mother.
16. Sample Group 1 served as the main sample of households, designed to represent the
poor eligible group for the program in the eight municipalities studied. It was determined
that a sample of 10 eligible households per barangay would provide enough statistical power to
detect program impact (see Annex 2: Sample Size Estimation). Therefore, a sample size of 1,300
households was planned for the main RCT analysis. Sample Groups 2, 3, and 4 were sampled in
the RCT areas to identify unexpected effects of the program among the non-target population
living in program areas.14
17. The findings from Sample Group 1 shed light on the impact of Pantawid Pamilya on
equally poor eligible households. The only difference among these households is that some
received the program because they happened to live in treatment areas, while some did not
receive the program because they happened to live in control areas. Although no baseline survey
was conducted, the randomization was successful as evidenced by roughly equal household
characteristics as measured in the Household Assessment data collected in 2008 (Table 1).
14
The analysis of Sample Groups 2, 3, and 4 was also important for assessing the effectiveness of RDD as the
analytical method for future evaluation rounds of the program. The households sampled in RCT areas therefore were
sampled so that RDD analysis could also be conducted in addition to this RCT analysis. The impact evaluation also
collected an additional sample of 4,156 households in five provinces for the specific purpose of conducting the RDD
analysis. The findings of these analyses will be presented in a separate report (forthcoming).

19
Table 1: Characteristics of the Sampled Households at the Time of the Household
Assessment in 2008 (Sample Group 1)
18. The distribution of sample households by province depended purely on the number
of barangays in each of the eight municipalities (Table 2). Of the 3,742 households sampled,
37 percent were in Lanao del Norte, 31 percent in Negros Oriental, 18 percent in Occidental
Mindoro, and 13 percent in Mountain Province.
Table 2: Households Sampled, by Sample Group and by Province
Province Sample 1
(Poor with
eligible children)
Sample 2
(Non-poor with
eligible children)
Sample 3
(Poor with no
eligible
children)
Sample 4
(Non-poor with
no eligible
children)
Total
Lanao Del Norte 559 367 236 233 1,395
Mountain
Province
184 171 62 86 503
Negros Oriental 431 365 174 190 1,160
Occidental
Mindoro
244 234 84 122 684
TOTAL 1,418 1,137 556 631 3,742
19. For each study site, key informants were also selected to provide information on the
local environment and on the health and education services to which the study population
had access. In each municipality visited, the mayor’s office, a Rural Health Unit, and up to three
public high schools were surveyed. In each barangay visited, one barangay captain, one public
elementary school, and one midwife were interviewed. In total, the key informants included
representatives from 8 Rural Health Units, 149 schools, 130 midwives, 8 mayor’s offices, and
130 barangay captains in the study sites. A summary of findings from information collected
through these key informants is presented in Annex 7: Environmental and Supply-Side Factors in
the Study Areas.
20. The study followed an ideal implementation schedule which allowed the treatment
sites to be “exposed” to the program for 2.5 years. The barangays were randomized into
treatment and control groups in 2008, program implementation in the treatment barangays started
in 2009, and the impact evaluation study was conducted in October/November 2011. This
duration is generally considered to be enough time to see program impacts on short-term
outcome measures but not enough time to show impacts on long-term outcome measures.
Treatment Barangays Control Barangays
# of households 704 714
Average # of household members 5.79 5.78
% of agricultural households 73.2 69.3
Average # of 0-5 year olds 1.18 1.10
Average # of 6-14 year olds 1.68 1.71
Average # of 15-18 year olds 0.50 0.54
Average estimated income (in log form) based on PMT in
2008
Php 9,141 (9.07) Php 9,382 (9.09)

20
21. The “control group”, poor localities where the CCT program was purposefully
withheld for the purpose of this evaluation, started receiving the program immediately
following the study in 2011. This randomized rationing of phasing in the program was justified
on the grounds that the available resources and administrative capacity were insufficient for
reaching every eligible poor household in the Philippines at the same time. This is the reality in
most countries, which have to phase in targeted social programs under resource/capacity
constraints. The program designers/administrators were forward-looking in their ability to
transform a constraint into a learning opportunity that could inform improvements to program
implementation going forward.
Main Findings
22. This section summarizes the main findings of the RCT impact evaluation. First, it
describes the impacts of Pantawid Pamilya on the program’s targeted education, health, and
socioeconomic indicators. It then summarizes some of the impacts of Pantawid Pamilya beyond
its directly targeted outcomes. In addition, the differential impacts of the program across
geographical areas and various groups of interest are discussed.
Program Impact on Targeted Indicators
Is the Program Keeping Children in School? - Program Impact on Targeted Education
Indicators
23. The study found that Pantawid Pamilya has a strong impact in school enrollment for
young children15
. Among preschool- and daycare-aged children (3-5 years old), enrollment was
10.3 percentage points higher among poor children in Pantawid barangays compared to the
baseline of 65 percent in non-Pantawid barangays (Table 17 in Annex 8 and Figure 1). Similarly,
school enrolment among elementary school-aged children (6-11 years old) in Pantawid
barangays was 4.5 percentage points higher than the control group baseline rate of 93 percent
(Table 18 and Figure 1). Given the high elementary school enrollment rate already achieved at
baseline, the increase in school enrollment achieved for this age group suggests that the
program has been able to reach near universal enrollment among this age group. These findings
are consistent with the higher school completion rates and lower dropout rates reported by the
120 elementary schools in the study sites.
Figure 1: Percentage of Children Enrolled in School by Age Group
15
In this study, school enrollment is defined by age group and not by DepEd normative age as the CCT program
monitors school attendance of children 3 years old to 14 years old receiving the education grants, regardless of the
level of school or grade the child is attending.

21
Note: Darker bars are statistically significant.
24. Increased school attendance, which was found across all school-aged groups except
for very young preschool-aged children, also suggests that Pantawid Pamilya is meeting the
objective of keeping poor children in school. Improvement in attendance was measured as over
85 percent attendance in school among children enrolled in school, in the two weeks prior to the
survey. Compared to non-Pantawid barangays, the study found that school attendance in
Pantawid barangays was 3.8 percentage points higher among 6-11 year olds, 4.9 percentage
points higher among 12-14 year olds, and 7.6 percentage points higher among 15-17 year olds
(Table 18 in Annex 8). The only age group in which improved attendance was not observed was
the preschool/daycare group (Table 17).
25. However, the program as currently designed has not improved levels of school
enrollment for older children in Pantawid barangays. On average, among children in control
barangays, 85 percent of children 12-14 years of age (eligible for the education grant) reported
being enrolled in school, while 62 percent of children 15-17 years of age (no longer eligible for
the education grant) reported being enrolled in school. These rates were roughly the same in
Pantawid barangays (Table 18 in Annex 8).
Figure 2: Percentage of Children Regularly Attending School by Age Group
Note: Darker bars are statistically significant.
40%
50%
60%
70%
80%
90%
100%
Enrolled (6-11yrs) Enrolled (12-14yrs) Enrolled (15-17yrs)
% enrolled
Control
Treatment
40%
50%
60%
70%
80%
90%
100%
Attend (6-11 yrs) Attend (12-14 yrs) Attend (15-17 yrs)
% attend regularly Control
Treatment

22
26. The age at which children dropped out of school started at 10 years old in non-
Pantawid barangays and 11 years old in Pantawid barangays. In the non-Pantawid barangays,
fewer children were enrolling at early ages, with a peak in enrollment at age 10 and steep drops
in enrollment at age 11, age 13, and age 15 (Figure 3). The level of school enrollment for
children in Pantawid barangays was statistically significantly higher than in non-Pantawid
barangays until age 11, after which children started dropping out at a similar pace with children
in the non-Pantawid barangays. Although not statistically significant, at age 15, children in
program areas appear to have a higher rate of dropout than those in the control areas, probably
due to the cut-off age of the program’s education grant.
Figure 3: Percentage of Children Enrolled in School by Age
27. Another challenge potentially undermining the efficacy of the program in
addressing school enrollment of older children could be that the direct costs and
opportunity costs of schooling may be considerably higher for older children. The
program’s standardized 300 peso per month education grant may not provide a strong enough
incentive to keep those children in school. The average schooling expenditure per child for those
who were currently enrolled as reported by study households provides some insights, with
household spending of PhP 4,010 per school year for children 12-14 years old and PhP 4,562 for
children 15-17 years old in non-Pantawid barangays. In comparison, the cost of schooling for
children 6-11 years old in the same barangays was only PhP2,247. Furthermore, children above
age 14 are no longer eligible for the education cash grant due to the age limit (14 years old) set
by the program. The finding that the program helped boost enrollment for younger
children/lower grades but was unable to keep older children/higher grades in school is consistent
with a previous impact evaluation study (Chaudhury & Okamura, 2012).
40%
50%
60%
70%
80%
90%
100%
6 7 8 9 10 11 12 13 14 15 16 17
% enrolled in school
Age
Control Treatment

23
Is the Program Keeping Children Healthy? - Program Impact on Targeted Health
Indicators
Maternal Health
28. The study found that Pantawid Pamilya is largely achieving its program objective of
ensuring basic health services for poor mothers, with poor pregnant women in Pantawid
barangays meeting conditionalities by attending antenatal and postnatal care. The study
found that more poor mothers living in Pantawid barangays were receiving antenatal care (ANC)
services (by 10.5 percentage points for a minimum of four ANC visits during the pregnancy).
The study also found that they were making ANC visits more frequently (by 0.6 times) compared
to mothers in non-Pantawid barangays. Similarly, the use of postnatal care (PNC) at home within
24 hours after delivery in Pantawid barangays was higher (by 10 percentage points) than in non-
Pantawid barangays (Table 19 in Annex 8). Figure 4: summarizes these differences in utilization
of health services across the Pantawid and non-Pantawid communities.
Figure 4: Proportion of Poor Mothers Using Antenatal and Postnatal Care
Note: Darker bars are statistically significant.
29. However, the study found no evidence that the program improves the rate of
facility-based delivery or assistance by a trained professional, and it appears that the use of
ANC visits has not yet translated into better health outcomes for mothers and newborns.
Although one of the program conditionalities for pregnant mothers is to deliver at a health
facility or, at a minimum, assisted by a trained professional (i.e. doctor or midwife), the study did
not find evidence that the program improves facility-based delivery or assistance by a trained
professional (Table 19 in Annex 8 and Figure 5). Delivery assisted by a trained health care
professional is strongly linked to reduction in maternal mortality. Unfortunately, the Philippines
has made little progress over the past decade in reducing maternal mortality rates.16
Among
mothers who gave birth in the three years preceding the survey, about 11 percent reported having
suffered from night blindness (potentially caused by Vitamin A deficiency) during pregnancy,
the rates for which were the same in both Pantawid and non-Pantawid barangays. The study also
16
Family Planning Survey 2006, National Statistics Office.
0%
10%
20%
30%
40%
50%
60%
70%
80%
ANC PNC in facility PNC at home
% used services Control Treatment

24
found no evidence that the program affected the perceived size of the newborn at birth reported
by the mother (Table 20 in Annex 8).
Figure 5: Proportion of Poor Mothers Using Delivery Services
Note: Darker bars are statistically significant.
Child Health
30. The study found that Pantawid Pamilya is meeting the objective of keeping children
healthy, as evidenced by a reduction in severe stunting17
among poor children 6-36 months
of age, which is expected to have long-term benefits. Notably, impact evaluations of CCT
programs around the world have not proven to reduce stunting at such early stages of program
implementation, but Pantawid Pamilya appears to be an exception. While there was no measured
impact on the mean height-for-age score or other anthropometric measures, the program lowered
the rate of severe stunting among poor children 6-36 months old by 10.1 percentage points from
the baseline of 24 percent in non-Pantawid barangays (Table 21 in Annex 8 and Figure 6).
Reduction in severe stunting among this young age group is expected to have strong long-term
benefits, as stunting in the first two years of life is known to lead to irreversible damage
including lower educational attainment, reduced adult income, and decreased offspring birth
weight (Cesar G Victora, 2008).
31. The reduction in severe stunting indicates that the program is enabling families to
better care for their children in a sustained and consistent manner. With the provision of
cash coupled with education on good parenting practices provided during the program’s Family
Development Sessions, the program improved parents’ feeding practices for their children. More
parents in Pantawid barangays were feeding their children more high-protein food including
eggs and fish, leading to the improved long-term nutritional status of young children (Table 22 in
Annex 8).
17
Measured as height-for-age <-3SD applying the WHO Child Growth Standard
(http://www.who.int/childgrowth/software/en/) accessed March 9, 2012
0%
10%
20%
30%
40%
50%
Skilled delivery Facility-based delivery Night blindness
% used services Control Treatment

25
Figure 6: Proportion of Malnourished among 6-36 Month Olds
Note: Darker bars are statistically significant.
32. The increase in poor children in Pantawid barangays who received age-appropriate
(ages 0-5) child health services also suggests that the program is meeting its objective of
keeping children healthy. These child health services include: regular growth monitoring (15
percentage points higher compared to their counterparts in non-Pantawid barangays in the six
months prior to the survey), the receipt of deworming pills (6.7 percentage points higher), and
Vitamin A supplementation (6.2 percentage points higher) (Figure 4: and Table 23 in Annex 8).
The increase in regular growth monitoring is impressive when compared to CCT programs
around the world. For example, Mexico in its early evaluation did not find impacts on health
visits, while the CCT program in Nicaragua found a 6.3 percentage point increase from a
baseline of 70.5 percent (Fiszbein, et al., 2009). The Pantawid Pamilya study also found that in
addition to the improvements in beneficiary children receiving preventative health services as
required by the program conditionalities, the program appears to have increased the utilization of
curative care for children sick with fever and cough (Table 23 in Annex 8).
33. The program is also having an impact on the health of school-aged children 6-14
years old in Pantawid barangays by ensuring access to deworming pills. Pantawid Pamilya
provides health grants to poor households with school-aged children on the condition that they
take deworming pills provided by the school twice a year. The study found that school-aged
children in Pantawid barangays were more likely (by 4 percentage points) to be offered
deworming pills and are also more likely to have taken at least one pill (by 5 percentage points)
and more than one pill (by 9 percentage points) during the previous school year (SY2011)
compared to the baseline of 80 percent for school-aged children in non-Pantawid barangays
(Table 24 in Annex 8).
34. However, some challenges still remain for the program’s efforts to improve child
health, such as improving coverage of childhood immunization. The study did not find a
statistically significant impact on the proportion of children receiving single immunizations such
0%
10%
20%
30%
40%
50%
60%
Underweight Severe underweight Wasting Severe wasting Stunting Severe wasting
% malnourished Control Treatment
26
as BCG or the measles vaccine, the baselines for which were 88 percent and 80 percent,
respectively (Table 23 in Annex 8).
Is the Program Increasing Investments for the Future of the Children? - Program Impact
on Targeted Socio-Economic Indicators
35. The program is meeting the objective of increasing poor households’ investments in
their children, as evidenced by the shift in spending patterns of poor households in
Pantawid barangays. The study found that poor households in Pantawid barangays spent 38
percent more on education per capita and 34 percent more on medical expenses per capita than
those in non-Pantawid barangays (Table 25 in Annex 8). Consistent with households’ reporting
of increased total expenditures on education, parents in Pantawid barangays also reported higher
expenditures on schooling when asked per child per item (Table 27). Similarly, poor households
reported spending 38 percent more per capita on protein-rich food such as dairy products and
eggs (Table 26). This is consistent with the mothers reporting increased feeding of high-protein
food such as eggs and fish for young children. This shift in spending patterns—particularly on
food items—has been observed widely in CCT evaluations around the world, with CCT
beneficiary households spending more on food items with higher-quality sources of nutrition, for
example in Mexico, Colombia, and Nicaragua.
36. Interestingly, although the study found that cash grants were reaching the
beneficiaries, it did not find an increase in overall levels of consumption.18
The estimated per
capita consumption per day reported by the sampled households was PhP 46 per day (equivalent
to US$ 1 a day), both in Pantawid and non-Pantawid barangays. Among the 85 percent of poor
households in the Pantawid barangays who reported to be beneficiaries of the program, they
received an average of PhP 1,740 for the last bimonthly payment. Assuming that these
households receive this grant amount six times during the year (which in fact they do not,
because the education grant only covers 10 months of the year), on a per capita basis, each
household beneficiary would receive PhP 5 per day (equivalent to US$ 0.11 a day), representing
approximately 11 percent of the household’s per capita consumption. Internationally, the largest
transfer amount was in Nicaragua with the transfer representing about 30 percent of consumption,
Mexico about 20 percent of consumption, and Brazil about 8 percent of consumption (Fiszbein,
et al., 2009). Further research is needed to understand the impact of Pantawid Pamilya on
consumption. To measure aggregate consumption carefully requires detailed surveys such as
FIES, with much more detailed consumption information than collected in this survey.
37. It appears that contrary to the design of the program in which the maximum benefit
amount beneficiary households could receive is 23 percent of poor households’ per capita
income, in reality the beneficiaries are receiving considerably smaller amounts. The
differences in the maximum grant amount a beneficiary household can receive and the actual
amount may be due to several factors. If beneficiaries do not meet the program conditionalities,
their grant amounts will be smaller. If the reports on compliance from health facilities and
18
See Annex 6 for the items included in the household consumption module. Household consumption was measured
applying the APIS consumption module, which was aggregated to estimate annual per capita consumption.
27
schools are not regularly submitted compliance, households may receive smaller grant amounts
than the program initially intended. Lastly, if the program database is not regularly updated to
reflect the schools and health facilities program beneficiary attend, their compliance will not be
effectively linked to the beneficiary payroll.
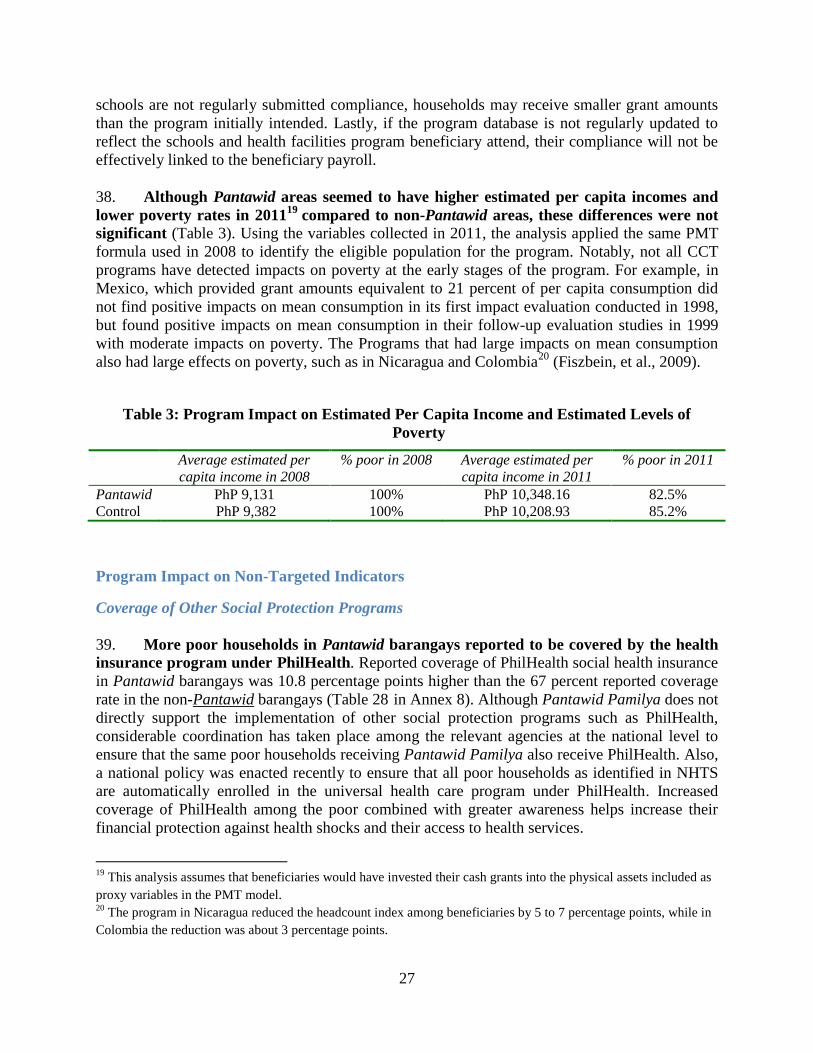
38. Although Pantawid areas seemed to have higher estimated per capita incomes and
lower poverty rates in 201119
compared to non-Pantawid areas, these differences were not
significant (Table 3). Using the variables collected in 2011, the analysis applied the same PMT
formula used in 2008 to identify the eligible population for the program. Notably, not all CCT
programs have detected impacts on poverty at the early stages of the program. For example, in
Mexico, which provided grant amounts equivalent to 21 percent of per capita consumption did
not find positive impacts on mean consumption in its first impact evaluation conducted in 1998,
but found positive impacts on mean consumption in their follow-up evaluation studies in 1999
with moderate impacts on poverty. The Programs that had large impacts on mean consumption
also had large effects on poverty, such as in Nicaragua and Colombia20
(Fiszbein, et al., 2009).
Table 3: Program Impact on Estimated Per Capita Income and Estimated Levels of
Poverty
Average estimated per
capita income in 2008
% poor in 2008 Average estimated per
capita income in 2011
% poor in 2011
Pantawid PhP 9,131 100% PhP 10,348.16 82.5%
Control PhP 9,382 100% PhP 10,208.93 85.2%
Program Impact on Non-Targeted Indicators
Coverage of Other Social Protection Programs
39. More poor households in Pantawid barangays reported to be covered by the health
insurance program under PhilHealth. Reported coverage of PhilHealth social health insurance
in Pantawid barangays was 10.8 percentage points higher than the 67 percent reported coverage
rate in the non-Pantawid barangays (Table 28 in Annex 8). Although Pantawid Pamilya does not
directly support the implementation of other social protection programs such as PhilHealth,
considerable coordination has taken place among the relevant agencies at the national level to
ensure that the same poor households receiving Pantawid Pamilya also receive PhilHealth. Also,
a national policy was enacted recently to ensure that all poor households as identified in NHTS
are automatically enrolled in the universal health care program under PhilHealth. Increased
coverage of PhilHealth among the poor combined with greater awareness helps increase their
financial protection against health shocks and their access to health services.
19
This analysis assumes that beneficiaries would have invested their cash grants into the physical assets included as
proxy variables in the PMT model. 20
The program in Nicaragua reduced the headcount index among beneficiaries by 5 to 7 percentage points, while in
Colombia the reduction was about 3 percentage points.

28
Impact on Assets21
40. No significant program impact was found on non-financial asset accumulation, as
measured by ownership of household furniture and appliances, animals, or land. The study
found no impact on asset accumulation using an index of 13 household furniture and appliance
items. Similarly, no differences were observed in land ownership between poor households in
Pantawid barangays and non-Pantawid barangays (Table 29 in Annex 8), nor were differences
found in the total numbers (heads) of animals owned by these households in a significantly
positive manner (Table 30 ).
41. It also appears that Pantawid Pamilya has not improved access to financial
institutions thus far. In both Pantawid and non-Pantawid barangays, only about 10 percent of
households reported having a bank account (Table 31 in Annex 8). However, more poor
households in Pantawid barangays reported savings in all provinces other than Lanao del Norte
(Table 32).
Impacts on Beneficiary Behavior
42. Countering concerns that the program might create mendicancy and dependency
among the beneficiary population, the study found that the introduction of Pantawid
Pamilya did not encourage households to work less or make less effort to obtain more work.
In the households surveyed in Pantawid and non-Pantawid barangays, 62 percent of adults 17-60
years old reported to have worked at least one hour in the previous one week. Among these
adults, no program impacts were found in: reported number of hours worked for his/her main job,
average number of hours worked for his/her main job in the last one week (41.4 hours), as well
as average total hours worked including his/her additional jobs (42.4 hours). Similarly, no
significant difference was found in the proportion of adults seeking work (in addition to their
main work if they already had one) in Pantawid and non-Pantawid barangays (Table 33 in
Annex 8).
43. Also contrary to concerns regarding potential increases in beneficiary household
spending on adult goods, the study found that spending on alcohol by poor households in
Pantawid barangays was lower compared to their counterparts in non-Pantawid barangays.
On average, poor households in Pantawid barangays spent 39 percent less on alcohol than
equally poor households in non-Pantawid barangays did. Furthermore, no evidence was found of
households spending more on gambling in program barangays (Table 25 in Annex 8).
44. The study findings also dispelled concerns raised at the time of program design over
the potential impact on fertility rates. The study found no evidence to conclude that women in
Pantawid barangays had higher fertility rates than women in non-Pantawid barangays (Table 34 in Annex 8). To avoid incentives for families to have more children, Pantawid Pamilya does not
21
According to SWS field supervisors, questions on assets were among the most difficult for interviewers to obtain
accurate answers, and they suspected that households in both Pantawid barangays and non-Pantawid barangays
were under-reporting their assets.

29
provide grants for newborns into the program except for newborns resulting from pregnancies
enumerated at the time of the household assessment.
Differential Impacts
45. This section describes some of the differences in program impact across various
beneficiary groups. It is important to bear in mind that the sampling for this study was done to
represent average impacts for Set 1 beneficiaries, so sampling was not done to be representative
by province or sub-group (e.g., Indigenous Peoples). The findings presented below are meant to
be for illustrative purposes, recognizing that no social program anywhere in the world has the
same impact across time and space. The variations by location and circumstance need to be
explored more rigorously in further studies. With this caveat, this study examined heterogeneities
such as: provincial heterogeneities, relative poverty, Indigenous Peoples (IP) status, relative
remoteness of the barangays, and gender of the beneficiaries.
Regional/Provincial Differences
46. Heterogeneity was most pronounced across geographical areas (by province),
indicating that the program has been more effective in some provinces than others. The
study found considerable differences in program impact on household socioeconomic (Table 35
and Table 36 in Annex 8), child health (Table 37), and education outcomes (Table 38) across the
four provinces. Across most outcomes, Negros Oriental consistently showed the most positive
and strongest program impacts, while Lanao del Norte consistently showed weaker impacts
compared to other provinces. Figure 7 below is a summary of child health service use indicators
by Pantawid and non-Pantawid areas by province. Although not necessarily statistically
significant, the bars for the Pantawid areas generally are higher than those for non-Pantawid
areas which indicates positive impact, except for Lanao del Norte.

30
Figure 7: Proportion Used Child Health Services by Province
(Note: darker bars are statistically significant)
47. Potential causes of regional heterogeneity in program impact include differences in
access to health and education services and other supply-side issues, socio-cultural and
environmental factors including security, as well as differences in the effectiveness of
program implementation. Key informant interviews pointed to considerable variation in
supply-side factors for both education and health. Based on levels of access to health and
education facilities at the barangay level as well as reports from health facilities and schools,
0%
50%
100%
Weighing Deworming Vitamin A Enrolled indaycare
Attend daycare Seek health carewhen ill
Negros Oriental Control Treatment
0%
50%
100%
Weighing Deworming Vitamin A Enrolled indaycare
Attend daycare Seek health carewhen ill
Lanao del Norte Control Treatment
0%
50%
100%
Weighing Deworming Vitamin A Enrolled indaycare
Attend daycare Seek health carewhen ill
Mountain Province Controls Treated
0%
50%
100%
Weighing Deworming Vitamin A Enrolled indaycare
Attenddaycare
Seek healthcare when ill
Dillhealthpu
Occidental Mindoro Control Treatment

31
service provision seemed most problematic in Lanao del Norte (see Annex 7: Environmental and
Supply-Side Factors in the Study Areas). Lanao del Norte had the lowest average number of
elementary schools and high schools in which the children in the village were enrolled. Similarly,
health service providers in Lanao del Norte were by far the most stretched, which may partially
explain the lack of program impact on health indicators in this province. Further studies need to
be conducted to better understand the potential differences in program implementation.
Población versus Non-Población
48. In general, program impacts were similar for those living in the población (capital of
the municipality, where most rural health facilities and schools are located) and those
outside the población, although some key outcomes suggest that program impact was
stronger for those in non-población areas. The study findings indicate that the program was
more effective for relatively remote areas (i.e. non-Población) in improving: access to a bank
account (Table 39 in Annex 8), maternal health services such as post-natal care, health and
education of poor children 0-5 years old, and attendance among school-aged children (6-14 years
old). Differences in program impact seem to be due to the fact that for most indicators, the
baseline (control group) means were lower for non-población areas than in the población where
most health centers and schools are located.
Relative Poverty, Indigenous Peoples Status, and Gender
49. In general, few differences were found in program impact across the other
groupings studied. Among those identified as poor, the program was found to be equally
effective for households who were relatively poorer and those who were relatively less poor.
Likewise, few differences were found between households who identified themselves as having
IP status and those who did not. The program also appeared to be equally effective for boys and
girls, with no gender differences found in program impacts on outcomes related to education and
health service use.
Summary of Conclusions and Policy Implications
50. After more than two years of program implementation in the study areas, evidence
indicates that in general, Pantawid Pamilya is meeting most of its program objectives. To
summarize, the program impacts observed include:
In education, the program is helping to keep younger children in school.
Improvements in school enrollment were found among the younger age groups (3-11
years old), while school attendance improved for all age groups except for the youngest
pre-school/daycare age group.
In health, the program is meeting its objective of helping to keep children healthy. The program has helped improve the long-term nutritional status of younger children (6-
36 months old). It has also encouraged poor households to use maternal and child health
services such as antenatal care, postnatal care, regular growth monitoring, and receipt of
Vitamin A and deworming pills, as well as increased healthcare-seeking behaviors among
beneficiaries when their children become ill.

32
The program is also achieving its objectives by allowing households to invest more
in meeting the health and education needs of their children. Pantawid Pamilya is
changing the spending patterns of poor households, with beneficiary households spending
more on health and education and less on adult goods such as alcohol.
However, the study was unable to identify a program impact on aggregate
consumption/expenditures, even though expenditures on education and health
increased and results from some areas suggest an increase in savings. Further studies,
which will require collection of detailed consumption data, are required to develop a
deeper understanding of the impact of Pantawid Pamilya on consumption and poverty.
The program has improved the effectiveness of other government programs for the
poor, as evidenced by the increased reported coverage of PhilHealth. This impact is
probably owing to greater awareness and access to information among poor households
with the program, leading to better access to social services for the poor.
51. The findings from this study also highlight certain policy implications going forward.
The challenges include:
To improve educational outcomes for older children, additional measures such as
expanding the age of coverage of Pantawid Pamilya, increasing the period of
coverage per family from the current five years, increasing the grant amount for
older children, and parallel supply-side interventions in the education sector should
be explored. The program as currently designed does not improve school enrollment of
older children (age 12 and above), which is key to sustaining the benefits reaped from
investments made in human capital and breaking the inter-generational poverty trap. To
address barriers that older children face in staying in school, many CCT programs such as
the Female Secondary School Stipend Program (FSSP) in Bangladesh, Opportunidades in
Mexico, Familias en Accion in Colombia, the Social Risk Mitigation Project (SRMP) in
Turkey, and Jamaica’s Program of Advancement through Health and Education (PATH)
provide larger benefit amounts for children in secondary school than for elementary
school children, recognizing that older children have higher opportunity costs and higher
costs of schooling. Many CCT programs also have parallel supply-side interventions such
as construction of schools and classrooms (e.g., in Honduras, Jamaica, Mexico,
Bangladesh), provision of teacher materials (Jamaica), and grants to teachers (Mexico
and Nicaragua) (Fiszbein, et al., 2009).
Linkages and coordination with health service providers need to be strengthened to
ensure that beneficiary mothers and children receive the services they require and
to ensure a continuum of care. The study found that although Pantawid Pamilya has
helped increase use of antenatal care by pregnant mothers, these initial contacts with the
service providers are not yet translating into increased facility-based delivery and/or
skilled delivery, the services most needed to address the high maternal mortality rates
effectively. Similarly, although children five years old and younger are regularly
attending health checkups and growth monitoring, this is not yet translating into

33
increased immunization coverage. Stronger coordination between Pantawid Pamilya on
the ground and local health service providers may improve the continuum of care to
ensure that mothers and children receive the basic health services that the program is
designed to increase.
It is important to consider ways in which other social programs that may have a
long-term impact on the welfare of the poor could take advantage of Pantawid
Pamilya’s strong and effective social mobilization structure. As found with the
increased coverage (and awareness) of PhilHealth among program beneficiaries,
Pantawid Pamilya, when centrally coordinated, has strong potential to raise a poor
household’s awareness of other social programs and help expand coverage and access
through the program’s organizational structures and the monthly discussions at the
Family Development Sessions (FDS). The FDS offers a potentially powerful platform for
providing education on good parenting practices (e.g., exclusive breastfeeding, good
feeding practices, remedies for children with diarrhea), improving financial literacy and
access to bank accounts, and promoting access to and use of other social services. The
FDS also could be used as an avenue to empower and facilitate the poor to voice
demands for more and improved social service delivery. This would not only benefit the
program through improved health and education services, but it could also plant seeds for
a more organized venue for the poor to voice their needs.
Further effort is needed to ensure that beneficiaries receive the full grant amounts
to which they are entitled. Although the program benefits are designed to be generous at
approximately 23 percent of household per capita income of the poor, the beneficiaries in
the study were receiving only 11 percent of household per capita consumption. The gap
may be minimized by working on three areas: (i) improving the levels of compliance with
program conditionalities, maximizing the grant transfer amounts to program
beneficiaries; (ii) regularly update the program beneficiary database to reflect the new
schools and health facilities that beneficiary children are attending, to ensure that
compliance with conditionalities by beneficiary children are effectively reflected in the
Compliance Verification process; and (iii) ensuring that health facilities and schools
report compliance with conditionalities regularly and in a timely manner through the
Compliance Verification process.
The reasons for heterogeneity of program impacts across geographical areas must
be better identified and understood to ensure more efficient program
implementation. The study found consistently weaker impacts in Lanao Del Norte than
in other provinces in the study. The causes behind these weaker impacts may be related to
program implementation issues in the province, supply-side factors, or due to variation in
local level political/social structure. The causes of this regional heterogeneity cannot be
fully explained through this impact evaluation alone, and further research—including an
in-depth qualitative study—is required to better understand and help improve program
effectiveness.

34
References
Cesar G Victora, L. A. (2008). Maternal and child undernutrition: consequences for adult health
and human capital. The Lancet, 340-357.
Chaudhury, N., & Okamura, Y. (2012). Conditional Cash Transfers and School Enrollent:
Impact of the Conditional Cash Transfer Program in the Philippines. Philippines Social
Protection Note No. 6.
Fernandez, L. (2012). Design and Implementation Features of the National Household Targeting
System in the Philippnes. World Bank, Philippines Social Protection Note 5.
Fernandez, L., & Olfindo, R. (2011). Overview of the Philippines' Conditional Cash Transfer
Program: The Pantawid Pamilyang Pilipino Program. World Bank Philippine Social
Protection Note 2.
Fiszbein, A., Schady, N., Ferreira, F. H., Grosh, M., Kelleher, N., Olinto, P., et al. (2009).
Conditional Cash Transfers: Reducing Present and Future Poverty.
Grosh, M., Ninno, C., Tesliuc, E., & Ouerghi, A. (2008). For Protection and Promotion: The
Design and Implementation of Effective Safety Nets.
Manasan, R. (2011). Pantawid Pamilyang Pilipino Program and School Attendance: Early
Indications of Success. PIDS PN 2011-19.
World Bank (2011). Philippines Health Sector Review: challenges and future directions.
World Bank (forthcoming). Philippines Social Protection Sector Review.
World Bank; AusAID (2012). Philippines Basic Education Public Expenditure Review.

35
Annexes
Annex 1: Sample Areas
Table 4: Comparison of Proportion of Poor Households in Set 1 Areas according to PMT
and RCT Sample Areas
REGION
CITY/MUNICI
PALITY
Sum of
Encoded HH
Sum of
Poor HH
Sum of
Potential HH
% of Poor
PMT
ARMM [Autonomous Region in
Muslim Mindanao] 23,408 11,542 7473 49
CAR [Cordillera Administrative
Region] 41,197 17,833 16136 43
NCR [National Capital Region] 36,833 18,246 16364 50
REGION I [Ilocos Region] 27,912 12,815 11869 46
REGION II [Cagayan Valley] 12,666 6,377 5915 50
REGION III [Central Luzon] 21,184 9,490 8362 45
REGION IV-A
[CALABARZON] 29,651 19,197 17177 65
REGION IV-B [MIMAROPA] 82,661 47,135 42236 57
REGION IX [Zamboanga
Peninsula] 72,324 52,047 42286 72
REGION V [Bicol Region] 62,922 42,915 37921 68
REGION VI [Western Visayas] 31,499 14,639 13517 46
REGION VII [Central Visayas] 66,814 29,216 25721 44
REGION VIII [Eastern Visayas] 37,217 21,593 19199 58
REGION X [Northern Mindanao] 87,764 53,034 44618 60
REGION XI [Davao Region] 19,002 10,283 9336 54
REGION XII [Soccsksargen] 16,205 9,149 8317 56
REGION XIII [Caraga] 80,242 55,317 46742 69
Grand Total 749,501 430,828 373,189 57
RCT sites
CAR [Cordillera Administrative
Region] PARACELIS 3338 1713 1625 51
SADANGA 1464 603 574 41
REGION IV-B [MIMAROPA] PALUAN 2341 1127 1050 48
SANTA CRUZ 12720 6886 6351 54
REGION VII [Central Visayas] JIMALALUD 5752 3394 3036 59
BASAY 4724 2422 2271 51
REGION X [Northern Mindanao] LALA 13077 8471 7067 65
SALVADOR 4281 3351 2694 78
47697 27967 24668 59

36
Table 5: Randomized Evaluation Areas
Macro
area Region Province
Municipality
name
(Census 07)
Total nr.
Barangays
Nr.
Control
barangays
Poverty
Incidence
(SAE
2003) *
Population
(Census
2007) *
Luzon CAR Mountain
Province
Paracelis 9 5 59.91 24705
Sadanga 8 4 63.53 9706
Luzon Region
IV-B
Occidental
Mindoro
Paluan 12 6 58.4 13718
Santa Cruz 11 6 53.99 30402
Visayas Region
VII
Negros
Oriental
Jimalalud 28 13 65.67 27728
Basay 10 5 63.45 22713
Mindanao Region
X
Lanao del
Norte
Lala 27 14 59.79 58395
Salvador 25 12 73.67 23222
Nr. Provinces: 4
Nr. municipalities: 8
Nr. barangays: 130
Nr. Control barangays: 65
Nr. Treatment barangays: 65
PROVINCE: Mountain Province
MUNICIPALITY: Paracelis Barangay_code Barangay name Treatment/Controls
144406002 Bacarni T
144406005 Butigue T
144406007 Buringal T
144406009 Poblacion T
144406001 Anonat C
144406003 Bananao C
144406004 Bantay C
144406006 Bunot C
144406008 Palitod C
PROVINCE: Mountain Province
MUNICIPALITY: Sadanga Barangay_code Barangay name Treatment/Controls
144408001 Anabel T
144408002 Belwang T
144408005 Poblacion T
144408008 Demang T

37
144408003 Betwagan C
144408004 Bekigan C
144408006 Sacasacan C
144408007 Saclit C
PROVINCE: Occidental Mindoro
MUNICIPALITY: Paluan Barangay_code Barangay name Treatment/Cont
rols
175107002 Harrison T
175107003 Lumangbayan T
175107008 Silahis Ng Pag-Asa Pob. (Bgy 3) T
175107009 Pag-Asa Ng Bayan Pob. (Bgy 4) T
175107010 Bagong Silang Pob. (Bgy 5) T
175107012 Tubili T
175107001 Alipaoy C
175107004 Mananao C
175107005 Marikit C
175107006 Mapalad Pob. (Bgy 1) C
175107007 Handang Tumulong Pob. (Bgy 2) C
175107011 San Jose Pob. (Bgy 6) C
PROVINCE: Occidental Mindoro
MUNICIPALITY: Santa Cruz Barangay_code Barangay name treatment
175111001 Alacaak T
175111008 Pinagturilan (San Pedro) T
175111009 Poblacion I (Barangay 1) T
175111010 San Vicente T
175111012 Kurtinganan T
175111002 Barahan C
175111003 Casague C
175111004 Dayap C
175111006 Lumangbayan C
175111007 Mulawin C
175111011 Poblacion II (Barangay 2) C

38
PROVINCE: Negros Oriental
MUNICIPALITY: Basay Barangay_code Barangay name Treatment/Controls
74605002 Bal-os T
74605004 Cabalayongan T
74605005 Cabatuanan T
74605007 Maglinao T
74605009 Olandao T
74605001 Actin C
74605003 Bongalonan C
74605006 Linantayan C
74605008 Nagbo-alao C
74605010 Poblacion C
PROVINCE: Negros Oriental
MUNICIPALITY: Jimalalud Barangay_code Barangay name Treatment/Control
s
74612004 Bae T
74612005 Bala-as T
74612007 Banog T
74612010 Camandayon T
74612011 Cangharay T
74612012 Canlahao T
74612013 Dayoyo T
74612015 Lacaon T
74612017 Malabago T
74612019 Mongpong T
74612020 Owacan T
74612022 Panglaya-an T
74612025 Polopantao T
74612026 Sampiniton T
74612027 Talamban T
74612001 Aglahug C
74612002 Agutayon C
74612003 Apanangon C
74612006 Bangcal C
74612008 Buto C
74612009 Cabang C

39
74612014 Eli C
74612016 Mahanlud C
74612018 Mambaid C
74612021 Pacuan C
74612023 North Poblacion C
74612024 South Poblacion C
74612028 Tamao C
PROVINCE: Lanao del Norte
MUNICIPALITY: Lala Barangay_code Barangay name Treatment/Controls
103509002 Andil T
103509005 Cabasagan T
103509008 Darumawang Ilaya T
103509010 Gumagamot T
103509013 Lanipao T
103509015 Maranding T
103509018 Pendolonan T
103509019 Pinoyak T
103509021 Rebe T
103509022 San Isidro Lower T
103509026 Santa Cruz Upper T
103509027 Simpak T
103509029 Tuna-an T
103509001 Abaga C
103509003 Matampay Bucana C
103509004 Darumawang Bucana C
103509006 Camalan C
103509009 El Salvador C
103509012 Lala Proper (Pob.) C
103509014 Magpatao C
103509016 Matampay Ilaya C
103509017 Pacita C
103509020 Raw-an C
103509023 San Isidro Upper C
103509024 San Manuel C
103509025 Santa Cruz Lower C
103509028 Tenazas C
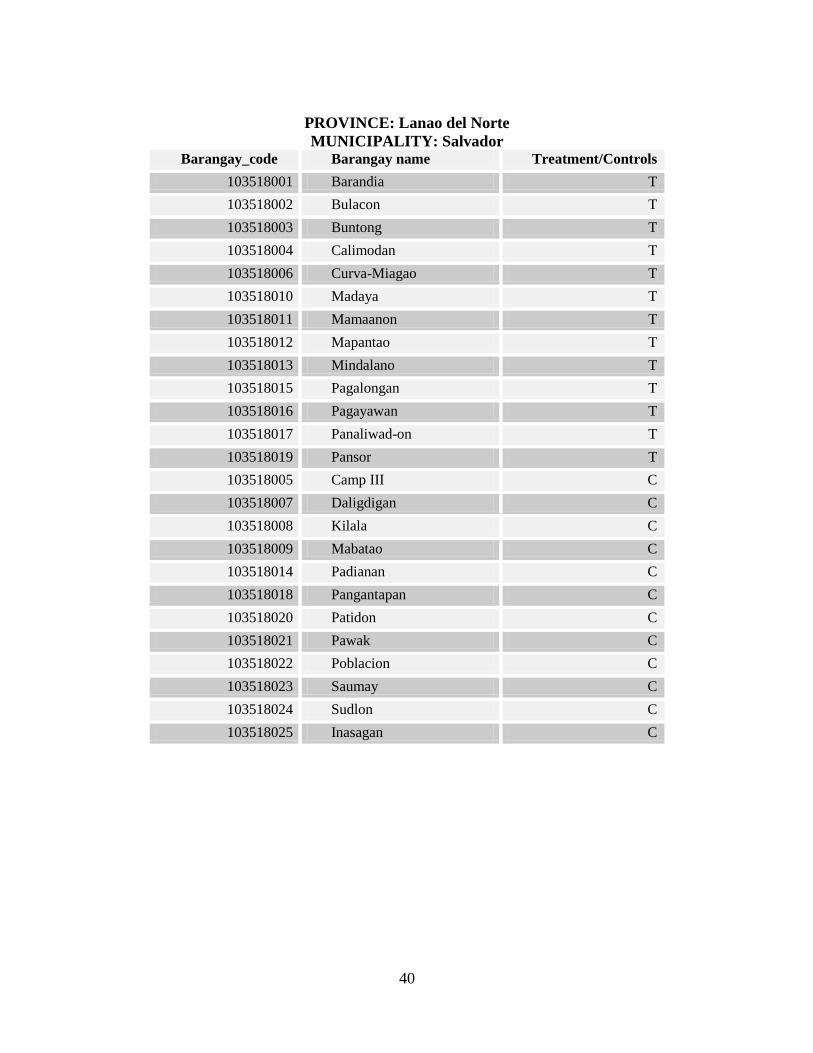
40
PROVINCE: Lanao del Norte
MUNICIPALITY: Salvador Barangay_code Barangay name Treatment/Controls
103518001 Barandia T
103518002 Bulacon T
103518003 Buntong T
103518004 Calimodan T
103518006 Curva-Miagao T
103518010 Madaya T
103518011 Mamaanon T
103518012 Mapantao T
103518013 Mindalano T
103518015 Pagalongan T
103518016 Pagayawan T
103518017 Panaliwad-on T
103518019 Pansor T
103518005 Camp III C
103518007 Daligdigan C
103518008 Kilala C
103518009 Mabatao C
103518014 Padianan C
103518018 Pangantapan C
103518020 Patidon C
103518021 Pawak C
103518022 Poblacion C
103518023 Saumay C
103518024 Sudlon C
103518025 Inasagan C

41
Annex 2: Sample Size Estimation
Table 6: Estimated Power for Selected Outcomes in the RCT Subcomponent
Outcome Number of
eligible
households
per cluster
Number
of units
per
household
Baseline
value
Standard
deviation
Hypothesized
effect
(increase)
Standardized
effect size
Estimated
ICC
Significance
level*
Power
Household PCE
10 1.00 400010 97253 40000 0.41 0.21 0.01 0.979
School participation, 6-
14 years 10 2.07 0.87 0.33 0.07 0.21 0.12 0.05 0.848
Health facility visit, 0-5
years 10 1.20 0.21 0.41 0.07 0.25 0.25 0.05 0.813
134 enumeration areas; 30 total households per enumeration area, 10 eligible households per enumeration area
Total study size: 3900 households in RCT area
Ten households without children under age 15 will be sampled – five with scores above the PMT cut-off and five with scores below
* Significance level for a one-sided hypothesis test

42
Annex 3: Evaluation Methodology
52. This Annex discusses the design of the Pantawid Pamilya impact evaluation and
describes the design and implementation of the evaluation survey. This discussion focuses on
the randomized control trials (RCT) methodology that was used for the impact evaluation.
Details on the regression discontinuity (RD) methodology that was also applied can be found in a
separate report (forthcoming).
A. Evaluation Design
53. Rigorous evaluation—one that estimates true causal effect—demands that any
observed change in outcomes in study units (households, communities, or regions) that
receive the program must be compared with a valid counterfactual. The counterfactual
represents the course of events that would have occurred in the treated unit in the absence of the
intervention. Various methodological approaches can be used to construct a valid counterfactual.
The most rigorous approach is an experimental design in which treatment/control status is
assigned to study units on a randomized basis.
54. Randomization ensures that all units have an equal chance of control or treatment
status, and it satisfies the conditions of a valid counterfactual comparison. These conditions
are: (i) all relevant pre-intervention factors/characteristics will be, on average, equal across the
treatment and control groups, and (ii) the only difference in observed outcomes is due to the
intervention and not to any other observed or unobserved factors. The main component of the
Pantawid Pamilya impact evaluation utilized this randomized treatment/control design to
estimate the causal impact of the program on priority outcomes and beneficiary behavior.
Barangays in Set 1 Batch 4 (see Annex 1: Sample Areas) were randomized into ―treatment‖ and
―control‖ groups, enabling a randomized control trials (RCT) approach to evaluation for this
population. Due to ethical considerations of withholding the program from poor households in
the control barangays, the agreement was that once released, the households in the control group
would receive the program for five years, the same number of years as for those in the treatment
group.
55. An RCT estimates program impact by comparing the mean among eligible
households in the treatment localities with the mean among “eligible” (i.e. who would have
been eligible if the program had been in operation) in the control localities. Figure 1
illustrates this RCT approach to impact evaluation. The left panel shows outcomes for each
household in a control locality plotted against the proxy means test score that was used to
determine eligibility (the ―index‖). The right panel shows outcomes for households in a
treatment locality. Since control and treatment localities are selected randomly, they should have
the same mean outcome in the absence of the program. Therefore, program impact is estimated
by comparing the means of the points in each of the boxes in Figure 1. The analysis can be
refined by comparing the means among ineligible households in each of the localities. If the
randomization is perfect, then the means between these two groups should be the same. If they
are not the same, this difference can be used to adjust the estimate to account for differences
across the localities.

43
56. In addition, the Pantawid Pamilya implementation enables alternative quasi-
experimental evaluation methods that can be used on a wider population than the RCT
barangays. These alternative methods will be utilized in conjunction with non-experimentally
designated barangays in order to (a) investigate the robustness of any findings, (b) extrapolate to
the wider national context, and (c) potentially establish a baseline impact with which to compare
future results based on this method (i.e. after the RCT method is no longer feasible because the
―control‖ group has been incorporated into the program). Specifically, the proxy means test
criterion of benefit receipt suggests the application of a regression discontinuity (RD) evaluation
design. As mentioned above, this report presents the findings from the RCT method only, and the
findings of the RD analysis are presented in a separate report (forthcoming).
Figure 8: Illustration of RCT Approach to Impact Evaluation
Without program With program
Note: Vertical dashed line at an index value of 50 shows the hypothetical cutoff for program eligibility.
57. Another critical consideration in the design of an impact study is the external
validity of the evaluation results—that is, the extent to which the results are relevant for
the potential population as a whole. Combining the RCT and RD approaches, the impact
evaluation covers interventions implemented on a broad scale—in 16 municipalities in 8
provinces around the country—and within existing government capabilities. Therefore, external
validity is achieved by the design for Set 1 expansion phase.
B. Survey Design and Implementation
Sample Size and Sample Selection
58. Since the main evaluation of Pantawid Pamilya is a cluster randomized trial with
treatment assignation at the cluster (barangay) level, a power analysis to determine
adequacy of study size was estimated using three main outcomes of interest. The main
outcomes considered were: monthly per capita household consumption, school participation of 6-
14 year olds, and health facility visits of 0-5 year olds. Either the 2007 Annual Poverty Indicator
Survey (APIS) dataset or 2003 National Demographic and Health Survey (NDHS) dataset was
01
02
03
04
05
0
Exp
en
ditu
res
0 10 20 30 40 50 60 70 80 90 100Index
01
02
03
04
05
0
Exp
en
ditu
res
0 10 20 30 40 50 60 70 80 90 100Index
Mean
outcome
without
program
Mean outcome with program
Mean
outcome
without
program

44
used to proxy for outcome mean and variance in the comparison population, which is defined
here as rural households in Set 1 Batch 4 provinces.22
59. The study size resulted in a relatively well-powered RCT study. The parameters of the
study are summarized in Table 6 in Annex 2: Sample Size Estimation. The analysis suggested an
RCT study size of 3,900 households randomly selected from 130 barangays: 65 barangays from
the population of Pantawid Pamilya experimental treatment barangays and 65 control barangays.
In each of the study barangays, 10 households were selected from the households eligible for
Pantawid Pamilya (i.e. with scores below the eligibility cutoff), and 10 households were selected
from the sample of ineligible households (i.e. with scores above the proxy means eligibility
cutoff). In the RCT study, this basic sample design was augmented by a sample of households
that were non-eligible due to their household structure. In the future, this will allow an analysis
of the potential program spillovers to households without children under age 14. This subsample
was comprised of five households per barangay with a score below the eligibility criterion and
five households with a score above the eligibility criterion.
60. In addition, key informants were interviewed to provide information on the local
environment and on the health and education services to which the study population had
access. The groups of key informants are described below.
Rural Health Units (RHU) and Midwives
61. All of the RHUs in the sample municipalities were interviewed for the study. As
there was no sampling framework for RHUs and midwives that could be obtained at the central
level, sampling was conducted by the field supervisors. Although the teams were instructed to
interview up to two RHUs in every municipality, none of the sample municipalities had more
than one RHU.
62. From the list of midwives who work and report to the RHU, the survey sampled
midwives who provided services at each of the sampled barangays. In case there was no
health facility at the sampled barangay, a midwife providing outreach services at that barangay
was sampled. If the sample barangay had more than one midwife providing services, one
midwife was randomly selected based on lottery. In some cases where a midwife provided
services in multiple barangays, the same midwife was interviewed multiple times to ensure that
questions regarding health service provision in each of the sampled barangays were asked.
Schools
63. One public elementary school per barangay and up to three public high schools per
municipality were sampled for interviews. The field supervisors also conducted sampling of
these schools. Based on the list of elementary schools attended by children living in the barangay
(not necessarily schools located in the barangay) obtained in the Barangay Captain Questionnaire,
one school was randomly sampled for each sampled barangay. For high schools, up to three
public high schools were sampled based on a list of all public high schools provided by the
22
In order to maintain sufficient sample sizes, all observations in these provinces (not just those in the RCT
barangays) were included in the estimates of means and variances that informed the power analysis.

45
mayor’s office. If a municipality had more than three public high schools, three were randomly
selected using a lottery.
Mayor’s Office and Barangay Captains
64. The mayor was interviewed in each municipality sampled. One barangay captain for
each barangay was also included in the sample.
Timeframe of the Study
65. Preparation for the study commenced in 2008. The set of provinces and municipalities
for the RCT was selected jointly by DSWD and the World Bank, and randomization was carried
out in October 2008. The sample for the impact evaluation was selected in three stages. First,
provinces in which the program had not yet been introduced in some of the eligible
municipalities as of October 2008 were selected, which is known as the expansion phase Set 1
Batch 4 (see Table 4 for comparison of sampled municipalities versus other Set 1 regions). Out
of the 11 provinces available, 3 provinces were excluded due to security concerns. From the
remaining 8 provinces, 4 provinces were chosen to span all three macro areas of the country
(North, Visayas, and Mindanao). Second, among the selected four provinces, municipalities were
randomly chosen to represent the average poverty level of areas covered by the program. Third,
within each of the municipalities selected in the evaluation sample, barangays were randomly
selected into treatment and control groups. Data for the Household Assessment Form (HAF) to
run the proxy means test for beneficiary selection was fielded in the eight RCT municipalities
between October 2008 and January 2009. This was followed by the implementation of Panwatid
Pamilya in the treatment barangays, with the first payment of cash grants commencing in April
2009.
66. Implementation of the impact evaluation survey began in 2011. Implementation was
originally planned for September/October 2010 but was delayed by one year due to the
administrative processes of procurement of the data collection firm. Social Weather Stations
(SWS), a local organization known for its regular opinion surveys, was selected to conduct the
data collection and data entry. Data collection in the RCT areas was conducted during October to
November 2011 by 4 teams consisting of 11 supervisors and 164 trained field interviewers. Data
encoding was conducted centrally in Manila, and all the data collected from households was
entered twice by different data encoders and validated to ensure quality control. SWS completed
the data encoding by March 2012.
67. The control group was released after data collection. Immediately after the survey
teams left the municipalities after data collection, community assemblies were called to enroll
the eligible beneficiaries in control barangays. Implementation of Pantawid Pamilya in control
barangays started in December 2011, with the first payment commencing in February 2012.

46
Annex 4: Description of the RCT Analysis and Sample
68. This Annex discusses the randomized control trials (RCT) analysis that was
conducted for the Pantawid Pamilya impact evaluation and describes the survey sample. A
description of the regression discontinuity (RD) analysis that was also conducted is provided in a
separate report (forthcoming).
Statistical Specifications
69. The impact evaluation compared outcomes between barangays within the sample
framework that were randomly assigned to receive Pantawid Pamilya and barangays
assigned to be controls. For the RCT sample, based on households eligible for Pantawid
Pamilya benefits in treatment and control barangays, the following linear regression form is
specified:
yij = α +βTj + γXij + ηij (a)
70. Where:
y denotes the outcome in household (or individual) i in barangay j
α, β, γ are fixed parameters
TTis the binary variable which is equal to 1 if the household (or the individual) is
in a treatment barangay and 0 if in a control barangay
η is the random error term
X is the age dummy added for all child-level variables, where appropriate
71. Based on this simple specification, the outcome for an eligible household living in the
treatment barangay is obtained by:
E(yij | T=1) = α + β + γXij (b)
72. The outcome for an eligible household living in the control barangay is similarly obtained
by:
E(yij | T=0) = α + γXij (c)
73. The difference between the conditional expectation for yij between eligible households in
Pantawid Pamilya treatment barangays and control barangays is therefore summarized by the
estimate of the parameter β, which can be considered as the mean intended treatment effect of
the program:
E(yij | T=1) - E(yij | T=0) = β (d)

47
74. Taking into consideration regional factors—including province-specific eligibility
cutoffs23
—and the clustered nature of the sample, municipality fixed effects regressions are
included as well as all standard errors clustered at the barangay level.
Balance Test 75. As the study did not have a full baseline aside from the data collected to estimate the
PMT scores, a balance test to assess the successfulness of the randomization was conducted
using this data (the Household Assessment data collected for the NHTS-PR). Analysis of
NHTS-PR data collected prior to the implementation of Pantawid Pamilya in 2008 indicates that
the treatment and control groups were similar in 2008. Barangay-level averages for a range of
indicators (population, poverty incidence, household composition, asset ownership, housing
amenities, education achievements, school enrollment, visits to health centers) were computed
(Table 7). Distributions of these indicators for the treatment and control groups were compared
using both t-test and Kolmogorov-Smirnov tests, both indicating that the treatment and control
groups were well-balanced.
Table 7: Balance Test Household Characteristics
Baseline survey variables Sample
Mean
Control
Mean
Treatment
Mean
Difference
(p-value)
Kolmogorov
(p-value)
Household composition:
Household size 5.68 5.69 5.66 0.74 0.92
Children 5 years old and below 1.09 1.10 1.08 0.52 0.04
Children between 6 and 14 years old 1.65 1.64 1.65 0.86 0.64
Primary occupation: Farming and
livestock 71.25 69.37 73.14 0.33 0.80
Highest educational attainment of the household heads: No grade completed 8.99 8.49 9.49 0.64 0.80
Some elementary school 40.99 41.97 40.00 0.42 0.35
Completed elementary school 21.76 21.77 21.75 0.99 0.92
Some high school 11.99 12.78 11.20 0.21 0.64
High school graduate 11.14 10.43 11.85 0.28 0.80
Some college 3.68 3.34 4.02 0.37 0.80
College graduate 1.84 1.74 1.94 0.64 0.92
Attendance to school: Attendance of children 6 to 11 years old 0.94 0.94 0.94 0.98 0.92
Attendance of children 12 to 14 years old 0.41 0.40 0.42 0.39 0.25
Housing Amenities: Strong roof materials 26.73 27.04 26.42 0.89 0.49
Strong wall materials 16.41 16.89 15.93 0.81 0.98
Light roof materials 53.99 52.68 55.31 0.54 0.92
Light wall materials 47.16 45.96 48.36 0.59 0.64
23
Provincial poverty lines were used to identify the poor through the PMT. As such, the eligibility cutoff for the
program differs by province.

48
Owns a house and lot 32.22 32.94 31.50 0.71 0.17
House has no toilet 42.38 43.33 41.42 0.62 0.80
Household Assets: Electricity in house 41.00 39.62 42.38 0.54 0.49
Owns a television 17.56 17.69 17.42 0.90 0.64
Owns a Stereo/CD player 10.06 10.54 9.58 0.47 0.80
Has a telephone/cellphone 6.06 5.76 6.35 0.56 0.98
Owns a motorcycle 1.96 2.18 1.74 0.30 0.92
*** p<0.01, ** p<0.05, * p<0.1
Robustness of Results
76. This report presents the analysis based on Intention to Treat (ITT), found to be
robust compared to program impacts assessed based on Treatment on Treated (ToT)
analysis. The ITT analysis includes all potential beneficiaries in the treatment barangays as
program beneficiaries and all potential beneficiaries in the control groups as not receiving the
program benefits, regardless of their actual program beneficiary status. The ToT analysis
assesses the program impacts on those who are actual program beneficiaries. This
complementary ToT analysis takes into account that household participation in Pantawid
Pamilya is voluntary and that program take-up, while high, is less than universal. To assess the
program impact through ToT, regressions were run using the random assignment of barangays
into treatment and control as the instrumental variable (IV) on program participation. Two data
sources for program participation were used: (i) data from the program’s beneficiary database
and (ii) self-reporting of program beneficiary status by household survey respondents. Main
regressions were run using both data sources, and as seen in Table 40 to Table 45 the directions
as well as the magnitude of the program impacts on all variables based on ITT and ToT were
consistent, although the magnitudes of impact were slightly higher using ToT. This report
focuses on the ITT results as they are arguably the more policy-relevant parameter estimate,
although the consistency of results given by the average treatment effect on the treated should be
noted.
The RCT Sample
77. In the eight municipalities selected for the impact evaluation RCT study, a total of
3,742 households were surveyed based on four Sample Groups. The four Sample Groups
were defined using the NHTS-PR database as follows (Table 8)24
:
1,418 Sample Group 1 households that were the poor households (below the PMT score)
with children aged 0-14 or a pregnant mother at the time of the household assessment
(the eligible group for Pantawid Pamilya);
1,137 Sample Group 2 households that were the non-poor households (above the PMT
score) with children aged 0-14 or a pregnant mother;
24
The sample was designed to identify spillover effects to non-beneficiary target groups, as well as to run the RD
analysis on the data from RCT sample areas.

49
556 Sample Group 3 households that were the poor households without children aged 0-
14 or a pregnant mother; and
631 Sample Group 4 households that were the non-poor without children aged 0-14 or a
pregnant mother.
Table 8: Households Sampled, by Sample Category
Treatment Sample 1
(Poor with
eligible children)
Sample 2
(Non-poor with
eligible children)
Sample 3
(Poor no eligible
children)
Sample 4
(Non-poor no
eligible children)
Pantawid Pamilya 714 578 291 313
Control 704 559 265 318
Total 1418 1137 556 631
78. In this RCT study, the impact of Pantawid Pamilya was assessed based on
comparisons of averages of indicators between Sample Group 1 households in the
treatment barangays and the control barangays. Possible impacts of the program on Sample
Groups 2, 3, and 4 households will be explored in subsequent analysis that investigates the
existence of program spillover effects and their effects on the design of RDD as a method for
future evaluations.
Pantawid Pamilya Program Coverage in the RCT Sample
79. Information gathered from the impact evaluation survey and information in the
program Management Information System (MIS) database yielded slightly different
estimates of program coverage. Although all of the 1,418 households in Sample Group 1 were
eligible to become Pantawid Pamilya beneficiaries in 2008, only those in treatment barangays
were offered the program in 2009 by design. According to the impact evaluation survey, among
the 704 households sampled in the Pantawid barangays, 85 percent (581) reported being
beneficiaries of the program, while 1 percent (7) in the control barangays also reported being
beneficiaries. According to the program MIS database, however, the control barangays did not
have any beneficiary households, and 91 percent (647) of the 704 sampled households in the
Pantawid barangays were beneficiaries of the program. Small numbers of households among
Sample Groups 2, 3, and 4 (5 percent, 5 percent, and 10 percent, respectively) reported being
Pantawid Pamilya beneficiaries, even though none of these households were program
beneficiaries according to the program MIS database.
Table 9: Program Beneficiary Status Among the Poor Eligible Population Self Report
Treatment barangays Control barangays
Beneficiary Non-Beneficiary Beneficiary Non-Beneficiary
According to
MIS database
Beneficiary 552 (80.8%) 78 (11.4%) 0 0
Non Beneficiary 29 (4.2%) 24 (3.5%) 7 (1.3%) 550 (98.7%)
TOTAL 683 557
80. The lower percentage of sampled households in Pantawid Pamilya barangays who
reported being program beneficiaries may be explained in part by the fact that program
participation is voluntary. Some households identified as potential beneficiaries may have
waived their right to the program. Another possibility is that through the community validation
process of NHTS-PR, these households may have been taken off the list of poor households. It is

50
also possible that a potential beneficiary household was unaware of the community assembly
where attendance is required for potential beneficiaries to sign up for the program and confirm
their basic household information collected for the PMT.
81. Although very small in number, it is more difficult to explain why non-beneficiary
households according to the program MIS reported themselves to be Pantawid Pamilya
beneficiaries in the survey. There is no official way for a household that was not identified as
poor by the NTHS-PR to be registered as a Pantawid Pamilya beneficiary. It is possible that the
respondents were thinking of some other program they received rather than Pantawid Pamilya.
82. Nonetheless, these results confirm that the targeting of treatment barangays was
implemented as planned. The results suggest the absence of confounding program availability
in control areas and the validity of the evaluation design.
Characteristics of the Study Population
83. The distribution of households by province depended purely on the number of
barangays in each of the eight municipalities (Table 10). Of the 3,742 households sampled for
RCT analysis, 37 percent (1,395) were in Lanao del Norte, 31 percent (1,160) in Negros Oriental,
18 percent (684) in Occidental Mindoro, and 13 percent (5.3) in Mountain Province.
Table 10: Households Sampled, by Sample Group and by Province
Province Sample 1 (Poor with
eligible children)
Sample 2 (Non-poor with
eligible children)
Sample 3 (Poor with no
eligible children)
Sample 4 (Non-poor with no
eligible children)
Total
Lanao Del Norte 559 367 236 233 1,395
Mountain Province 184 171 62 86 503
Negros Oriental 431 365 174 190 1,160
Occidental Mindoro 244 234 84 122 684
TOTAL 1,418 1,137 556 631 3,742
84. According to the 2011 survey, the eligible group (Sample Group 1) had relatively
larger households and a higher proportion of households engaged in agriculture. These
households had 6.06 household members on average, with an average of 0.85 children aged 0-5
years old, 1.7 children aged 6-14 years old, and 0.7 children aged 15-18 years old. Just over half
(54 percent) of the households reported having at least one adult engaged in agriculture. All other
sample group households had smaller household sizes with fewer children, with a smaller
proportion of households engaged in agriculture. The proportion of Indigenous Peoples (IP)
households was similar at around 13 percent for all sample groups, except for Sample 4 who
were non-poor and had no children in the eligible group. A slightly higher proportion of
households in the control group in all sample groups lived in the población, more centrally in the
municipality (Table 1).

51
Annex 5: Description of Impact Evaluation Survey Modules
The full set of questionnaires is available for download at the DSWD website:
http://www.dswd.gov.ph
MODULES
AND FORMS
MAIN RESPONDENT AND
AREAS COVERED IN THE MODULE
Module A
Household – Main
PART 1: Household head: household roster; household assessment; migration; housing
characteristics; poverty and hunger; general opinions on marriage and children; social
support group; labor; family agriculture and aquaculture business; engagement in fishing;
family non-farm business; economic difficulties; shocks; household economy
PART 2: Spouse of household head: household consumption; price information;
exposure to banking; saving; borrowing; lending; community participation; social
capital; attendance in parenting sessions; 4Ps knowledge/perceptions; governance; future
expectations
Module B
Household – Mother
Women younger than 50 years old and who have ever been pregnant or have ever been
married or has/had a partner: reproductive history; use of prenatal, delivery and postnatal
care; family planning; knowledge, aptitude, and practice; female empowerment and
decision making
Module C
Household – School-
aged Children
PART 1: Main caregiver of the school-aged child (6-17 years old): education;
expenditure for schooling
PART 2: Child aged 10-17 years old: child labor; work for pay and no pay; attitudes
about the future
Module D Household – Children
Five Years Old
PART 1: Mother of the child and child 5 years old and below: birth registration; daycare
or preschool enrollment and attendance; use of health care; feeding practices
PART 2: All mother/guardian of children five years and below who takes solid food
aside from breastmilk: nutritional Status; anthropometrics (for all children 5 years old
and below)
PART 3: Parent or guardian of the child 3 and 5 years of age: age and stages questions
Module E Service Provider –
School
School Principal: school characteristics; characteristics of the principal; facilities; new
student admissions; students and teachers; drop out and completion rates; national exam
scores; scholarships; student attendance; teacher attendance; textbooks; schooling
expenses (by parents); Parent-Teacher Committee/Association (PTA); school budget;
information about Compliance Verification forms of 4Ps
Module F Service Provider –
Health Facility – RHU
Rural Health Officer (Head of Rural Health Unit): facility characteristics; beds and
accreditation; RHU health characteristics; list of doctors, nurses, and midwives reporting
to his RHU/Health Center; fees; service hours; patients; outreach; vaccine provision and
stock; basic supply; sources of funds; use of funds; information about Compliance
Verification forms of 4Ps
Module G
Service Provider –
Barangay Health Station
Midwife in charge of the Barangay Health Station or someone who provides outreach
services in the barangay: health facility characteristics; fees; patients; BHS
characteristics and midwife’s services; service provision at the barangay level; last three
deliveries; information about Compliance Verification forms of 4Ps
Module H Service Provider –
Barangay
Barangay Captain: barangay characteristics; access to transportation; availability of
electricity; water and sanitation; schools; health facility; health officers; natural disasters;
economic activities
Module I Local Government –
Mayor
Municipal Mayor: personal characteristics; social programs; decentralization;
effectiveness and efficiency; accountability; transparency; rule of law

52
Annex 6: Items on the Consumption Module
The Impact Evaluation used the APIS consumption module. During the PAST SIX MONTHS, how much on the average is your actual weekly consumption on the following? (Include all food items consumed from purchases paid whether in cash or on credit, received as gifts or own-produced. Round to the nearest peso.)
Code Total In cash/ on credit
In kind Received as gift
1. Food Consumed At Home
a Cereal and cereal preparations (rice, corn, bread, biscuits, kur, native cakes, noodles, infant cereal, cereal-based junk foods, etc.)
b Roots and tubers (potato, cassava, sweet potato, gabi, ubi, tugui, cassava cake, haleya, potato chips, etc.)
c Fruits and vegetables (fresh hits, leafy veg., green/dry beans and other legumes, coconut, peanuts, fruit preparation, pickled veg., tokwa, tausi, miso, peanut, butter, etc.)
d Meat and meat preparations (fresh chicken, fresh beef, fresh pork, corned beef, goat's meat, corned beef, luncheon meat, meat loaf, vienna sausage, longanisa, chorizo, hotdog, tocino, tapa, etc.)
e Dairy products and eggs (milk, ice cream, butter, cheese, fresh eggs, balut, salted eggs)
f Fish and marine products (fresh fish, shrimps, squid, shells, sardines, daing, tuyo, tinapa, bagoong, canned squid, etc.)
g Coffee, cocoa and tea (processed, coffee beans, Milo, Ovaltine, proessed cocoa, cocoa beans, processed tea, tea leaves, etc.)
h Non-alcoholic beverages (soft drinks, pineapple juice, orange juice, ice candy, ice drop, ice buko, etc.)
i Food not elsewhere classified (sugar products, cooking oil, margarine, sauces, salt, other spices & seasoning, prepared meals - bought outside and eaten at home, ice, honey, etc.
2. Food regularly consumed outside the home (meals at schools, place of work, restaurants, merienda or snacks, etc.)
3. Alcoholic beverages (beer, tuba, basi, lambanog, brandy, whisky, rhum, etc.)
4. Tobacco (cigarettes, cigars, betel nut, leaf and lime, chewing tobacco, leaf tobacco, etc.)
Fuel, Transportation, Household and Personal Care Expenses During the PAST SIX MONTHS, how much on the average is your monthly expenses/consumption on the following? (Includes all expenses/consumption whether purchased or paid in cash or on credit, received as gifts or own-produced. Round to the nearest peso).
Code Total In cash/ on credit
In kind Received as gift
1. Fuel, light and water (charcoal, firewood, LPG, kerosene/gas, electricity, candle, oils, water, etc.)
2. Transportation and communication (bus, jeepney, tricycle, air transport fare, water transport fare, gasoline/diesel, driver's salary, telephone bills, postage stamps, telegrams, driving lesson fees, feeds for animals used for transport, etc.)
3. Household operations (laundry soap and detergent, starch, floor wax, insect spray/mt and mosquito killer/coil, cleanser/scouring pad, air freshener/deodorizer, fluorescent/incandescent bulbs, matches, brooms, husks, battery, etc.)
4. Personal care and effects (cleansing cream, body deodorant, lotion, baby oil, toilet/bath soap, tissue paper, toothpaste, sanitary napkin, shampoo, jewelry, handbag, wallet, wristwatch, haircut, manicure/ pedicure, etc.)

53
Clothing, Education, Medicines, Taxes and Others During the PAST SIX MONTHS, how much on the average is your actual disbursements/expenditures on the following? (Include expenditures whether purchased/paid for in cash or on credit, received as gifts. Round to the nearest peso).
Item Code In Cash/ In Credit
Received as Gifts
1. Clothing, footwear and other wear (clothing & ready-made apparel, footwear, sewing materials, accessories, service fees)
2. Education (tuition fees, graduation fees, allowance for family member studying away from home, books, school supplies, etc.)
3. Recreation (children bicycle & playcars, dolls, balls, mahjong sets, admission tickets to movies, rental of video tapes, food for pets, etc.)
4. Medical care (drugs & medicines, hospital room charges, medical and dental charges, other medical goods & supplies, herbal medicines etc.)
5. Non-durable furnishing (dinnerware, glassware, silverware, plastic ware, kitchen utensils/knives, mosquito net, pillow, pillow cases, etc.
6. Durable furnishings (refrigerator, cooking range/ stove, washing machine, T.V., Cassette recorder, electric fan, etc.)
7. Taxes (income tax, real estate tax, car registration, toll fees & other license, residence certificate, etc.)
8. House maintenance and repair (carpentry materials, electrical materials, masonry, paint, plumbing materials, etc.)
9. Special occasions (birthday, wedding, baptismal, anniversary, family reunion, etc.)
10. Gifts and contributions to others (gifts and assistance to private individuals outside the family, contribution to church, donations, etc.)
11. Other expenditures (life insurance & retirement premiums, SSS, GSIS, losses due to fire & theft, legal fees, membership fees, medicare, pre-need plan, etc.)
12. Other disbursements
a. Purchase/amortization of real property
b. Payments of cash loan (principal)
c. Installments for appliances, etc. bought before February 2011
d. Installments for personal transport bought before February 2011
e. Loans granted to persons outside the family
f. Amounts deposited in banks/investments
g. Other disbursements (major repair and construction of house, withholding taxes from current income, payment for goods/services acquired/ availed of outside reference period, back rentals paid during the reference period, etc.)

54
Annex 7: Environmental and Supply-Side Factors in the Study Areas
85. This section presents the findings from interviews with the Municipal Mayor;25
the
Village Captain; the local health facilities and their midwives who provide most of the
maternal, neonatal, and child health (MNCH) services; and school principals. The study
found that access to schools at the barangay level seemed more standardized across the areas
covered by the survey, perhaps reflecting the municipal mayors’ reporting of having enough
resources and personnel for service delivery in education. In contrast, the study found wide
variation in the level of access to and provision of health services, which may partially explain
the heterogeneity in Pantawid program impacts across regions.
Municipality Characteristics
86. Among the eight municipalities surveyed, one-third reported having non-food
subsidy programs such as for health and education, while all mayors reported having
Pantawid Pamilya as well as the PhilHealth Indigent program. Only half of the mayors felt
they had enough budget to implement health programs. Half said they had enough infrastructure
for health, and two-thirds thought they had enough professional officials for service delivery.
Municipalities seemed to fare better in the implementation of education programs: two-thirds
said they had enough budget, two-thirds said they had enough infrastructure for education, and
three-quarters said they had enough professional officials.
87. When comparing the number of municipalities with different social programs and types
of programs, Occidental Mindoro appear to have the most complete variation of social programs
implemented in the municipalities at the time of the survey. Mountain Province and Lanao del
Norte where the provinces with fewer municipalities with different social programs.
Table 11: Number of Municipalities Implementing Social Programs Province
NFA Rice Subsidy Food-For School PhilHealth Indigent
Program Pantawid Pamilya KALAHI-CIDSS
Yes
Yes in FY2011
Yes Yes in
FY2011 Yes
Yes in FY2011
Yes Yes in
FY2011 Yes
Yes in FY2011
Negros Oriental 2 1 1 1 2 2 2 2 1 1
Lanao Del Norte 2 0 2 1 2 0 2 0 2 2
Mountain Province 1 1 0 0 2 1 2 0 2 0
Occidental Mindoro 2 2 2 2 2 2 2 2 2 2
Province
Non-Food Subsidy Improving Access to
Financial Services
Transportation Infrastructure in
Rural areas
Improving Business Climate for Small
Enterprise
Increasing Regional
Minimum Salary
Yes
Yes in FY2011
Yes Yes in
FY2011 Yes
Yes in FY2011
Yes Yes in
FY2011 Yes
Yes in FY2011
Negros Oriental 2 2 1 1 2 2 2 2 2 2
Lanao Del Norte 2 0 1 0 2 2 1 1 2 2
Mountain Province 1 1 0 0 1 0 2 0 0 0 Occidental Mindoro 2 2 2 2 2 2 1 1 1 1
25
Interviews were carried out with the eight municipal mayors of the municipalities included in the study. All of the
mayors were male, with an average age of 53 years old.

55
Barangay Characteristics
88. The characteristics of the 130 barangays included in the study varied considerably.
The population size ranged from an average of 1,596 people in Negros Oriental to 3,139 in
Mountain Province. The proportion of IP population in the village according to the Barangay
Captain also varied widely, from the lowest of 10.5 percent in Negros Oriental to the highest of
100 percent in Mountain Province.26
89. At the village level, levels of access to health and education facilities seemed most
problematic in Lanao del Norte, with the lowest average number of elementary schools and
high schools in which the children in the village were enrolled.27
In contrast, Mountain
Province had the largest concentration of schools in which children enrolled from the specific
village. Although all villages in Mountain Province had a Barangay Health Station (BHS) with a
midwife providing basic health services, the distance to the closest Rural Health Unit (RHU) was
by far the longest. Access to basic MNCH services seemed to be most problematic in Lanao del
Norte, followed by Negros Oriental with about 1 in 6 villages in these provinces not having a
midwife to provide regular services in the village. Nevertheless, it must be noted that given the
difficult geographic conditions in Mountain Province, one cannot assume that access to schools
and health facilities is less problematic at the household level than in other provinces.
Table 12: Village Characteristics
Indicators
Negros
Oriental
(N=38)
Lanao
del Norte
(N=52)
Mountain
Province
(N=17)
Oriental
Mindoro
(N=23)
Avg. population size 1,596 2,225 3,139 2748
Avg. number of households 389 397 390 499
Avg. % of IP population 10.5% 30.8% 100% 56.5%
Avg. number of daycare centers in the village 1.32 1.38 4.65 3
Avg. number of elementary level schools in the village 1.05 0.94 2.53 1.96
Avg. number of high schools in the village 0.21 0.17 0.77 0.22
% with a health facility (BHS, RHU, or hospital) in the village 47% 58% 100% 74%
Avg. time to BHS if none in village (minutes) 31 24 - 10
Avg. distance to BHS if none in village (kms) 5.1 3.8 - 3.0
Avg. time to RHU if none in village (minutes) 33 25 87 32
Avg. distance to RHU if none in village (kms) 7.67 6.04 14 8.0
% with a doctor who provides services in village 34% 29% 19% 61%
% with a nurse who provides services in village 39% 56% 44% 65%
% with a midwife who provides services in village 86% 83% 100% 100%
% with a traditional midwife servicing in village 76% 62% 63% 48%
% experienced flooding in village in last two years 47% 38% 18% 65%
% experienced earthquake in village in last two years 97% 17% 24% 70%
% experienced drought in village in last two years 26% 12% 29% 43%
26
This is an interesting contrast with the households’ self-identification of their IP status. By province, Negros
Oriental had the lowest proportion of households identifying themselves as being IP (1.9 percent), and the highest
was in Mountain Province (70.7 percent). In Lanao del Norte, 4.5 percent of households identified themselves as
being IP. 27
These schools, however, are not necessarily physically located in the village.

56
Health Facility Characteristics
90. The sample of health facilities in the survey consisted of two types: one rural health
unit per municipality and the 130 midwives who report to these RHUs. The midwives were
sampled randomly among the midwives who provide services (or outreach services) in the 130
barangays included in the study. These samples of RHUs and midwives did not fully cover the
health services in these provinces but are presented here as they may partially explain the
regional differences in program impacts described above.
91. The study findings clearly indicate that health service providers in Lanao del Norte
were by far the most stretched, which may partially explain the lack of program impact on
health indicators in this province. The two RHUs in Lanao del Norte were the least resourced
in terms of medical personnel as well as finances, yet they were seeing the largest number of
patients per week and were expected to cover the largest number of villages and population in
their respective catchment areas. Only one of the two RHUs in Lanao del Norte was PhilHealth-
accredited, probably reflecting the lack of a doctor at one of the RHUs surveyed. The RHUs in
Oriental Mindoro were also stretched, with large numbers of patients seen per week and small
numbers of midwives per population, and again only one of the two RHUs was PhilHealth-
accredited.
Table 13: Characteristics of Rural Health Units
Indicators
Negros
Oriental
(N=2)
Lanao del
Norte
(N=2)
Mountain
Province
(N=2)
Oriental
Mindoro
(N=2)
% accredited by PhilHealth 100% 50% 100% 50%
% accredited by Sentrong 100% 50% 50% 0
Average number of doctors 1 0.5 1 1.5
Average number of nurses 2 3 4 6
Average number of midwives 9.5 10 11 5.5
Midwife population ratio (for 10,000 people) 3.2 2.4 7.5 2.5
Average number of patients in the past week 24 57 41.5 151
Average revenues in 2010 2,082,800 245,900 22,600,000 3,665,000
Average expenses in 2010 867,879 1,111,660 523,771 956,500
Average net profit in 2010 687,810 -619,860 22,100,000 2,708,500
Average number of villages in catchment area 19 26 8.5 11.5
Average population size in catchment area 29,500 43,280 17,604.5 23,362
92. The study found that the characteristics of the midwives and the services they
provided in the villages varied considerably by province (Table 14). Negros Oriental and
Lanao del Norte had midwives with an average age of about 50 years old, while the midwives in
Mountain Province and Oriental Mindoro were younger at about 41 years old. The average
number of patients seen in the village in the previous one week varied significantly from
province to province, although the ranges of the number of patients seen were also wide. What is
striking is that the midwives in Lanao del Norte seemed to be stretched, on average providing
services in 3.8 villages and serving the largest patient load per village, with the smallest amount
of support from the Barangay Health Workers (BHWs). Midwives in Lanao del Norte spent the
shortest amount of time per week per village. However, as indicated by the average (and the

57
median) number of days lapsed since the last delivery the midwives assisted (a proxy for the
frequency of deliveries they assist), midwives in both Lanao del Norte and Oriental Mindoro
assisted fewer deliveries than midwives in other provinces. Again, the shortage of basic maternal
and child health service delivery may have contributed to the small Pantawid program impacts
on health indicators in Lanao del Norte.
Table 14: Services Provided by Midwives in the Villages
Indicators
Negros
Oriental
(N=38)
Lanao
del Norte
(N=52)
Mountain
Province
(N=17)
Oriental
Mindoro
(N=23)
Average age of midwives 49.5 50.5 41.8 41.2%
% of midwives originally from the municipality 60.5% 86.5% 94.1% 65.2%
Average number of patients seen in the village during the
previous one week (range)
27.0
(3-136)
42.7
(0-527)
35.7
(2 – 60)
30.0
(0 – 110)
Average number of villages she serves (range) 3.6
(1-6)
3.8
(1-7)
1.0
(1)
3.5
(1 – 7)
Average number of hours spent per week in sampled
barangay (non-Pantawid)
14.7 4.7 29 13.6
Average number of hours spent per week in sampled
barangay (Pantawid)
9.9 6.2 42.5 12.4
Average number of Barangay Health Workers 6.0 5.0 11.5 14.6
Average number of days since last delivery assisted
(median)
36.8
(12)
149
(55)
21.1
(18.5)
99
(53)
% used partograph in the previous three deliveries assisted 45.5% 17.6% 42.8% 28.4%
School Characteristics
93. Public elementary and high schools were also visited as part of the survey. A total of
149 schools were visited, and the school principals were interviewed. Of the 149 schools, 10
schools were incomplete primary schools, 10 were complete primary schools (from grades 1 to
4), 100 schools were complete elementary (from grades 1 to 6), and 29 were complete high
schools. Again, the data presented here do not represent the conditions of all schools in the
provinces or regions, but they do reflect the conditions of schools that the children in the study
attended.
Table 15: Types and Numbers of School Surveyed
Types of schools surveyed Number of schools surveyed
Incomplete primary 10
Complete primary (grades 1 – 4) 10
Complete elementary (grades 1 – 6) 100
Complete high school 29
Total 149
94. At the elementary school level, the condition of schools as well as dropout and
repetition rates varied considerably by province. The student-teacher ratio and the student-
classroom ratios did not differ considerably by province, except for the lower ratios in Mountain
Province. According to school reports, the completion rates were highest in Lanao del Norte at
89.9 percent and lowest in Negros Oriental at 72.5 percent, but Negros Oriental had a relatively
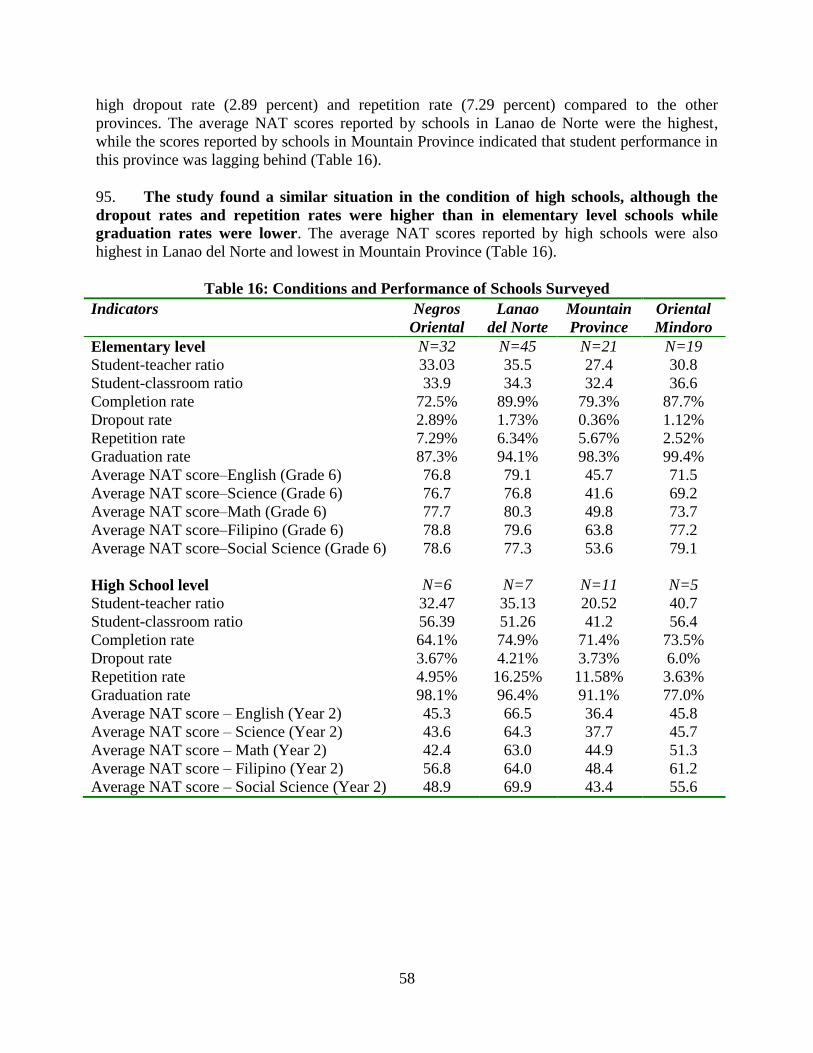
58
high dropout rate (2.89 percent) and repetition rate (7.29 percent) compared to the other
provinces. The average NAT scores reported by schools in Lanao de Norte were the highest,
while the scores reported by schools in Mountain Province indicated that student performance in
this province was lagging behind (Table 16).
95. The study found a similar situation in the condition of high schools, although the
dropout rates and repetition rates were higher than in elementary level schools while
graduation rates were lower. The average NAT scores reported by high schools were also
highest in Lanao del Norte and lowest in Mountain Province (Table 16).
Table 16: Conditions and Performance of Schools Surveyed
Indicators Negros
Oriental
Lanao
del Norte
Mountain
Province
Oriental
Mindoro
Elementary level N=32 N=45 N=21 N=19
Student-teacher ratio 33.03 35.5 27.4 30.8
Student-classroom ratio 33.9 34.3 32.4 36.6
Completion rate 72.5% 89.9% 79.3% 87.7%
Dropout rate 2.89% 1.73% 0.36% 1.12%
Repetition rate 7.29% 6.34% 5.67% 2.52%
Graduation rate 87.3% 94.1% 98.3% 99.4%
Average NAT score–English (Grade 6) 76.8 79.1 45.7 71.5
Average NAT score–Science (Grade 6) 76.7 76.8 41.6 69.2
Average NAT score–Math (Grade 6) 77.7 80.3 49.8 73.7
Average NAT score–Filipino (Grade 6) 78.8 79.6 63.8 77.2
Average NAT score–Social Science (Grade 6) 78.6 77.3 53.6 79.1
High School level N=6 N=7 N=11 N=5
Student-teacher ratio 32.47 35.13 20.52 40.7
Student-classroom ratio 56.39 51.26 41.2 56.4
Completion rate 64.1% 74.9% 71.4% 73.5%
Dropout rate 3.67% 4.21% 3.73% 6.0%
Repetition rate 4.95% 16.25% 11.58% 3.63%
Graduation rate 98.1% 96.4% 91.1% 77.0%
Average NAT score – English (Year 2) 45.3 66.5 36.4 45.8
Average NAT score – Science (Year 2) 43.6 64.3 37.7 45.7
Average NAT score – Math (Year 2) 42.4 63.0 44.9 51.3
Average NAT score – Filipino (Year 2) 56.8 64.0 48.4 61.2
Average NAT score – Social Science (Year 2) 48.9 69.9 43.4 55.6

59
Annex 8: Tables
Table 17: Program Impact on Pre-School/Daycare Enrollment and Attendance
Enrolled in day
care or preschool
(3-5yrs)
Day care or
preschool
attendance 85% of
days
coef/se coef/se
Program impact 0.103** 0.066
(0.040) (0.043)
Age in months 0.018*** 0.006***
(0.002) (0.002)
_cons -0.286*** 0.409***
(0.100) (0.107)
Control_mean 0.650 0.733
Treatment_mean 0.762 0.782
Number of observations 698 468
note: *** p<0.01, ** p<0.05, * p<0.1

60
Table 18: Program Impact on Education (6 to 17 years old)
Enrolled
in school
6-11yrs
Enrolled
in school
12-14yrs
Enrolled
in school
15-17yrs
Attended
>85% 6-
11yrs
Attende
d >85%
12-14yrs
Attende
d >85%
15-17yrs
Started
elementary at
age 6 among
6-9yrs
Children
12-15yrs
are in high
school
Years of
school
repeated
Years of
schooling
coef/se coef/se coef/se coef/se coef/se coef/se coef/se coef/se coef/se coef/se
Program impact 0.045*** 0.039 -0.027 0.038** 0.049** 0.076*** -0.036 0.003 -0.003 0.060
(0.014) (0.024) (0.041) (0.017) (0.020) (0.021) (0.031) (0.035) (0.070) (0.086)
Age in years 0.003 -0.046*** -0.114*** -0.001 0.009 0.044*** -0.160*** 0.216*** 0.024** 0.825***
(0.004) (0.017) (0.022) (0.003) (0.013) (0.012) (0.012) (0.012) (0.012) (0.010)
_cons 0.909*** 1.449*** 2.446*** 0.915*** 0.793*** 0.204 1.811*** -2.372*** 1.102*** -4.178***
(0.034) (0.220) (0.348) (0.032) (0.168) (0.207) (0.088) (0.162) (0.148) (0.112)
Control_mean 0.933 0.845 0.623 0.912 0.911 0.906 0.616 0.531 1.398 5.391
Treatment_mean 0.979 0.885 0.582 0.945 0.958 0.985 0.576 0.486 1.376 5.308
Number of observations 1,570 809 713 1,463 680 410 1,008 865 791 3,006
note: *** p<0.01, ** p<0.05, * p<0.1
Table 19: Program Impact on Use of Maternal Health Services (for pregnancies in the previous three years)
Received
antenatal
care at least 4
times
Number of times
received
antenatal care
Antenatal care
quality index
Postnatal care at
facility w/in 24
hrs
Postnatal
care at
home w/in
24 hrs
Delivery
assisted by
doctor/
midwife
Facility-
based
delivery
coef/se coef/se coef/se coef/se coef/se coef/se coef/se
Program impact 0.105** 0.616* 0.628*** 0.101 0.096** 0.037 0.002
(0.047) (0.320) (0.176) (0.065) (0.038) (0.053) (0.039)
_cons 0.537*** 4.173*** 5.012*** 0.646*** 0.142*** 0.413*** 0.261***
(0.037) (0.280) (0.128) (0.047) (0.025) (0.040) (0.028)
Control_mean 0.542 4.200 5.017 0.636 0.143 0.417 0.263
Treatment_mean 0.637 4.764 5.636 0.755 0.236 0.446 0.261
Number of observations 672 672 631 182 540 683 683
note: *** p<0.01, ** p<0.05, * p<0.1

61
Table 20: Program Impact on Maternal and Neonatal Health (for pregnancies in the previous three years)
Table 21: Program Impact on Malnutrition
z-score
weight-
for-age
z-score
height-
for-age
z-score
weight-
for-
height
Malnutrition
weight-for-
age:6-
36months
Severe
malnutrition
weight-for
age:6-
36months
Wasting
weight-
for
height:6-
36months
Severe
wasting
weight-
for-
height:6-
36months
Stunting
height-
for-age:6-
36months
Severe
stunting
height-
for-age:6-
36months
coef/se coef/se coef/se coef/se coef/se coef/se coef/se coef/se coef/se
Program impact -0.002 -0.202 0.081 -0.026 0.011 0.045 0.027 -0.039 -0.101**
(0.099) (0.207) (0.142) (0.048) (0.029) (0.034) (0.021) (0.052) (0.043)
Age in months -0.007** -0.013** 0.010** 0.005** -0.000 -0.006*** -0.001 0.016*** 0.012***
(0.003) (0.006) (0.004) (0.003) (0.001) (0.002) (0.001) (0.003) (0.002)
_cons -1.008*** -1.547*** -0.483*** 0.184*** 0.091*** 0.221*** 0.064** 0.192*** 0.006
(0.129) (0.257) (0.186) (0.058) (0.031) (0.046) (0.027) (0.060) (0.044)
Control_mean -1.213 -1.950 -0.168 0.287 0.085 0.108 0.036 0.497 0.240
Treatment_mean -1.232 -2.218 -0.047 0.267 0.094 0.143 0.060 0.473 0.147
Number of observations 920 896 868 390 390 349 349 351 351
note: *** p<0.01, ** p<0.05, * p<0.1
Suffered night blindness during pregnancy Perceived size of newborn at birth
coef/se coef/se
Program impact 0.002 0.006
(0.028) (0.062)
_cons 0.112*** 2.940***
(0.020) (0.039)
Control_mean 0.112 2.953
Treatment_mean 0.114 2.935
Number of observations 681 653
note: *** p<0.01, ** p<0.05, * p<0.1

62
Table 22: Program Impact on Feeding Practices
Fed eggs Fed meat Fed fish Fed vegetables
Initiated
breastfeeding
w/in 24 hrs of
birth
Exclusive
breasfeeding for
6 months
coef/se coef/se coef/se coef/se coef/se coef/se
Program impact 0.091*** 0.001 0.042* -0.006 -0.030 -0.046
(0.035) (0.036) (0.025) (0.021) (0.031) (0.042)
Age in months 0.001* 0.001* 0.002*** 0.003*** -0.002** 0.001
(0.001) (0.001) (0.001) (0.001) (0.001) (0.001)
_cons 0.637*** 0.448*** 0.743*** 0.761*** 0.808*** 0.560***
(0.035) (0.042) (0.032) (0.030) (0.028) (0.049)
Control_mean 0.691 0.511 0.852 0.896 0.745 0.574
Treatment_mean 0.773 0.507 0.880 0.894 0.724 0.535
Number of observations 1,071 1,070 1,071 1,069 1,130 643
note: *** p<0.01, ** p<0.05, * p<0.1
Table 23: Program Impact on Use of Child Health Services
Regular weighing
according to age Took deworming pills
Took Vitamin
A BCG Measles
Sought treatment
any illness
coef/se coef/se coef/se coef/se coef/se coef/se
Program impact 0.150*** 0.067** 0.062** 0.030 0.036 0.132***
(0.030) (0.032) (0.029) (0.027) (0.026) (0.035)
Age in months 0.004*** 0.010*** -0.001 0.001* 0.006*** -0.000
(0.001) (0.001) (0.001) (0.000) (0.001) (0.001)
_cons 0.034 0.154*** 0.774*** 0.855*** 0.586*** 0.416***
(0.025) (0.031) (0.034) (0.025) (0.034) (0.034)
Control_mean 0.169 0.553 0.749 0.880 0.804 0.397
Treatment_mean 0.333 0.633 0.806 0.911 0.842 0.543
Number of observations 1,133 1,155 1,086 1,151 1,113 1,113
note: *** p<0.01, ** p<0.05, * p<0.1

63
Table 24: Program Impact on Deworming of School-Aged Children
Deworm pills offered 6-14yrs Took deworm pills 6-14yrs Took >1 deworm pill 6-14yrs
coef/se coef/se coef/se
Program impact 0.042** 0.047** 0.093***
(0.020) (0.022) (0.028)
Age in years -0.026*** -0.024*** -0.008*
(0.004) (0.004) (0.004)
_cons 1.064*** 0.987*** 0.348***
(0.039) (0.044) (0.047)
Control_mean 0.799 0.745 0.268
Treatment_mean 0.845 0.796 0.362
Number of observations 2,158 2,157 2,140
note: *** p<0.01, ** p<0.05, * p<0.1
Table 25: Program Impact on Household Expenditures 1
Ln household
consumption per
capita
Ln consumption
on education per
capita
Ln consumption
on medical per
capita
Ln consumption
on alcohol
Ln consumption
on gambling
coef/se coef/se coef/se coef/se coef/se
Program impact 0.027 0.317** 0.289* -0.331*** -0.065
(0.037) (0.129) (0.149) (0.092) (0.056)
_cons 9.428*** 3.969*** 3.043*** 1.276*** 0.160***
(0.026) (0.086) (0.099) (0.069) (0.046)
Control_mean 9.444 3.998 3.077 1.286 0.160
Treatment_mean 9.438 4.256 3.298 0.936 0.094
Number of observations 1,418 1,415 1,415 1,417 1,417
note: *** p<0.01, ** p<0.05, * p<0.1
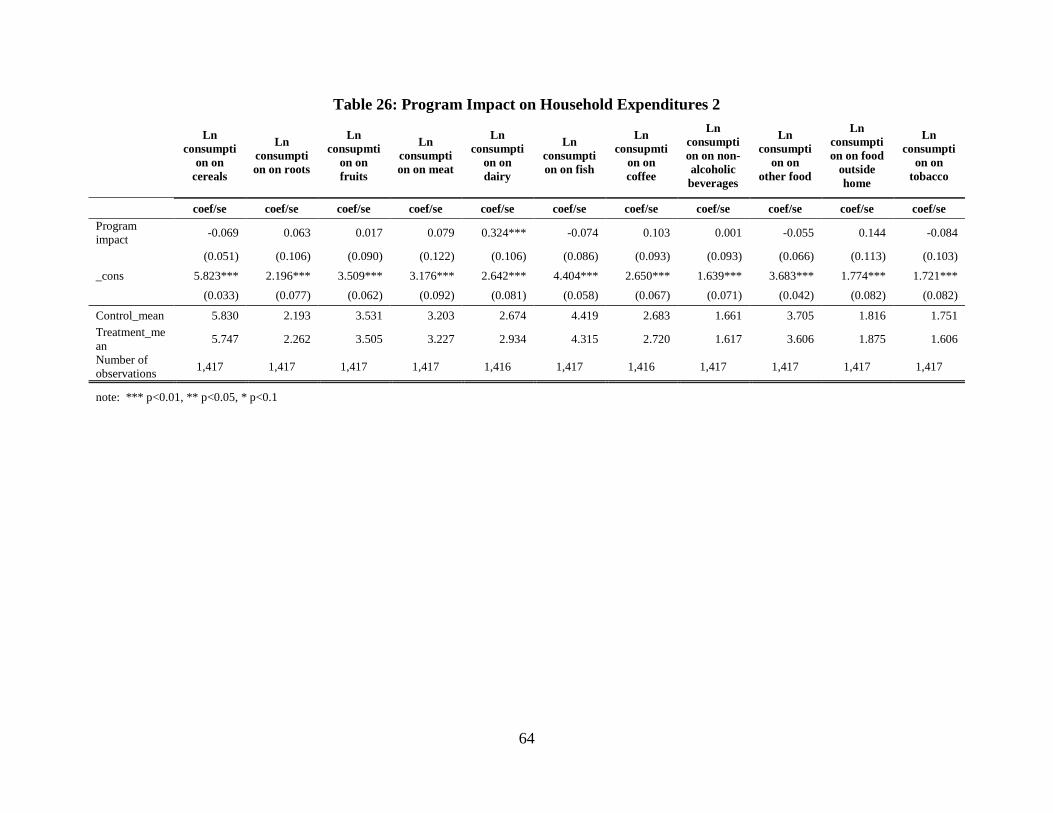
64
Table 26: Program Impact on Household Expenditures 2
Ln
consumpti
on on
cereals
Ln
consumpti
on on roots
Ln
consupmti
on on
fruits
Ln
consumpti
on on meat
Ln
consumpti
on on
dairy
Ln
consumpti
on on fish
Ln
consupmti
on on
coffee
Ln
consumpti
on on non-
alcoholic
beverages
Ln
consumpti
on on
other food
Ln
consumpti
on on food
outside
home
Ln
consumpti
on on
tobacco
coef/se coef/se coef/se coef/se coef/se coef/se coef/se coef/se coef/se coef/se coef/se
Program
impact -0.069 0.063 0.017 0.079 0.324*** -0.074 0.103 0.001 -0.055 0.144 -0.084
(0.051) (0.106) (0.090) (0.122) (0.106) (0.086) (0.093) (0.093) (0.066) (0.113) (0.103)
_cons 5.823*** 2.196*** 3.509*** 3.176*** 2.642*** 4.404*** 2.650*** 1.639*** 3.683*** 1.774*** 1.721***
(0.033) (0.077) (0.062) (0.092) (0.081) (0.058) (0.067) (0.071) (0.042) (0.082) (0.082)
Control_mean 5.830 2.193 3.531 3.203 2.674 4.419 2.683 1.661 3.705 1.816 1.751
Treatment_me
an 5.747 2.262 3.505 3.227 2.934 4.315 2.720 1.617 3.606 1.875 1.606
Number of
observations 1,417 1,417 1,417 1,417 1,416 1,417 1,416 1,417 1,417 1,417 1,417
note: *** p<0.01, ** p<0.05, * p<0.1

65
Table 27: Program Impact on Expenditures on Schooling per Child
Ln total
expenditu
res on
schooling
6-17yrs
Ln
expenditu
res on
schooling
6-11yrs
Ln
expenditu
res on
schooling
12-14yrs
Ln
expenditu
res on
schooling
15-17yrs
Ln
expenditu
res on
school
tuition
fees 6-
17yrs
Ln
expenditu
res on
exam fees
6-17yrs
Ln
expenditure
s on
extracurric
ular
activities 6-
17yrs
Ln
expenditu
res on
supportin
g
materials
6-17yrs
Ln
expenditu
res on
uniforms
6-17yrs
Ln
expenditu
res on
books 6-
17yrs
Ln
expenditu
res on
snacks 6-
17yrs
coef/se coef/se coef/se coef/se coef/se coef/se coef/se coef/se coef/se coef/se coef/se
Program
impact 0.333** 0.205** 0.085 0.230 0.276** 0.218* 0.191* 0.206 0.671*** 0.074* 0.320*
(0.141) (0.088) (0.111) (0.149) (0.135) (0.122) (0.106) (0.129) (0.163) (0.039) (0.167)
Age in years -0.188*** 0.057** 0.220*** 0.105 -0.016 0.007 0.034*** -0.143*** -0.047** 0.006 -0.130***
(0.022) (0.023) (0.059) (0.132) (0.018) (0.017) (0.011) (0.017) (0.018) (0.006) (0.022)
_cons 8.207*** 6.484*** 4.662*** 6.146*** 3.529*** 1.660*** 0.479*** 5.803*** 3.577*** 0.077 6.388***
(0.256) (0.231) (0.762) (2.050) (0.226) (0.207) (0.135) (0.208) (0.245) (0.069) (0.282)
Control_mea
n 6.057 6.994 7.518 7.828 3.350 1.737 0.879 4.163 3.051 0.144 4.903
Treatment_
mean 6.402 7.156 7.596 8.012 3.613 1.959 1.056 4.381 3.702 0.214 5.223
Number of
observations 3,084 1,494 694 429 3,098 3,098 3,098 3,098 3,098 3,098 3,098
note: *** p<0.01, ** p<0.05, * p<0.1
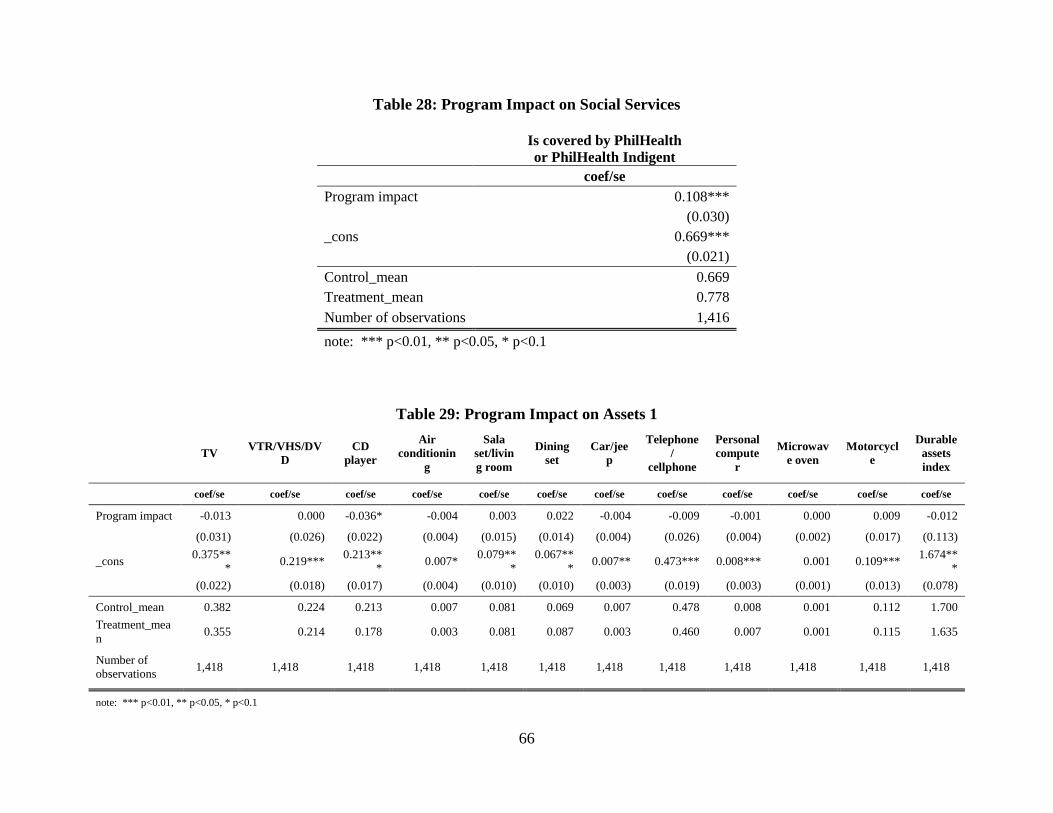
66
Table 28: Program Impact on Social Services
Is covered by PhilHealth
or PhilHealth Indigent
coef/se
Program impact 0.108***
(0.030)
_cons 0.669***
(0.021)
Control_mean 0.669
Treatment_mean 0.778
Number of observations 1,416
note: *** p<0.01, ** p<0.05, * p<0.1
Table 29: Program Impact on Assets 1
TV VTR/VHS/DV
D
CD
player
Air
conditionin
g
Sala
set/livin
g room
Dining
set
Car/jee
p
Telephone
/
cellphone
Personal
compute
r
Microwav
e oven
Motorcycl
e
Durable
assets
index
coef/se coef/se coef/se coef/se coef/se coef/se coef/se coef/se coef/se coef/se coef/se coef/se
Program impact -0.013 0.000 -0.036* -0.004 0.003 0.022 -0.004 -0.009 -0.001 0.000 0.009 -0.012
(0.031) (0.026) (0.022) (0.004) (0.015) (0.014) (0.004) (0.026) (0.004) (0.002) (0.017) (0.113)
_cons 0.375**
* 0.219***
0.213**
* 0.007*
0.079**
*
0.067**
* 0.007** 0.473*** 0.008*** 0.001 0.109***
1.674**
*
(0.022) (0.018) (0.017) (0.004) (0.010) (0.010) (0.003) (0.019) (0.003) (0.001) (0.013) (0.078)
Control_mean 0.382 0.224 0.213 0.007 0.081 0.069 0.007 0.478 0.008 0.001 0.112 1.700
Treatment_mea
n 0.355 0.214 0.178 0.003 0.081 0.087 0.003 0.460 0.007 0.001 0.115 1.635
Number of
observations 1,418 1,418 1,418 1,418 1,418 1,418 1,418 1,418 1,418 1,418 1,418 1,418
note: *** p<0.01, ** p<0.05, * p<0.1

67
Table 30: Program Impact on Assets 2
Poultry
Number
of
poultries
Pig Number
of pigs Goat
Number
of goats Cow
Number
of cows Horse
Number
of horses
Owns
any
livestock
coef/se coef/se coef/se coef/se coef/se coef/se coef/se coef/se coef/se coef/se coef/se
Program impact -0.046 -0.295 -0.056* -0.090 0.036 0.135** -0.015 -0.024 -0.038** -0.049** -0.050*
(0.033) (0.374) (0.033) (0.111) (0.027) (0.067) (0.035) (0.075) (0.019) (0.024) (0.029)
_cons 0.628*** 3.944*** 0.458*** 0.938*** 0.148*** 0.280*** 0.315*** 0.517*** 0.071*** 0.088*** 0.789***
(0.025) (0.257) (0.026) (0.091) (0.019) (0.039) (0.025) (0.054) (0.016) (0.020) (0.021)
Control_mean 0.623 3.941 0.457 0.943 0.143 0.270 0.311 0.513 0.069 0.085 0.786
Treatment_mean 0.587 3.652 0.403 0.842 0.190 0.425 0.303 0.498 0.034 0.041 0.741
Number of observations 1,418 1,418 1,418 1,418 1,418 1,415 1,417 1,415 1,418 1,417 1,418
note: *** p<0.01, ** p<0.05, * p<0.1
Table 31: Program Impact on Savings and Having a Bank Account
Has savings Ln savings
amount
Has a bank
account
coef/se coef/se coef/se
Program impact 0.037 0.236 0.010
(0.024) (0.156) (0.017)
_cons 0.182*** 1.153*** 0.094***
(0.016) (0.100) (0.012)
Control_mean 0.187 1.189 0.095
Treatment_mean 0.214 1.353 0.102
Number of observations 1,394 1,405 1,390
note: *** p<0.01, ** p<0.05, * p<0.1

68
Table 32: Program Impact on Savings and Having a Bank Account (Provincial Heterogeneity)
Has savings Ln savings amount Has a bank account
coef/se coef/se coef/se
Program impact on NO 0.099*** 0.593*** 0.017
(0.028) (0.167) (0.013)
Program impact on LdN -0.120*** -0.741*** -0.041*
(0.046) (0.278) (0.024)
Program impact on MP -0.009 0.101 0.135***
(0.085) (0.589) (0.051)
Program impact on OM -0.073 -0.439 -0.048
(0.077) (0.543) (0.074)
_cons 0.181*** 1.149*** 0.094***
(0.016) (0.096) (0.011)
Control_NO 0.084 0.373 0.010
Treatment_NO 0.176 0.937 0.027
Control_LdN 0.176 1.119 0.081
Treatment_LdN 0.150 0.945 0.055
Control_MP 0.247 1.588 0.041
Treatment_MP 0.342 2.304 0.198
Control_OM 0.336 2.363 0.325
Treatment_OM 0.351 2.441 0.292
Number of observations 1,394 1,405 1,390
note: *** p<0.01, ** p<0.05, * p<0.1

69
Table 33: Program Adult Labor
Worked at
least one
hour past 7
days
Hours of work
in a week past
7 days
Number hours
worked past 7
days
Looked for
job past 7
days
coef/se coef/se coef/se coef/se
Program impact 0.002 0.286 0.201 -0.011
(0.017) (1.286) (1.297) (0.010)
_cons 0.619*** 41.272*** 42.310*** 0.036***
(0.013) (0.887) (0.845) (0.007)
Control_mean 0.619 41.543 42.563 0.037
Treatment_mean 0.621 41.277 42.253 0.024
Number of observations 4,006 2,208 2,387 1,501
note: *** p<0.01, ** p<0.05, * p<0.1
Table 34: Fertility Rates in the Last Three Years by Age Group, by Treatment and Control
Age Groups
Fertility Rate (95% Confidence Interval)
Pantawid barangay Non-Pantawid barangay
15 to 19 years old 0.204 (0.125 - 0.283) 0.158 (0.055 - 0.261)
20 to 24 years old 0.257 (0.204 - 0.309) 0.221 (0.157 - 0.284)
25 to 29 years old 0.200 (0.157 - 0.243) 0.248 (0.202 -0.293)
30 to 34 years old 0.169 (0.121 - 0.217) 0.133 (0.092 -0.174)
35 to 39 years old 0.111 (0.071 - 0.150) 0.104 (0.070 - 0.137)
40 to 44 years old 0.076 (0.048 - 0.104) 0.063 (0.037 - 0.090)
45 to 49 years old 0.018 (-0.006 - 0.043) 0.018 (-0.002 -0.038)
Total Fertility Rate 5.171 (4.590 - 5.752) 4.724 (4.013 - 5.434)

70
Table 35: Program Impact on Household Expenditures 1 (Provincial Heterogeneity)
Ln household
consumption
per capita
Ln
consumption
on education
per capita
Ln
consumption
on medical per
capita
coef/se coef/se coef/se
Program impact on NO 0.092* 0.812*** 0.410
(0.054) (0.196) (0.270)
Program impact on LdN -0.116 -0.738*** 0.024
(0.080) (0.276) (0.351)
Program impact on MP -0.176 -1.129*** -0.534
(0.134) (0.391) (0.618)
Program impact on OM 0.020 -0.339 -0.358
(0.110) (0.421) (0.391)
_cons 9.427*** 3.962*** 3.040***
(0.026) (0.082) (0.098)
Control_NO 8.993 2.919 2.011
Treatment_NO 9.083 3.726 2.429
Control_LdN 9.590 3.998 3.165
Treatment_LdN 9.560 4.069 3.597
Control_MP 9.617 5.690 3.771
Treatment_MP 9.502 5.370 3.611
Control_OM 9.701 4.437 4.037
Treatment_OM 9.804 4.914 4.071
Number of observations 1,418 1,415 1,415
note: *** p<0.01, ** p<0.05, * p<0.1

71
Table 36: Program Impact on Household Expenditures 2 (Provincial Heterogeneity)
Ln
consu
mption
on
cereals
Ln
consumpt
ion o
roots
Ln
consupmt
ion on
fruits
Ln
consumpt
ion on
meat
Ln
consumpt
ion on
dairy
Ln
consumpt
ion on
fish
Ln
consupmt
ion on
coffee
Ln
consumpt
ion on
non-
alcoholic
beverages
Ln
consumpt
ion on
other
food
Ln
consumpt
ion
onfood
outside
home
Ln
consumpt
ion on
tobacco
coef/se coef/se coef/se coef/se coef/se coef/se coef/se coef/se coef/se coef/se coef/se
Program
impact on NO
-0.083 0.005 -0.040 0.593*** 0.585*** -0.061 0.436** 0.432*** 0.087 0.389** -0.038
(0.079) (0.208) (0.163) (0.156) (0.155) (0.157) (0.186) (0.129) (0.082) (0.174) (0.163)
Program
impact on LdN
0.023 -0.057 0.188 -0.874*** -0.512** -0.050 -0.642*** -0.946*** -0.243* -0.498** -0.035
(0.117) (0.257) (0.213) (0.271) (0.235) (0.203) (0.234) (0.184) (0.145) (0.253) (0.246)
Program
impact on MP
-0.196 0.099 -0.365 -0.801** -0.354 -0.222 -0.439 -0.458 -0.402** -0.469 -0.345
(0.170) (0.336) (0.337) (0.314) (0.345) (0.340) (0.294) (0.287) (0.195) (0.303) (0.295)
Program
impact on OM
0.173 0.394 0.175 -0.377 -0.072 0.206 -0.129 0.013 0.036 0.074 0.077
(0.137) (0.357) (0.245) (0.340) (0.307) (0.243) (0.249) (0.288) (0.181) (0.373) (0.294)
_cons 5.823*
** 2.198*** 3.510*** 3.169*** 2.639*** 4.404*** 2.647*** 1.635*** 3.681*** 1.772*** 1.720***
(0.032) (0.076) (0.061) (0.088) (0.079) (0.058) (0.065) (0.065) (0.041) (0.080) (0.081)
Control_NO 5.645 2.571 2.949 2.329 1.760 3.995 1.735 0.865 3.095 0.762 0.964
Treatment_NO 5.567 2.569 2.903 2.930 2.354 3.934 2.146 1.298 3.179 1.142 0.904
Control_LdN 5.831 1.644 3.553 3.337 2.849 4.717 2.889 2.055 3.705 1.525 1.842
Treatment_Ld
N 5.768 1.597 3.709 3.032 2.903 4.596 2.677 1.535 3.547 1.417 1.772
Control_MP 6.077 2.751 4.018 4.050 3.168 3.907 2.911 1.950 4.290 2.553 2.609
Treatment_MP 5.792 2.864 3.582 3.796 3.334 3.572 2.849 1.861 3.939 2.401 2.146
Control_OM 5.932 2.389 4.033 3.643 3.354 4.812 3.551 1.827 4.226 3.565 2.144
Treatment_O
M 6.019 2.787 4.149 3.849 3.855 4.960 3.858 2.258 4.338 4.015 2.188
Number of
observations 1,417 1,417 1,417 1,417 1,416 1,417 1,416 1,417 1,417 1,417 1,417
note: *** p<0.01, ** p<0.05, * p<0.1
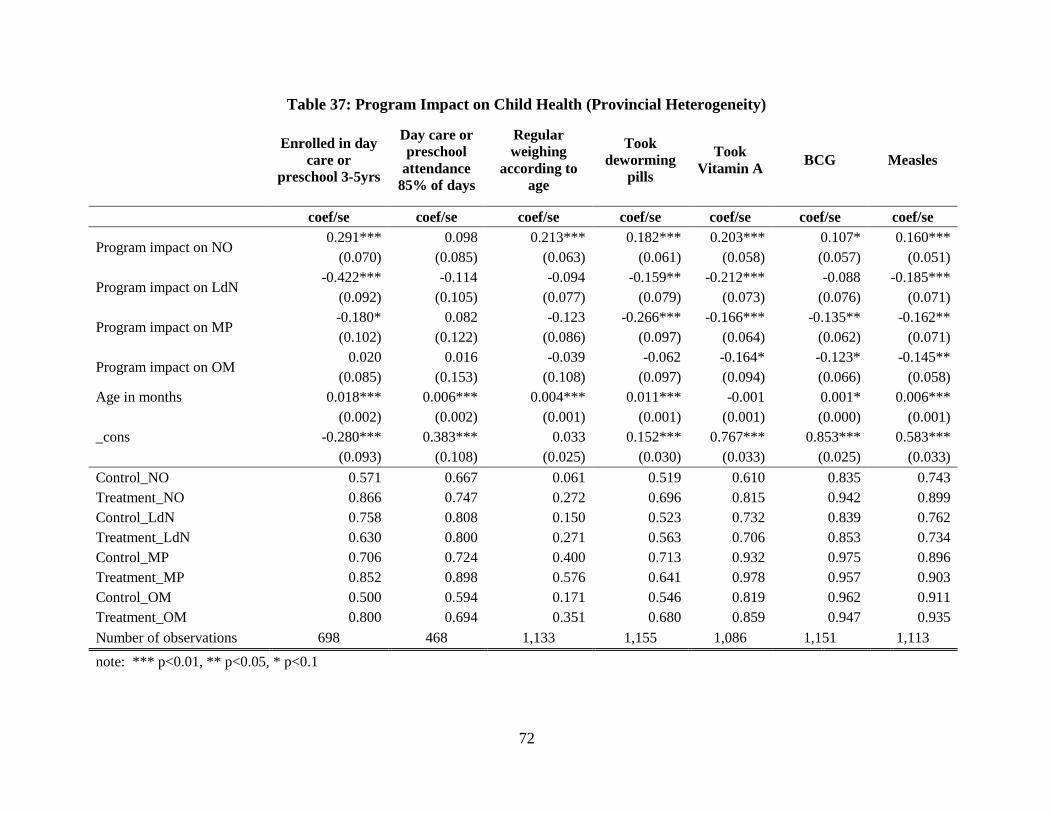
72
Table 37: Program Impact on Child Health (Provincial Heterogeneity)
Enrolled in day
care or
preschool 3-5yrs
Day care or
preschool
attendance
85% of days
Regular
weighing
according to
age
Took
deworming
pills
Took
Vitamin A BCG Measles
coef/se coef/se coef/se coef/se coef/se coef/se coef/se
Program impact on NO 0.291*** 0.098 0.213*** 0.182*** 0.203*** 0.107* 0.160***
(0.070) (0.085) (0.063) (0.061) (0.058) (0.057) (0.051)
Program impact on LdN -0.422*** -0.114 -0.094 -0.159** -0.212*** -0.088 -0.185***
(0.092) (0.105) (0.077) (0.079) (0.073) (0.076) (0.071)
Program impact on MP -0.180* 0.082 -0.123 -0.266*** -0.166*** -0.135** -0.162**
(0.102) (0.122) (0.086) (0.097) (0.064) (0.062) (0.071)
Program impact on OM 0.020 0.016 -0.039 -0.062 -0.164* -0.123* -0.145**
(0.085) (0.153) (0.108) (0.097) (0.094) (0.066) (0.058)
Age in months 0.018*** 0.006*** 0.004*** 0.011*** -0.001 0.001* 0.006***
(0.002) (0.002) (0.001) (0.001) (0.001) (0.000) (0.001)
_cons -0.280*** 0.383*** 0.033 0.152*** 0.767*** 0.853*** 0.583***
(0.093) (0.108) (0.025) (0.030) (0.033) (0.025) (0.033)
Control_NO 0.571 0.667 0.061 0.519 0.610 0.835 0.743
Treatment_NO 0.866 0.747 0.272 0.696 0.815 0.942 0.899
Control_LdN 0.758 0.808 0.150 0.523 0.732 0.839 0.762
Treatment_LdN 0.630 0.800 0.271 0.563 0.706 0.853 0.734
Control_MP 0.706 0.724 0.400 0.713 0.932 0.975 0.896
Treatment_MP 0.852 0.898 0.576 0.641 0.978 0.957 0.903
Control_OM 0.500 0.594 0.171 0.546 0.819 0.962 0.911
Treatment_OM 0.800 0.694 0.351 0.680 0.859 0.947 0.935
Number of observations 698 468 1,133 1,155 1,086 1,151 1,113
note: *** p<0.01, ** p<0.05, * p<0.1
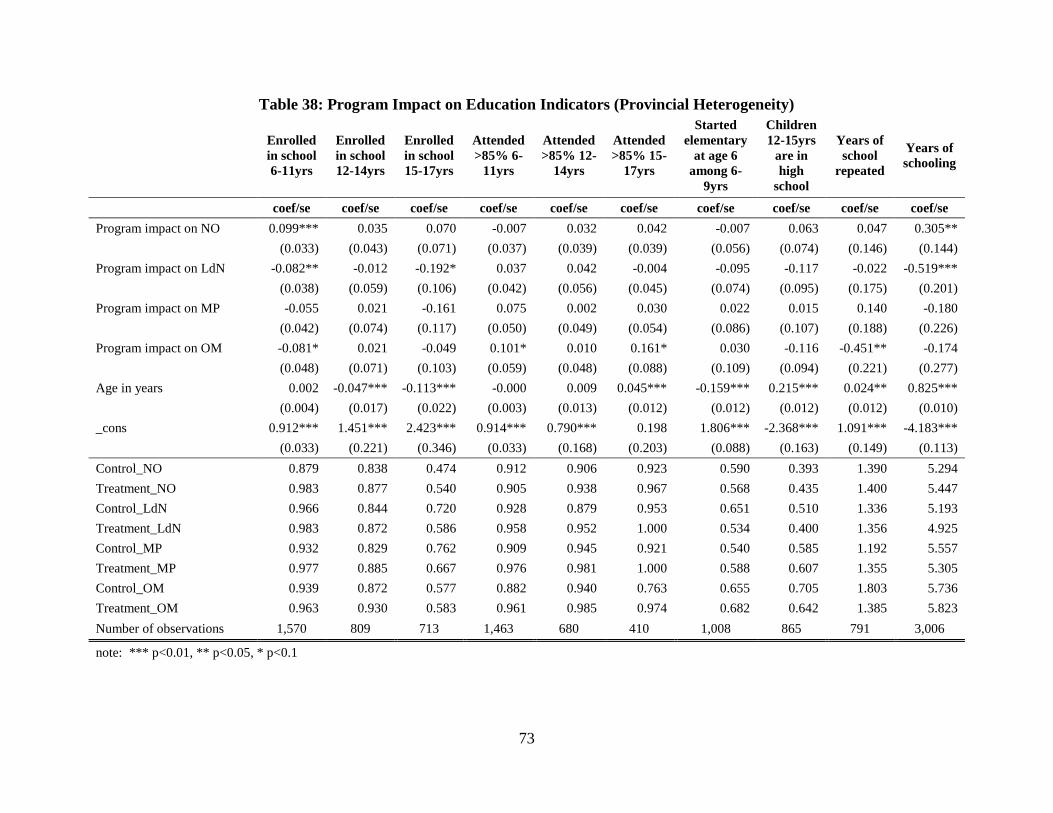
73
Table 38: Program Impact on Education Indicators (Provincial Heterogeneity)
Enrolled
in school
6-11yrs
Enrolled
in school
12-14yrs
Enrolled
in school
15-17yrs
Attended
>85% 6-
11yrs
Attended
>85% 12-
14yrs
Attended
>85% 15-
17yrs
Started
elementary
at age 6
among 6-
9yrs
Children
12-15yrs
are in
high
school
Years of
school
repeated
Years of
schooling
coef/se coef/se coef/se coef/se coef/se coef/se coef/se coef/se coef/se coef/se
Program impact on NO 0.099*** 0.035 0.070 -0.007 0.032 0.042 -0.007 0.063 0.047 0.305**
(0.033) (0.043) (0.071) (0.037) (0.039) (0.039) (0.056) (0.074) (0.146) (0.144)
Program impact on LdN -0.082** -0.012 -0.192* 0.037 0.042 -0.004 -0.095 -0.117 -0.022 -0.519***
(0.038) (0.059) (0.106) (0.042) (0.056) (0.045) (0.074) (0.095) (0.175) (0.201)
Program impact on MP -0.055 0.021 -0.161 0.075 0.002 0.030 0.022 0.015 0.140 -0.180
(0.042) (0.074) (0.117) (0.050) (0.049) (0.054) (0.086) (0.107) (0.188) (0.226)
Program impact on OM -0.081* 0.021 -0.049 0.101* 0.010 0.161* 0.030 -0.116 -0.451** -0.174
(0.048) (0.071) (0.103) (0.059) (0.048) (0.088) (0.109) (0.094) (0.221) (0.277)
Age in years 0.002 -0.047*** -0.113*** -0.000 0.009 0.045*** -0.159*** 0.215*** 0.024** 0.825***
(0.004) (0.017) (0.022) (0.003) (0.013) (0.012) (0.012) (0.012) (0.012) (0.010)
_cons 0.912*** 1.451*** 2.423*** 0.914*** 0.790*** 0.198 1.806*** -2.368*** 1.091*** -4.183***
(0.033) (0.221) (0.346) (0.033) (0.168) (0.203) (0.088) (0.163) (0.149) (0.113)
Control_NO 0.879 0.838 0.474 0.912 0.906 0.923 0.590 0.393 1.390 5.294
Treatment_NO 0.983 0.877 0.540 0.905 0.938 0.967 0.568 0.435 1.400 5.447
Control_LdN 0.966 0.844 0.720 0.928 0.879 0.953 0.651 0.510 1.336 5.193
Treatment_LdN 0.983 0.872 0.586 0.958 0.952 1.000 0.534 0.400 1.356 4.925
Control_MP 0.932 0.829 0.762 0.909 0.945 0.921 0.540 0.585 1.192 5.557
Treatment_MP 0.977 0.885 0.667 0.976 0.981 1.000 0.588 0.607 1.355 5.305
Control_OM 0.939 0.872 0.577 0.882 0.940 0.763 0.655 0.705 1.803 5.736
Treatment_OM 0.963 0.930 0.583 0.961 0.985 0.974 0.682 0.642 1.385 5.823
Number of observations 1,570 809 713 1,463 680 410 1,008 865 791 3,006
note: *** p<0.01, ** p<0.05, * p<0.1

74
Table 39: Program Impact on Access to Bank Account (Heterogeneity for Location of Residence)
Has a bank account
coef/se
Program impact (Live outside of Poblacion) 0.029*
(0.017)
treatXpob -0.129**
(0.060)
Program impact (Live in poblacion) 0.131***
(0.042)
_cons 0.075***
(0.011)
Control_pob 0.230
Treatment_pob 0.161
Control_nonpob 0.072
Treatment_nonpob 0.093
Number of observations 1,390
note: *** p<0.01, ** p<0.05, * p<0.1

75
Table 40: Robustness Test Applying Instrumental Variables (Reported Beneficiary Status)
Program Effects on Education
Enrolled
in
school 6-
11yrs
Enrolled
in
school
12-14yrs
Enrolled
in
school
15-17yrs
Attended
>85% 6-
11yrs
Attended
>85%
12-14yrs
Attended
>85%
15-17yrs
Started
elementary
at age 6
among 6-
9yrs
Children
12-15yrs
are in
high
school
Years of
school
repeated
Years of
schooling
coef/se coef/se coef/se coef/se coef/se coef/se coef/se coef/se coef/se coef/se
Program Impact 0.050*** 0.012 -0.050 0.046** 0.045* 0.106*** -0.028 -0.056 -0.035 -0.188
(0.018) (0.025) (0.052) (0.020) (0.024) (0.029) (0.042) (0.044) (0.081) (0.146)
Municipality 2 0.144** -0.012 -0.030 0.133** 0.045 0.070 0.088 -0.090 -0.111 0.602***
(0.057) (0.047) (0.076) (0.055) (0.054) (0.050) (0.075) (0.067) (0.141) (0.181)
Municipality 3 0.135** 0.025 0.120* 0.140** 0.055 0.096** 0.182** 0.011 -0.193 0.152
(0.059) (0.045) (0.068) (0.055) (0.057) (0.049) (0.073) (0.071) (0.127) (0.196)
Municipality 4 0.158*** -0.013 0.106 0.142*** 0.019 0.080 -0.055 -0.104 -0.097 0.019
(0.058) (0.049) (0.089) (0.054) (0.058) (0.050) (0.084) (0.069) (0.109) (0.230)
Municipality 5 0.118** 0.040 0.139 0.123** 0.078 0.004 0.072 0.139 -0.223 0.312
(0.059) (0.052) (0.096) (0.058) (0.058) (0.066) (0.072) (0.091) (0.150) (0.274)
Municipality 6 0.110* 0.002 0.144 0.179*** 0.085 0.069 -0.021 0.122* -0.107 0.541**
(0.062) (0.058) (0.099) (0.053) (0.055) (0.054) (0.098) (0.074) (0.119) (0.241)
Municipality 7 0.107* 0.053 0.152** 0.159*** 0.108** -0.081 0.221** 0.231*** 0.156 0.703**
(0.062) (0.058) (0.069) (0.054) (0.051) (0.081) (0.091) (0.072) (0.199) (0.327)
Municipality 8 0.155*** 0.054 -0.071 0.047 0.043 0.035 0.046 0.117 0.069 1.036***
(0.057) (0.051) (0.088) (0.075) (0.058) (0.065) (0.089) (0.072) (0.141) (0.238)
_cons 0.808*** 0.864*** 0.565*** 0.783*** 0.866*** 0.849*** 0.536*** 0.520*** 1.502*** 5.090***
(0.060) (0.042) (0.060) (0.054) (0.052) (0.048) (0.074) (0.053) (0.097) (0.152)
Control_mean 0.935 0.868 0.609 0.915 0.916 0.911 0.588 0.531 1.422 5.485
Treatment_mean 0.982 0.894 0.594 0.944 0.960 0.982 0.601 0.486 1.384 5.279
Number of
observations 1,403 710 649 1,318 608 379 900 775 703 2,686
note: *** p<0.01, ** p<0.05, * p<0.1

76
Table 41: Robustness Test Applying Instrumental Variables (Beneficiary Status According to Program Database)
Program Effects on Education
Enrolled
in school
6-11yrs
Enrolled
in school
12-14yrs
Enrolled
in school
15-17yrs
Attended
>85% 6-
11yrs
Attended
>85% 12-
14yrs
Attended
>85% 15-
17yrs
Started
elementary
at age 6
among 6-
9yrs
Children
12-15yrs
are in
high
school
Years of
school
repeated
Years of
schooling
coef/se coef/se coef/se coef/se coef/se coef/se coef/se coef/se coef/se coef/se
Program Impact 0.047*** 0.043* -0.035 0.040** 0.051** 0.084*** -0.033 -0.038 -0.015 -0.087
(0.015) (0.025) (0.044) (0.018) (0.020) (0.023) (0.035) (0.039) (0.073) (0.130)
Municipality 2 0.120** -0.023 -0.023 0.105* 0.034 0.059 0.070 -0.091 -0.146 0.559***
(0.051) (0.045) (0.071) (0.054) (0.054) (0.051) (0.066) (0.070) (0.144) (0.175)
Municipality 3 0.118** 0.013 0.133** 0.110** 0.034 0.088* 0.175*** 0.020 -0.203 0.216
(0.053) (0.044) (0.066) (0.053) (0.056) (0.050) (0.063) (0.074) (0.134) (0.184)
Municipality 4 0.128** -0.049 0.131 0.115** 0.007 0.071 -0.054 -0.083 -0.114 -0.035
(0.051) (0.050) (0.085) (0.053) (0.059) (0.052) (0.072) (0.072) (0.118) (0.223)
Municipality 5 0.102* 0.009 0.197** 0.074 0.050 0.047 0.046 0.093 -0.269* 0.291
(0.052) (0.050) (0.078) (0.061) (0.057) (0.063) (0.066) (0.083) (0.142) (0.229)
Municipality 6 0.109* -0.042 0.189** 0.154*** 0.089* 0.080 0.013 0.117 -0.185 0.626***
(0.056) (0.063) (0.085) (0.052) (0.053) (0.052) (0.088) (0.072) (0.132) (0.209)
Municipality 7 0.078 0.034 0.150** 0.139*** 0.090* -0.070 0.205** 0.235*** 0.189 0.682**
(0.060) (0.055) (0.067) (0.052) (0.052) (0.080) (0.086) (0.068) (0.194) (0.304)
Municipality 8 0.141*** 0.023 -0.059 0.042 0.049 0.045 0.045 0.126* 0.036 0.936***
(0.052) (0.061) (0.086) (0.070) (0.056) (0.065) (0.083) (0.071) (0.148) (0.214)
_cons 0.828*** 0.854*** 0.540*** 0.810*** 0.870*** 0.858*** 0.546*** 0.504*** 1.506*** 5.014***
(0.053) (0.041) (0.055) (0.051) (0.051) (0.048) (0.062) (0.057) (0.109) (0.140)
Control_mean 0.933 0.846 0.608 0.916 0.915 0.911 0.620 0.533 1.402 5.393
Treatment_mean 0.981 0.885 0.597 0.943 0.956 0.984 0.569 0.482 1.370 5.301
Number of observations 1,570 809 713 1,463 680 410 1,008 865 791 3,006
note: *** p<0.01, ** p<0.05, * p<0.1

77
Table 42: Robustness Test Applying Instrumental Variables (Reported Beneficiary Status)
Program Effects on Use of Maternal Health Services
Received
antenatal
care at least
4 times
Number of
times
received
antenatal
care
Antenatal
care quality
index
Postnatal
care at
facility w/in
24 hrs
Postnatal
care at home
w/in 24 hrs
Delivery
assisted by
doctor/
midwife
Facility-
based
delivery
coef/se coef/se coef/se coef/se coef/se coef/se coef/se
Program Impact 0.125** 0.895*** 0.732*** 0.115 0.116** 0.036 -0.021
(0.057) (0.322) (0.204) (0.077) (0.046) (0.066) (0.050)
Municipality 2 -0.115 -0.585 -0.216 -0.371** 0.074 -0.053 0.006
(0.096) (0.553) (0.342) (0.150) (0.066) (0.096) (0.088)
Municipality 3 0.201** 0.739 0.330 -0.133 0.192** 0.258*** 0.258***
(0.084) (0.533) (0.307) (0.109) (0.081) (0.089) (0.084)
Municipality 4 -0.054 -0.371 -0.178 -0.050 0.039 0.021 -0.048
(0.087) (0.630) (0.325) (0.121) (0.059) (0.107) (0.089)
Municipality 5 -0.132 -0.502 1.004** -0.454** 0.259** 0.215* 0.024
(0.134) (0.670) (0.408) (0.195) (0.116) (0.129) (0.110)
Municipality 6 0.022 0.117 0.136 -0.212 0.471*** 0.295*** -0.004
(0.155) (0.689) (0.329) (0.131) (0.132) (0.098) (0.091)
Municipality 7 0.220** 0.949 0.289 0.092 0.222** 0.178 -0.108
(0.103) (0.699) (0.322) (0.101) (0.109) (0.121) (0.089)
Municipality 8 0.048 -0.011 -0.244 -0.364** -0.000 0.030 0.007
(0.115) (0.651) (0.446) (0.161) (0.065) (0.117) (0.105)
_cons 0.506*** 3.956*** 4.918*** 0.831*** 0.005 0.321*** 0.249***
(0.080) (0.522) (0.274) (0.105) (0.056) (0.084) (0.078)
Control_mean 0.546 4.103 5.095 0.642 0.133 0.433 0.277
Treatment_mean 0.635 4.717 5.607 0.756 0.237 0.437 0.264
Number of observations 597 597 562 167 475 607 607
note: *** p<0.01, ** p<0.05, * p<0.1

78
Table 43: Robustness Test Applying Instrumental Variables (Reported Beneficiary Status)
Program Effects on Use of Child Health Services
Regular weighing
according to age
Took deworming
pills Took Vitamin A BCG Measles
coef/se coef/se coef/se coef/se coef/se
Program Impact 0.173*** 0.077* 0.051 0.033 0.047
(0.037) (0.041) (0.037) (0.030) (0.033)
Municipality 2 -0.055 -0.095 -0.006 -0.073* -0.035
(0.110) (0.083) (0.064) (0.039) (0.052)
Municipality 3 0.124 -0.095 0.157*** -0.004 0.039
(0.109) (0.087) (0.055) (0.031) (0.045)
Municipality 4 -0.109 -0.191** -0.179*** -0.192*** -0.225***
(0.105) (0.087) (0.069) (0.052) (0.058)
Municipality 5 -0.054 0.008 0.180*** -0.018 0.019
(0.109) (0.093) (0.059) (0.040) (0.053)
Municipality 6 0.633*** -0.019 0.237*** 0.039 0.096**
(0.116) (0.094) (0.049) (0.028) (0.044)
Municipality 7 0.050 -0.025 0.125* 0.009 0.074*
(0.134) (0.095) (0.074) (0.036) (0.043)
Municipality 8 0.054 -0.114 0.058 -0.006 0.075
(0.113) (0.091) (0.078) (0.039) (0.046)
_cons 0.132 0.655*** 0.727*** 0.938*** 0.827***
(0.098) (0.080) (0.058) (0.034) (0.045)
Control_mean 0.155 0.557 0.729 0.871 0.790
Treatment_mean 0.360 0.641 0.842 0.925 0.858
Number of observations 1,003 1,019 962 1,017 986
note: *** p<0.01, ** p<0.05, * p<0.1

79
Table 44: Robustness Test Applying Instrumental Variables (Reported Beneficiary Status)
Program Effects on Malnutrition
z-score
weight-
for-age
z-score
height-
for-age
z-score
weight-
for-
height
Malnutrition
weight-for-
age:6-
36months
Severe
malnutrition
weight-for
age:6-
36months
Wasting
weight-
for
height:6-
36months
Severe
wasting
weight-
for-
height:6-
36months
Stunting
height-
for-age:6-
36months
Severe
stunting
height-
for-age:6-
36months
coef/se coef/se coef/se coef/se coef/se coef/se coef/se coef/se coef/se
Program Impact -0.015 -0.251 0.155 -0.038 0.010 0.064 0.029 -0.041 -0.111**
(0.123) (0.258) (0.167) (0.058) (0.035) (0.041) (0.025) (0.065) (0.054)
Municipality 2 0.075 -0.193 0.207 -0.238** 0.040 0.058** 0.045* -0.119 -0.040
(0.199) (0.355) (0.352) (0.112) (0.051) (0.030) (0.025) (0.096) (0.079)
Municipality 3 0.021 0.317 -0.049 -0.176* 0.039 0.211*** 0.088*** -0.236** -0.008
(0.209) (0.436) (0.352) (0.097) (0.052) (0.049) (0.032) (0.092) (0.093)
Municipality 4 0.218 -0.113 0.492 -0.208** 0.062 0.084*** 0.041* -0.099 -0.069
(0.212) (0.358) (0.315) (0.098) (0.050) (0.030) (0.022) (0.086) (0.082)
Municipality 5 0.126 -0.633 0.128 -0.356*** -0.039 0.201* 0.006 -0.270** -0.189**
(0.213) (0.630) (0.439) (0.104) (0.041) (0.119) (0.009) (0.133) (0.091)
Municipality 6 -0.318* -0.431 0.037 0.004 0.112 0.188*** 0.075** -0.057 0.087
(0.193) (0.330) (0.312) (0.102) (0.088) (0.071) (0.037) (0.116) (0.099)
Municipality 7 -0.256 -0.309 -0.358 -0.157 0.037 0.100 0.002 -0.211 -0.044
(0.280) (0.473) (0.351) (0.129) (0.079) (0.074) (0.007) (0.149) (0.124)
Municipality 8 -0.293 0.356 -0.490 -0.172 0.121 0.287*** 0.123* -0.281** -0.200**
(0.209) (0.295) (0.329) (0.125) (0.086) (0.097) (0.074) (0.134) (0.082)
_cons -1.218*** -1.903*** -0.264 0.482*** 0.035 -0.038 -0.017 0.661*** 0.293***
(0.181) (0.297) (0.302) (0.092) (0.044) (0.026) (0.016) (0.077) (0.075)
Control_mean -1.180 -1.969 -0.133 0.283 0.090 0.101 0.040 0.500 0.220
Treatment_mean -1.262 -2.206 -0.075 0.283 0.092 0.145 0.060 0.479 0.156
Number of observations 817 795 772 350 350 315 315 317 317
note: *** p<0.01, ** p<0.05, * p<0.1
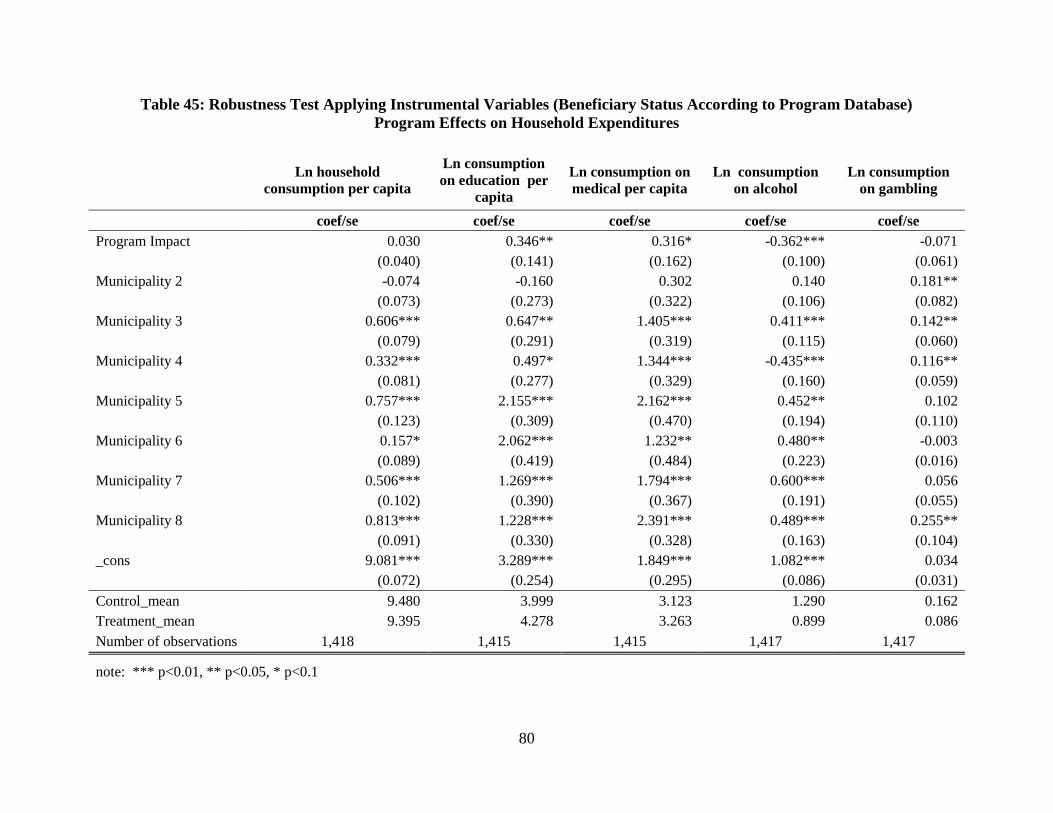
80
Table 45: Robustness Test Applying Instrumental Variables (Beneficiary Status According to Program Database)
Program Effects on Household Expenditures
Ln household
consumption per capita
Ln consumption
on education per
capita
Ln consumption on
medical per capita
Ln consumption
on alcohol
Ln consumption
on gambling
coef/se coef/se coef/se coef/se coef/se
Program Impact 0.030 0.346** 0.316* -0.362*** -0.071
(0.040) (0.141) (0.162) (0.100) (0.061)
Municipality 2 -0.074 -0.160 0.302 0.140 0.181**
(0.073) (0.273) (0.322) (0.106) (0.082)
Municipality 3 0.606*** 0.647** 1.405*** 0.411*** 0.142**
(0.079) (0.291) (0.319) (0.115) (0.060)
Municipality 4 0.332*** 0.497* 1.344*** -0.435*** 0.116**
(0.081) (0.277) (0.329) (0.160) (0.059)
Municipality 5 0.757*** 2.155*** 2.162*** 0.452** 0.102
(0.123) (0.309) (0.470) (0.194) (0.110)
Municipality 6 0.157* 2.062*** 1.232** 0.480** -0.003
(0.089) (0.419) (0.484) (0.223) (0.016)
Municipality 7 0.506*** 1.269*** 1.794*** 0.600*** 0.056
(0.102) (0.390) (0.367) (0.191) (0.055)
Municipality 8 0.813*** 1.228*** 2.391*** 0.489*** 0.255**
(0.091) (0.330) (0.328) (0.163) (0.104)
_cons 9.081*** 3.289*** 1.849*** 1.082*** 0.034
(0.072) (0.254) (0.295) (0.086) (0.031)
Control_mean 9.480 3.999 3.123 1.290 0.162
Treatment_mean 9.395 4.278 3.263 0.899 0.086
Number of observations 1,418 1,415 1,415 1,417 1,417
note: *** p<0.01, ** p<0.05, * p<0.1