Philippine Global Seafarers: A Profile - Mariners...
97
Seafarers International Research Centre (SIRC) Philippine Global Seafarers: A Profile Maragtas S. V. Amante November 2003
Transcript of Philippine Global Seafarers: A Profile - Mariners...
Seafarers International Research Centre (SIRC)
Philippine Global Seafarers:
A Profile
Maragtas S. V. Amante
November 2003
Contents
Acronyms
Acknowledgements
1. Introduction . . . . . . . . . . . . . . . . . . . . . . . . . . . . . . . . . . . . . . . . . . . . 1
2. Filipino seafarers and the OFW economy . . . . . . . . . . . . . . . . . . 2
The Philippine labour market . . . . . . . . . . . . . . . . . . . . . . . . . . . . . . . . 2
Growth of the Philippines’ seafaring labour force . . . . . . . . . . . . . . . . 2
Seafarers and the Philippine economy . . . . . . . . . . . . . . . . . . . . . . . . . . 5
Box 2.1 Filipinos and Philippine economic activity . . . . . . . . . 7
3. The seafarer survey . . . . . . . . . . . . . . . . . . . . . . . . . . . . . . . . . . . . . . . 9
Basic socio-economic characteristics. . . . . . . . . . . . . . . . . . . . . . . . . . . . . 9
Age started work at sea and work experience . . . . . . . . . . . . . . . . . . . . . . .10
Retirement age . . . . . . . . . . . . . . . . . . . . . . . . . . . . . . . . . . . . . . . . . . . . . . 11
Flag of last ship . . . . . . . . . . . . . . . . . . . . . . . . . . . . . . . . . . . . . . . . . . . . . 12
Regional origin and linguistic group . . . . . . . . . . . . . . . . . . . . . . . . . . . . . 13
Parental occupation . . . . . . . . . . . . . . . . . . . . . . . . . . . . . . . . . . . . . . . . . 14
Siblings, children and dependents . . . . . . . . . . . . . . . . . . . . . . . . . . . . . . . . 16
Seafarers’ wives . . . . . . . . . . . . . . . . . . . . . . . . . . . . . . . . . . . . . . . . . . . .. 19
Why be a seafarer? . . . . . . . . . . . . . . . . . . . . . . . . . . . . . . . . . . . . . . . . . . . 19
4. Education and training . . . . . . . . . . . . . . . . . . . . . . . . . . . . . . . . . . . . . . . . 21
Maritime education in the Philippines . . . . . . . . . . . . . . . . . . . . . . . . . . . . 21
Education profile of seafarers . . . . . . . . . . . . . . . . . . . . . . . . . . . . . . . . . . . 24
Maritime training . . . . . . . . . . . . . . . . . . . . . . . . . . . . . . . . . . . . . . . . . . . . 27
Trends in maritime enrolment and graduation . . . . . . . . . . . . . . . . . . . . 30
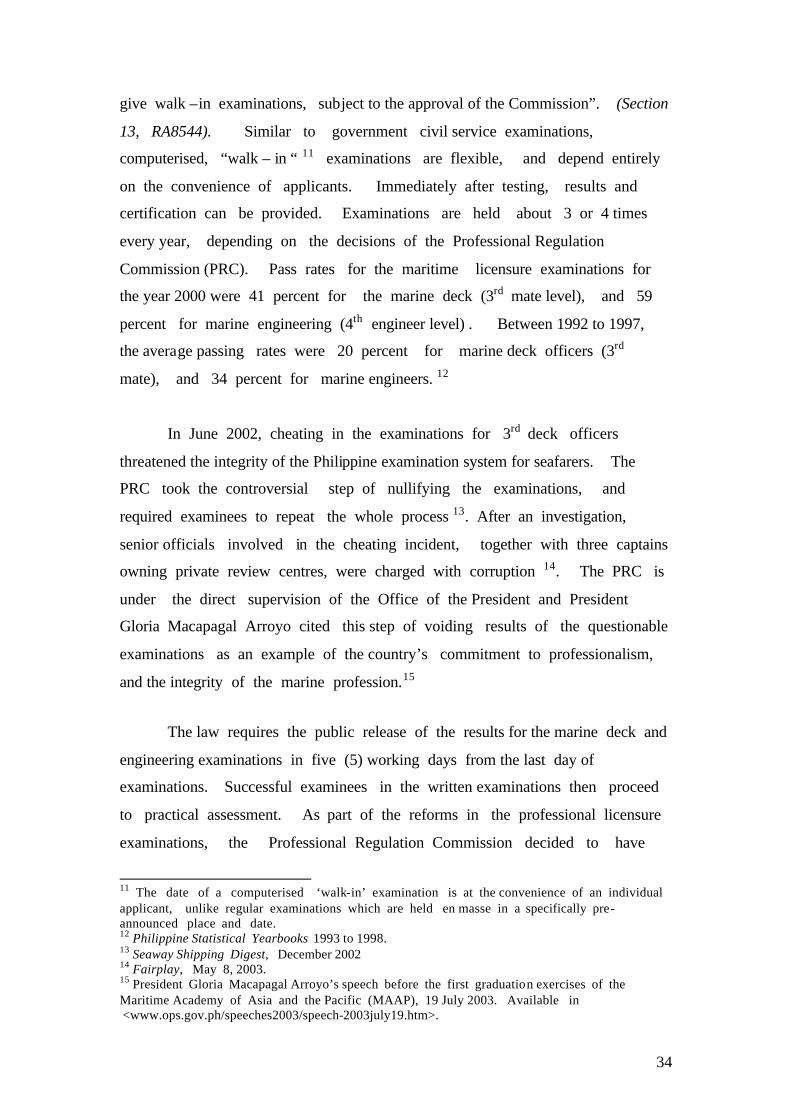
Licensure examination of officers. . . . . . . . . . . . . . . . . . . . . . . . . . . . . . . 33
Sources of support and costs of Philippine maritime education . . . . . . . 36
Problems and prospects of Philippine maritime education . . . . . . . . . . . . 39
5. Pay variations among Filipino seafarers . . . . . .. . . . . . . . . . . . . . . . . . 41
Pay profile . . . . . . . . . . . . . . . . . . . . . . . . . . . . . . . . . . . . . . . . . . . . . . . . 41
Union and non-union pay differential . . . . . . . . . . . . . . . . . . . . . . . . . . . . .46
Pay differentials and length of contracts of employment . . . . . . . . . . . . 47
Pay differentials by education level. . . . . . . . . . . . . . . . . . . . . . . . . . . 49
6. Hiring, recruitment and work onboard . . . . . . . . . . . . . . . . . . . . . . . . 52
Crewing agencies and seafarer recruitment . . . . . . . . . . . . . . . . . . . . . . 52
Box 6.1 Philippine government honours for crewing agencies . . . . 53
The Rizal Park labour market . . . . . . . . . . . . . . . . . . . . . . . . . . . . . . . . . . 56
Employment contracts . . . . . . . . . . . . . . . . . . . . . . . . . . . . . . . . . . . . . . . 59
Box 6.2 Precedent court decision on employment of seafarers. . . . 60
Job search . . . . . . . . . . . . . . . . . . . . . . . . . . . . . . . . . . . . . . . . . . . . . . . .61
Coastal and inter- island work experience . . . . . . . . . . . . . . . . . . . . . . . . . 61
Experience with mixed nationality crews . . . . . . . . . . . . . . . . . . . . . . . 62
Filipino seafarers’ job satisfaction on board . . . . . . . . . . . . . . . . . . . . . . . 66
Union membership of seafarers . . . . . . . . . . . . . . . . . . . . . . . . . . . . . . . . 67
Seafarer unions in the Philippines . . . . . . . . . . . . . . . . . . . . . . . . . . . . . 68
7. Conclusions . . . . . . . . . . . . . . . . . . . . . . . . . . . . . . . . . . . . . . . . . . . . . . . . 70
Appendix 1. Sample maritime education curriculum
Appendix 2. Important laws and policies on Philippine seafarers
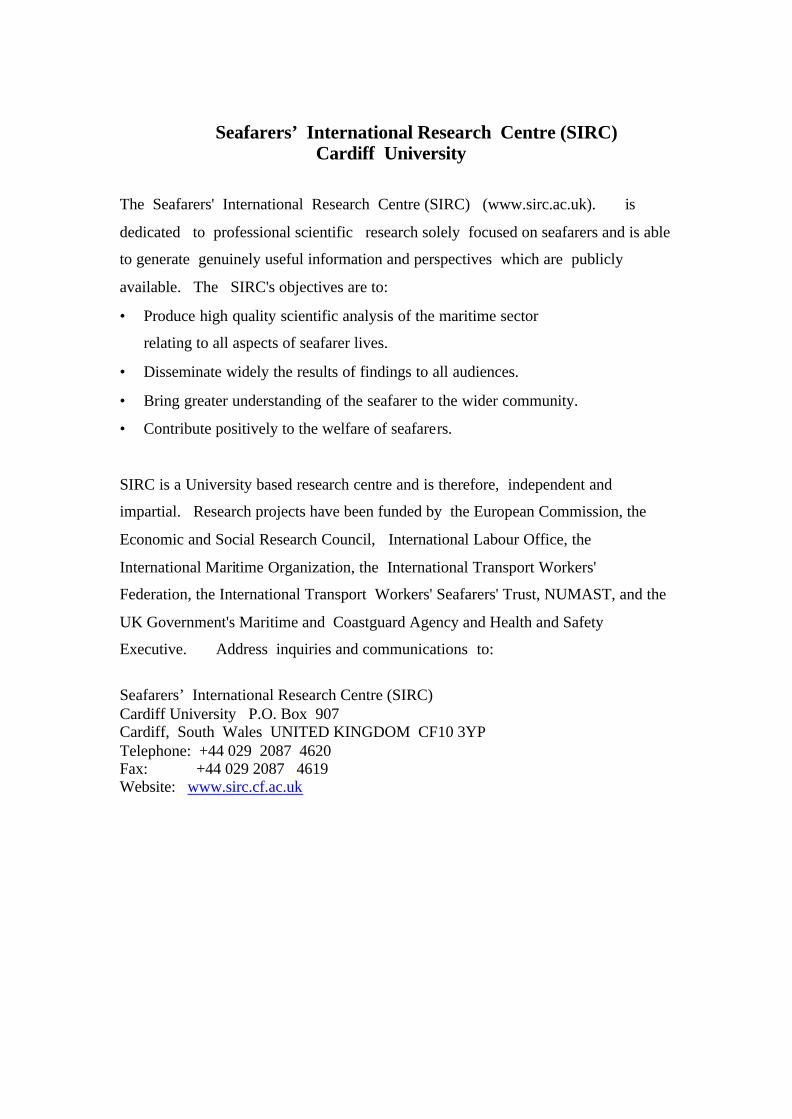
Seafarers’ International Research Centre (SIRC) Cardiff University
The Seafarers' International Research Centre (SIRC) (www.sirc.ac.uk). is
dedicated to professional scientific research solely focused on seafarers and is able
to generate genuinely useful information and perspectives which are publicly
available. The SIRC's objectives are to:
• Produce high quality scientific analysis of the maritime sector
relating to all aspects of seafarer lives.
• Disseminate widely the results of findings to all audiences.
• Bring greater understanding of the seafarer to the wider community.
• Contribute positively to the welfare of seafarers.
SIRC is a University based research centre and is therefore, independent and
impartial. Research projects have been funded by the European Commission, the
Economic and Social Research Council, International Labour Office, the
International Maritime Organization, the International Transport Workers'
Federation, the International Transport Workers' Seafarers' Trust, NUMAST, and the
UK Government's Maritime and Coastguard Agency and Health and Safety
Executive. Address inquiries and communications to:
Seafarers’ International Research Centre (SIRC) Cardiff University P.O. Box 907 Cardiff, South Wales UNITED KINGDOM CF10 3YP Telephone: +44 029 2087 4620 Fax: +44 029 2087 4619 Website: www.sirc.cf.ac.uk
ACRONYMS Government agencies
CHED Commission on Higher Education
DOH Department of Health
DOLE Department of Labour and Employment
DOTC Department of Transport and Communication
DFA Department of Foreign Affairs
ECC Employees Compensation Commission
MTC Maritime Training Center
MARINA Maritime Industry Authority, also under the DOTC
OWWA Overseas Workers Welfare Administration, under the DOLE
PCG Philippine Coast Guard, under the Department of Transport
and Communication (DOTC)
PRC Professional Regulation Commission
POEA Philippine Overseas Employment Administration, under DOLE
PSOC Philippine Seafarers One Stop Processing Centre
TESDA Technical Education and Skills Development Authority,
under the DOLE
NCMB National Mediation and Conciliation Board
NLRC National Labour Relations Commission
NTC National Telecommunications Committee, under the DOTC
Unions and organisations
AAMI Association of Accredited Maritime Institutions
AMOSUP Associated Maritime Officers and Seamen’s Union of the Philippines
AOS Apostleship of the Sea
FAME Filipino Association for Mariner’s Employment
ITF International Transport Workers Federation
PAMI Philippine Association of Maritime Institutions
PAMTCI Philippine Association of Maritime Training Centres, Inc.
PSPC Philippine Seafarers Promotion Council
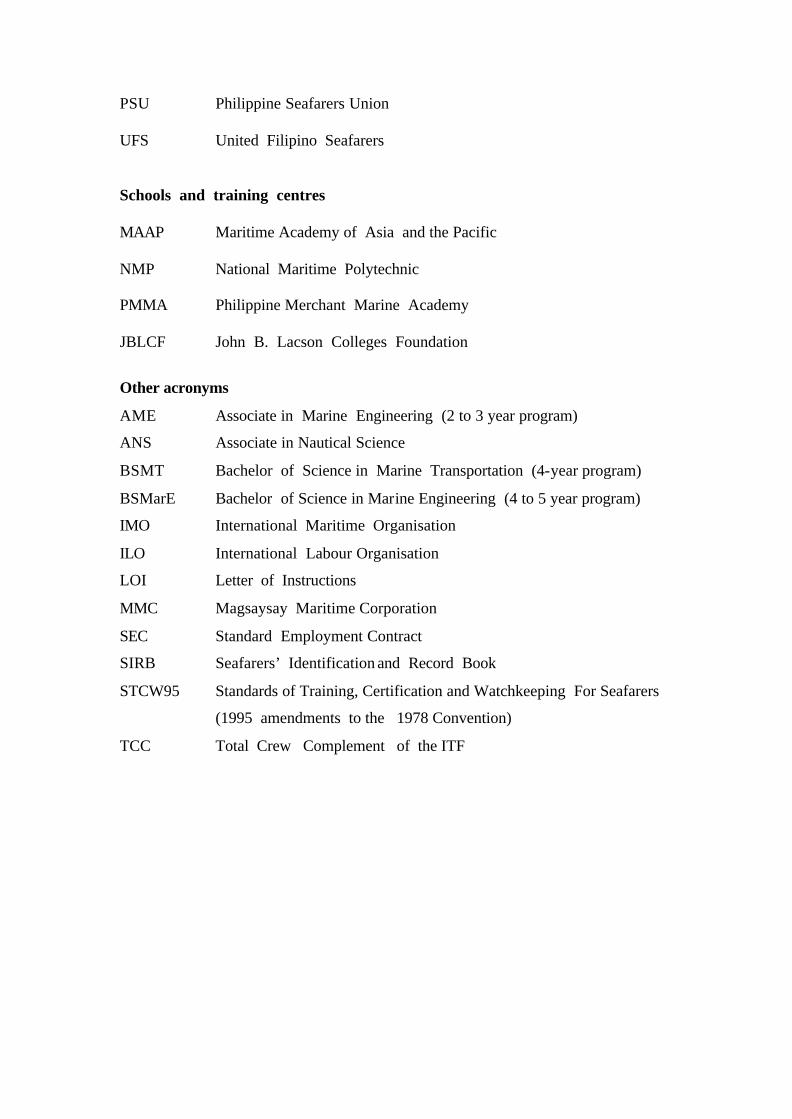
PSU Philippine Seafarers Union UFS United Filipino Seafarers Schools and training centres MAAP Maritime Academy of Asia and the Pacific NMP National Maritime Polytechnic PMMA Philippine Merchant Marine Academy JBLCF John B. Lacson Colleges Foundation
Other acronyms
AME Associate in Marine Engineering (2 to 3 year program)
ANS Associate in Nautical Science
BSMT Bachelor of Science in Marine Transportation (4-year program)
BSMarE Bachelor of Science in Marine Engineering (4 to 5 year program)
IMO International Maritime Organisation
ILO International Labour Organisation
LOI Letter of Instructions
MMC Magsaysay Maritime Corporation
SEC Standard Employment Contract
SIRB Seafarers’ Identification and Record Book
STCW95 Standards of Training, Certification and Watchkeeping For Seafarers
(1995 amendments to the 1978 Convention)
TCC Total Crew Complement of the ITF
ACKNOWLEDGEMENTS
Support from the SIRC - Cardiff University under the terms of the
Mols Sorenson Postdoctoral Research Fellowship is gratefully acknowledged.
Views expressed in this research report are those of the author’s, and do not
constitute the official position of the Seafarers’ International Research Centre -
Cardiff University where I spent the research fellowship for about 2 years, from
March 2002 to February 2004.
The research benefited immensely from interactions with colleagues and
industry leaders both in the Philippines and the United Kingdom; officials of
seafarer organisations, unions, shipping and crewing companies and industry
associations; and government officials. Most of all, the research is grateful to
the seafarers and maritime students who participated in the survey. All errors
and omissions however are the sole responsibility of the author. In particular,
the research is indebted to the following:
• Tony Lane, previous SIRC Director, for his encouragement, guidance,
constructive comments, patient editing and insightful suggestions full of wisdom
about the global seafaring industry.
• Helen Sampson, current SIRC Director, for her valuable comments and
suggestions to improve the research, introduced me to more innovative methods
of doing labour analysis.
• Erol Kahveci, my unofficial chaplain and guide when I first ventured into the
world of seafarers.
• Mick Bloor, for his valuable comments which shaped the initial thrust,
methodology and the framework of the research.
• Neil Ellis, for his readiness to compute and share statistics from SIRC’s
seafarer database.
• Nick Winchester, for his very helpful critical comments and suggestions,
both technical and non-technical.
About the author
The researcher, Maragtas S.V. Amante is Mols Sorensen Postdoctoral
Research Fellow, Seafarers International Research Centre (SIRC), Cardiff
University, U.K. While on research fellowship, he was on leave from the School
of Labour and Industrial Relations, University of the Philippines (U.P. SOLAIR),
Diliman, Quezon City. He has more than 15 years of experience in teaching,
research and consultancy work in the areas of industrial relations, economics of
human resources, and compensation. His research, publications and advocacy
emphasise the interdisciplinary approach, using the tools of the social sciences
including law and management, to promote innovation in the world of work,
and the resolution of issues in employment relations. In various capacities, he
works closely with the trade unions, employers and both the DOLE and the
Philippine Congress to promote the ideals of social dialogue, industrial democracy
and decent work.
1
1. Introduction
Although the Philippines provides more than one quarter of the world’s
seafarers employed aboard internationally trading ships, and its position as the
world’s leading supplier of ships’ crews seems assured, it has not been possible
for crew managers, officers of international agencies, associations and other
interested parties to find reliable information about Filipino seafarers and their
circumstances in one published document. This report modestly aims to remedy
this international deficit.
Between October 2002 and January 2003, separate surveys were conducted,
of seafarers (n=374) and students (n=658) enrolled in 11 maritime colleges, with
the aim of generating a dependable profile of Filipino seafarers. The survey results
were subsequently amplified by a search of available documentation and interviews
with crewing managers, senior government and trade union officials. Websites
and publications by government agencies, employers and unions, and seafarer
organizations provided other data.
2
2. Filipino seafarers and the economy
The Philippine labour market The Philippines has a labour surplus economy. A population of 81
million, and a relatively high annual population growth rate of 2.3 percent
between 1980 - 2000 has added a sizeable increment of young job seekers
every year, while job creation has not kept pace.
The profile of the Philippine workforce (NSO 2003) shows 22 percent
have a college education. Filipino workers are predominantly male (84 percent),
with employment concentrated in the rural areas (54 percent). Most are still
predominantly employed in agriculture (39 percent) with 23 percent in
manufacturing.
Philippine open unemployment remains high, at 10.6 percent in January
2003. In addition, underemployment -- officially defined as “those who are
employed but still looking for work” changed very slightly from 16.9
percent in January 2000 to 16.1 percent in January 2003 (NSO 2003). It is
estimated that between 5 to 8 million mostly in the Middle East. Labour export is
therefore of considerable importance to the national economy. In 2002, an
average of 2,748 Filipinos left the country every day for overseas employment. 1
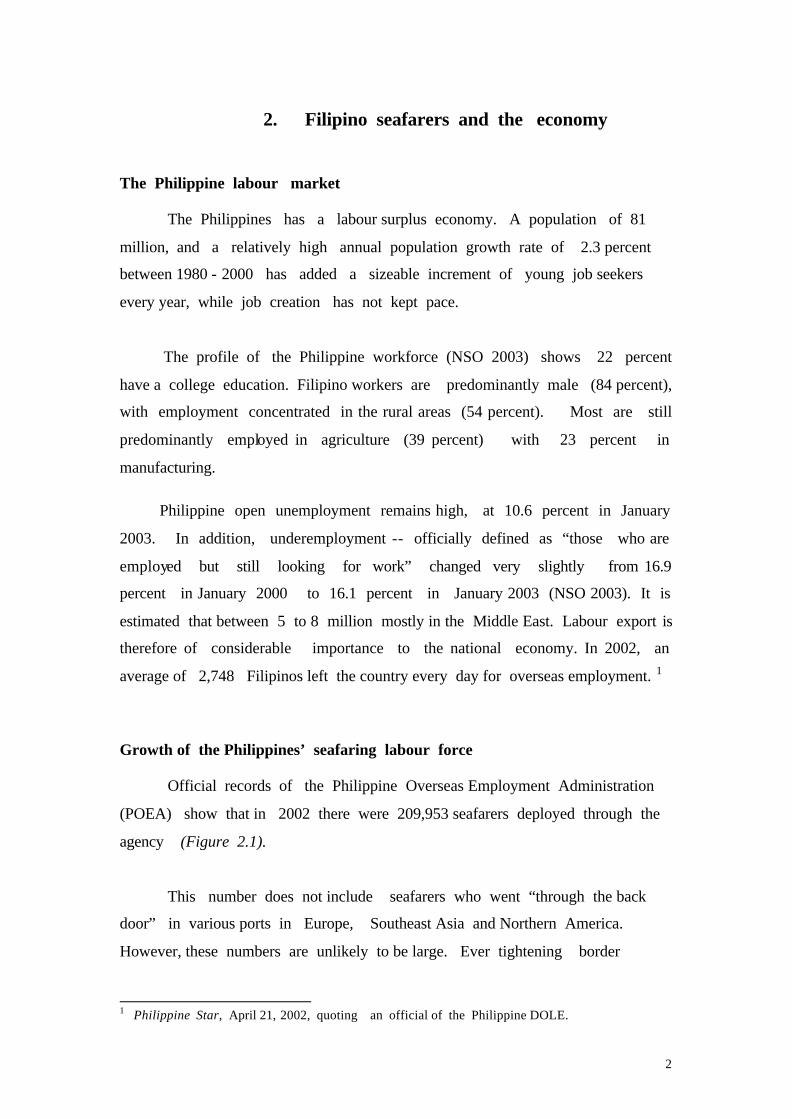
Growth of the Philippines’ seafaring labour force Official records of the Philippine Overseas Employment Administration
(POEA) show that in 2002 there were 209,953 seafarers deployed through the
agency (Figure 2.1).
This number does not include seafarers who went “through the back
door” in various ports in Europe, Southeast Asia and Northern America.
However, these numbers are unlikely to be large. Ever tightening border
1 Philippine Star, April 21, 2002, quoting an official of the Philippine DOLE.
3
controls and the relative insignificance of localised port-based labour markets
mean that opportunities in the ports of the world are limited and diminishing.
The years from 1986 to 1990 saw a rapid expansion in the Philippine
seafaring industry. The number of Filipino seafarers more than doubled, from
52,290 to 111,212. The rate of increase from 1986 to 1990 averaged 16.6
percent every year. Between 1991 and 1995, the number of Philippine
seafarers increased but by a slower rate of 8.3 percent. From 1996 to 2000,
the number of seafarers still increased, but at a much lower annual rate of
3.7 percent.
Figure 2.1 Number of Filipino seafarers: 1975 to 2002
Source of basic data: Philippine Overseas Employment Administration (POEA)
Figures represent seafarers deployed.
2002200019951990198519801975
Sea
fare
rs d
eplo
yed
thru
PO
EA
300000
200000
100000
0
209953198324
165401
111212
5229057196
23534
4
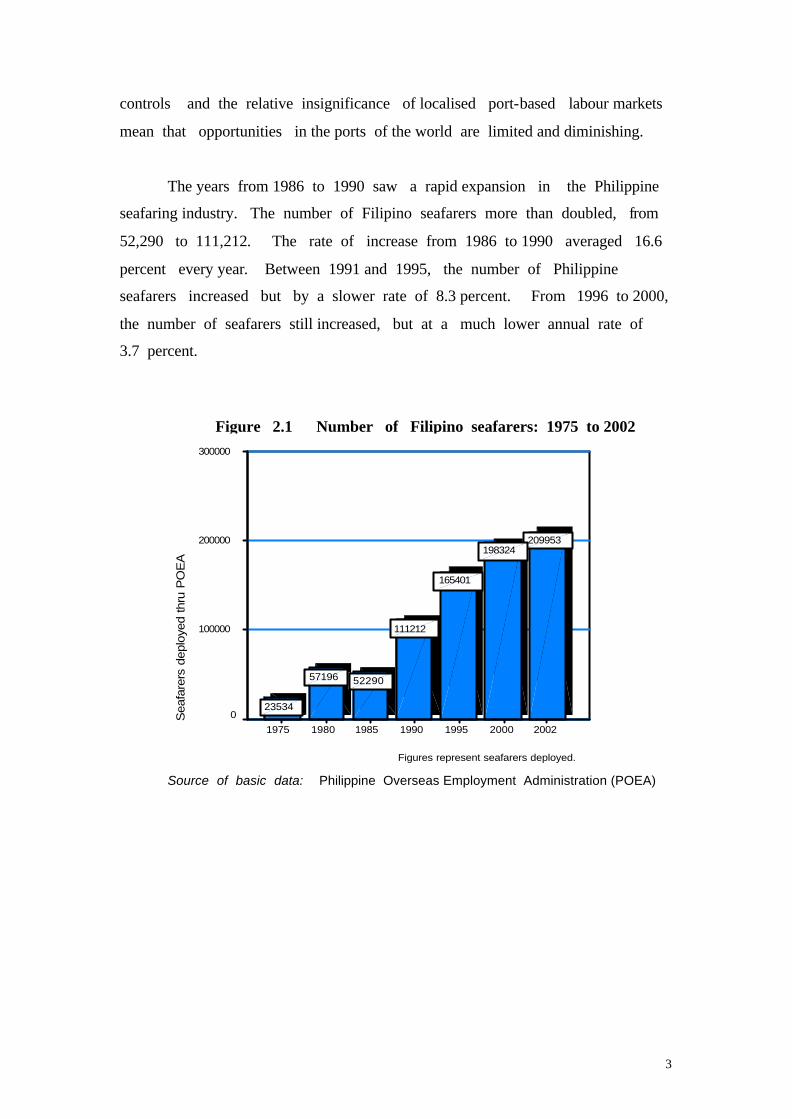
The Philippines continues to be the largest supplier of seafarers --
both officers and ratings -- with 28.1 percent shown in the SIRC 2003 global
crew survey, derived from an annual census based on crew lists. This share
is consistent with the findings of the SIRC 2000 survey showing the Philippines
as supplying 28.5 percent of the total population of seafarers aboard ships
engaged in international trade. In the SIRC 2003 survey, 9 percent of
Filipinos were employed as senior officers, 19 percent were employed as junior
officers, and 72 percent worked as ratings (Figure 2.2).
Source: Seafarers’ International Research Centre (SIRC) Database, 2003
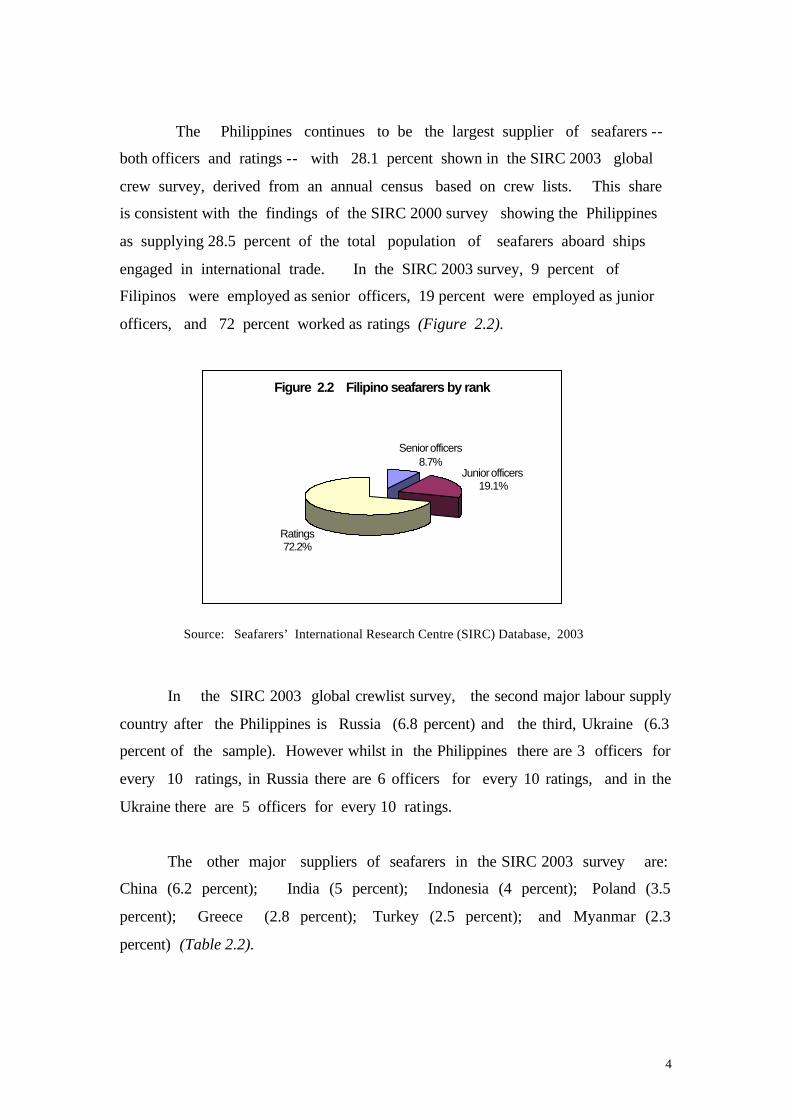
In the SIRC 2003 global crewlist survey, the second major labour supply
country after the Philippines is Russia (6.8 percent) and the third, Ukraine (6.3
percent of the sample). However whilst in the Philippines there are 3 officers for
every 10 ratings, in Russia there are 6 officers for every 10 ratings, and in the
Ukraine there are 5 officers for every 10 ratings.
The other major suppliers of seafarers in the SIRC 2003 survey are:
China (6.2 percent); India (5 percent); Indonesia (4 percent); Poland (3.5
percent); Greece (2.8 percent); Turkey (2.5 percent); and Myanmar (2.3
percent) (Table 2.2).
Figure 2.2 Filipino seafarers by rank
Ratings72.2%
Junior officers19.1%
Senior officers8.7%
5
Table 2.2 Ten largest seafarer supply countries
Rank Country % of sample
1 Philippines 28.1 2 Russia 6.8 3 Ukraine 6.3 4 China 6.2 5 India 5.0 6 Indonesia 4.0 7 Poland 3.5 8 Greece 2.8 9 Turkey 2.5 10 Myanmar 2.3
All top 10 67.5
Source: SIRC Global Seafarers Database, 2003.
Seafarers and the Philippine economy
Filipino seafarers have become a vital component of the Overseas
Filipino Worker (OFW) economy. Remittances from all OFWs are a major
source of US dollar earnings, contribute significantly to stabilising the balance
of payments, prevent foreign exchange instability, and serve as a buffer
against drastic devaluations of the peso which could lead to inflation.
Politicians refer to OFWs, including seafarers, as the “new heroes” in
acknowledgement of their economic role. 2
As mandated by Philippine labour laws, the Philippine Overseas
Employment Administration (POEA) regulates the recruitment of overseas
Filipino workers, including seafarers. As such, the POEA issues seafarers with a
“standard contract” which requires the homeward remittance of 80 percent of
monthly seafarer basic pay, including backwages, and other earnings such
as overtime pay. Remittances are paid in Philippines’ currency at the US dollar
2 Despite political and security problems, the Philippine’s Gross Domestic Product (GDP) grew by 4.4 percent in the third quarter of 2003, from the 3.8 percent growth last year. Officials recognise the contribution overseas Filipinos, including seafarers -- Net Factor Income from Abroad (NFIA) increased robustly by 28.4 percent, pushing the growth of the Gross National Product (GNP) upward to 5.9 percent, from 3.1 percent recorded in the previous year. Source: [WWW] <http://www.nscb.gov.ph/sna/2003/3qtr-2003/Default.asp> [27 November 2003]
6
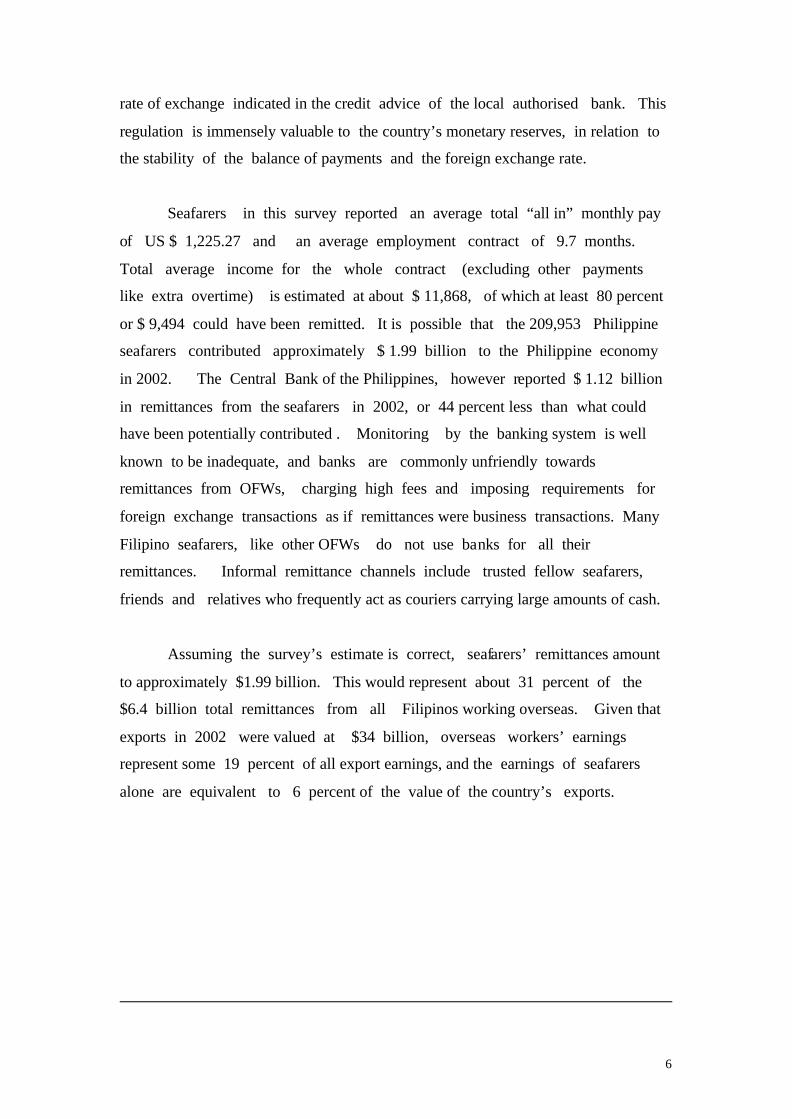
rate of exchange indicated in the credit advice of the local authorised bank. This
regulation is immensely valuable to the country’s monetary reserves, in relation to
the stability of the balance of payments and the foreign exchange rate.
Seafarers in this survey reported an average total “all in” monthly pay
of US $ 1,225.27 and an average employment contract of 9.7 months.
Total average income for the whole contract (excluding other payments
like extra overtime) is estimated at about $ 11,868, of which at least 80 percent
or $ 9,494 could have been remitted. It is possible that the 209,953 Philippine
seafarers contributed approximately $ 1.99 billion to the Philippine economy
in 2002. The Central Bank of the Philippines, however reported $ 1.12 billion
in remittances from the seafarers in 2002, or 44 percent less than what could
have been potentially contributed . Monitoring by the banking system is well
known to be inadequate, and banks are commonly unfriendly towards
remittances from OFWs, charging high fees and imposing requirements for
foreign exchange transactions as if remittances were business transactions. Many
Filipino seafarers, like other OFWs do not use banks for all their
remittances. Informal remittance channels include trusted fellow seafarers,
friends and relatives who frequently act as couriers carrying large amounts of cash.
Assuming the survey’s estimate is correct, seafarers’ remittances amount
to approximately $1.99 billion. This would represent about 31 percent of the
$6.4 billion total remittances from all Filipinos working overseas. Given that
exports in 2002 were valued at $34 billion, overseas workers’ earnings
represent some 19 percent of all export earnings, and the earnings of seafarers
alone are equivalent to 6 percent of the value of the country’s exports.
7
============================================================
Box 2.1 Filipinos and Philippines economic activity
There are 81 million Filipinos inhabiting some 700 of the nation's 7,100
islands. Cultural distinctions remain among the nation's more than 75 ethnic
groups. The Philippines has more than 111 spoken local languages and
dialects. It is common for a Filipino to speak more than one local language,
in addition to English.
The national language of the Philippines is Filipino, which is based on
Tagalog. The constitution provides that “for purposes of communication and
instruction, the official languages of the Philippines are Filipino and English”.
The Philippine economy in terms of employment is dominated by
agriculture, where the chief products are rice, corn, coconut, pineapple and sugar.
The country is rich in raw materials i.e. copper, cobalt, nickel, silver, iron, and gold.
It has well-developed industries in food processing, text iles, clothing, wood, forest
products and home appliances, with fast-growing aquaculture, microcircuit, garments
and furniture sectors. Main trading partners are the United States, Japan, and
Taiwan.
Foreign debt in 2002 is US$ 50 billion, and the deficit of imports over
exports is $ 138 million (as of August 2003. The government has promised to
continue its economic reforms to help the Philippines match the pace of development
in the newly industrialized countries of East Asia.
8
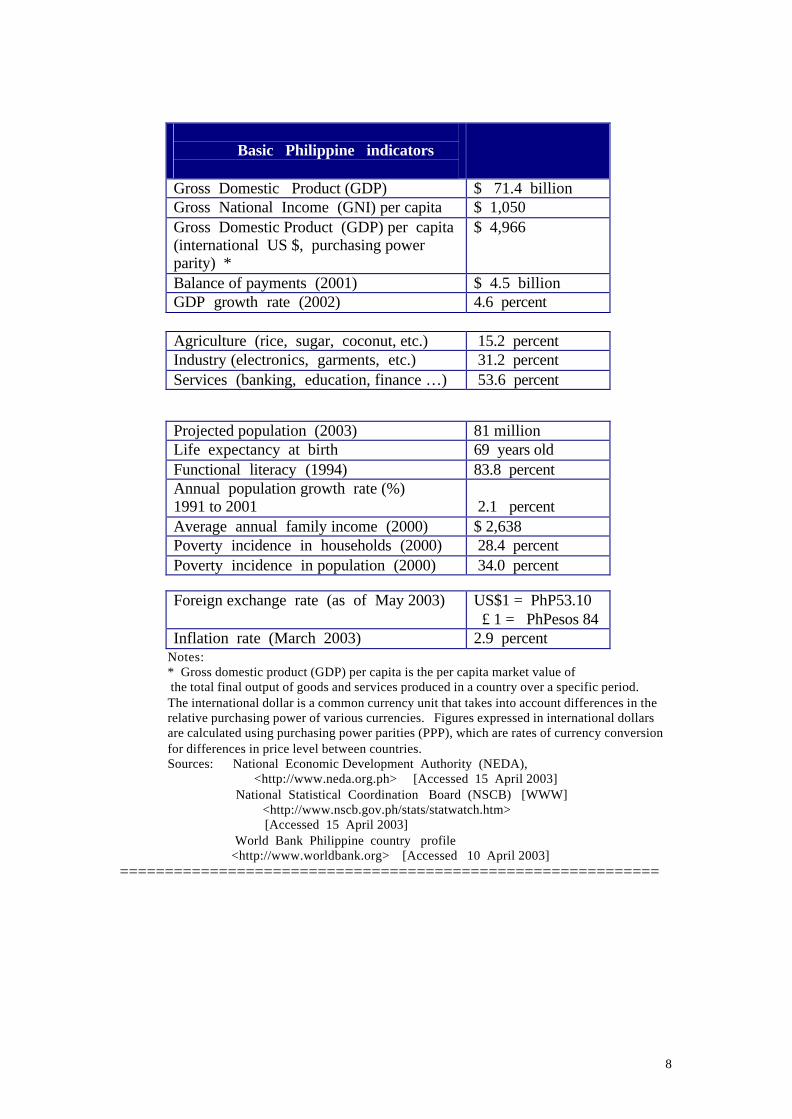
Basic Philippine indicators
Gross Domestic Product (GDP) $ 71.4 billion Gross National Income (GNI) per capita $ 1,050 Gross Domestic Product (GDP) per capita (international US $, purchasing power parity) *
$ 4,966
Balance of payments (2001) $ 4.5 billion GDP growth rate (2002) 4.6 percent
Agriculture (rice, sugar, coconut, etc.) 15.2 percent Industry (electronics, garments, etc.) 31.2 percent Services (banking, education, finance …) 53.6 percent
Projected population (2003) 81 million Life expectancy at birth 69 years old Functional literacy (1994) 83.8 percent Annual population growth rate (%) 1991 to 2001
2.1 percent
Average annual family income (2000) $ 2,638 Poverty incidence in households (2000) 28.4 percent Poverty incidence in population (2000) 34.0 percent
Foreign exchange rate (as of May 2003) US$1 = PhP53.10
£ 1 = PhPesos 84 Inflation rate (March 2003) 2.9 percent
Notes: * Gross domestic product (GDP) per capita is the per capita market value of the total final output of goods and services produced in a country over a specific period. The international dollar is a common currency unit that takes into account differences in the relative purchasing power of various currencies. Figures expressed in international dollars are calculated using purchasing power parities (PPP), which are rates of currency conversion for differences in price level between countries. Sources: National Economic Development Authority (NEDA),
<http://www.neda.org.ph> [Accessed 15 April 2003] National Statistical Coordination Board (NSCB) [WWW] <http://www.nscb.gov.ph/stats/statwatch.htm>
[Accessed 15 April 2003] World Bank Philippine country profile <http://www.worldbank.org> [Accessed 10 April 2003] ============================================================
9
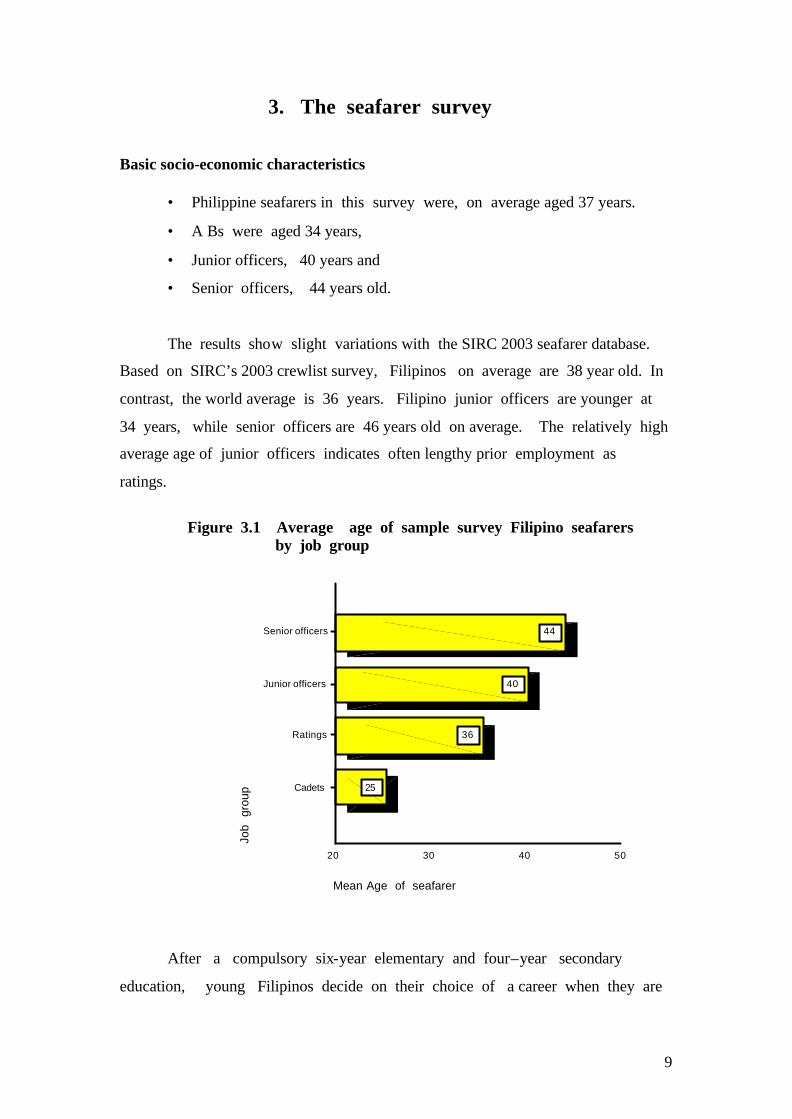
3. The seafarer survey
Basic socio-economic characteristics
• Philippine seafarers in this survey were, on average aged 37 years.
• A Bs were aged 34 years,
• Junior officers, 40 years and
• Senior officers, 44 years old.
The results show slight variations with the SIRC 2003 seafarer database.
Based on SIRC’s 2003 crewlist survey, Filipinos on average are 38 year old. In
contrast, the world average is 36 years. Filipino junior officers are younger at
34 years, while senior officers are 46 years old on average. The relatively high
average age of junior officers indicates often lengthy prior employment as
ratings.
Figure 3.1 Average age of sample survey Filipino seafarers
by job group
After a compulsory six-year elementary and four–year secondary
education, young Filipinos decide on their choice of a career when they are
Job
gro
up
Senior officers
Junior officers
Ratings
Cadets
Mean Age of seafarer
50403020
25
36
40
44
10
16 years old. They either proceed to college, or pursue a vocational or a
technical course provided their families can pay fees and living allowances.
Maritime students on a four-year college programme typically complete
studies when they are 20 years old. The last year of college is usually
spent aboard ship as a cadet (in the case of top graduates) but mainly as
apprentices. With or without a cadetship or an apprenticeship, maritime
students are awarded an “associate” nautical (navigating) or marine
engineering degree at graduation. After completing a cadetship, students are
awarded a bachelor’s degree. They then prepare for the licensure
examinations for officers; if they pass (at 21 or 22 years of age), they can
potentially serve as a deck or engine cadet, after which they could be
promoted as third mates. However, due to severe competition for limited jobs
aboard, many young seafarers who passed the officer licensure examinations
have no choice but to apply for ratings’ posts “just to gain sea experience”
(“upang lang makasakay”), as many said in the interviews.
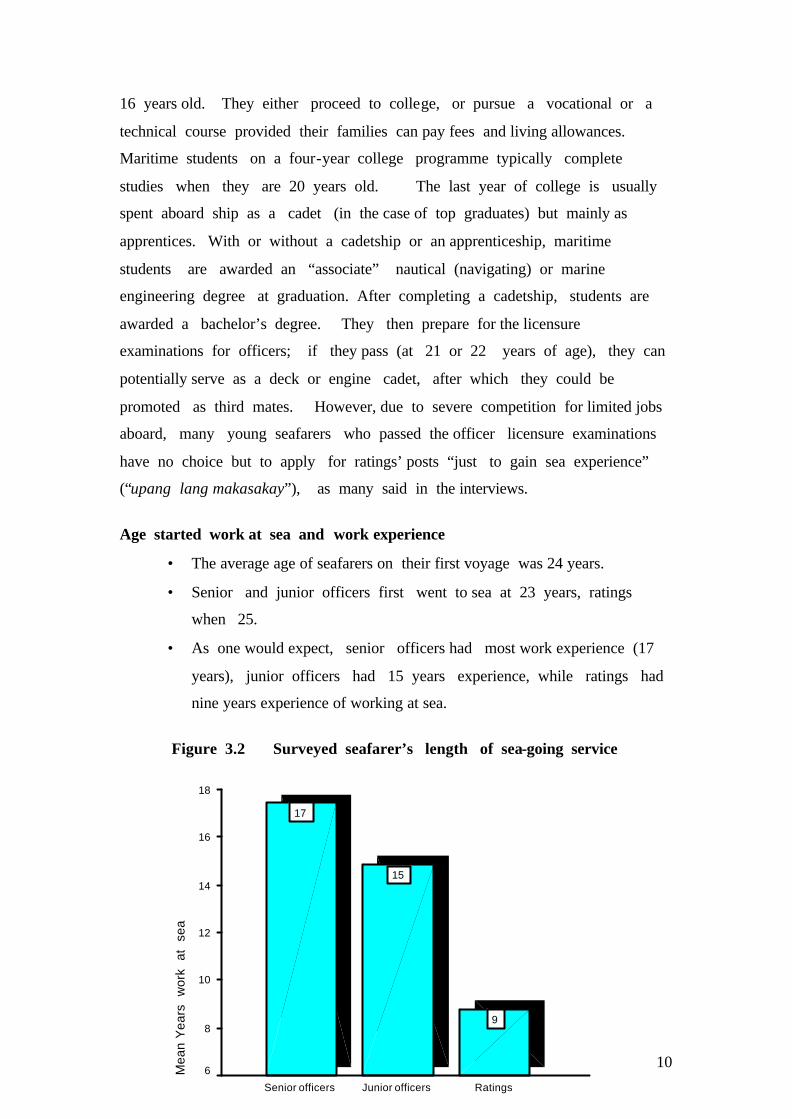
Age started work at sea and work experience
• The average age of seafarers on their first voyage was 24 years.
• Senior and junior officers first went to sea at 23 years, ratings
when 25.
• As one would expect, senior officers had most work experience (17
years), junior officers had 15 years experience, while ratings had
nine years experience of working at sea.
Figure 3.2 Surveyed seafarer’s length of sea-going service
RatingsJunior officersSenior officers
Mea
n Y
ears
w
ork
at
sea
18
16
14
12
10
8
6
9
15
17
11
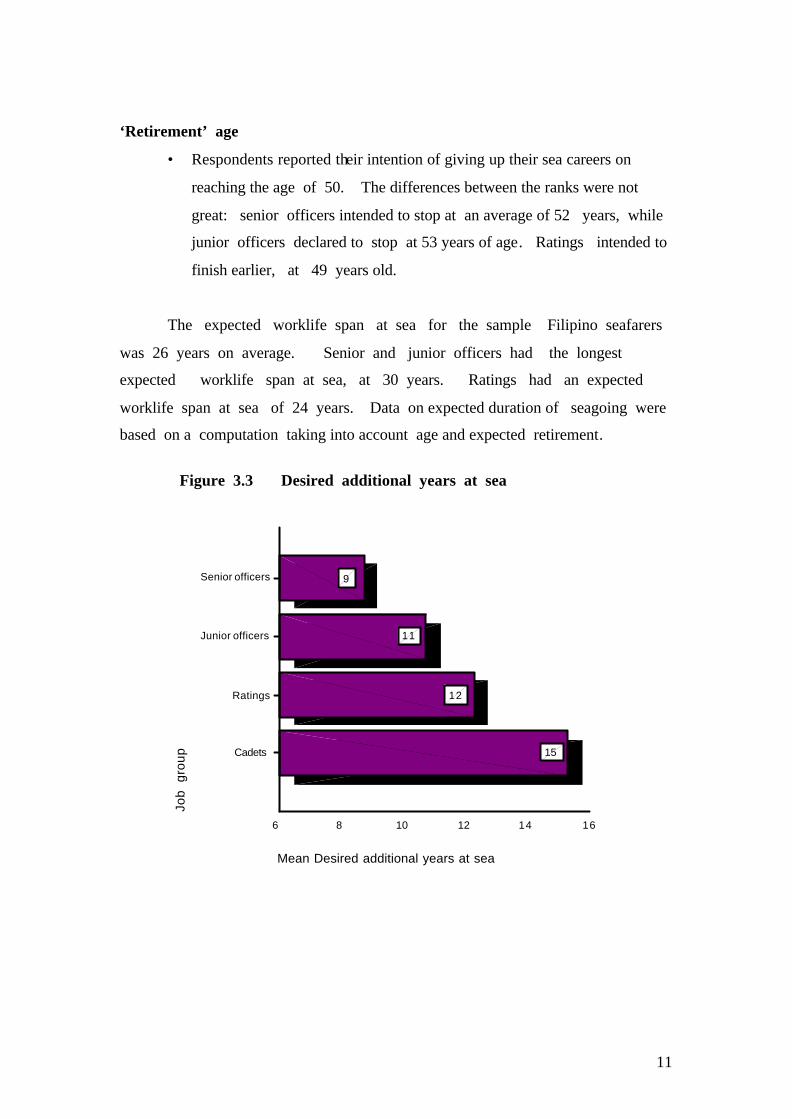
‘Retirement’ age
• Respondents reported their intention of giving up their sea careers on
reaching the age of 50. The differences between the ranks were not
great: senior officers intended to stop at an average of 52 years, while
junior officers declared to stop at 53 years of age. Ratings intended to
finish earlier, at 49 years old.
The expected worklife span at sea for the sample Filipino seafarers
was 26 years on average. Senior and junior officers had the longest
expected worklife span at sea, at 30 years. Ratings had an expected
worklife span at sea of 24 years. Data on expected duration of seagoing were
based on a computation taking into account age and expected retirement.
Figure 3.3 Desired additional years at sea
Job
gro
up
Senior officers
Junior officers
Ratings
Cadets
Mean Desired additional years at sea
1614121086
15
12
11
9
12
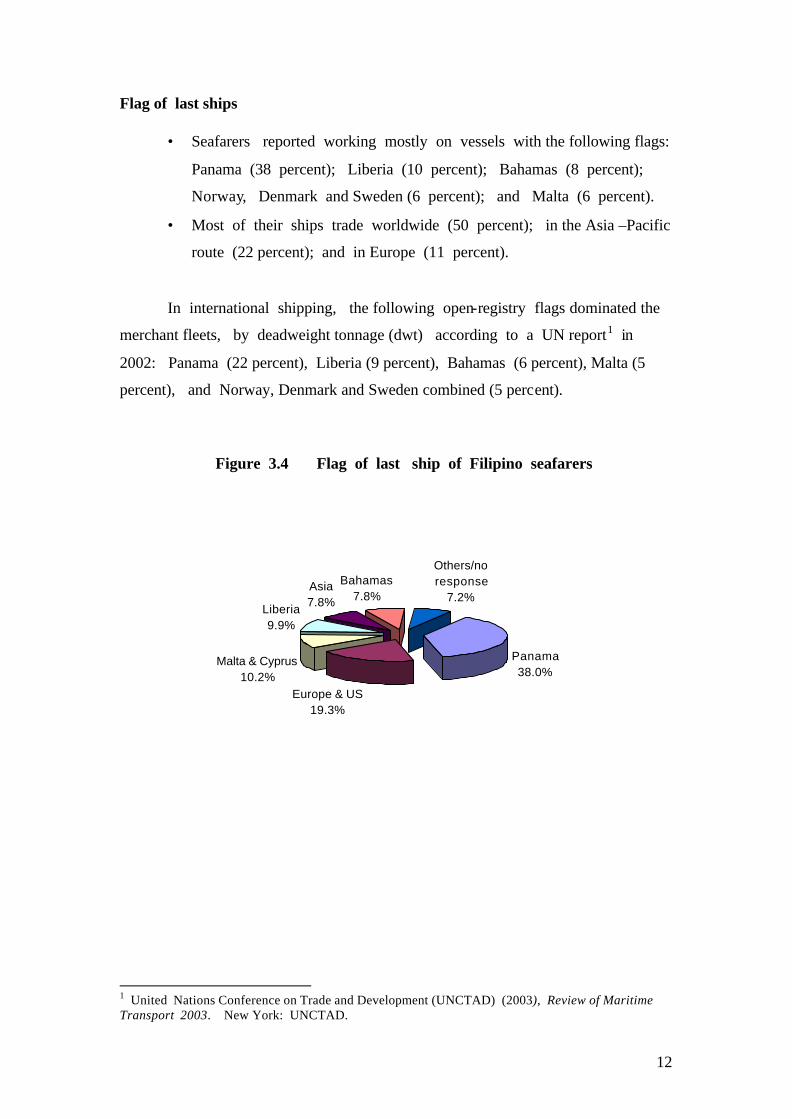
Flag of last ships
• Seafarers reported working mostly on vessels with the following flags:
Panama (38 percent); Liberia (10 percent); Bahamas (8 percent);
Norway, Denmark and Sweden (6 percent); and Malta (6 percent).
• Most of their ships trade worldwide (50 percent); in the Asia –Pacific
route (22 percent); and in Europe (11 percent).
In international shipping, the following open-registry flags dominated the
merchant fleets, by deadweight tonnage (dwt) according to a UN report1 in
2002: Panama (22 percent), Liberia (9 percent), Bahamas (6 percent), Malta (5
percent), and Norway, Denmark and Sweden combined (5 percent).
Figure 3.4 Flag of last ship of Filipino seafarers
1 United Nations Conference on Trade and Development (UNCTAD) (2003), Review of Maritime Transport 2003. New York: UNCTAD.
Panama38.0%
Liberia9.9%
Asia7.8%
Bahamas7.8%
Others/no response
7.2%
Europe & US19.3%
Malta & Cyprus10.2%
13
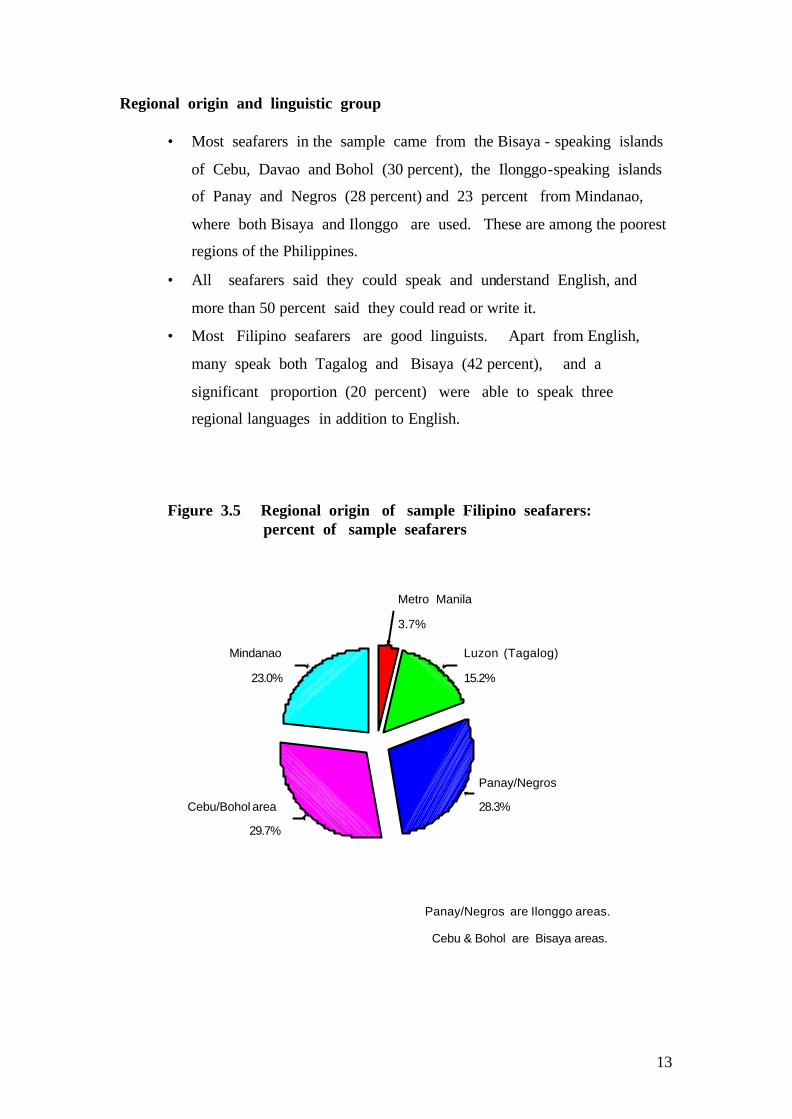
Regional origin and linguistic group
• Most seafarers in the sample came from the Bisaya - speaking islands
of Cebu, Davao and Bohol (30 percent), the Ilonggo-speaking islands
of Panay and Negros (28 percent) and 23 percent from Mindanao,
where both Bisaya and Ilonggo are used. These are among the poorest
regions of the Philippines.
• All seafarers said they could speak and understand English, and
more than 50 percent said they could read or write it.
• Most Filipino seafarers are good linguists. Apart from English,
many speak both Tagalog and Bisaya (42 percent), and a
significant proportion (20 percent) were able to speak three
regional languages in addition to English.
Figure 3.5 Regional origin of sample Filipino seafarers: percent of sample seafarers
Panay/Negros are Ilonggo areas.
Cebu & Bohol are Bisaya areas.
23.0%
29.7%
28.3%
15.2%
3.7%
Mindanao
Cebu/Bohol area
Panay/Negros
Luzon (Tagalog)
Metro Manila
14
Most seafarers came from the islands in central and southern
Philippines where seafaring in the coastline villages is a tradition, and
where poverty is more pronounced. The location of maritime schools generally
reflects the regional distribution of seafarers.
All survey respondents indicated that they could speak and understand
English, but not many said they could write or read it. English is the
medium of instruction in the Philippines, and reading materials, examinations
and communications are written in the English language. Children are
exposed to English- language movies, television programs, magazines and
newspapers. Regional languages are auxiliary official languages and media of
instruction in the regions.
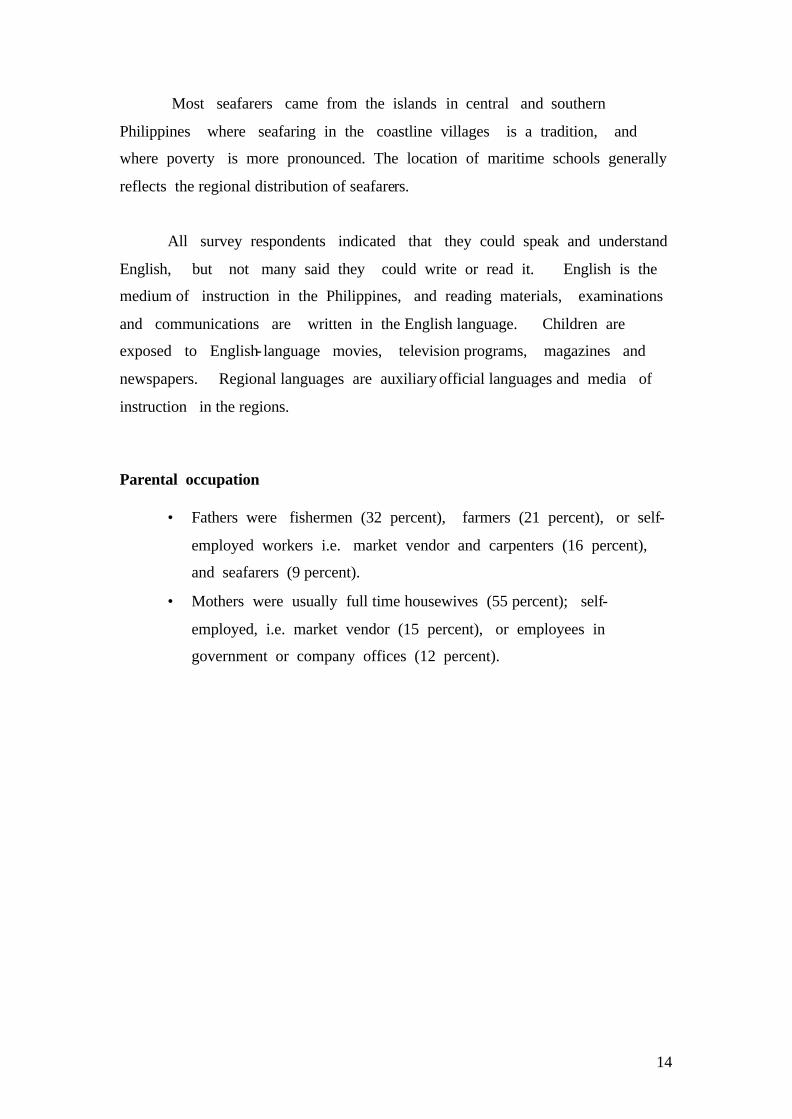
Parental occupation
• Fathers were fishermen (32 percent), farmers (21 percent), or self-
employed workers i.e. market vendor and carpenters (16 percent),
and seafarers (9 percent).
• Mothers were usually full time housewives (55 percent); self-
employed, i.e. market vendor (15 percent), or employees in
government or company offices (12 percent).
15
Figure 3.6 Father’s occupation, sample Filipino seafarers
Figure 3.7 Mother’s occupation, sample Filipino seafarers
5.3%
17.1%
9.1%
35.4%
23.3%
9.7%
Others
Self employed
Worker, laborer
Fisherman
Farmer
Seafarer
8.8%
16.7%
13.5%61.0%
Others
Self employed
EmployeeHousewife
16
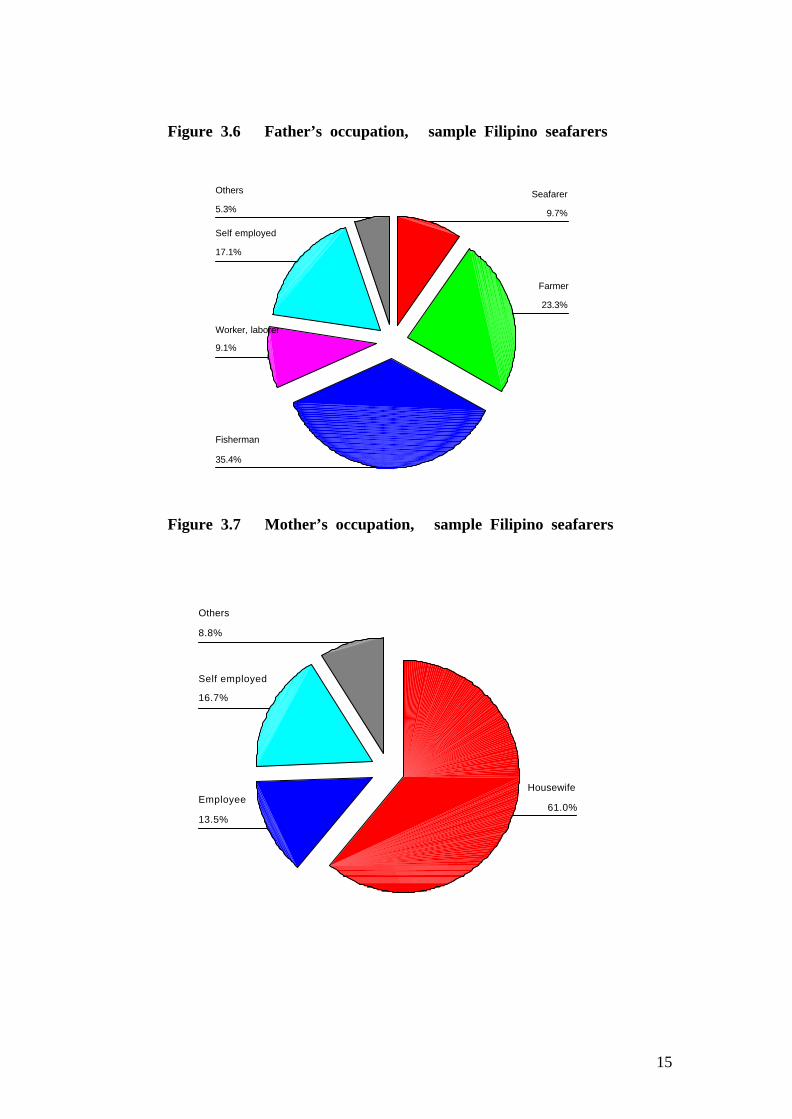
Siblings, children and dependents
• Filipino seafarers come from large families, eight persons on average
(six siblings, two parents).
• Most are married (73 percent). Those with two children constitute
30 percent of the sample, and those with three children, 25
percent of the sample.
• Seafarers support an average of five dependents, inc luding parents,
brothers or sisters, and their children.
• Fifty percent support three to five dependents, while 33 percent
support six or more dependents.
• Most seafarers in this sample had betweeno ne and three children
(56 percent). A few had between four to six children (14
percent).
Figure 3.8 Number of children of surveyed seafarers (percent)
The extended family is normal in most of rural Philippines. It is
common for a family to have elderly grandparents, aunts, uncles and their
families living together in the same house, or within the same housing
compound, or in houses within the immediate neighbourhood. Whether
they are “head” of the household or not, seafarers are expected to provide or
contribute financial support to dependents, particularly for schooling and
No children3%
1 to 3 children56%
4 to 6 children14%
7+ children1%
Not married26%
17
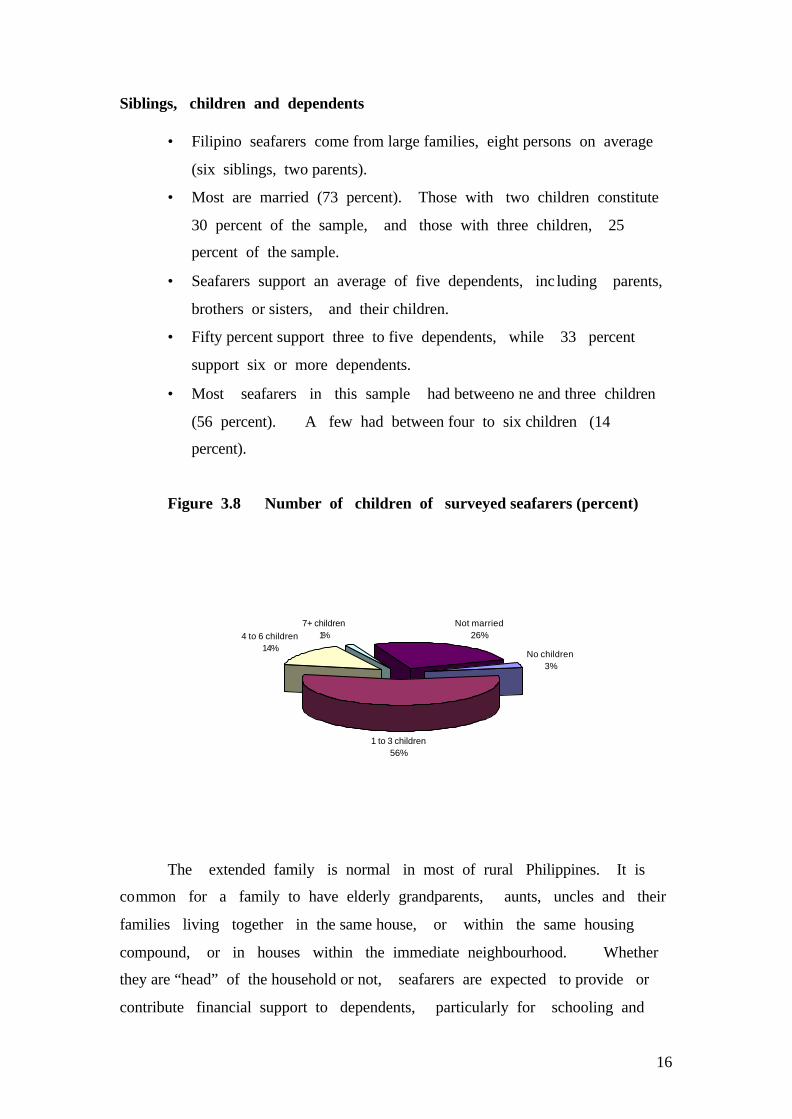
medical needs. Both married and single seafarers in this study supported
several other dependents, through full or partial financial assistance -- elderly
parents, grandparents, siblings, or other relatives. Most support between
one and five dependents (66 percent), but almost one-third support six and ten
dependents (30 percent). Among single seafarers, 71 percent support
between one and five dependents; and 24 percent support between six and ten
dependents. Only four single seafarers said they had no dependents, and they
were among the youngest in the group of respondents.
Figure 3.9 Dependents of married & unmarried sample seafarers
3%
7%
19%19%
16%
14%
10%
4%
2%3%
2%0% 0%
4%
7%
26%
15%
10%
13%
10%9%
1%
3%
1%
Single Married
18
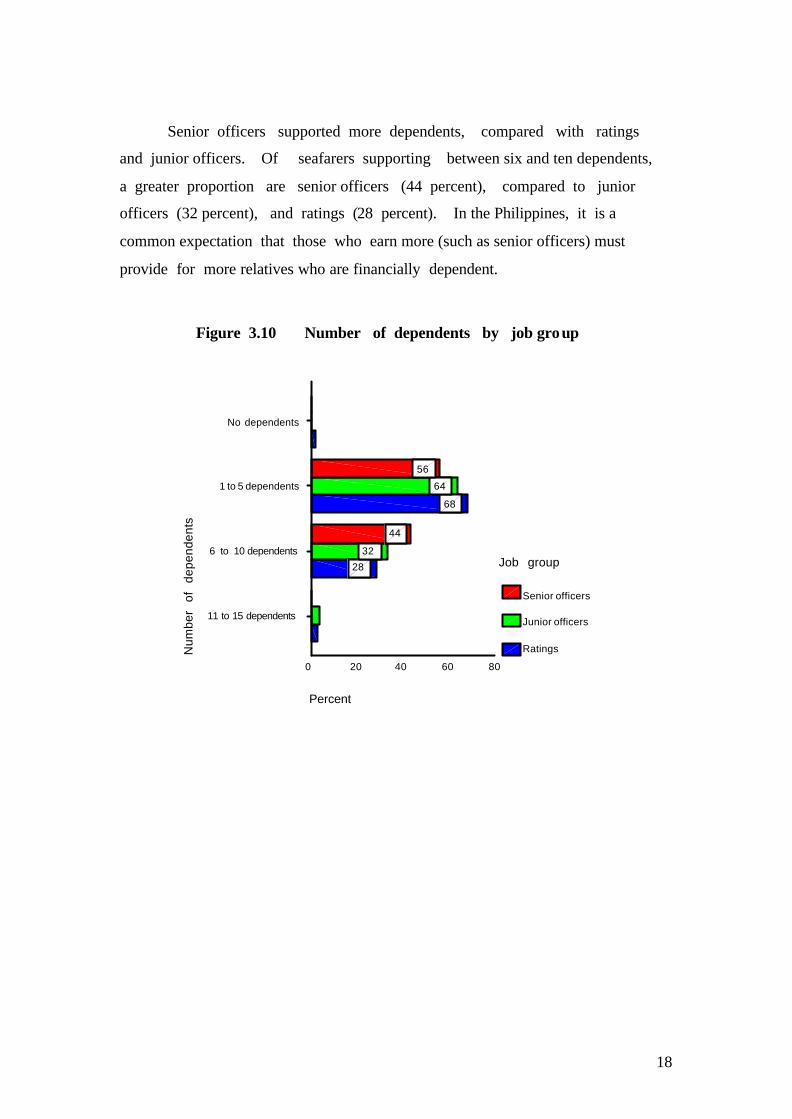
Senior officers supported more dependents, compared with ratings
and junior officers. Of seafarers supporting between six and ten dependents,
a greater proportion are senior officers (44 percent), compared to junior
officers (32 percent), and ratings (28 percent). In the Philippines, it is a
common expectation that those who earn more (such as senior officers) must
provide for more relatives who are financially dependent.
Figure 3.10 Number of dependents by job group
Num
ber
of
dep
ende
nts
No dependents
1 to 5 dependents
6 to 10 dependents
11 to 15 dependents
Percent
806040200
Job group
Senior officers
Junior officers
Ratings
28
68
32
64
44
56
19
Seafarers’ wives
• Most seafarers’ wives worked. Only three percent said they were
full-time housewives. By contrast, seafarers’ mothers are mostly full
time housewives.
• Working wives were professionals (teacher, nurse, etc., 37 percent)) or
staff of government agencies and private firms (34 percent).
Officers’ wives have a higher percentage of professionals (51
percent).
• Seafarers tend to marry those with an equivalent level of education.
Many spouses finished college (48 percent), while some had
unfinished college schooling (11 percent).
Why be a seafarer?
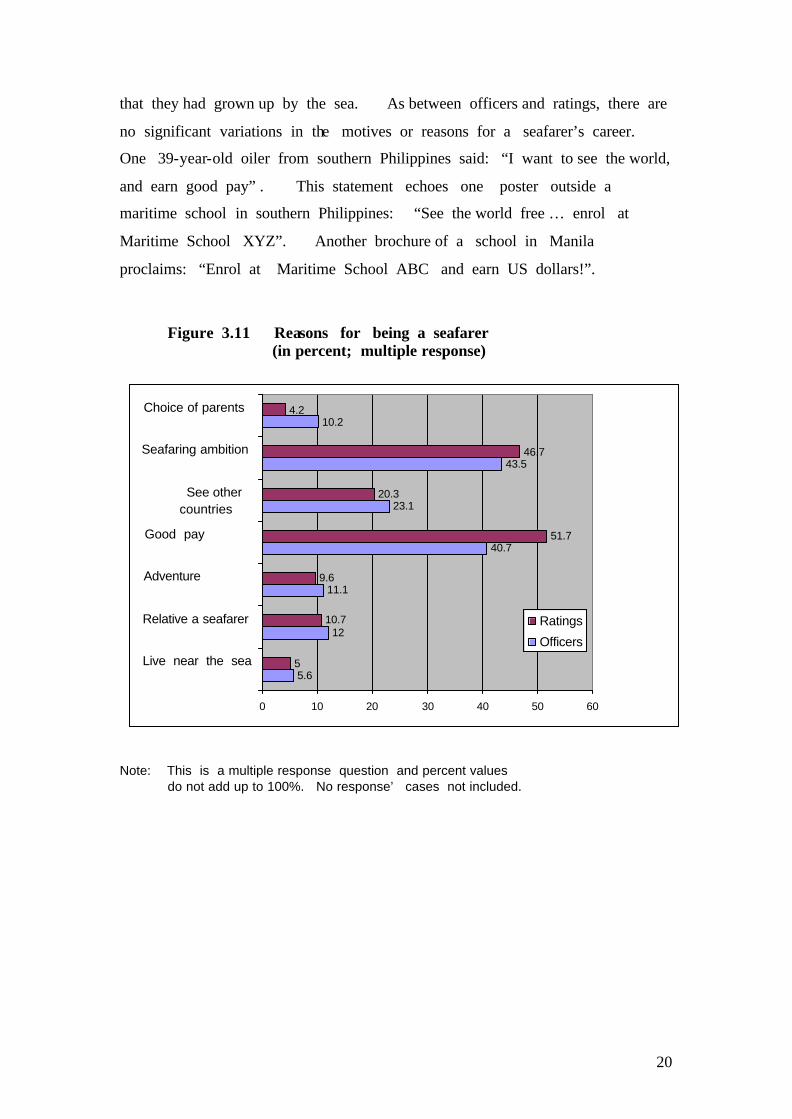
Seafarers view their job as a way out of poverty, but are also attracted
to a career at sea. Many seafarers insisted that “good pay” was their main
motive (49 percent) while marking also among the list of reasons that it was
their ambition to be a seafarer (46 percent). While Filipino seafarers came mostly
from poor rural backgrounds, the love of a career at sea also is uppermost among
their reasons.
Seafarers explained their choices, in terms of wanting their families to
have a better life”; “help their parents and family”; “send brother(s),
sister(s), or children to school”; or “help pay our debt, loans”. Some
said that they have “heard of the difficulties and dangers associated with
working at sea, but they have no choice, since there were very few
economically attractive job opportunities”. A significant minority (11
percent) said they choose this job since their “father, brother, or uncle was
or had been a seafarer, and had influenced their choice of a career”. It is
interesting to note that quite a number of seafarers said it was their parents
or relative’s “advice” (by way of guidance) or choice for them to pursue a
seafarer’s job. A few also referred to the possibilities of “adventure”, and
20
that they had grown up by the sea. As between officers and ratings, there are
no significant variations in the motives or reasons for a seafarer’s career.
One 39-year-old oiler from southern Philippines said: “I want to see the world,
and earn good pay” . This statement echoes one poster outside a
maritime school in southern Philippines: “See the world free … enrol at
Maritime School XYZ”. Another brochure of a school in Manila
proclaims: “Enrol at Maritime School ABC and earn US dollars!”.
Figure 3.11 Reasons for being a seafarer
(in percent; multiple response)
Note: This is a multiple response question and percent values
do not add up to 100%. No response’ cases not included.
5.6
12
11.1
40.7
23.1
43.5
10.2
5
10.7
9.6
51.7
20.3
46.7
4.2
0 10 20 30 40 50 60
Live near the sea
Relative a seafarer
Adventure
Good pay
See other countries
Seafaring ambition
Choice of parents
Ratings
Officers
21
4. Education and training Maritime education in the Philippines
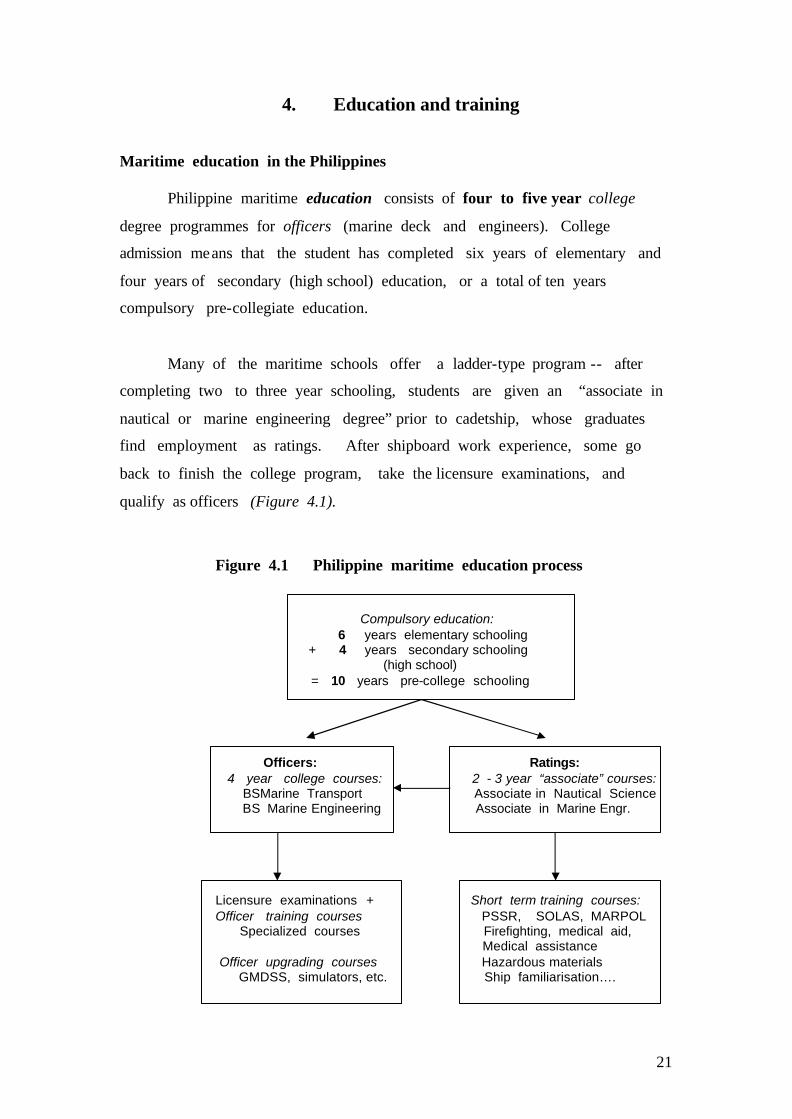
Philippine maritime education consists of four to five year college
degree programmes for officers (marine deck and engineers). College
admission means that the student has completed six years of elementary and
four years of secondary (high school) education, or a total of ten years
compulsory pre-collegiate education.
Many of the maritime schools offer a ladder-type program -- after
completing two to three year schooling, students are given an “associate in
nautical or marine engineering degree” prior to cadetship, whose graduates
find employment as ratings. After shipboard work experience, some go
back to finish the college program, take the licensure examinations, and
qualify as officers (Figure 4.1).
Figure 4.1 Philippine maritime education process Compulsory education:
6 years elementary schooling + 4 years secondary schooling (high school)
= 10 years pre-college schooling
Officers: Ratings: 4 year college courses: 2 - 3 year “associate” courses: BSMarine Transport Associate in Nautical Science BS Marine Engineering Associate in Marine Engr.
Licensure examinations + Short term training courses: Officer training courses PSSR, SOLAS, MARPOL
Specialized courses Firefighting, medical aid, Medical assistance Officer upgrading courses Hazardous materials GMDSS, simulators, etc. Ship familiarisation….
22
Students complete the four-year course and find a placement as a cadet
to gain ‘seatime experience’, and they get a college diploma upon completion of
all requirements. They are then eligible to take the licensure examinations
for marine officers. Those who don’t finish, or fail the licensure
examinations typically find employment as ratings.
The Philippine Commission on Higher Education (CHED), established in
1994, is the government agency regulating higher (tertiary or college)
education, including the maritime sector. As of June 2002, there were 76
accredited universities and colleges which offer maritime courses -- 68 of these
offer a Bachelor of Science in Maritime Transport (BSMT) program for
deck officers and 59 offer a Bachelor of Science in Marine Engineering
(BSMarE), for engineering officers. Many schools offer both programs, as
well as “associate degree” (non graduate tertiary level) courses. CHED’s
memorandum says that “all accredited institutions shall be subject to regular
monitoring and assessment. If found not complying with, or not maintaining the
standards, said institutions shall be deleted [from the list]”. 1
In 1985, there were 47 maritime schools (8 government – owned,
and 39 private – owned) 2 but by 2000 there were 121 schools. Demands for
the application of IMO education standards to meet STCW95 put pressure
upon the CHED to trim the list to 53 schools with accredited maritime
programs in 2001. The number of graduates went down to 8,961 in year
2001, compared with a peak of 15,754 in 1997 (Table 4.4). Many schools
were subsequently able to comply with the standards on facilities and teaching
staff under STCW95 and the number of schools increased to 76 by 2002.
Consistent with being the largest seafarer supplying country, the IMO’s
Compendium of Maritime Training Institutions (IMO 2003) shows that the
1 CHED Memorandum Order, dated 3 June 2002 updating the list of universities and colleges with accredited maritime courses. 2 Mier, A. Francisco J. (1989). Philippine Country Report. In: Mary R. Brooks (editor) Seafarers in the ASEAN Region. Singapore: Institute of Southeast Asian Studies. Pp. 201–203.
23
Philippines has the world’s largest number (n=98) of MET institutions.3 Most
maritime schools offer short-term training upgrading courses for seafarers
alongside the regular degree programs. Of the 76 schools, seven are
government owned. 4 Entrepreneurs who have commercial interests in other areas
of education, as well as other businesses, own most schools. Many school
owners are involved in politics, or have connections with politicians.
Government officials, crewing managers and other industry informants
were asked to list the top maritime schools in the Philippines. Based on
their facilities, teaching staff, reputation and past performance in the
officer licensure examinations, informants most often cited the following
schools: the state-owned Philippine Merchant Marine Academy (PMMA) in San
Narciso, Zambales and the privately owned, non-profit schools: John B.
Lacson Colleges Foundation (JBCLF) in Iloilo City and Bacolod City;
University of Cebu in Cebu City; Misamis Institute of Technology (MIT) in
Ozamis City; Cagayan Capitol College (CCC) in Cagayan de Oro City in
Mindanao; and the Davao Merchant Marine Academy (DMMA) in Davao
City.
Industry informants said that the newest maritime school with the latest
acquisitions in laboratories and other learning equipment is the Maritime
Academy of Asia and the Pacific (MAAP) in Mariveles town, across
Manila Bay. Established in 1998, MAAP is owned by the Associated
Marine Officers and Seamen’s Union of the Philippines (AMOSUP). It had
567 maritime students when visited in 2002. The first batch of 130
graduates in April 2003 had 4 females. All had undergone shipboard
3 The IMO website (www.imo.org, accessed 16 September 2003) shows a ‘white’ list of 98 MET institutions (maritime schools, colleges and training centres) in the Philippines. The website also lists MET institutions in other countries: Russia, 38; UK, 25; Ukraine, 26; India, 20; Netherlands, 15; China, 14; and the USA, 10. Greece has 8; Turkey, 5 and Indonesia, 5. 4 The government owned maritime schools include: (1) the Philippine Merchant Marine Academy (PMMA); and 6 regional state colleges with maritime courses in southern Philippines: (2) Iloilo State College of Fisheries in Barotac Nuevo, Iloilo province; (3) Western Visayas College of Science and Technology in La Paz, Iloilo City; (4) Cebu State College of Science and Technology in Carmen, Cebu province; (5) Naval Institute of Technology in Naval, Biliran province; (6) Palompon Institute of Technology in Palompon, Leyte province; and (7) Zamboanga State College of Marine Science and Technology, in Zamboanga City in Mindanao.
24
training and cadetship in foreign merchant ships. The first batch will take
the licensure examinations for officers in late 2003.
In the four or five-year program, students undergo a prescribed
combination of general education subjects (humanities, social sciences,
mathematics, physical sciences) and the maritime related technical courses.
Military training through the Naval Reserve Officers Training Corps (NROTC)
requires four to five hours a week, in four semesters mostly in parade &
marching formation.
English is the official medium of instruction in Philippine maritime college
courses, and there are three or four mandatory courses on English communication
skills (writing, grammar, and literature). All text-books and training materials in
other subjects are also in English, although instructors often use the local language to
supplement explanations.
CHED requires all maritime schools to follow a similar structure and
sequence of courses. Most Philippine maritime schools adopt the “3 - 1”
model (three years of classroom schooling plus one year shipboard cadetship
training). Variations of the curriculum are used by some maritime schools
for various groups of students, such as:
“2 – 1 - 1” model: two years of classroom schooling plus one year shipboard
training (cadetship) plus one year additional classroom schooling.
“1 – 1 - 2” model: one year classroom schooling plus one year shipboard
training (cadetship) plus two years additional classroom schooling.
The “2 – 1 - 1” and the “1 – 1 – 2” models apply to maritime
students under sponsorship by the shipping employers in Project Alpha, of
the Norwegian Shipowners Association. The project is underway in several
maritime schools, and the aim is to provide a supply of officers for NIS
ships. At the time of the survey, there were 50 first year cadets sponsored
25
by Project Alpha (25 deck, 25 marine engine); and a total of 200 student-
beneficiaries of the project in this school.
Education profile of seafarers
Most seafarer survey respondents had a college degree (55 percent),
and 47 percent of them had completed a maritime course -- either BS Marine
Transport (39.8 percent) or BS Marine Engineering program (7.5 percent).
Those who finished an associate level (non-graduate college level) in maritime
education were 31.8 percent of the sample. Some four percent had high
school education only. They were all ratings.
Figure 4.2 Education profile of seafarers: total sample
Most ratings (55 percent) had college education: 37 percent had
finished a BS Marine Transport degree, eight percent a BS Marine
Engineering, and nine percent other college courses.
4.3%
6.7%
.5%
9.1%
31.8%
7.5%
39.6%
.5%
High school graduat
College, graduated
Some college
Vocat'l, technical
Associate nautical
BS Marine Eng'r
BS Marine Transport
No response
26
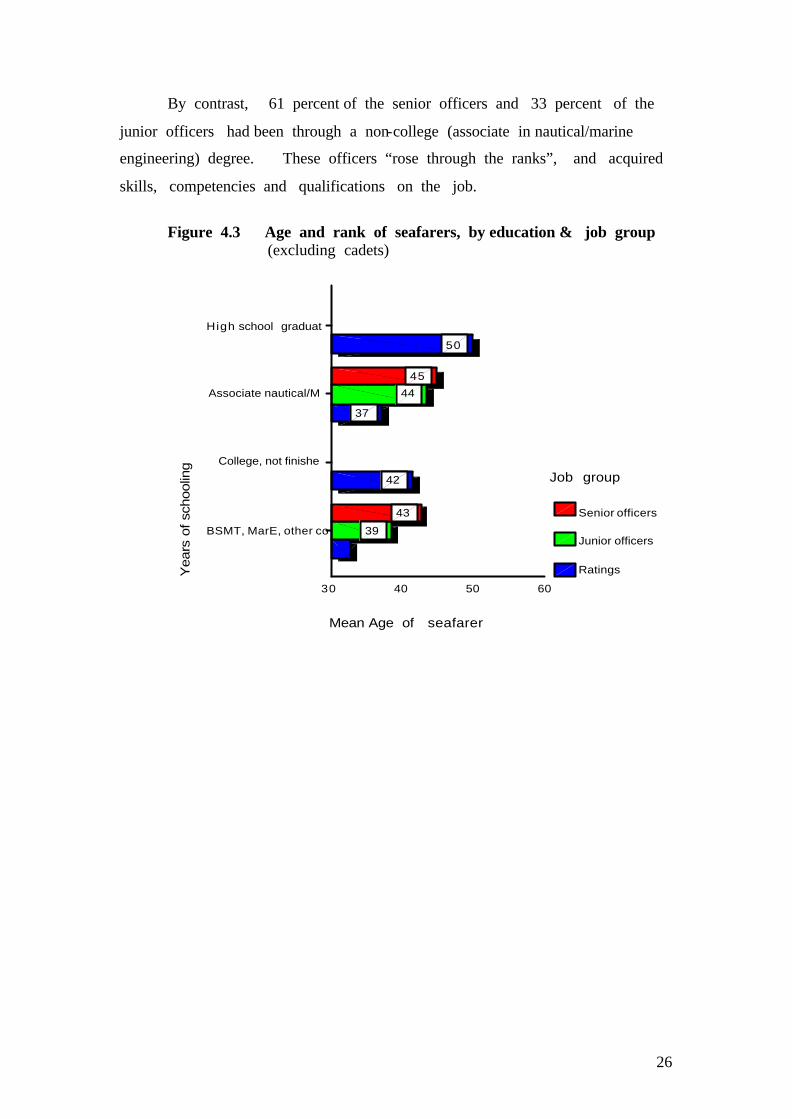
By contrast, 61 percent of the senior officers and 33 percent of the
junior officers had been through a non-college (associate in nautical/marine
engineering) degree. These officers “rose through the ranks”, and acquired
skills, competencies and qualifications on the job.
Figure 4.3 Age and rank of seafarers, by education & job group (excluding cadets)
Most ratings (55 percent) had college education -- 37 percent
Yea
rs o
f sc
hool
ing
High school graduat
Associate nautical/M
College, not finishe
BSMT, MarE, other co
Mean Age of seafarer
60504030
Job group
Senior officers
Junior officers
Ratings
42
37
50
39
44
43
45
27
Maritime training
Maritime training provides a variety of short courses which update
competencies of seafarers, both officers and ratings, for career development,
promotion, and to qualify for STCW’95 certification. There were 41 maritime
training centres accredited by the Maritime Training Council in 2002.5
The MTC was created in 1984 to co-ordinate the efforts of a dozen
or so government agencies based in different ministries.6 A maritime
training centre must have a certificate of accreditation, or provisional authority
before accepting trainees. The MTC ensures compliance with the
requirements of the IMO STCW’95.
Courses approved by the MTC secretariat include: personal survival
techniques, fire prevention and firefighting, elementary first aid, and Personal
Safety and Social Responsibility (PSSR). As a major effort against fraudulent
certification, a government website 7 allows verification of the digital image of
a seafarer’s certificate, which enables shipping companies and crewing
agencies world-wide to check its authenticity.
The law mandates a separate agency, the Technical Education and
Skills Development Authority (TESDA), to regulate training for ratings
(TESDA Law of 1994, Republic Act 7796). In June 2002, there were 114
assessors accredited to examine competencies of ratings. Portfolio
assessment is used for ratings who possess at least one-year seagoing
experience. A “procedures manual for assessment and certification” is now
on pilot implementation in a number of regional centres. TESDA has
5 A list of the accredited training centres and maritime schools could be viewed at the MTC website: <http://www.mtc.gov.ph>). This website also allows verification of certificates of Filipino seafarers. 6 More details about the government agencies involved are presented in Chapter 7 on policy and governance. 7 Website address: www.mtc.gov.ph
28
accredited 16 “assessment centres”, qualified and certified 73,209 deck
ratings, and 39,346 engine ratings. 8
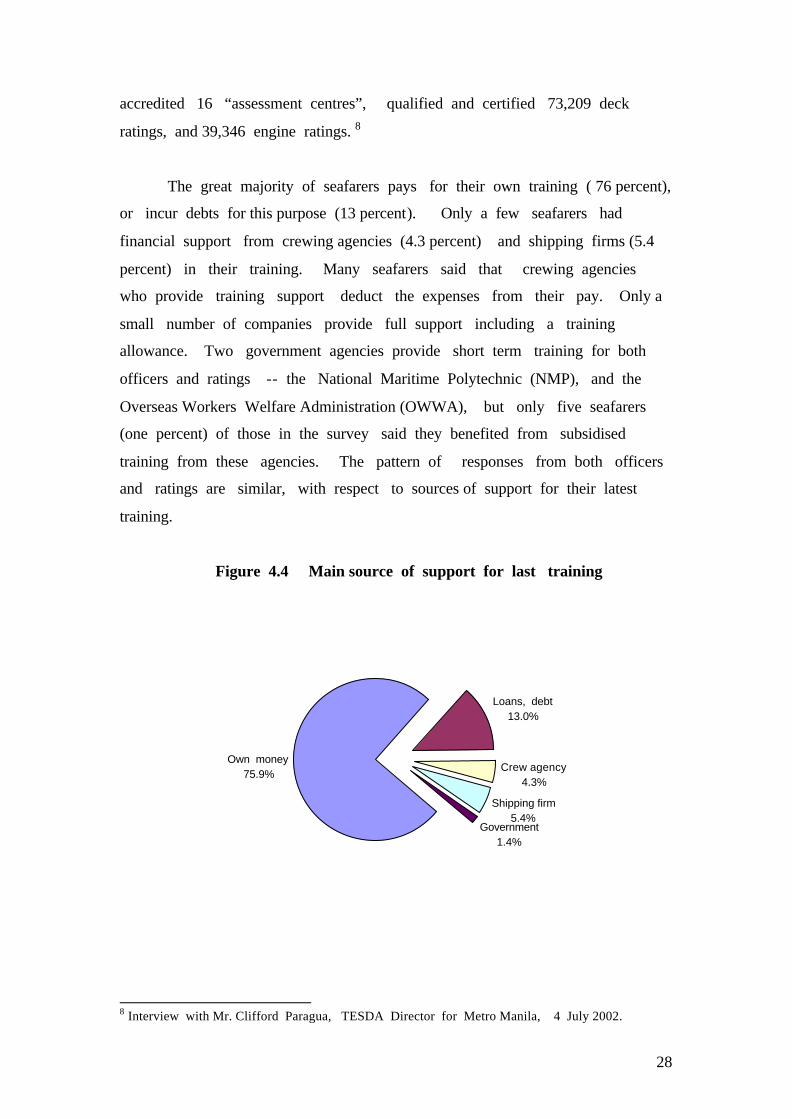
The great majority of seafarers pays for their own training ( 76 percent),
or incur debts for this purpose (13 percent). Only a few seafarers had
financial support from crewing agencies (4.3 percent) and shipping firms (5.4
percent) in their training. Many seafarers said that crewing agencies
who provide training support deduct the expenses from their pay. Only a
small number of companies provide full support including a training
allowance. Two government agencies provide short term training for both
officers and ratings -- the National Maritime Polytechnic (NMP), and the
Overseas Workers Welfare Administration (OWWA), but only five seafarers
(one percent) of those in the survey said they benefited from subsidised
training from these agencies. The pattern of responses from both officers
and ratings are similar, with respect to sources of support for their latest
training.
Figure 4.4 Main source of support for last training
8 Interview with Mr. Clifford Paragua, TESDA Director for Metro Manila, 4 July 2002.
Own money75.9%
Loans, debt13.0%
Crew agency4.3%
Shipping firm5.4%
Government1.4%
29
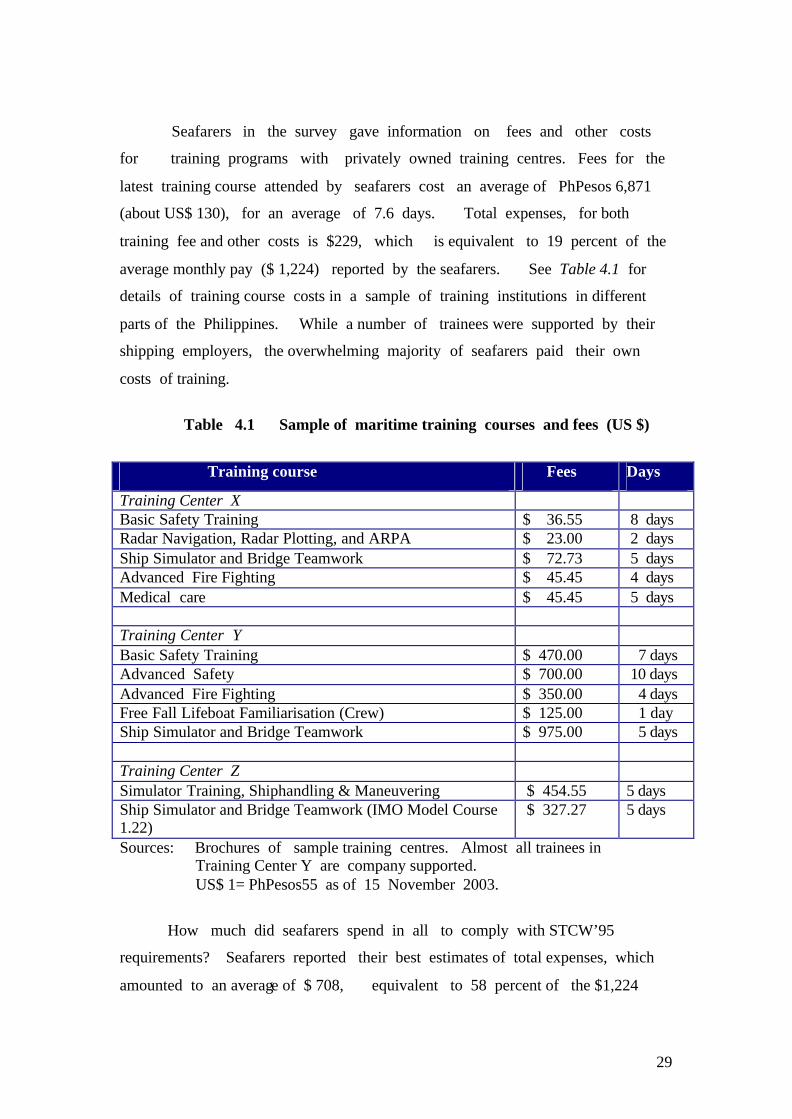
Seafarers in the survey gave information on fees and other costs
for training programs with privately owned training centres. Fees for the
latest training course attended by seafarers cost an average of PhPesos 6,871
(about US$ 130), for an average of 7.6 days. Total expenses, for both
training fee and other costs is $229, which is equivalent to 19 percent of the
average monthly pay ($ 1,224) reported by the seafarers. See Table 4.1 for
details of training course costs in a sample of training institutions in different
parts of the Philippines. While a number of trainees were supported by their
shipping employers, the overwhelming majority of seafarers paid their own
costs of training.
Table 4.1 Sample of maritime training courses and fees (US $)
Training course Fees Days
Training Center X Basic Safety Training $ 36.55 8 days Radar Navigation, Radar Plotting, and ARPA $ 23.00 2 days Ship Simulator and Bridge Teamwork $ 72.73 5 days Advanced Fire Fighting $ 45.45 4 days Medical care $ 45.45 5 days Training Center Y Basic Safety Training $ 470.00 7 days Advanced Safety $ 700.00 10 days Advanced Fire Fighting $ 350.00 4 days Free Fall Lifeboat Familiarisation (Crew) $ 125.00 1 day Ship Simulator and Bridge Teamwork $ 975.00 5 days Training Center Z Simulator Training, Shiphandling & Maneuvering $ 454.55 5 days Ship Simulator and Bridge Teamwork (IMO Model Course 1.22)
$ 327.27 5 days
Sources: Brochures of sample training centres. Almost all trainees in Training Center Y are company supported.
US$ 1= PhPesos55 as of 15 November 2003.
How much did seafarers spend in all to comply with STCW’95
requirements? Seafarers reported their best estimates of total expenses, which
amounted to an average of $ 708, equivalent to 58 percent of the $1,224
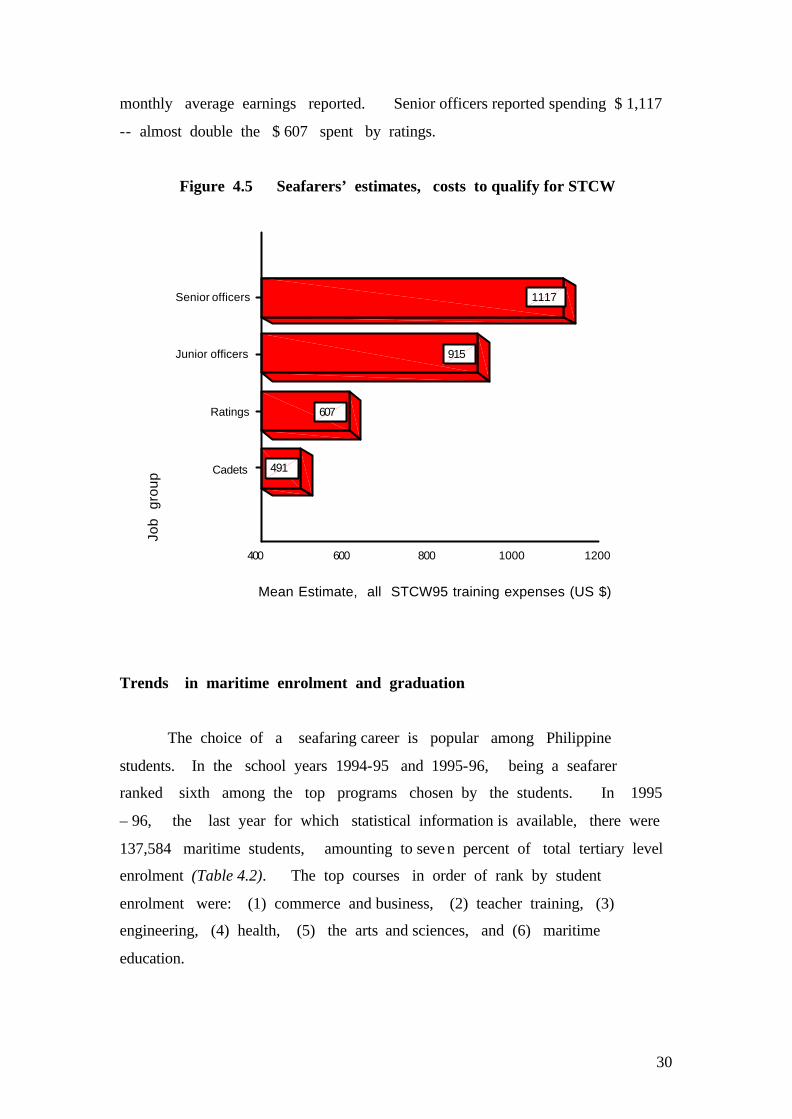
30
monthly average earnings reported. Senior officers reported spending $ 1,117
-- almost double the $ 607 spent by ratings.
Figure 4.5 Seafarers’ estimates, costs to qualify for STCW
Trends in maritime enrolment and graduation
The choice of a seafaring career is popular among Philippine
students. In the school years 1994-95 and 1995-96, being a seafarer
ranked sixth among the top programs chosen by the students. In 1995
– 96, the last year for which statistical information is available, there were
137,584 maritime students, amounting to seven percent of total tertiary level
enrolment (Table 4.2). The top courses in order of rank by student
enrolment were: (1) commerce and business, (2) teacher training, (3)
engineering, (4) health, (5) the arts and sciences, and (6) maritime
education.
Job
gro
up
Senior officers
Junior officers
Ratings
Cadets
Mean Estimate, all STCW95 training expenses (US $)
12001000800600400
491
607
915
1117
31
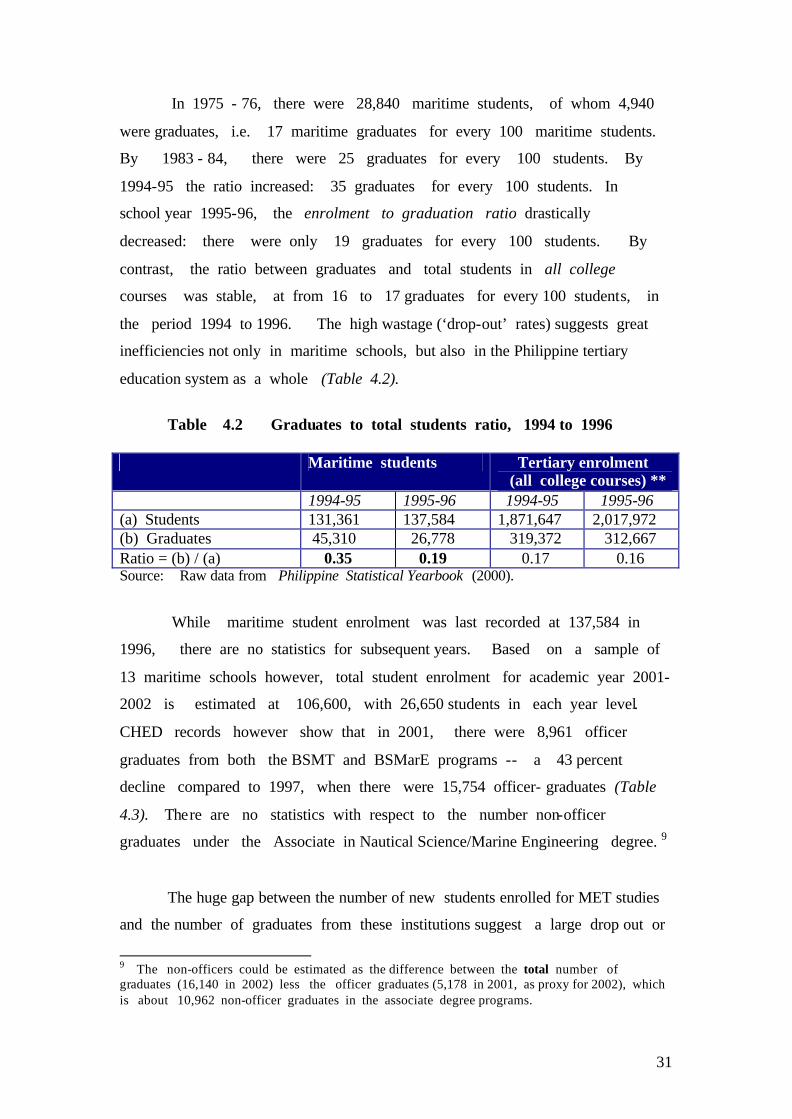
In 1975 - 76, there were 28,840 maritime students, of whom 4,940
were graduates, i.e. 17 maritime graduates for every 100 maritime students.
By 1983 - 84, there were 25 graduates for every 100 students. By
1994-95 the ratio increased: 35 graduates for every 100 students. In
school year 1995-96, the enrolment to graduation ratio drastically
decreased: there were only 19 graduates for every 100 students. By
contrast, the ratio between graduates and total students in all college
courses was stable, at from 16 to 17 graduates for every 100 students, in
the period 1994 to 1996. The high wastage (‘drop-out’ rates) suggests great
inefficiencies not only in maritime schools, but also in the Philippine tertiary
education system as a whole (Table 4.2).
Table 4.2 Graduates to total students ratio, 1994 to 1996
Maritime students Tertiary enrolment
(all college courses) ** 1994-95 1995-96 1994-95 1995-96 (a) Students 131,361 137,584 1,871,647 2,017,972 (b) Graduates 45,310 26,778 319,372 312,667 Ratio = (b) / (a) 0.35 0.19 0.17 0.16 Source: Raw data from Philippine Statistical Yearbook (2000).
While maritime student enrolment was last recorded at 137,584 in
1996, there are no statistics for subsequent years. Based on a sample of
13 maritime schools however, total student enrolment for academic year 2001-
2002 is estimated at 106,600, with 26,650 students in each year level.
CHED records however show that in 2001, there were 8,961 officer
graduates from both the BSMT and BSMarE programs -- a 43 percent
decline compared to 1997, when there were 15,754 officer- graduates (Table
4.3). There are no statistics with respect to the number non-officer
graduates under the Associate in Nautical Science/Marine Engineering degree. 9
The huge gap between the number of new students enrolled for MET studies
and the number of graduates from these institutions suggest a large drop out or
9 The non-officers could be estimated as the difference between the total number of graduates (16,140 in 2002) less the officer graduates (5,178 in 2001, as proxy for 2002), which is about 10,962 non-officer graduates in the associate degree programs.
32
wastage rate. Many students may find they are unable to afford the costs of MET
courses, and are forced to drop out. Others find they are unable to obtain
placements for cadetships or shipboard training.
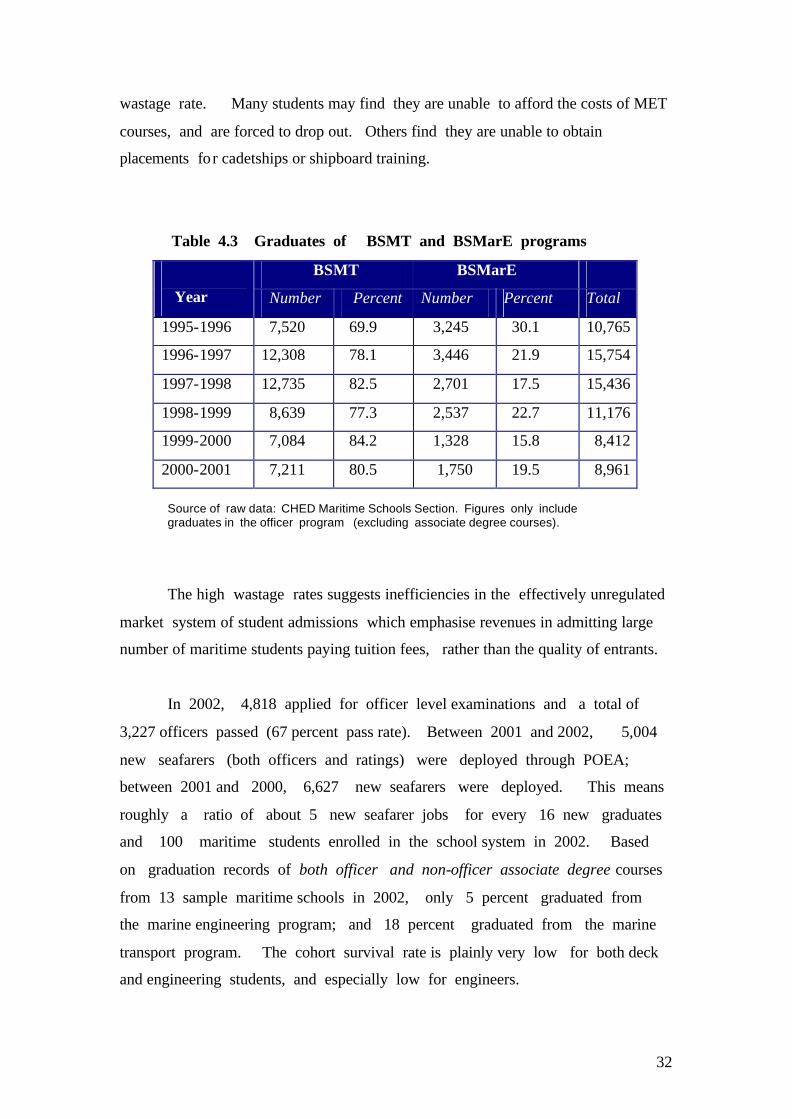
Table 4.3 Graduates of BSMT and BSMarE programs
BSMT BSMarE
Year Number Percent Number Percent Total
1995-1996 7,520 69.9 3,245 30.1 10,765
1996-1997 12,308 78.1 3,446 21.9 15,754
1997-1998 12,735 82.5 2,701 17.5 15,436
1998-1999 8,639 77.3 2,537 22.7 11,176
1999-2000 7,084 84.2 1,328 15.8 8,412
2000-2001 7,211 80.5 1,750 19.5 8,961 Source of raw data: CHED Maritime Schools Section. Figures only include graduates in the officer program (excluding associate degree courses).
The high wastage rates suggests inefficiencies in the effectively unregulated
market system of student admissions which emphasise revenues in admitting large
number of maritime students paying tuition fees, rather than the quality of entrants.
In 2002, 4,818 applied for officer level examinations and a total of
3,227 officers passed (67 percent pass rate). Between 2001 and 2002, 5,004
new seafarers (both officers and ratings) were deployed through POEA;
between 2001 and 2000, 6,627 new seafarers were deployed. This means
roughly a ratio of about 5 new seafarer jobs for every 16 new graduates
and 100 maritime students enrolled in the school system in 2002. Based
on graduation records of both officer and non-officer associate degree courses
from 13 sample maritime schools in 2002, only 5 percent graduated from
the marine engineering program; and 18 percent graduated from the marine
transport program. The cohort survival rate is plainly very low for both deck
and engineering students, and especially low for engineers.
33
Licensure examinations of officers
The Merchant Marine Professions Act of 1998 (Republic Act No.
8544) provides the basis for the Professional Regulation Commission to
regulate the certification of officers, through licensure examination. This
Act declares as state policy “… the institutionalisation of radical changes as
required by international and national standards to ensure qualified, competent and
globally competitive marine deck and engine officers … .” The Philippine
Congress enacted the law as part of the country’s commitment to the
Standards of Training, Certification and Watchkeeping Convention of 1978
(STCW78), as amended in 1995 (Section 2, RA8544).
The scope of examinations for deck and engineering officers include the
following functions: (1) navigation; (2) cargo handling and stowage; (3) ship
operation and care for persons onboard; (4) marine engineering; (5) electrical,
electronic and control engineering; (6) maintenance and repair; and (7) radio
communications. There are no restrictions on the number of times that an
applicant can take the examinations, in the event of failure.
The Philippine Maritime Officers Act (RA8544) requires the Board of
Examiners of the Marine Deck and Engineer Officers “… to report on the
performance of the examinees of maritime schools, colleges and universities.
Examiners monitor and submit to the CHED a list of maritime schools whose
successful examinees in the past three consecutive examinations is less than 5
percent of their total, with a recommendation to phase out the course
program, if necessary”. 10
All seafarers who finish their studies must register for the practice of
the maritime profession, and are required by law to undergo and pass a
written technical examination. Results are announced within 15 days. The
Act provides that “when conditions and circumstances warrant, the Board may
10 Section 41 of the Implementing Rules and Regulations for the Merchant Marine Professional Act of 1997 (RA 8544).
34
give walk –in examinations, subject to the approval of the Commission”. (Section
13, RA8544). Similar to government civil service examinations,
computerised, “walk – in “ 11 examinations are flexible, and depend entirely
on the convenience of applicants. Immediately after testing, results and
certification can be provided. Examinations are held about 3 or 4 times
every year, depending on the decisions of the Professional Regulation
Commission (PRC). Pass rates for the maritime licensure examinations for
the year 2000 were 41 percent for the marine deck (3rd mate level), and 59
percent for marine engineering (4th engineer level) . Between 1992 to 1997,
the average passing rates were 20 percent for marine deck officers (3rd
mate), and 34 percent for marine engineers. 12
In June 2002, cheating in the examinations for 3rd deck officers
threatened the integrity of the Philippine examination system for seafarers. The
PRC took the controversial step of nullifying the examinations, and
required examinees to repeat the whole process 13. After an investigation,
senior officials involved in the cheating incident, together with three captains
owning private review centres, were charged with corruption 14. The PRC is
under the direct supervision of the Office of the President and President
Gloria Macapagal Arroyo cited this step of voiding results of the questionable
examinations as an example of the country’s commitment to professionalism,
and the integrity of the marine profession.15
The law requires the public release of the results for the marine deck and
engineering examinations in five (5) working days from the last day of
examinations. Successful examinees in the written examinations then proceed
to practical assessment. As part of the reforms in the professional licensure
examinations, the Professional Regulation Commission decided to have
11 The date of a computerised ‘walk-in’ examination is at the convenience of an individual applicant, unlike regular examinations which are held en masse in a specifically pre-announced place and date. 12 Philippine Statistical Yearbooks 1993 to 1998. 13 Seaway Shipping Digest, December 2002 14 Fairplay, May 8, 2003. 15 President Gloria Macapagal Arroyo’s speech before the first graduation exercises of the Maritime Academy of Asia and the Pacific (MAAP), 19 July 2003. Available in <www.ops.gov.ph/speeches2003/speech-2003july19.htm>.
35
separate examinations for the theoretical or written phase, and the practical
phase. The practical assessments required the use of simulators in the
examinations of 2002, and this major change became the subject of seafarer
protests. Some seafarers argued that certified seagoing experience in jobs which
had actual simulators aboard certain types of ships rendered such assessments
unnecessary.
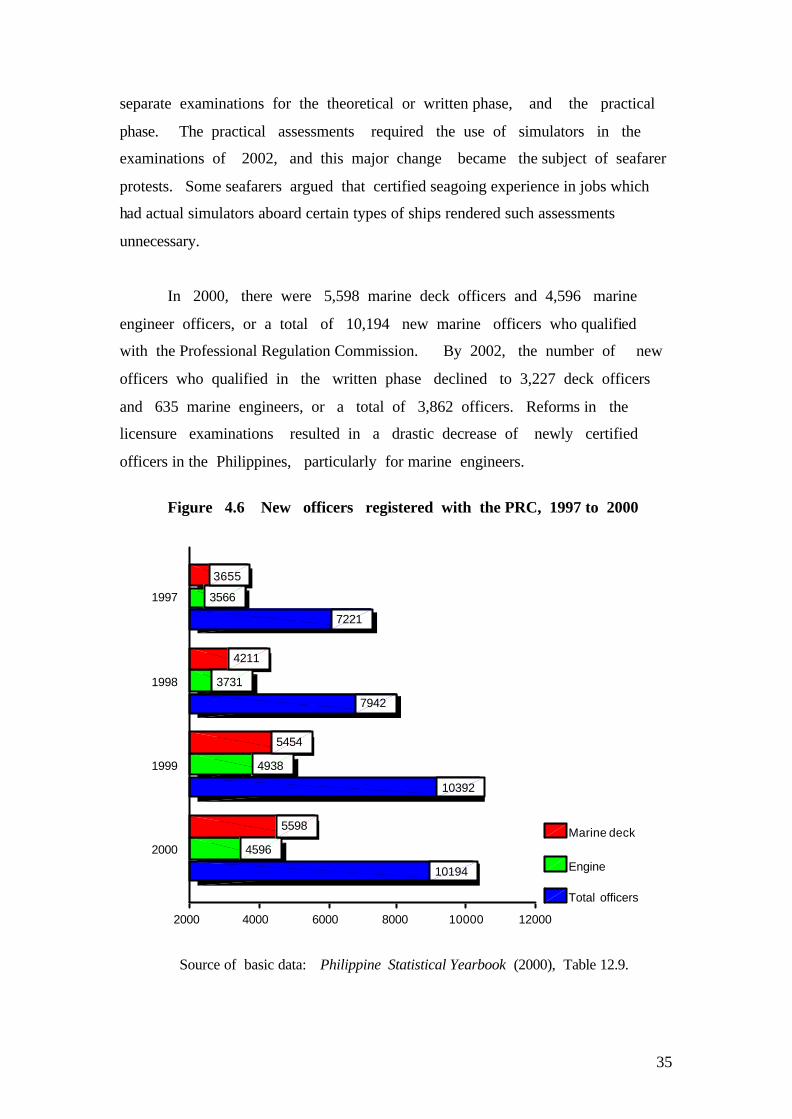
In 2000, there were 5,598 marine deck officers and 4,596 marine
engineer officers, or a total of 10,194 new marine officers who qualified
with the Professional Regulation Commission. By 2002, the number of new
officers who qualified in the written phase declined to 3,227 deck officers
and 635 marine engineers, or a total of 3,862 officers. Reforms in the
licensure examinations resulted in a drastic decrease of newly certified
officers in the Philippines, particularly for marine engineers.
Figure 4.6 New officers registered with the PRC, 1997 to 2000
Source of basic data: Philippine Statistical Yearbook (2000), Table 12.9.
1997
1998
1999
2000
12000100008000600040002000
Marine deck
Engine
Total officers
10194
10392
7942
7221
4596
4938
3731
3566
5598
5454
4211
3655
36
Some government officials point to this phenomenon of a drastic decrease
in certified officers as evidence of the effective implementation of higher standards
in Philippine maritime education and certification. In addition, Philippine
authorities declared ‘all-out war’ against fraudulent certification, by filing formal
charges in court against those who submit fake documents and records on
schooling, training, seagoing service, birth certificates, and others.16
Sources of support and costs of Philippine maritime education
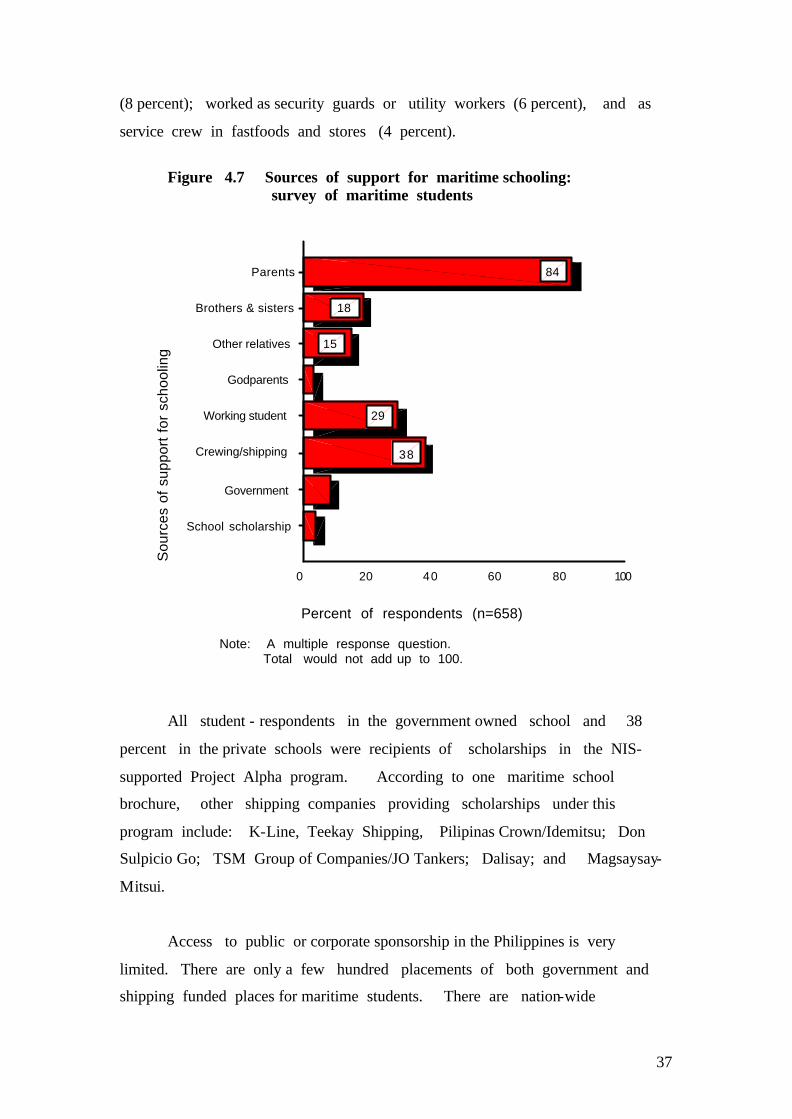
The data from this section is derived from a sample survey of 658
senior maritime students in 11 maritime schools nation-wide. The survey was
conducted from July to August 2002. While students may have obtained
financial assistance from a variety of sources for their maritime schooling,
parents were still the overwhelming source of support (83.7 percent). Family
members also provided assistance: brothers or sisters (18 percent); other relatives
(15 percent) and even godparents (3.3 percent). It is significant that 37.8
percent of students were sponsored in their studies by shipping or crewing
firms. On the other hand, some siblings of the student-respondents (18
percent) had been obliged to cut short their own schooling so that their brothers
could continue their maritime education. Forty–four percent of students said
that parents covered all schooling expenses, 21 percent said more than
half, and 35 percent less than half.
Some students indicated that their parents borrowed money or took out
loans to pay for schooling (14 percent), and even sold or leased property
such as land, farm animals and cattle (5.6 percent) to raise funds for their
schooling expenses. Students on shipboard training were provided “training
allowances”, from which savings were used to pay for other schooling
expenses (51 percent).
Others had part time summer jobs (14 percent); worked part time in
the school (9 percent); took odd jobs in construction, as a driver or barber
16 See ‘Philippines stamping out fake certificates’, Lloyd’s List, 26 November 2003 p.3.
37
(8 percent); worked as security guards or utility workers (6 percent), and as
service crew in fastfoods and stores (4 percent).
Figure 4.7 Sources of support for maritime schooling:
survey of maritime students
Note: A multiple response question.
Total would not add up to 100.
All student - respondents in the government owned school and 38
percent in the private schools were recipients of scholarships in the NIS-
supported Project Alpha program. According to one maritime school
brochure, other shipping companies providing scholarships under this
program include: K-Line, Teekay Shipping, Pilipinas Crown/Idemitsu; Don
Sulpicio Go; TSM Group of Companies/JO Tankers; Dalisay; and Magsaysay-
Mitsui.
Access to public or corporate sponsorship in the Philippines is very
limited. There are only a few hundred placements of both government and
shipping funded places for maritime students. There are nation-wide
Sou
rces
of
supp
ort
for
scho
olin
g
Parents
Brothers & sisters
Other relatives
Godparents
Working student
Crewing/shipping
Government
School scholarship
Percent of respondents (n=658)
100806040200
38
29
15
18
84
38
announcements for annual competitive examinations for 200 scholarships with
the Philippine Merchant Marine Academy (PMMA) and 100 places with the
Maritime Academy for Asia and the Pacific (MAAP). About 200 NIS-sponsored
scholarships are also available for the Alpha Programme. In one maritime school
in southern Philippines, students accepted in the NIS – sponsored Project
Alpha program sign a contract, to the effect that upon successful
employment after graduation the graduate must return the sponsorship funds
to the school–owner, for payment of the “study loan”.
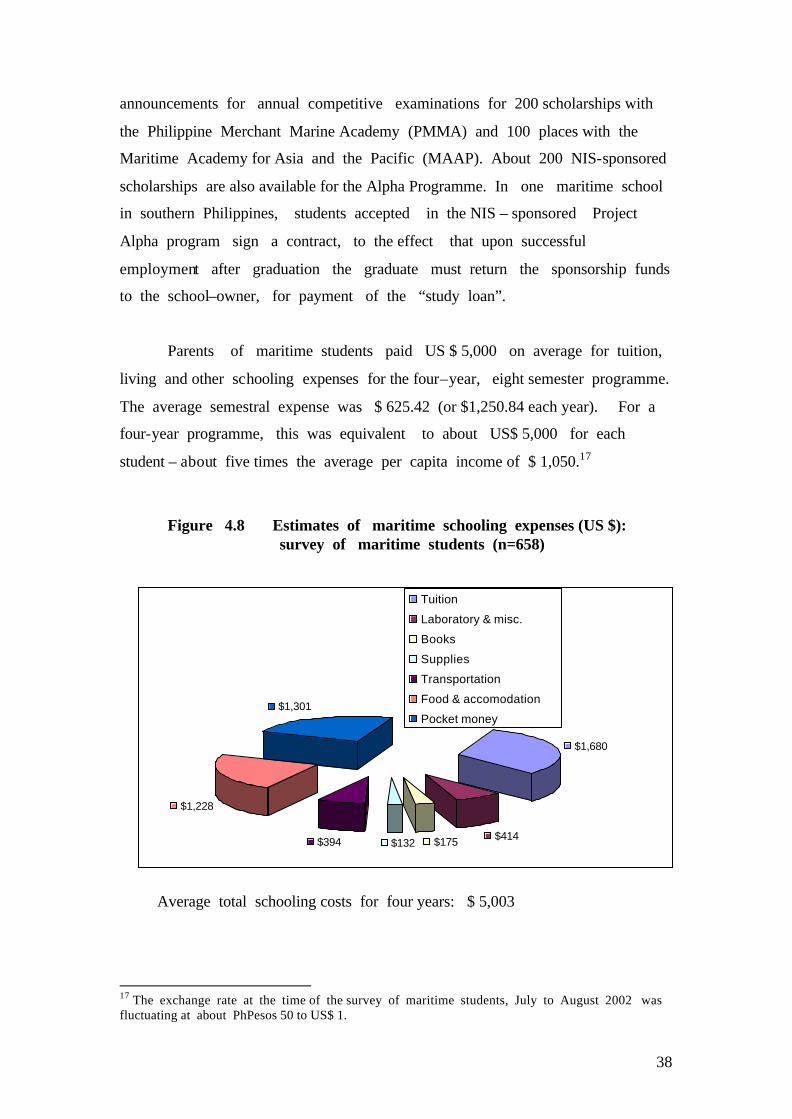
Parents of maritime students paid US $ 5,000 on average for tuition,
living and other schooling expenses for the four–year, eight semester programme.
The average semestral expense was $ 625.42 (or $1,250.84 each year). For a
four-year programme, this was equivalent to about US$ 5,000 for each
student – about five times the average per capita income of $ 1,050.17
Figure 4.8 Estimates of maritime schooling expenses (US $):
survey of maritime students (n=658)
Average total schooling costs for four years: $ 5,003
17 The exchange rate at the time of the survey of maritime students, July to August 2002 was fluctuating at about PhPesos 50 to US$ 1.
$1,680
$414$175$132
$1,228
$1,301
$394
Tuition
Laboratory & misc.
Books
Supplies
Transportation
Food & accomodation
Pocket money
39
The one – year shipboard cadetship period had an equivalent amount
of academic credit, and maritime schools collect tuition fees when students
enrol for cadetship. Shipping firms and crewing agencies however provided a
monthly allowance to cadets while on shipboard training.
In terms of programmes, the marine engineering course costs were
reported to be 13 percent more at $681 per semester, compared to the marine
transport programme that costs Pesos $600 per semester.
Tuition and laboratory costs per semestral term were on average $262
per student. This amount goes to the school as fees, which is 42 percent of
total expenses. Food, transport and other living expenses constitute 58
percent of total expenses of students. There are significant differences in
schooling costs by region. Maritime students in Metro Manila for example pay
40 percent more on average than those in Mindanao.
Students in the government maritime school do not pay tuition fees,
but do pay for their uniforms, living, transport and personal expenses. These
non-tuition costs average $ 285. This is 45 percent of the total average costs
for maritime education paid by students in private maritime schools.
Students benefiting from company sponsorships have paid for their full
costs of education, including tuition, miscellaneous fees, and living allowances
while in school and aboard ship as a cadet. Students report that their
contracts provide from US$ 10,000 to $ 25,000 per student, three to five
times the total average costs borne by ordinary students.
Problems and prospects of Philippine maritime education
Comments from maritime students, and interviews with maritime school
officials and teaching staff identified common problems in Philippine
maritime education. These include:
• Poor screening and lack of common admission standards for students.
40
• Profit-orientation of maritime schools and training centres, with crowded
enrolment (more than 50 students per class), for bigger tuition revenues.
• Lack of scholarship opportunities for underprivileged students.
• Outdated learning facilities and equipment, with overcrowding.
• Lack of teaching staff development programmes and low pay and poor
incentives for teachers and administrators.
• Lack of funding and incentives for advanced research.
• Lack of sustained, quality publications in maritime studies.
• Lack of sustained national and international academic linkages.
A number of merchant marine schools run their educational programs
in a regimented (military) style with emphasis on discipline and a hierarchical
command structure (“learn to lead and command by learning to obey”). Other
schools run similar, if less regimented programmes. A number of teaching
staff and students vehemently complained about the amount of time devoted
to parade ground drills.
An overwhelming number of the maritime students complained about
unventilated crowded classrooms, severely limited opportunities for practical
learning from a bridge simulator and other navigational equipment, and poor
teaching standards. While a few schools have their own training ships, most
rely upon partnerships with shipping firms for opportunities for shipboard
training. Slots for cadetships or shipboard training are extremely limited.
School officials compete with other schools for the placement of their cadets
for shipboard training. A few schools officials said they have to provide
“tuition fee payments” to shipping managers for the training of their cadets.
41
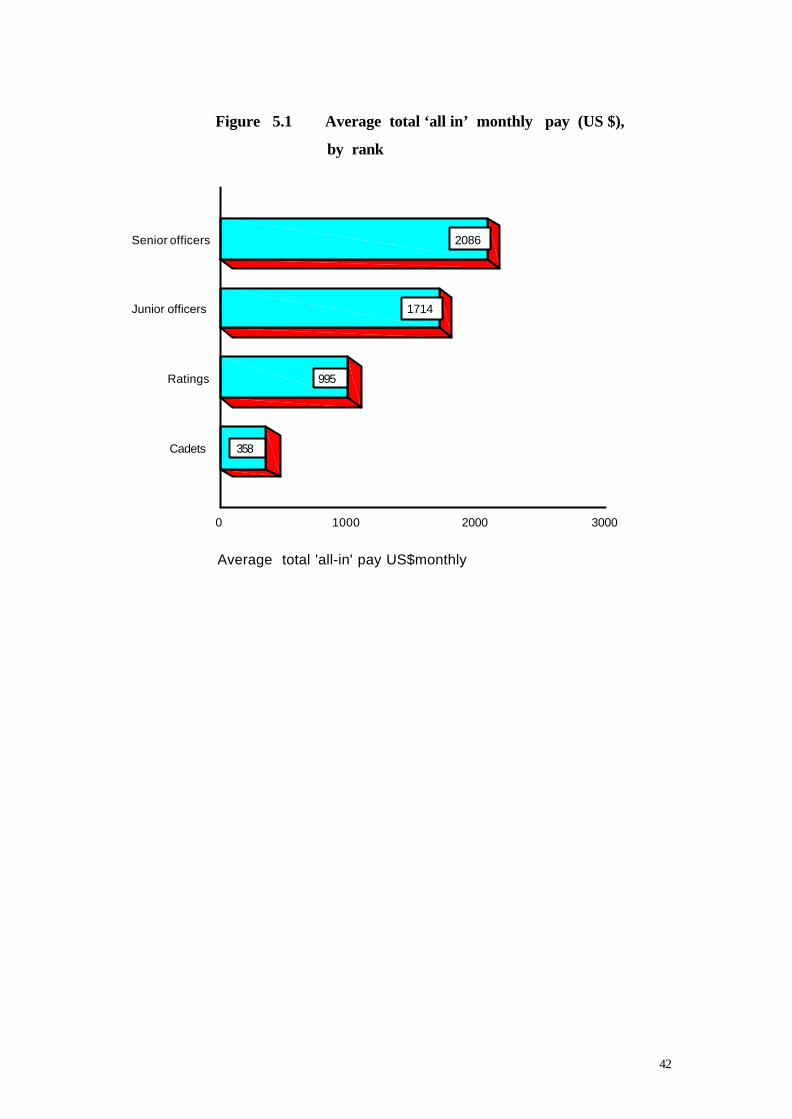
5. Pay variations among Filipino seafarers Pay profile
• Senior officers receive on average $ 2,086.
• Junior officers receive on average $ 1,714.
• A Bs reported an average pay of $1,000 per month (30 percent lower
than the ITF TCC rate of $ 1,300 effective January 2002).
• Basic pay was about half of total pay for all ranks.
Respondents were asked to provide information on basic pay, total
‘all in’ pay and allotments sent to the ir family or designated beneficiary,
and savings in their last voyage. In most seafarer employment contracts,
‘all in’ pay includes variable payments for guaranteed overtime, leave and
other items which depend upon the type of ship and the shipowner manager.
Basic pay as a proportion of total pay averaged at 50 percent. It varied with rank
but not by a large margin. Chief officers reported basic pay as 60 percent of the
total, OS as 50 percent of the total.
The average monthly ‘all in’ pay rates reported by the sample of
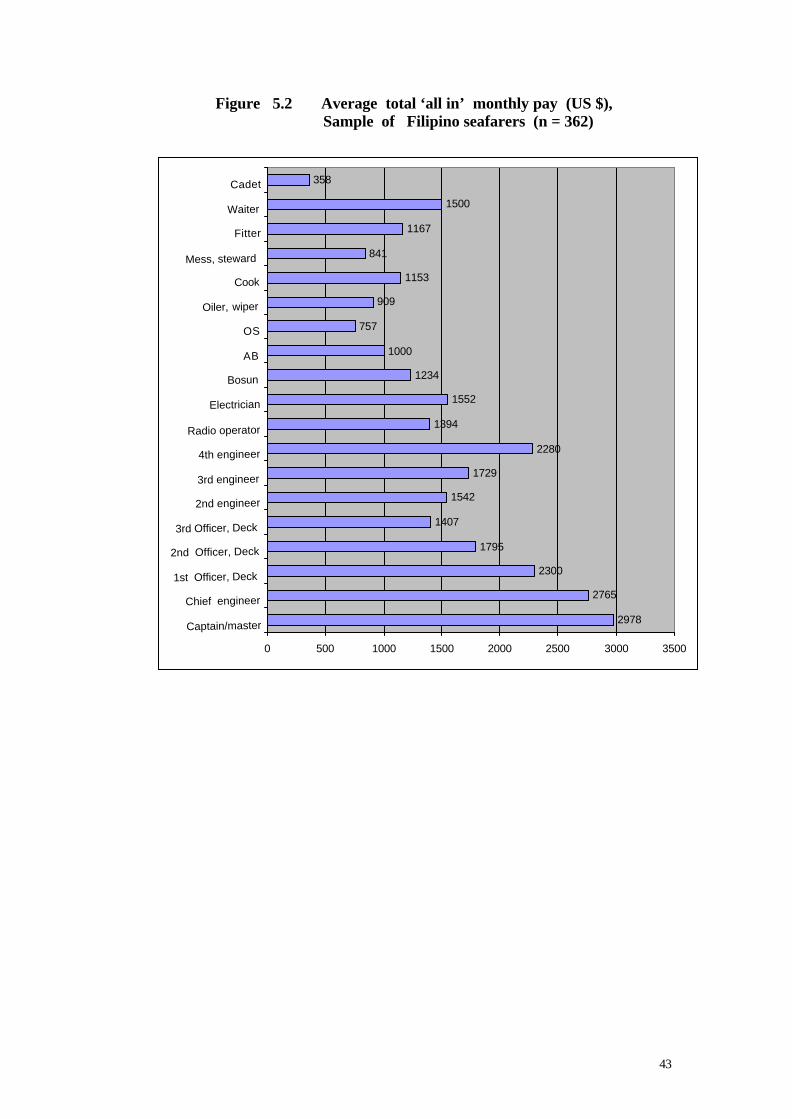
senior and junior officers, in contrast to ratings are presented in Figure 5.1.
Pay rates by job are presented in Figure 5.2, and pay differentials indexed to
those received by A Bs = 1.00 are presented in Figures 5.3. A Bs
reported an average monthly pay of $ 1,000. All ratings reported an
average monthly pay of $ 995. 1
1 All currency is at US$ 1 = PhPesos 53, as of January 15, 2003 which was the end of the survey for Philippine seafarers.
42
Figure 5.1 Average total ‘all in’ monthly pay (US $),
by rank
Senior officers
Junior officers
Ratings
Cadets
Average total 'all-in' pay US$monthly
3000200010000
358
995
1714
2086
43
Figure 5.2 Average total ‘all in’ monthly pay (US $), Sample of Filipino seafarers (n = 362)
2978
2765
2300
1795
1407
1542
1729
2280
1394
1552
1234
1000
757
909
1153
841
1167
1500
358
0 500 1000 1500 2000 2500 3000 3500
Captain/master
Chief engineer
1st Officer, Deck
2nd Officer, Deck
3rd Officer, Deck
2nd engineer
3rd engineer
4th engineer
Radio operator
Electrician
Bosun
AB
OS
Oiler, wiper
Cook
Mess, steward
Fitter
Waiter
Cadet
44
Figure 5.3 Pay differentials by seafarer jobs (AB=1.00)
Sample of Filipino seafarers (n = 362)
Figures represent mean values
Index to AB=1.00 (US$ 1,001)
Captain/masterChief engineer
1st Officer, Deck2nd Officer, Deck3rd Officer, Deck
2nd engineer3rd engineer4th eng ineer
OSAB
BosunOiler, wiper
CookM ess, stewardRadio operator
ElectricianFitter
Cadet
3.53.02.52.01.51.0.50.0
.41.2
1.61.4
.81.2
.91.2
1.0.8
2.31.7
1.51.4
1.82.3
2.83.0
45
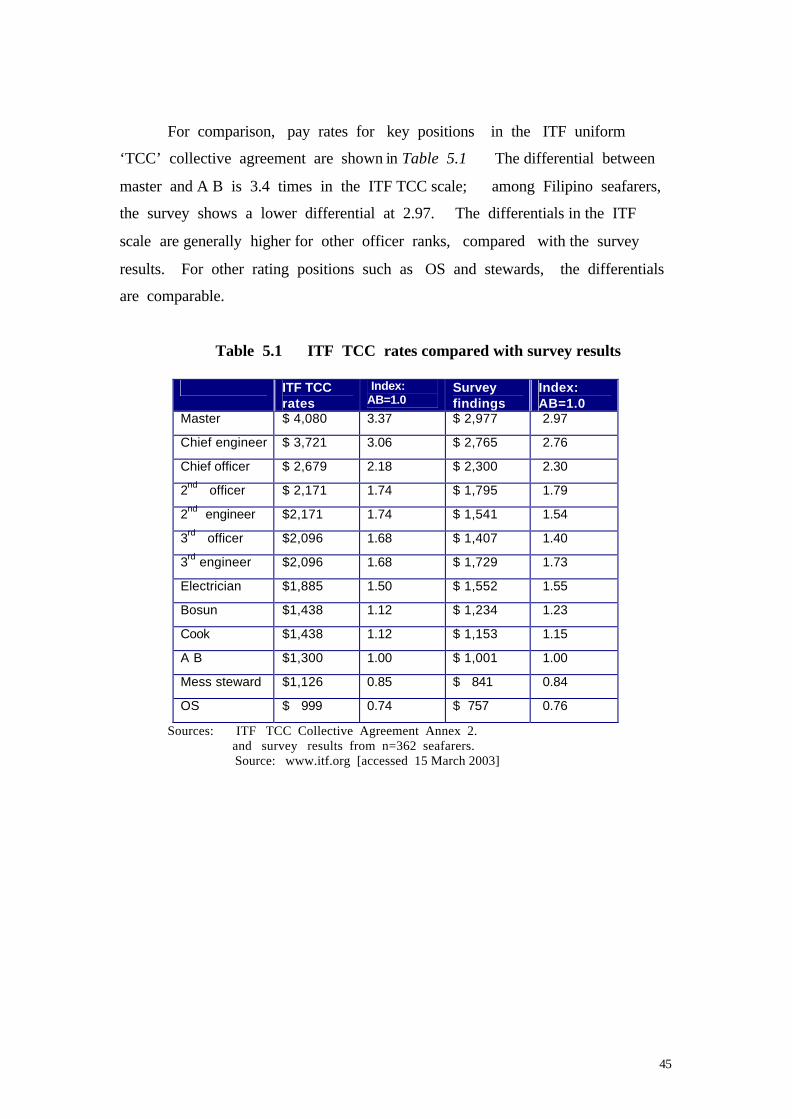
For comparison, pay rates for key positions in the ITF uniform
‘TCC’ collective agreement are shown in Table 5.1 The differential between
master and A B is 3.4 times in the ITF TCC scale; among Filipino seafarers,
the survey shows a lower differential at 2.97. The differentials in the ITF
scale are generally higher for other officer ranks, compared with the survey
results. For other rating positions such as OS and stewards, the differentials
are comparable.
Table 5.1 ITF TCC rates compared with survey results
ITF TCC rates
Index: AB=1.0
Survey findings
Index: AB=1.0
Master $ 4,080 3.37 $ 2,977 2.97
Chief engineer $ 3,721 3.06 $ 2,765 2.76
Chief officer $ 2,679 2.18 $ 2,300 2.30
2nd officer $ 2,171 1.74 $ 1,795 1.79
2nd engineer $2,171 1.74 $ 1,541 1.54
3rd officer $2,096 1.68 $ 1,407 1.40
3rd engineer $2,096 1.68 $ 1,729 1.73
Electrician $1,885 1.50 $ 1,552 1.55
Bosun $1,438 1.12 $ 1,234 1.23
Cook $1,438 1.12 $ 1,153 1.15
A B $1,300 1.00 $ 1,001 1.00
Mess steward $1,126 0.85 $ 841 0.84
OS $ 999 0.74 $ 757 0.76
Sources: ITF TCC Collective Agreement Annex 2. and survey results from n=362 seafarers. Source: www.itf.org [accessed 15 March 2003]
46
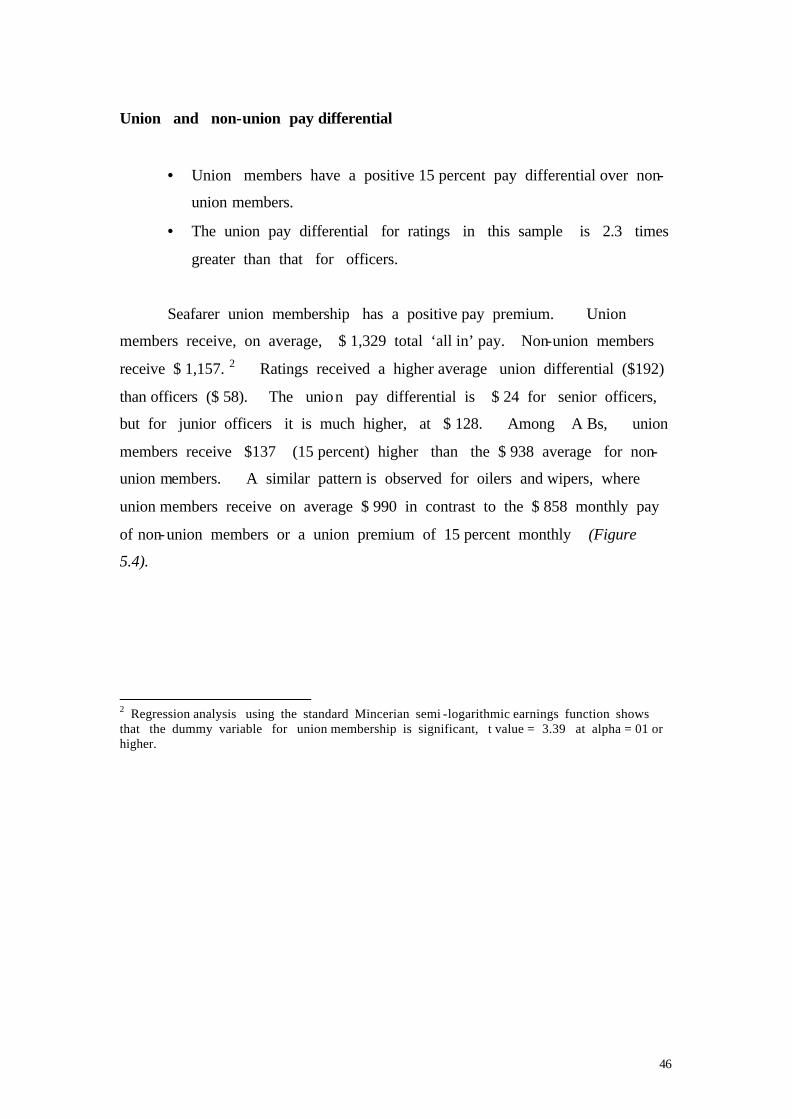
Union and non-union pay differential
• Union members have a positive 15 percent pay differential over non-
union members.
• The union pay differential for ratings in this sample is 2.3 times
greater than that for officers.
Seafarer union membership has a positive pay premium. Union
members receive, on average, $ 1,329 total ‘all in’ pay. Non-union members
receive $ 1,157. 2 Ratings received a higher average union differential ($192)
than officers ($ 58). The union pay differential is $ 24 for senior officers,
but for junior officers it is much higher, at $ 128. Among A Bs, union
members receive $137 (15 percent) higher than the $ 938 average for non-
union members. A similar pattern is observed for oilers and wipers, where
union members receive on average $ 990 in contrast to the $ 858 monthly pay
of non-union members or a union premium of 15 percent monthly (Figure
5.4).
2 Regression analysis using the standard Mincerian semi -logarithmic earnings function shows that the dummy variable for union membership is significant, t value = 3.39 at alpha = 01 or higher.
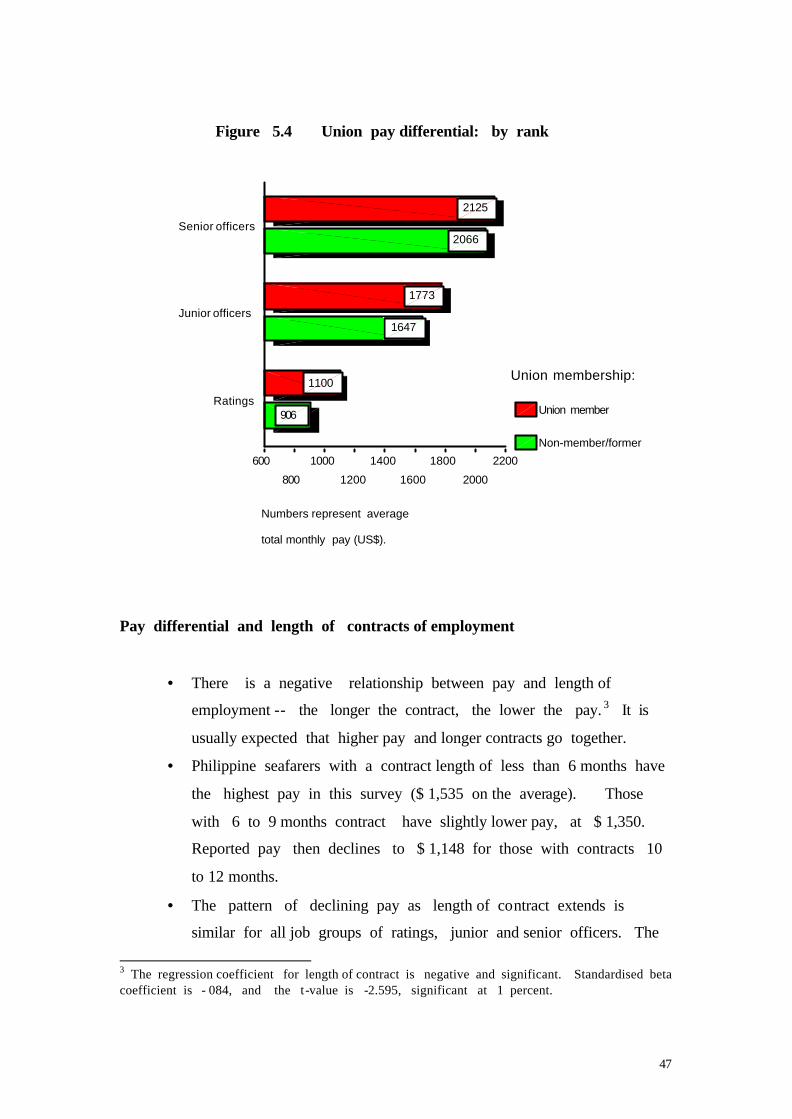
47
Figure 5.4 Union pay differential: by rank
Pay differential and length of contracts of employment
• There is a negative relationship between pay and length of
employment -- the longer the contract, the lower the pay. 3 It is
usually expected that higher pay and longer contracts go together.
• Philippine seafarers with a contract length of less than 6 months have
the highest pay in this survey ($ 1,535 on the average). Those
with 6 to 9 months contract have slightly lower pay, at $ 1,350.
Reported pay then declines to $ 1,148 for those with contracts 10
to 12 months.
• The pattern of declining pay as length of contract extends is
similar for all job groups of ratings, junior and senior officers. The
3 The regression coefficient for length of contract is negative and significant. Standardised beta coefficient is - 084, and the t-value is -2.595, significant at 1 percent.
Numbers represent average
total monthly pay (US$).
Senior officers
Junior officers
Ratings
2200
2000
1800
1600
1400
1200
1000
800
600
Union membership:
Union member
Non-member/former
906
1647
2066
1100
1773
2125
48
differential in pay as the contract gets longer however is sharpest
among junior officers (differential of 125 percent, between those
with more than 12 months contract and those with 6 months or less);
compared to ratings (40 percent differential); and senior officers
(11 percent differential).
• These findings suggest that better employers offer shorter contracts.
Those working longer contracts are trading life quality for earnings
accumulation.
Figure 5.5 Pay by length of contract & by job group
Contract length in months
M ore than 12 months
10 to 12 months
6 to 9 months
Less than 6 months
Mea
n T
otal
'all-
in' p
ay U
S$m
onth
ly
3000
2000
1000
0
Job group
Senior officers
Junior officers
Ratings
49
Pay differentials and education level
• The pay differentials due to schooling among the seafarers in
the survey show some unexpected findings. The average pay of
those who finished a 4-year college maritime course ($ 1,187) is
actually lower -- by 11 percent -- than those who finished only
a 2 or 3 year associate nautical or marine engineering course
($ 1,315).
• The distorted pay differential by education level is most
apparent for junior officers and ratings. The average pay of
junior officers who did not finish a college maritime course ($
1,924) is higher -- by 20 percent -- than those who finished a
college maritime course ( average $ 1,602).
• Distortion in pay does not apply to senior officers. College graduates
have slightly higher average pay (US$ 2,228) than those who did
not ($ 2,032).
• The distortion is most pronounced among the ratings. The
average pay of ratings that finished only a high school education
($ 1,112) is higher -- by 14 percent --- than those who finished
a college maritime course. The average pay of ratings
completing a pre-college associate in nautical or marine engineering
course ($ 995) is slightly lower -- by 2 percent -- compared with
those finishing a college maritime course.
Figures 5.6 & 5.7 illustrate the evidence for the distortion in pay by
level of education among Philippine seafarers. Industry officials think this
phenomenon is due to the older age profile of seafarers in the sample.4
4 Comments expressed by industry leaders in a presentation with the Philippine Seafarers Promotion Council (PSPC), 23 July 2003, in Manila.
50
Years of schooling and the costs involved represent investment involved
in producing a seafarer with basic qualifications. It could be expected that
seafarers with a higher education level would earn more. However, seafarers
completing college courses, but unable to find jobs as officers take jobs as
ratings and it is this which explains apparent distortions in pay differentials by
educational level. The pay profile with respect to years of work experience
shows more significant differentials. These distortions may also indicate
substantial problems in the Philippine maritime educational system, where
commercially-run schools are necessarily focused on revenue rather than quality of
output where the potential supply of qualified labour greatly exceeds the demand for
it.
Figure 5.6 Pay by education level & by job group
Senior officers
Junior officers
Ratings
2400
2200
2000
1800
1600
1400
1200
1000
800
Education level
High school graduat
Associate nautical/M
Some college
BSMT, MarE, college
1602
2228
1026
999
1924
2032
1112
52
Chapter 6. Hiring, recruitment and shipboard work Crewing agencies and seafarer recruitment Seafarers formally enter the labour market through crewing agencies.
Where shipping company-owned agencies are almost invariably dedicated to crews
for their own ships, the great majority of agencies, including the very largest, serve
many ‘owners and managers’. Sources of labour market information on vacancies
or new opportunities include relatives, friends, classmates, school officials,
and former fellow crew. Seafarers visit crewing agencies and the union
hiring hall of AMOSUP for the latest job postings and announcements. The Rizal
Park seafarer labour market in Manila is also a popular venue where seafarers
effectively verify information about working conditions, policies as well as
practices by crewing agencies and shipping firms.
The POEA website (www.poea.gov.ph) shows an accredited list of
417 crewing agencies, involved in recruitment, processing and deployment of
seafarers. A list of the larger crewing agencies and the number of
seafarers they processed in 2001 are shown in Figure 6.1. In 2002,
and in recognition of their importance to the employment of overseas workers,
the government of the Philippines awarded presidential honours to 20
crewing agencies deploying the largest numbers of seafarers. There were also
presidential awards for “excellence”, exemplary welfare programs and services
in providing “moral and spiritual values; family services, human resource
development, assistance in providing re- integration, and employee relations”
(Box 6.1).
Seafarers recruited by wholly owned agencies are much more likely to
experience continuity of employment and not suffer age discrimination. It is
worth noting that these agencies feature prominently in the awards of presidential
honours.
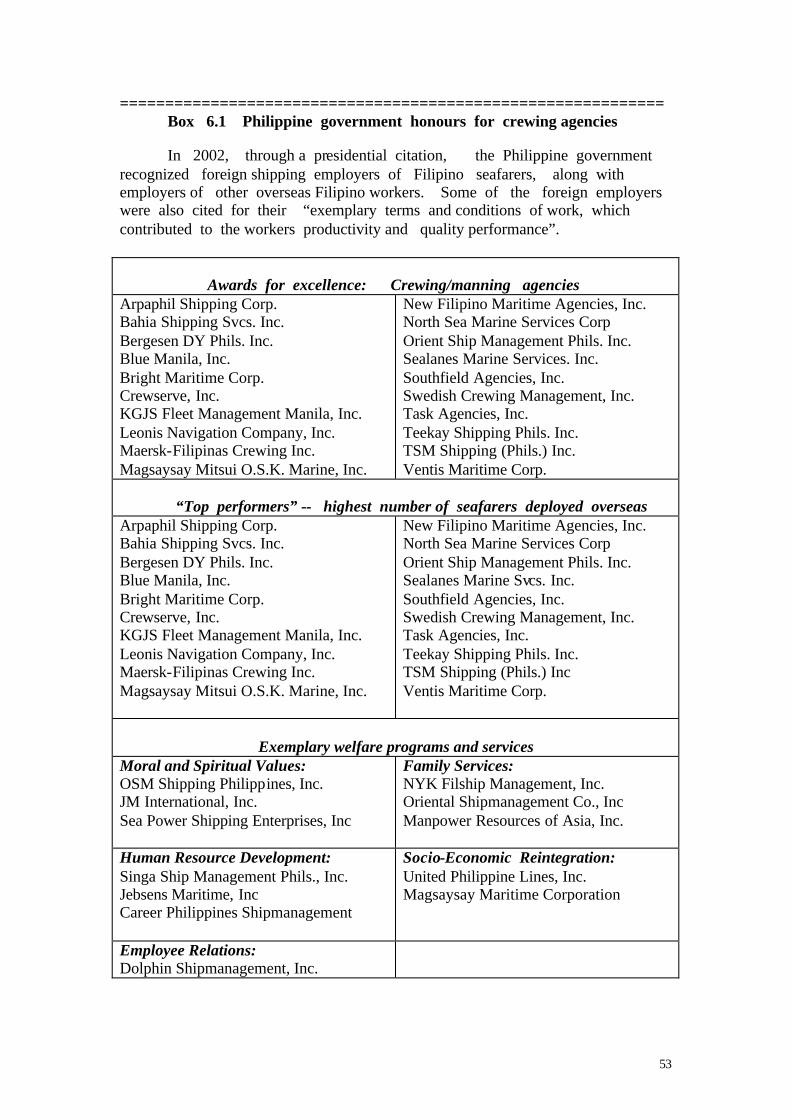
53
============================================================ Box 6.1 Philippine government honours for crewing agencies
In 2002, through a presidential citation, the Philippine government recognized foreign shipping employers of Filipino seafarers, along with employers of other overseas Filipino workers. Some of the foreign employers were also cited for their “exemplary terms and conditions of work, which contributed to the workers productivity and quality performance”. Awards for excellence: Crewing/manning agencies Arpaphil Shipping Corp. Bahia Shipping Svcs. Inc. Bergesen DY Phils. Inc. Blue Manila, Inc. Bright Maritime Corp. Crewserve, Inc. KGJS Fleet Management Manila, Inc. Leonis Navigation Company, Inc. Maersk-Filipinas Crewing Inc. Magsaysay Mitsui O.S.K. Marine, Inc.
New Filipino Maritime Agencies, Inc. North Sea Marine Services Corp Orient Ship Management Phils. Inc. Sealanes Marine Services. Inc. Southfield Agencies, Inc. Swedish Crewing Management, Inc. Task Agencies, Inc. Teekay Shipping Phils. Inc. TSM Shipping (Phils.) Inc. Ventis Maritime Corp.
“Top performers” -- highest number of seafarers deployed overseas Arpaphil Shipping Corp. Bahia Shipping Svcs. Inc. Bergesen DY Phils. Inc. Blue Manila, Inc. Bright Maritime Corp. Crewserve, Inc. KGJS Fleet Management Manila, Inc. Leonis Navigation Company, Inc. Maersk-Filipinas Crewing Inc. Magsaysay Mitsui O.S.K. Marine, Inc.
New Filipino Maritime Agencies, Inc. North Sea Marine Services Corp Orient Ship Management Phils. Inc. Sealanes Marine Svcs. Inc. Southfield Agencies, Inc. Swedish Crewing Management, Inc. Task Agencies, Inc. Teekay Shipping Phils. Inc. TSM Shipping (Phils.) Inc Ventis Maritime Corp.
Exemplary welfare programs and services
Moral and Spiritual Values: OSM Shipping Philippines, Inc. JM International, Inc. Sea Power Shipping Enterprises, Inc
Family Services: NYK Filship Management, Inc. Oriental Shipmanagement Co., Inc Manpower Resources of Asia, Inc.
Human Resource Development: Singa Ship Management Phils., Inc. Jebsens Maritime, Inc Career Philippines Shipmanagement
Socio-Economic Reintegration: United Philippine Lines, Inc. Magsaysay Maritime Corporation
Employee Relations: Dolphin Shipmanagement, Inc.
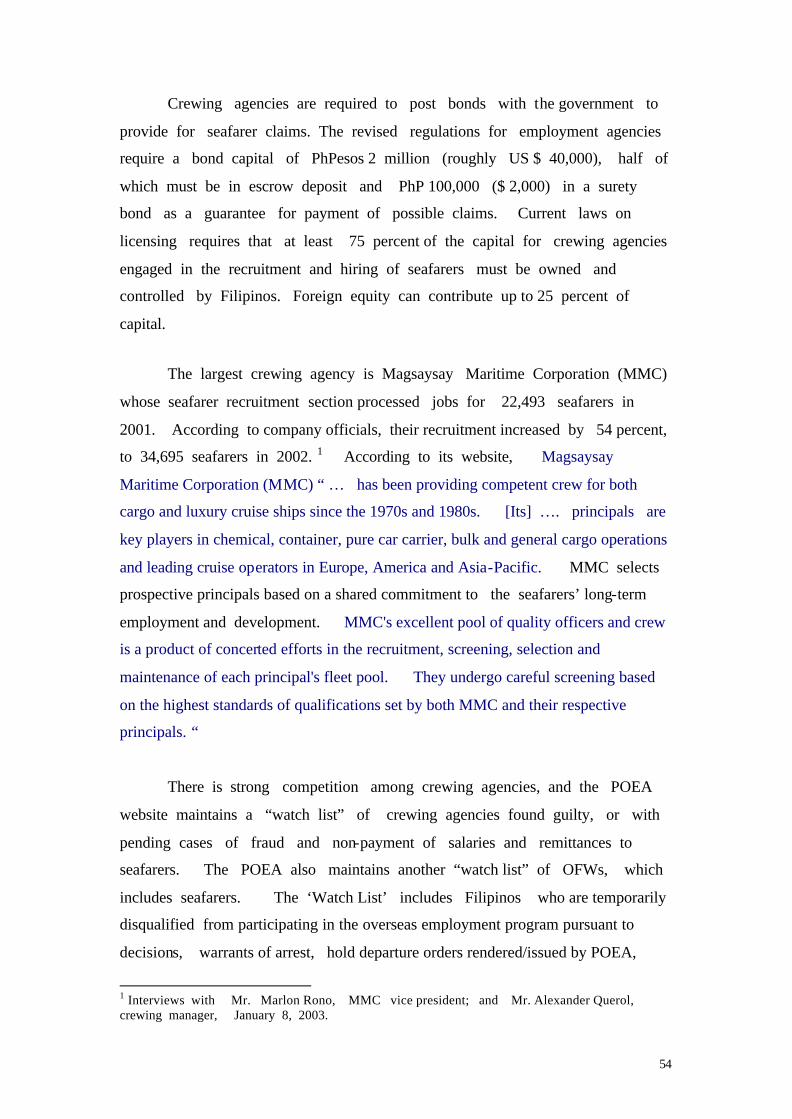
54
Crewing agencies are required to post bonds with the government to
provide for seafarer claims. The revised regulations for employment agencies
require a bond capital of PhPesos 2 million (roughly US $ 40,000), half of
which must be in escrow deposit and PhP 100,000 ($ 2,000) in a surety
bond as a guarantee for payment of possible claims. Current laws on
licensing requires that at least 75 percent of the capital for crewing agencies
engaged in the recruitment and hiring of seafarers must be owned and
controlled by Filipinos. Foreign equity can contribute up to 25 percent of
capital.
The largest crewing agency is Magsaysay Maritime Corporation (MMC)
whose seafarer recruitment section processed jobs for 22,493 seafarers in
2001. According to company officials, their recruitment increased by 54 percent,
to 34,695 seafarers in 2002. 1 According to its website, Magsaysay
Maritime Corporation (MMC) “ … has been providing competent crew for both
cargo and luxury cruise ships since the 1970s and 1980s. [Its] …. principals are
key players in chemical, container, pure car carrier, bulk and general cargo operations
and leading cruise operators in Europe, America and Asia-Pacific. MMC selects
prospective principals based on a shared commitment to the seafarers’ long-term
employment and development. MMC's excellent pool of quality officers and crew
is a product of concerted efforts in the recruitment, screening, selection and
maintenance of each principal's fleet pool. They undergo careful screening based
on the highest standards of qualifications set by both MMC and their respective
principals. “
There is strong competition among crewing agencies, and the POEA
website maintains a “watch list” of crewing agencies found guilty, or with
pending cases of fraud and non-payment of salaries and remittances to
seafarers. The POEA also maintains another “watch list” of OFWs, which
includes seafarers. The ‘Watch List’ includes Filipinos who are temporarily
disqualified from participating in the overseas employment program pursuant to
decisions, warrants of arrest, hold departure orders rendered/issued by POEA,
1 Interviews with Mr. Marlon Rono, MMC vice president; and Mr. Alexander Querol, crewing manager, January 8, 2003.
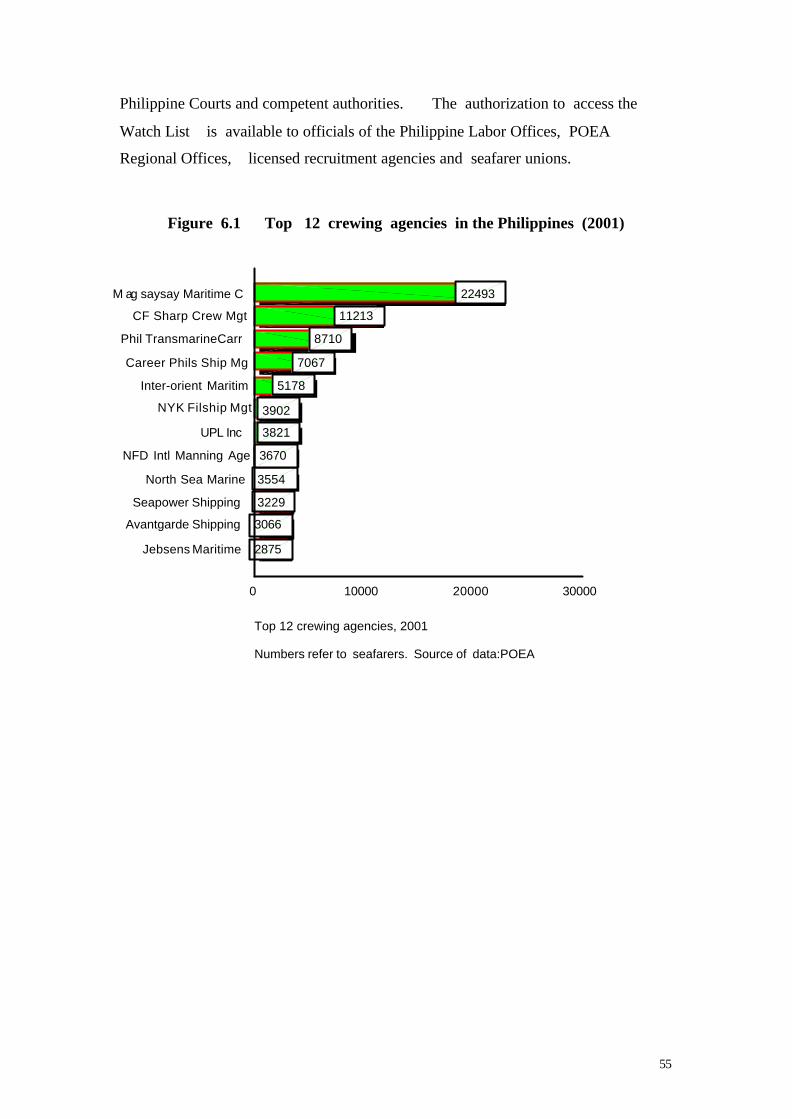
55
Philippine Courts and competent authorities. The authorization to access the
Watch List is available to officials of the Philippine Labor Offices, POEA
Regional Offices, licensed recruitment agencies and seafarer unions.
Figure 6.1 Top 12 crewing agencies in the Philippines (2001)
Top 12 crewing agencies, 2001
Numbers refer to seafarers. Source of data:POEA
M ag saysay Maritime C
CF Sharp Crew Mgt
Phil TransmarineCarr
Career Phils Ship Mg
Inter-orient Maritim
NYK Filship Mgt
UPL Inc
NFD Intl Manning Age
North Sea Marine
Seapower Shipping
Avantgarde Shipping
Jebsens Maritime
3000020000100000
2875
3066
3229
3554
3670
3821
3902
5178
7067
8710
11213
22493
56
The Rizal Park Labour Market
Philippine seafarers converge in Rizal Park, along Kalaw Street , which is
in front of the largest crewing agency, Magsaysay Maritime Corporation. It is
also within walking distance of the offices of many other crewing agencies,
the Department of Labour and Employment, the seafarer union AMOSUP, and
the government agency in charge of seafarer registration (MARINA).
On any weekday about a thousand seafarers gather in Rizal Park for an
exchange of the latest information on job prospects. Some have recently
disembarked, but many are unemployed. Crewing agents with urgent
demands from shipping companies with difficult-to-find skills and competencies
compete with each other in attracting qualified officers and ratings. Some
seafarers with existing job contracts and waiting to board their ships are on the
lookout for better prospects, signing in with new agents who offer better pay
and working conditions.
‘Runners’ of crewing agents -- mostly young cadet ratings on
apprenticeship duty with the recruitment outfit -- go around Rizal Park
among the seafarers, with small posters on the latest urgent demands for
crewing from shipping companies all over the world. Maritime students – some
finishing their college studies, some just graduated -- said that many of them
serve in crewing agencies, work just like other staff but are unpaid. The
young runners compete with each other in inviting prospective seafarer
applicants to sign up for an application form and possibly, a call for an
interview. Runners said they are required to have a good number (at least
five or more) of applicants per job position before reporting back to the
office.
Most of the seafarers in Rizal Park are from central and southern
Philippines -- Ilonggo speaking seafarers from Iloilo and Negros islands, Cebuano
speaking seafarers from Cebu and Bohol islands, and both Ilonggo and
Bisaya speakers from Mindanao island. Seafarers gather and exchange
information with each other by speaking in their own ethnic language.
57
Two seafarers start a conversation, others overhear and join in, and soon a
small group is actively exchanging labour market information. Distinct small
groups could be observed for the Ilonggos, the Bisayas, and occasionally, the
Ilocanos and Pangalatoks (Pangasinan).
The seafarers’ street has no public lavatories and no shelter. When it
rains, seafarers rush to nearby buildings with awnings over the sidewalks.
Seafarers said that there were efforts to provide sidewalk kiosks and shelter
`from rain, but Rizal Park authorities disapproved the proposal on grounds that
it will provide a precedent with negative consequences for the whole Park.
Rizal Park serves mostly the lower segments of the global labour
market for seafarers, and is a good source of applicants to ensure choice
of seafarers for emergency crewing. Agents from the top crewing
industries are seen sometimes. Crewing managers said they do send their
agents to the Park in case there is difficulty in recruiting a seafarer for a
particularly urgent demand. Many officers who get recruited in Rizal Park are
those sought by shipping managers whose specifications for experience are
urgent, but are not easily available in agencies’ reserve crew lists. This is
especially true for gas or chemical tanker engineers, whose specifications for
required experience are not easily available. Some crewing agencies prepare a
list of available seafarers to respond to urgent demands from shipping employers.
This practice is known as “manpower pooling”, but some crewing agencies
charge fees from seafarers for their names to be included in the list. Many
agencies recruit in Rizal Park for chemical or gas carriers -- which seafarers say
are dangerous ships, which they prefer to avoid.
Due to the Park’s open and informal nature, unscrupulous crewing
agents and impostors cheat seafarers desperate for jobs. There are “fixers”
-- people who offer “assistance” (in return for payment), for seafarers to
comply with the requirements for certificates of competency -- in effect, an
offer for a fraudulent certificate. They usually connive with low-paid
processing clerks and staff in government agencies involved in producing
employment papers for seafarers, complete with signatures. Fixers offer
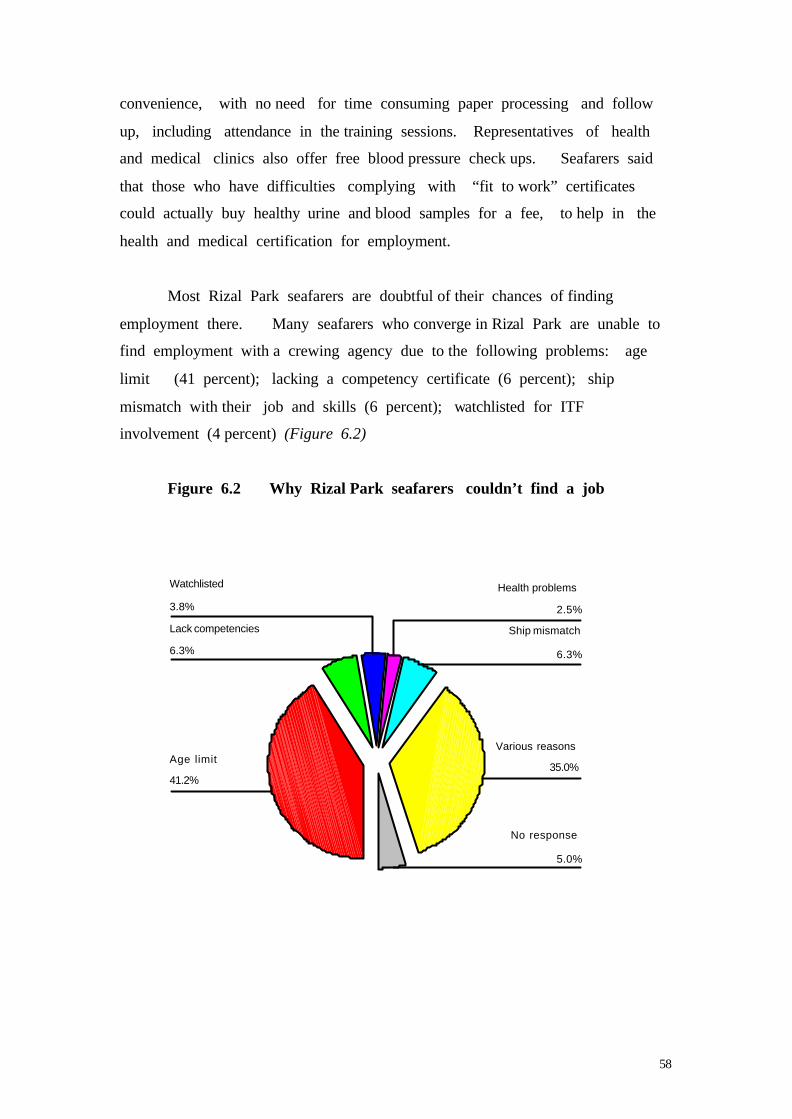
58
convenience, with no need for time consuming paper processing and follow
up, including attendance in the training sessions. Representatives of health
and medical clinics also offer free blood pressure check ups. Seafarers said
that those who have difficulties complying with “fit to work” certificates
could actually buy healthy urine and blood samples for a fee, to help in the
health and medical certification for employment.
Most Rizal Park seafarers are doubtful of their chances of finding
employment there. Many seafarers who converge in Rizal Park are unable to
find employment with a crewing agency due to the following problems: age
limit (41 percent); lacking a competency certificate (6 percent); ship
mismatch with their job and skills (6 percent); watchlisted for ITF
involvement (4 percent) (Figure 6.2)
Figure 6.2 Why Rizal Park seafarers couldn’t find a job
5.0%
35.0%
6.3%
2.5%3.8%
6.3%
41.2%
No response
Various reasons
Ship mismatch
Health problemsWatchlisted
Lack competencies
Age limit
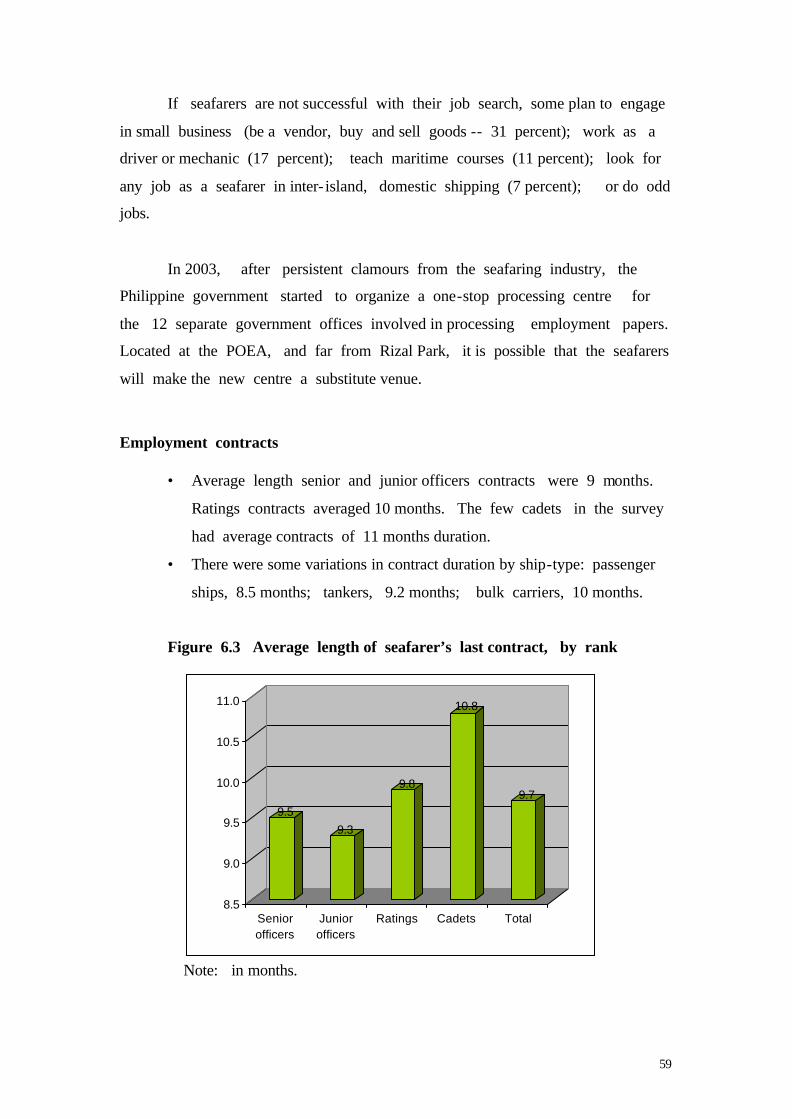
59
If seafarers are not successful with their job search, some plan to engage
in small business (be a vendor, buy and sell goods -- 31 percent); work as a
driver or mechanic (17 percent); teach maritime courses (11 percent); look for
any job as a seafarer in inter- island, domestic shipping (7 percent); or do odd
jobs.
In 2003, after persistent clamours from the seafaring industry, the
Philippine government started to organize a one-stop processing centre for
the 12 separate government offices involved in processing employment papers.
Located at the POEA, and far from Rizal Park, it is possible that the seafarers
will make the new centre a substitute venue.
Employment contracts
• Average length senior and junior officers contracts were 9 months.
Ratings contracts averaged 10 months. The few cadets in the survey
had average contracts of 11 months duration.
• There were some variations in contract duration by ship-type: passenger
ships, 8.5 months; tankers, 9.2 months; bulk carriers, 10 months.
Figure 6.3 Average length of seafarer’s last contract, by rank
Note: in months.
9.59.3
9.8
10.8
9.7
8.5
9.0
9.5
10.0
10.5
11.0
Seniorofficers
Juniorofficers
Ratings Cadets Total
60
Job title, length of employment at sea, and pay are specified in
seafarers’ employment documents. Contract extensions are however possible,
since relatively few ships work to schedules. Thus, actual lengths of
service aboard often differ from those stated on employment contracts. The
POEA standard employment contract for seafarers specifies that work at sea
should not be longer than 12 months. A recent Supreme Court decision
confirmed that seafarers under Philippine labour laws are subjects of fixed-term
contracts and, continuity notwithstanding, cannot be regarded as regular or
permanent employees (Box 6.2).
============================================================
Box 6.2 Precedent court decision on employment of seafarers In 1989, Douglas Millares and Rogelio Lagda were chief engineers who
requested for optional retirement under their employers’ Consecutive Enlistment Incentive Plan (CEIP), after 20 years of service. Their employer, Esso International, denied their request on the following grounds: (a) they are employed on a contractual basis; (b) their contracts did not provide for retirement before the age of 60 years; (c) they did not comply with the requirement to submit a written advice to the company of their intention to terminate employment within thirty days from the last disembarkation date. The employer further considered them absent without leave, and dropped them from the rolls. Millares and Lagda filed a complaint with the POEA, for illegal dismissal and non-payment of employee benefits. The POEA dismissed the complaint, and Millares and Lagda appealed to the NLRC who sustained the POEA decision.
The Supreme Court recognized both seafarers as regular employees
entitled to optional retirement and separation benefits. The Supreme Court reversed the NLRC decision, and ordered: (1) reinstatement of Millares and Lagda to their former positions; (2) if reinstatement is not possible, payment of separation pay equivalent to one month’s salary for every year of service; and (3) pay the petitioners 100 percent of their credited contributions under the Consecutive Enlistment Incentive Plan (CEIP). (Millares and Lagda vs. NLRC and Trans-Global Maritime Agency, Inc. and Esso International Shipping Co., Ltd.; GR 123619, March 14, 2000). The case was decided after 10 years, including appeals. However, the shipping employer and the Filipino Association for Mariners Employment, Inc. (FAME), the umbrella organisation for crewing agencies, moved for reconsideration. Subsequently, the Supreme Court reversed itself, and decided that seafarers indeed are fixed term contractual employees. The Court recognized the validity of fixed term employment contracts, agreed upon freely and voluntarily by seafarers and
61
their employers. The employers were ordered to pay the seafarers their total credited contributions under the retirement plan.
Source: Philippine Supreme Court, Millares and Lagda vs. NLRC and
Trans-Global Maritime Agency, Inc. and Esso International Shipping Co., Ltd.; GR 110524, July 29, 2002).
============================================================
Under Philippine labour law (Article 280 of the Labour Code),
employees are considered regular if they are continuously hired or employed
after a probationary period of usually six (6) months. Their employment is
considered “necessary or desirable in the usual business or trade” of the
employer. The law however provides for exemptions in cases of fixed term,
“for specific projects or undertaking the completion of which has been
determined at the time of the engagement of the employee, or w here the work or
service to be employed is seasonal in nature”. The POEA’s Standard
Employment Contract (Part I, Section C) for seafarers further provides that
“employment shall be for a fixed period but in no case to exceed 12 months,
and shall be stated in the Crew Contract. Any extension of the Contract period
shall be subject to the mutual consent of the parties”. Seafarers however are
eligible for rehiring, subject to qualifications, after a period of rest onshore.
Job search
• Job search includes the time spent applying, processing papers
for a new employment contract, and the waiting time to board the
ship. Seafarers spent an average 7.2 months in job search. Senior
officers spent 7.3 months, junior officers slightly less, at 6.9
months and ratings 7.3 months. Cadets had the longest job search
period at 13 months.
Coastal and inter-island work experience
• Many seafarers have work experience and training in domestic
shipping (41 percent), before joining the global labour market.
Others had work experience in fishing boats and training ships (9
percent). Many seafarers started in domestic ships as deckboys or
62
cadets (18 percent); as mess stewards (4 percent) and as oilers or
wipers (5 percent).
• In between jobs in the global labour market, only 8.5 percent of
seafarers had shore-based jobs. Few seafarers said they look for
land-based jobs, in between jobs at sea.
Did the seafarer’s job change when moving to foreign vessels? Most
seafarers (81.3 percent) said that they had an upward career movement
when moving to employment in foreign vessels. Only 15 percent (mostly
ratings) said they had the same job level or job group in both their foreign
and domestic ships.
Experience with mixed nationality crews
• Seafarers in the survey said that they work in ships with
multinational crews, but mostly with many Filipinos aboard. A
few said that full Filipino crews are common in the Asian routes.
• Filipino seafarers said they work mostly with vessels commanded by
captains or masters from Europe (27 percent); Japan (14 percent) or
the Philippines (14 percent); and Greece (13 percent)
• Chief mates and chief engineers were reported mostly from the
Philippines (22 percent); Western Europe (17 percent); Eastern
Europe (Croatia, Ukraine, Poland, Russia), 9 percent; Japan (9
percent).
• Junior officers were reported to be mostly from the Philippines (72
percent), India (5.5 percent); Baltic states (4.6 percent).
• Seafarers also said that the principal nationality of ratings in their
last ship were Filipinos (88 percent). Seafarers also work with
ratings that were of Asian nationality (2 percent -- from India,
Pakistan, China, and Korea).
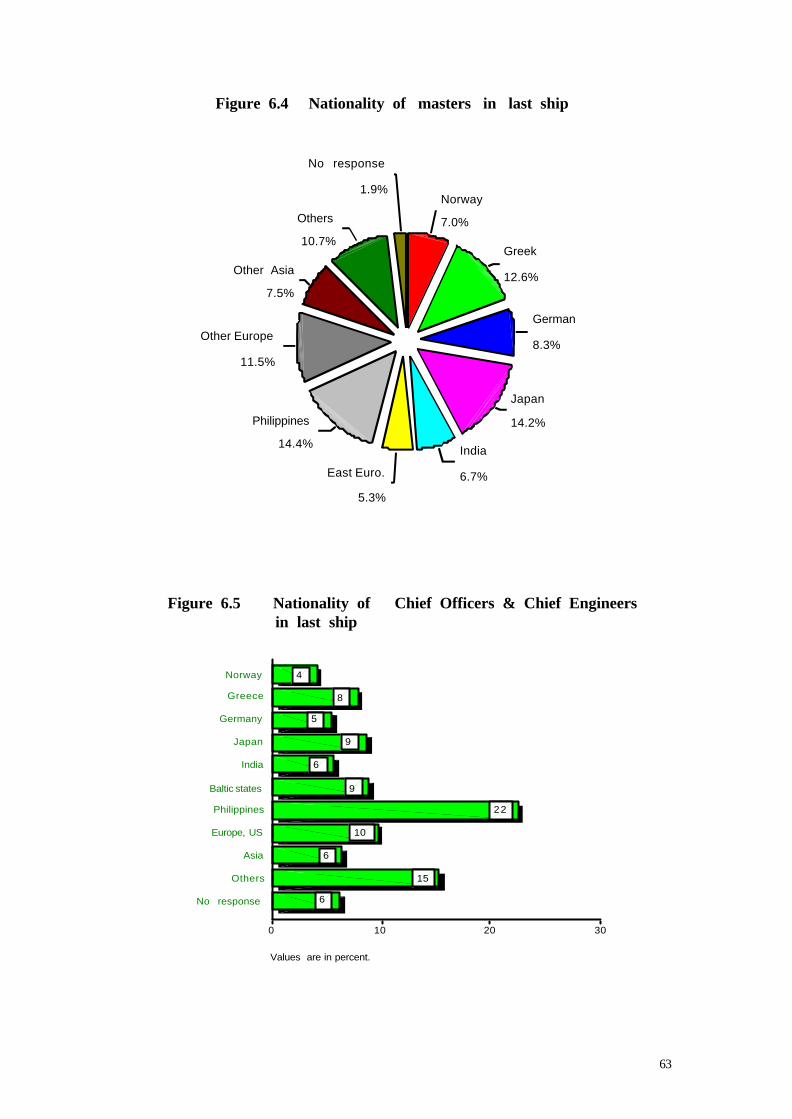
63
Figure 6.4 Nationality of masters in last ship
Figure 6.5 Nationality of Chief Officers & Chief Engineers in last ship
Values are in percent.
Norway
Greece
Germany
Japan
India
Baltic states
Philippines
Europe, US
Asia
Others
No response
3020100
6
15
6
10
22
9
6
9
5
8
4
1.9%
10.7%
7.5%
11.5%
14.4%
5.3%
6.7%
14.2%
8.3%
12.6%
7.0%
No response
Others
Other Asia
Other Europe
Philippines
East Euro.
India
Japan
German
Greek
Norway
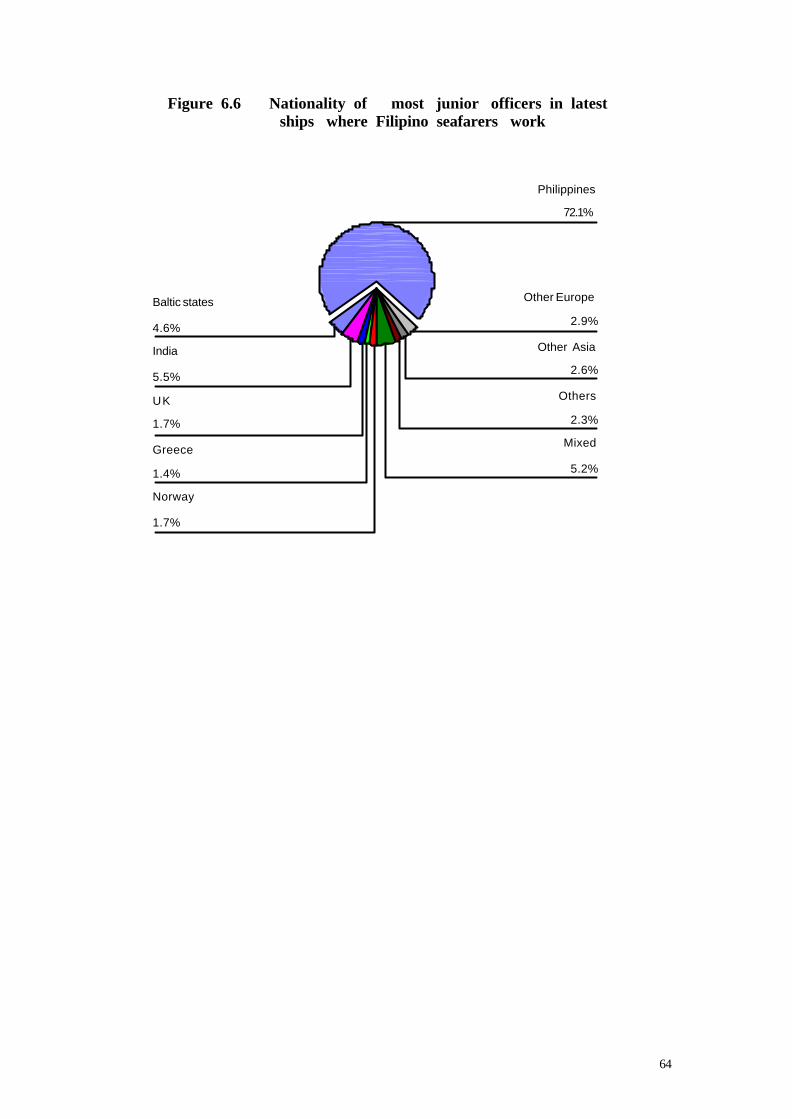
64
Figure 6.6 Nationality of most junior officers in latest ships where Filipino seafarers work
5.2%
2.3%
2.6%
2.9%
72.1%
4.6%
5.5%
1.7%
1.4%
1.7%
Mixed
Others
Other Asia
Other Europe
Philippines
Baltic states
India
UK
Greece
Norway
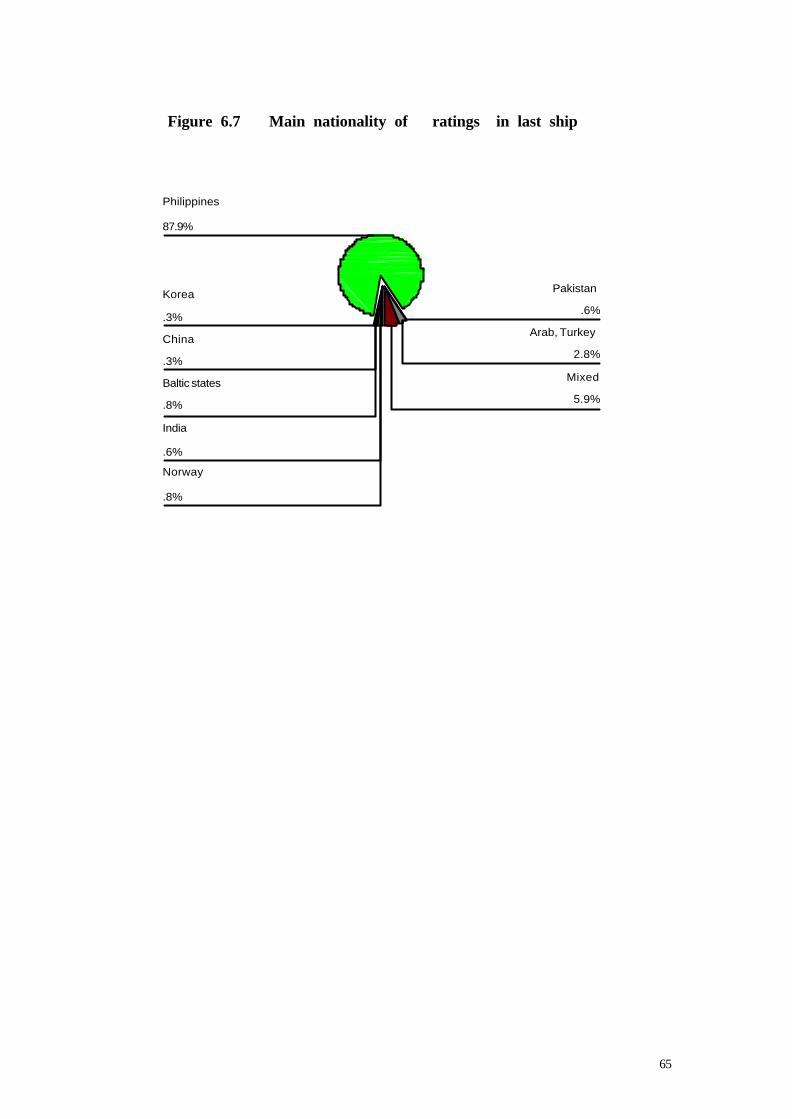
65
Figure 6.7 Main nationality of ratings in last ship
5.9%
2.8%
.6%
87.9%
.3%
.3%
.8%
.6%
.8%
Mixed
Arab, Turkey
Pakistan
Philippines
Korea
China
Baltic states
India
Norway
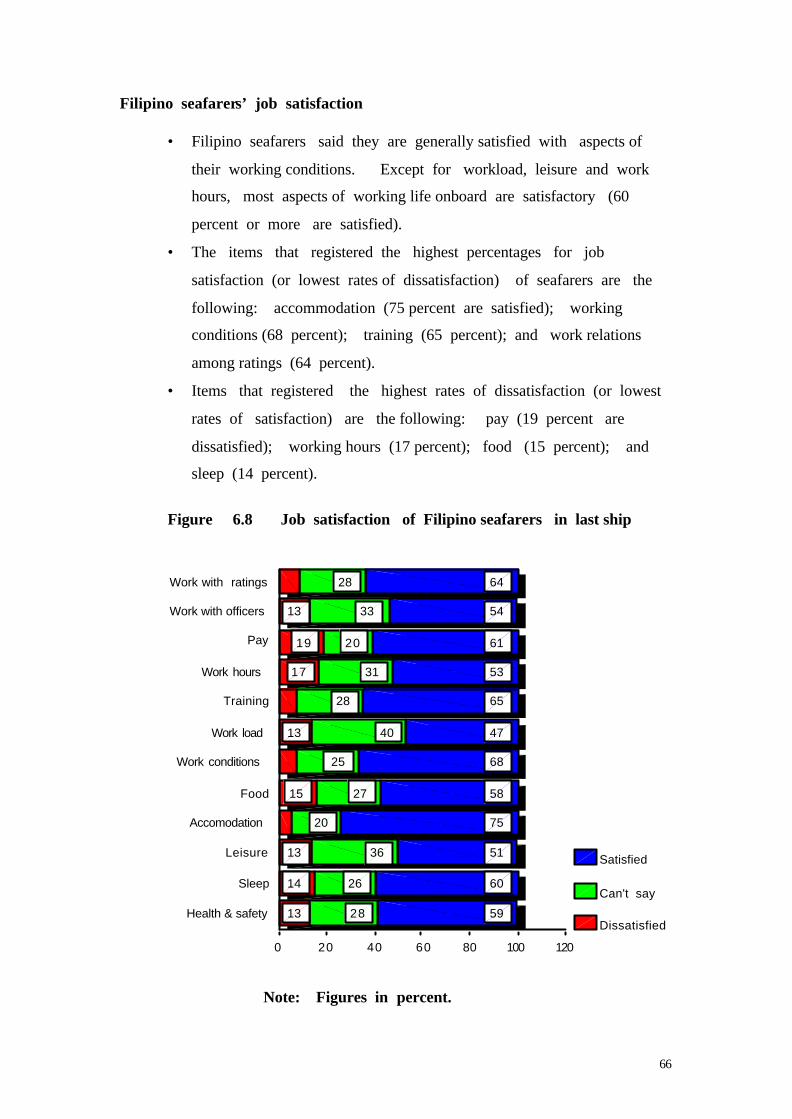
66
Filipino seafarers’ job satisfaction
• Filipino seafarers said they are generally satisfied with aspects of
their working conditions. Except for workload, leisure and work
hours, most aspects of working life onboard are satisfactory (60
percent or more are satisfied).
• The items that registered the highest percentages for job
satisfaction (or lowest rates of dissatisfaction) of seafarers are the
following: accommodation (75 percent are satisfied); working
conditions (68 percent); training (65 percent); and work relations
among ratings (64 percent).
• Items that registered the highest rates of dissatisfaction (or lowest
rates of satisfaction) are the following: pay (19 percent are
dissatisfied); working hours (17 percent); food (15 percent); and
sleep (14 percent).
Figure 6.8 Job satisfaction of Filipino seafarers in last ship
Note: Figures in percent.
Work with ratings
Work with officers
Pay
Work hours
Training
Work load
Work conditions
Food
Accomodation
Leisure
Sleep
Health & safety
120100806040200
Satisfied
Can't say
Dissatisfied59
60
51
75
58
68
47
65
53
61
54
64
28
26
36
20
27
25
40
28
31
20
33
28
13
14
13
15
13
17
19
13
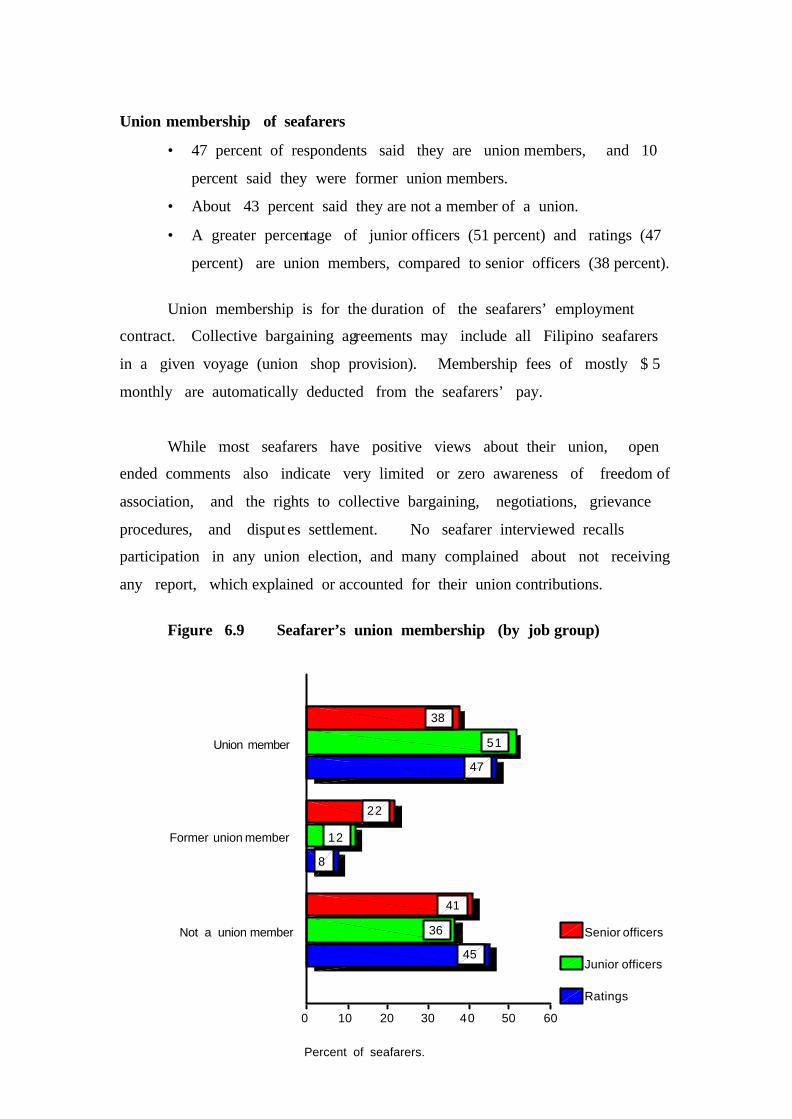
67
Union membership of seafarers
• 47 percent of respondents said they are union members, and 10
percent said they were former union members.
• About 43 percent said they are not a member of a union.
• A greater percentage of junior officers (51 percent) and ratings (47
percent) are union members, compared to senior officers (38 percent).
Union membership is for the duration of the seafarers’ employment
contract. Collective bargaining agreements may include all Filipino seafarers
in a given voyage (union shop provision). Membership fees of mostly $ 5
monthly are automatically deducted from the seafarers’ pay.
While most seafarers have positive views about their union, open
ended comments also indicate very limited or zero awareness of freedom of
association, and the rights to collective bargaining, negotiations, grievance
procedures, and disputes settlement. No seafarer interviewed recalls
participation in any union election, and many complained about not receiving
any report, which explained or accounted for their union contributions.
Figure 6.9 Seafarer’s union membership (by job group)
Percent of seafarers.
Union member
Former union member
Not a union member
6050403020100
Senior officers
Junior officers
Ratings
45
8
47
36
12
51
41
22
38
68
Seafarer unions in the Philippines
There are six seafarer unions in the Philippines. By far the largest
is the Associated Marine Officers and Seamen’s Union of the Philippines
(AMOSUP), recognised as the biggest seafarer union in the Philippines. The
union, through its president Captain Gregorio S. Oca, is represented in various
policy-making bodies with government and industry, including sectoral
seafarer conferences in the ILO. It is affiliated with the ITF. A local
publication reported that there were 30,000 AMOSUP members in 2001.2 In an
interview, a key official of the union said that they have 55,000 members in
2002. A recent newspaper report says that in 2003, AMOSUP has 75,000
members. 3 Among the explanations for variations is the fact that when seafarers
finish their employment contracts aboard and are unable to find new employment
for a long time, union membership ends.
Another union with a significant presence is the Philippine Seafarers
Union (PSU), (President: Mr. Democrito Mendoza; German Pascua, vice
president). The PSU is affiliated with the Associated Labor Union - Trade Union
Congress of the Philippines (ALU - TUCP), and also affiliated with ITF.
PSU seafarer members work mostly in Asian routes, mainly with Japanese
ships. PSU estimates it has 5,000 members.
The United Filipino Seafarer (UFS) (website: www.ufs.org), with Mr.
Nelson Ramirez as President traces its origin in the Rizal Park seafarer street
labour market. The UFS publishes a newspaper, Tinig ng Marino (Voice of
the Seafarer), and Mr. Ramirez also broadcasts a regular radio program.
This union claims 20,000 members.
The other unions reported to have collective bargaining agreements with
shipping employers are: International Seamen’s Mutual Labor Association
(ISLA); Philippine Officers & Seamen’s Union (POSU); and the
2 Shipmate Magazine, December 2001 p. 5 3 Philippine Daily Inquirer, July 21, 2003, p. A6.
69
Marine Transport Employees Union (MATEU), with domestic seafarers
mostly as members.
Another seafarers’ group, the Mariners’ Association for Regional and
International Networking Organization (MARINO provides educational,
organizational and para- legal advice to seafarers, with support from the
Swedish Service and Communications Union (SEKO), an ITF affiliate.
MARINO is trying to organize the seafarers that converge in the Rizal Park.
There are reports of another group, the Filipino Seafarers Movement (FSM)
but no further details are available.
Another organization, the International Seafarers Action Centre
(ISAC) was recently organized, to provide legal and para- legal services to
seafarers that pursue claims for work-related disability, sickness and
injuries as well as death benefits for dependents.
There are various support organisations for Filipino seafarers in other
countries. The Filipino Maritime Network in Japan (FMN) was organized
in 1996 by people involved in the maritime industry, who live and work in
Tokyo and nearby areas. The objective of the organization is “…to promote
the welfare and upgrade the quality of Filipino seafarers”. It is not known
whether or not FMN is still active. Based in Rotterdam, the Netherlands,
the Philippine Seafarers’ Assistance Program (PSAP), conducts information
and education activities on seafarers rights. PSAP also provides a forum for
discussion on issues and concerns of the sea-based workers and their families.
PSAP estimates that around 300 Filipino seafarers pass through Rotterdam each
day.4 Hundreds work aboard Dutch ships, while a number of Filipino residents in
the Netherlands successfully applied for jobs with Norwegian, German and other
European ships. Some 300 Filipino men and women work on production platforms
run by American. Norwegian, British, and Dutch companies in the North Sea.
4 Interviews with Mr. Nonoy Ty, PSAP volunteer and Dr. Peter Payoyo, PSAP Programme Manager, 20 to 21 June 2002.
70
7. Conclusions
The Philippines continues to be a significant supplier of seafarers in the
global labour market. This phenomenon occurs in the context of continuing efforts by
global shipping companies to cut costs, rationalise crewing, and comply with,
among others, international conventions on maritime labour and protection of
the environment. There is also a diversity of countries where global seafarers
came from, giving prominence to multinational crews. High unemployment,
widespread poverty and low national income meanwhile characterise the Philippine
economy, which ‘pushes’ people to find jobs as overseas Filipino workers. The
country’s heavy foreign debt burden (US$60 billion as of 2002) and the
perennial trade deficit ($137.54 million in August 2003) 1 puts pressure against
the balance of payments and economic performance. Philippine seafarers, together
with other Filipinos working overseas, have become a vital lifeblood of the
national economy.
Filipino seafarers in this survey were mostly from the poor maritime
areas in the Visayas and Mindanao. They came from large families, and their
parents were either fishermen, farmers, or self-employed workers. The choice
of a seafaring career was a way out of poverty, with the added attraction of
“earning dollars and seeing the world for free”, proclaimed by gleeful maritime
school brochures. Parents sacrificed their incomes to pay the $5,000 tuition and
other schooling costs needed for a 4-year program, and even brothers, sisters
and other relatives were enlisted financially for help. The cost to complete an
officer-level maritime course was about 5 times the average per capita income in
the Philippines.
The Philippines has the world’s largest number of maritime education
and training institutions (76 universities and colleges with maritime courses, and
41 training centres) which complied with the IMO STCW’95 standards. It is
estimated that these schools had a total of 108,000 maritime students, but
CHED records show there were only 8,961 officer-graduates in 2001; there are
1 National Statistics Office (NSO), Philippines. Key Indicators. <http://www.nscb.gov.ph> [Accessed 31 August 2003]
71
no statistics for the number of ratings-graduates. POEA reports that between
2001 and 2002 there were 5,004 new seafarers deployed. This means that for
every 100 students, there were only 5 new seafarer jobs available in 2002.
Many students are unable to finish a maritime college course, due to among
others, limited placements for cadetship, and the relatively high costs of
maritime education. There is simply an oversupply of maritime graduates in
the Philippines, compared to the demand by the seafaring industry to employ
them.
After 10 years of basic elementary and secondary schooling, young
Filipinos enrol in a maritime school at age 16, and graduate 3 or 4 years
later at age 20, then begin their sea career soon thereafter. In this survey, the
average seafarer work experience is 11 years on and off, with 6 to 9 months
work contracts. Non-regular employment contracts onboard characterise the
engagement of Filipino seafarers in the global labour market. Seafarers intend to
stop work at sea when they reach 50 years of age, on the average.
Aside from the shipping employers and crewing agencies, stakeholders in
the Philippine seafaring industry include seafarer unions and organisations. While
government policy, expressed in various laws, aims “to ensure qualified, competent
and globally competitive Philippine seafarers”2, labour market regulation remains
decentralised in a plethora of state institutions with their own specialisation’s,
histories, mandates and constituencies. At the same time, Philippine labour laws
reflect the tensions faced by the State in exploiting the global demand for
Filipino labour, and the need to protect workers from abuse and exploitation.
The quality of maritime education and training directly affects the seafarers’
competencies and skills, which in turn reflects on the performance of their job
assignments, pay and working conditions in the global labour market. The
following key conclusions on maritime education and training (MET) emerge
from this survey.
• There is a need to review the existing framework and instruments of
regulation (evaluation and assessment) of MET institutions, particularly
72
with respect to quality standards on admission of students, size,
comfort level and adequacy of classrooms, equipment, library,
laboratory, teaching staff, teaching methods, staff recruitment,
student to teacher ratio, cadetship placements, and related learning
resources. New legislation is needed to strengthen the monitoring,
review and assessment of schools and training centres. Assessors of
maritime programs and training courses need to be with an independent
competent body with regular financial allocations.
• Maritime schools do not have common academic and physical- fitness
standards for applicants to be admitted to maritime courses. It is
possible for a student refused admission in a maritime program in one
school to be admitted in another school. There is a need for CHED to
develop a “national maritime admission examination” for applicants
to marine transport and marine engineering programs, associate
nautical & marine engineering, and related maritime courses.
Legislation is needed to strengthen CHED’s power to phase out
programs and schools , which fall below standards.
• With an oversupply of maritime graduates who could not be employed
by the seafaring industry, there is irrationality in the allocation of
resources (human, financial and physical) in 7 government-owned
schools and colleges offering maritime courses, in the different
areas of the country. There must be a way to reallocate resources
devoted to government-owned MET institutions, towards more selective
admission, excellence and greater employability of maritime graduates.
• While some top maritime schools have strong linkages with shipping
employers, most MET institutions simply admit students based on
quantitative targets, with no regard for job placements after graduation.
There is a need for schools to consider places for shipboard training
(cadetship and apprenticeship), when determining student admission.
The CHED needs to incorporate successful seafarer job placements in
their evaluation of the maritime schools’ performance.
2 Republic Act 8544 of 1998, “An Act Regulating the Practice of the Merchant Marine Profession in the Philippines.
73
• Legislative amendments are needed in the maritime curriculum, to
reduce the time devoted for required military training, or compulsory
humanities for instance; more options to study other foreign
languages, or more time for English language competencies, etc.. and
alternatives to the usual 3 – 1 curriculum (with incentives to pursue
the 2 – 1 – 1 or 1 – 1- 2 model).
• Various forms of foreign assistance complement government
resources allocated to the annual budgets of MET institutions. There is a
need however to review and rationalise how these programs respond
to the current realities of the global seafarer labour market. There are
no specific resources devoted to upgrade maritime education,
particularly the acquisition of new learning equipment and methods to
the latest specifications by industry. There are gaps in processes ,
which lead to the certification of skills and competencies for both
officers and ratings, as they progress in their careers. Efforts however
exist in the officer certification agency, the Professional Regulation
Commission (PRC), to develop test item banks to benchmark latest
world-class standards, and to computerise licensure examinations
along with flexible, walk- in schedules.
In the areas of industrial relations and disputes settlement, Philippine
labor laws and court decisions guide seafarer industry stakeholders in their
recruitment and employment practices. Unlike other maritime countries, there is
however no specialized maritime court in the Philippines, which could have
jurisdiction over disputes on shipping, labour disputes between seafarers and
employers, compensation claims, shipping disasters, and the like. Interviews
with seafarers during the survey revealed a list of common problems in their
employment in the global labour market. These most common problems are the
following:
• Age limits as a form of employment discrimination.
• Watchlisting (or blacklisting) of seafarers;
• Increased costs for identity documents of seafarers, i.e. visa
requirements in US ports.
74
• Contract substitution by employers.
• Non-compliance of seafarer contracts by unscrupulous employers.
• Reduction in compensation; delayed or non-payment of salaries.
• Exorbitant interest rates for overseas employment placement.
• Onerous requirements for medical examinations and certifications.
• Inadequate food and accommodation aboard.
• Lack of awareness of grievance procedures aboard.
• Limits on postponement of cases for illegal dismissals and claims.
• Irrelevant ‘cash cow’ training outside of STCW95 requirements.
• Medical and educational assistance for seafarers’ families and
dependents.
• Need for a labour market information center for seafarers.
• Action on ambulance chasers,3 who victimize seafarers and their
families pursuing claims for accidents, injuries or death.
• Need for more expertise for the mediation, conciliation and voluntary
arbitration of disputes involving seafarers and their employers.
Philippines industry leaders and officials continually express the hope that
the country maintain its top position, or even further enlarge its share of the
global labour market. The conclusions derived from this profile of Philippine
global seafarers point to the need to pursue more vigorous and sustained policy
reforms to strengthen maritime education and training, with benchmarks as well
as standards consistent with best practices in leading countries. At the same
time, the protection and welfare of seafarers through labour market regulation
requires more resources to be allocated to the institutions and agencies which
deal with them. The forthcoming consolidation of ILO maritime labour
conventions will test the capacity and readiness of the Philippine seafaring
industry to realise more decent work for the seafarers, a core dimension of global
labour market competitiveness.
*** *** ***
3 “Ambulance chasers" are lawyers who, in return for authorising them as case handlers or signing waivers, offer huge sums of money and cash advances for distressed seafarers (and other OFWs, and their families) pursuing legal claims for compensation as a result of injury, sickness or death.
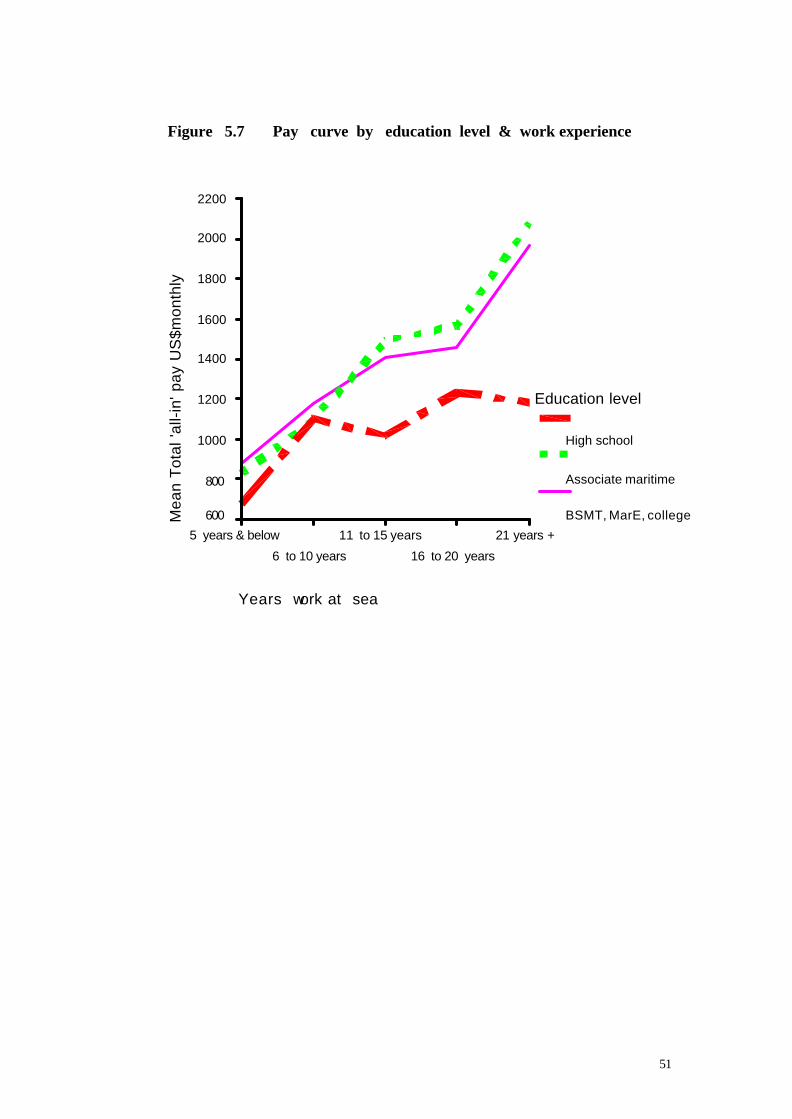
51
Figure 5.7 Pay curve by education level & work experience
Years work at sea
21 years +
16 to 20 years
11 to 15 years
6 to 10 years
5 years & below
Mea
n T
otal
'all-
in' p
ay U
S$m
onth
ly
2200
2000
1800
1600
1400
1200
1000
800
600
Education level
High school
Associate maritime
BSMT, MarE, college
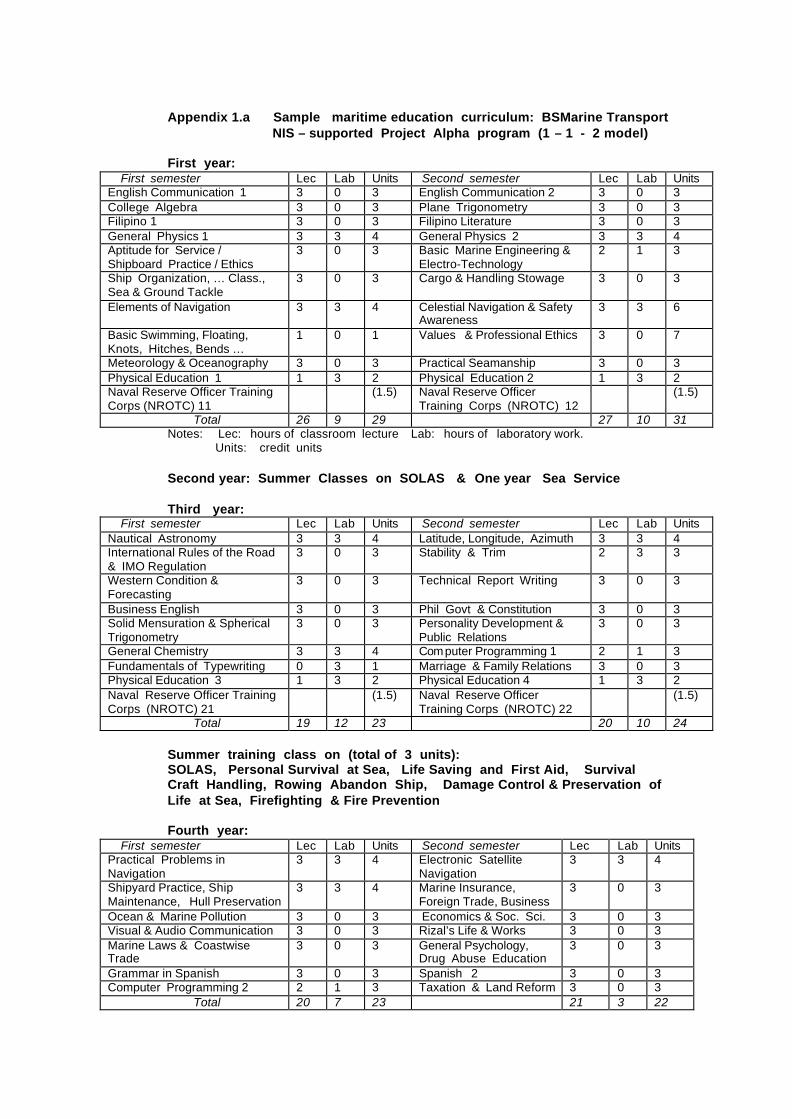
Appendix 1.a Sample maritime education curriculum: BSMarine Transport NIS – supported Project Alpha program (1 – 1 - 2 model) First year:
First semester Lec Lab Units Second semester Lec Lab Units English Communication 1 3 0 3 English Communication 2 3 0 3 College Algebra 3 0 3 Plane Trigonometry 3 0 3 Filipino 1 3 0 3 Filipino Literature 3 0 3 General Physics 1 3 3 4 General Physics 2 3 3 4 Aptitude for Service / Shipboard Practice / Ethics
3 0 3 Basic Marine Engineering & Electro-Technology
2 1 3
Ship Organization, … Class., Sea & Ground Tackle
3 0 3 Cargo & Handling Stowage 3 0 3
Elements of Navigation 3 3 4 Celestial Navigation & Safety Awareness
3 3 6
Basic Swimming, Floating, Knots, Hitches, Bends …
1 0 1 Values & Professional Ethics 3 0 7
Meteorology & Oceanography 3 0 3 Practical Seamanship 3 0 3 Physical Education 1 1 3 2 Physical Education 2 1 3 2 Naval Reserve Officer Training Corps (NROTC) 11
(1.5) Naval Reserve Officer Training Corps (NROTC) 12
(1.5)
Total 26 9 29 27 10 31 Notes: Lec: hours of classroom lecture Lab: hours of laboratory work. Units: credit units Second year: Summer Classes on SOLAS & One year Sea Service Third year:
First semester Lec Lab Units Second semester Lec Lab Units Nautical Astronomy 3 3 4 Latitude, Longitude, Azimuth 3 3 4 International Rules of the Road & IMO Regulation
3 0 3 Stability & Trim 2 3 3
Western Condition & Forecasting
3 0 3 Technical Report Writing 3 0 3
Business English 3 0 3 Phil Govt & Constitution 3 0 3 Solid Mensuration & Spherical Trigonometry
3 0 3 Personality Development & Public Relations
3 0 3
General Chemistry 3 3 4 Computer Programming 1 2 1 3 Fundamentals of Typewriting 0 3 1 Marriage & Family Relations 3 0 3 Physical Education 3 1 3 2 Physical Education 4 1 3 2 Naval Reserve Officer Training Corps (NROTC) 21
(1.5) Naval Reserve Officer Training Corps (NROTC) 22
(1.5)
Total 19 12 23 20 10 24 Summer training class on (total of 3 units): SOLAS, Personal Survival at Sea, Life Saving and First Aid, Survival Craft Handling, Rowing Abandon Ship, Damage Control & Preservation of Life at Sea, Firefighting & Fire Prevention Fourth year:
First semester Lec Lab Units Second semester Lec Lab Units Practical Problems in Navigation
3 3 4 Electronic Satellite Navigation
3 3 4
Shipyard Practice, Ship Maintenance, Hull Preservation
3 3 4 Marine Insurance, Foreign Trade, Business
3 0 3
Ocean & Marine Pollution 3 0 3 Economics & Soc. Sci. 3 0 3 Visual & Audio Communication 3 0 3 Rizal’s Life & Works 3 0 3 Marine Laws & Coastwise Trade
3 0 3 General Psychology, Drug Abuse Education
3 0 3
Grammar in Spanish 3 0 3 Spanish 2 3 0 3 Computer Programming 2 2 1 3 Taxation & Land Reform 3 0 3 Total 20 7 23 21 3 22
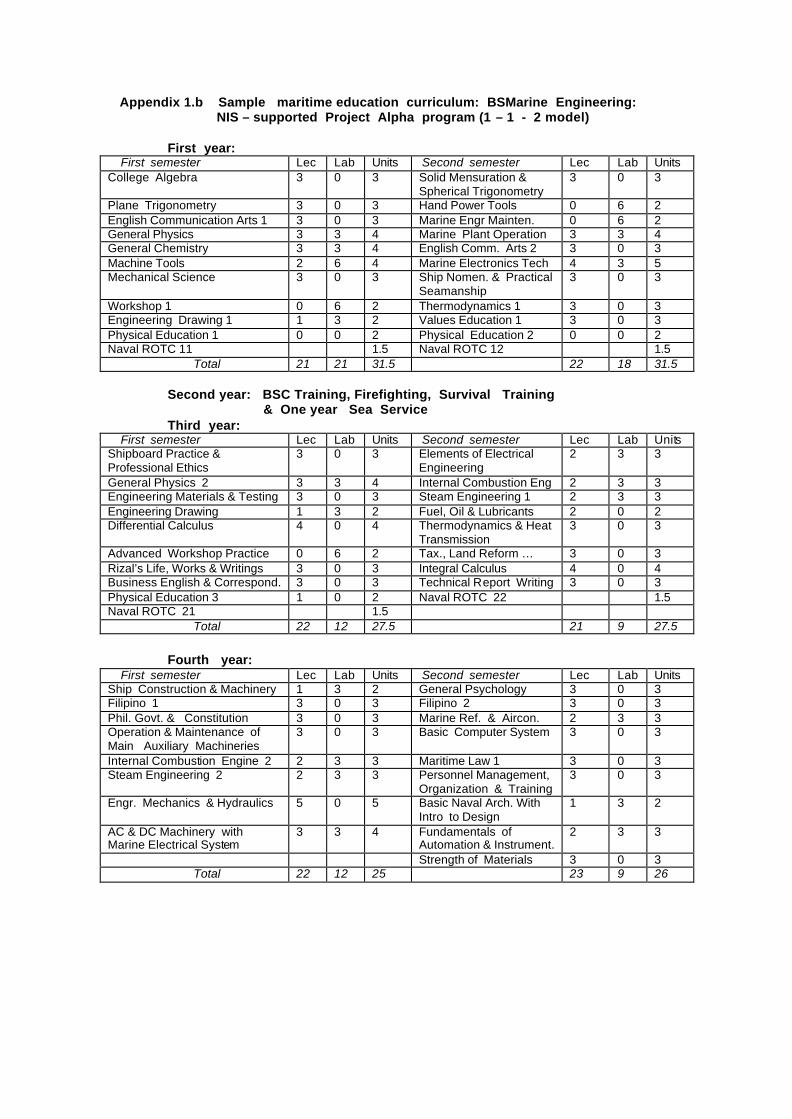
Appendix 1.b Sample maritime education curriculum: BSMarine Engineering: NIS – supported Project Alpha program (1 – 1 - 2 model) First year:
First semester Lec Lab Units Second semester Lec Lab Units College Algebra 3 0 3 Solid Mensuration &
Spherical Trigonometry 3 0 3
Plane Trigonometry 3 0 3 Hand Power Tools 0 6 2 English Communication Arts 1 3 0 3 Marine Engr Mainten. 0 6 2 General Physics 3 3 4 Marine Plant Operation 3 3 4 General Chemistry 3 3 4 English Comm. Arts 2 3 0 3 Machine Tools 2 6 4 Marine Electronics Tech 4 3 5 Mechanical Science 3 0 3 Ship Nomen. & Practical
Seamanship 3 0 3
Workshop 1 0 6 2 Thermodynamics 1 3 0 3 Engineering Drawing 1 1 3 2 Values Education 1 3 0 3 Physical Education 1 0 0 2 Physical Education 2 0 0 2 Naval ROTC 11 1.5 Naval ROTC 12 1.5 Total 21 21 31.5 22 18 31.5
Second year: BSC Training, Firefighting, Survival Training
& One year Sea Service Third year:
First semester Lec Lab Units Second semester Lec Lab Units Shipboard Practice & Professional Ethics
3 0 3 Elements of Electrical Engineering
2 3 3
General Physics 2 3 3 4 Internal Combustion Eng 2 3 3 Engineering Materials & Testing 3 0 3 Steam Engineering 1 2 3 3 Engineering Drawing 1 3 2 Fuel, Oil & Lubricants 2 0 2 Differential Calculus 4 0 4 Thermodynamics & Heat
Transmission 3 0 3
Advanced Workshop Practice 0 6 2 Tax., Land Reform … 3 0 3 Rizal’s Life, Works & Writings 3 0 3 Integral Calculus 4 0 4 Business English & Correspond. 3 0 3 Technical Report Writing 3 0 3 Physical Education 3 1 0 2 Naval ROTC 22 1.5 Naval ROTC 21 1.5 Total 22 12 27.5 21 9 27.5
Fourth year:
First semester Lec Lab Units Second semester Lec Lab Units Ship Construction & Machinery 1 3 2 General Psychology 3 0 3 Filipino 1 3 0 3 Filipino 2 3 0 3 Phil. Govt. & Constitution 3 0 3 Marine Ref. & Aircon. 2 3 3 Operation & Maintenance of Main Auxiliary Machineries
3 0 3 Basic Computer System 3 0 3
Internal Combustion Engine 2 2 3 3 Maritime Law 1 3 0 3 Steam Engineering 2 2 3 3 Personnel Management,
Organization & Training 3 0 3
Engr. Mechanics & Hydraulics 5 0 5 Basic Naval Arch. With Intro to Design
1 3 2
AC & DC Machinery with Marine Electrical System
3 3 4 Fundamentals of Automation & Instrument.
2 3 3
Strength of Materials 3 0 3 Total 22 12 25 23 9 26
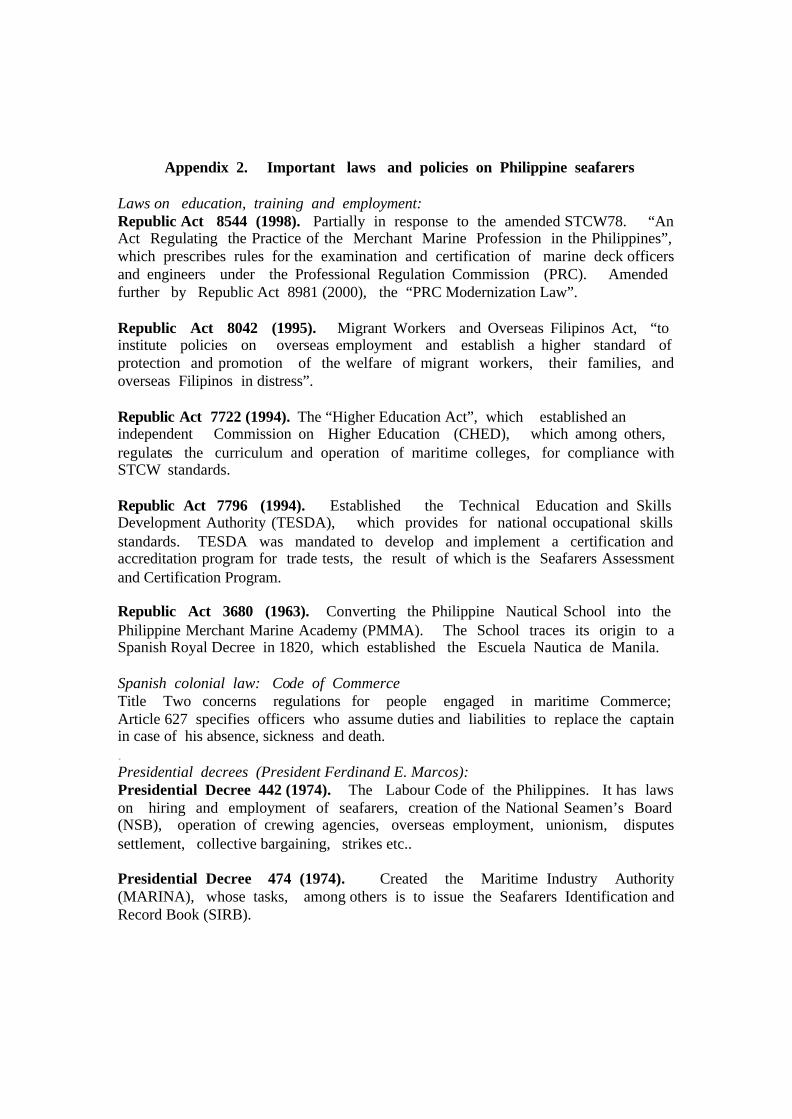
Appendix 2. Important laws and policies on Philippine seafarers
Laws on education, training and employment: Republic Act 8544 (1998). Partially in response to the amended STCW78. “An Act Regulating the Practice of the Merchant Marine Profession in the Philippines”, which prescribes rules for the examination and certification of marine deck officers and engineers under the Professional Regulation Commission (PRC). Amended further by Republic Act 8981 (2000), the “PRC Modernization Law”.
Republic Act 8042 (1995). Migrant Workers and Overseas Filipinos Act, “to institute policies on overseas employment and establish a higher standard of protection and promotion of the welfare of migrant workers, their families, and overseas Filipinos in distress”.
Republic Act 7722 (1994). The “Higher Education Act”, which established an independent Commission on Higher Education (CHED), which among others, regulates the curriculum and operation of maritime colleges, for compliance with STCW standards.
Republic Act 7796 (1994). Established the Technical Education and Skills Development Authority (TESDA), which provides for national occupational skills standards. TESDA was mandated to develop and implement a certification and accreditation program for trade tests, the result of which is the Seafarers Assessment and Certification Program.
Republic Act 3680 (1963). Converting the Philippine Nautical School into the Philippine Merchant Marine Academy (PMMA). The School traces its origin to a Spanish Royal Decree in 1820, which established the Escuela Nautica de Manila.
Spanish colonial law: Code of Commerce Title Two concerns regulations for people engaged in maritime Commerce; Article 627 specifies officers who assume duties and liabilities to replace the captain in case of his absence, sickness and death. . Presidential decrees (President Ferdinand E. Marcos): Presidential Decree 442 (1974). The Labour Code of the Philippines. It has laws on hiring and employment of seafarers, creation of the National Seamen’s Board (NSB), operation of crewing agencies, overseas employment, unionism, disputes settlement, collective bargaining, strikes etc..
Presidential Decree 474 (1974). Created the Maritime Industry Authority (MARINA), whose tasks, among others is to issue the Seafarers Identification and Record Book (SIRB).
References
Apostleship of the Sea (AOS) - Philippines 1998. Ahoy! Manual for Filipino
Seafarers. Second Edition. Manila: Society of St. Paul.
Brooks, Mary R. (1989). Report on the Seafarer Survey. In: Mary R. Brooks (ed.) Seafarers in the ASEAN Region. Singapore: Institute of Southeast Asian Studies. Pp. 108 – 129.
Bureau of Labor and Employment Statistics, Philippine Department of Labor and
Employment (BLES – DOLE) (2001). Quarterly Labor Statistics. Manila: BLES – DOLE.
Corpuz, Onofre D. 1997. An Economic History of the Philippines. Quezon City: University of the Philippine Press.
De Morga, Antonio (1609). Sucesos delas Islas Filipinas (Events in the
Philippine Islands). Translated and Edited by J.S. Cummins (1972). Cambridge: Cambridge University Press.
Drewry (2001). Ship Operating Costs Annual Review and Forecast.
[Citation to be completed] Ehrenberg, Ronald G. and Robert S. Smith (2000). Modern Labor Economics
7th Edition. New York: Addison and Wesley. Harper, Bambi (2003). Who was Enrique de Malacca? Sense & Sensibility
column. Philippine Daily Inquirer. [WWW] http://www.inq7.net/ opi_harper-1.htm [Accessed 24 March 2003]
International Labour Organization - Joint Maritime Commission (2002). Wages,
Hours of Work, and Manning (Sea) Recommendation 1958 (No. 109): Updating of the Minimum Basic Wage of Able Seamen. [WWW] www.ilo.org/public/english/dialogue/sector/techmeet/jmc96/wages2.htm (Accessed 12 April 2002)
International Commission on Shipping (ICONS) (2000). Ships, Slaves and
Competition. Inquiry Into Ship Safety. [WWW] Charleston NSW, Australia: ICONS. <www.icons.org.au> [Accessed 27 March 2003]
International Shipping Federation (ISF) (2000). BIMCO/ISF 2000 Manpower Update. < http://www.marisec.org/isf> [23 March 2002)
International Transport Workers Federation (ITF) (2002). ITF Maritime
Department: Policies <www.itf.org.uk/SECTIONS/Mar/cabotagepolicy> [Accessed 3 March 2002] International Transport Workers Federation (ITF) (2000). Flags of Convenience
Campaign Report 2000. [WWW] <www.itf.org.uk/seafarers/foc /report_2000> [Accessed 3 March 2002]
International Transport Workers Federation (ITF) (2002). Flags of Convenience Campaign Report 2001/02. London: ITF.
Ishak, Ghani (1989). Wages, Conditions of Work and the Welfare of ASEAN
Seafarers. In: Mary R. Brooks (ed.) Seafarers in the ASEAN Region. Singapore: Institute of Southeast Asian Studies. Pp. 57 – 90.
Kahveci, Erol, Tony Lane and Helen Sampson (2002). Transnational
Seafarer Communities. Cardiff, U.K: Seafarer’s International Research Centre (SIRC) – Cardiff University.
Kahveci, Erol (2003). Evaluation of the Finnish, German and Filipino Sailing
Chaplains. The Sailing Chaplain and Outreach Welfare Schemes. Summary Report. Cardiff, UK: Seafarers International Research Centre, Cardiff University.
Lane, Tony (2000). The Global Seafarers Labour Market: Problems and
Solutions. Seafarer’s International Research Centre, Cardiff University: Cardiff, U.K. (Unpublished paper).
Lane, Tony, and Jaime Veiga (2001). A Study of the Global Supply of
Suitably Trained Ratings. Seafarer’s International Research Centre, Cardiff University: Cardiff, U.K. (Unpublished report).
Maritime Industry Authority (MARINA), Philippines (1999). 25th Anniversary Yearbook, 1974-1999. Manila: MARINA
Maritime Industry Authority (MARINA), Philippines (1999). Maritime Industry
Sectoral Situation. Manila: MARINA [WWW] <http://www.marina.gov.ph/report/> [Accessed 10 April 2003]
Maritime Training Center (MTC), Philippines (2003). Accredited Maritime
Training Centers and Schools. <http://www.mtc.gov.ph> [Accessed 8 February 2003]
Mier, A. Francisco J. (1989). Philippine Country Report. In: Mary R. Brooks
(ed.) Seafarers in the ASEAN Region. Singapore: Institute of Southeast Asian Studies. Pp. 183 – 206.
Morris, Peter. 2002. Globalisation affects today’s seafarers. ICONS Chairman Address to the Apostleship of the Sea XXI World Congress, October 1, 2002 Rio de Janeiro. [WWW] <http://www.icons.org.au/pdfs/Speech_021001.pdf>
[Accessed 2 April 2003] National Statistical Coordination Board (NSCB), Philippines (2002).
Philippine Yearbook of Statistics 2002. Manila: NSCB
National Statistics Office (NSO), Philippines (2003). Philippine Key Indicators [WWW] <http://www.census.gov.ph/data> [Accessed 15 March 2003]
National Statistics Office (NSO), Philippines (2000). Survey of Overseas
Filipinos (OFWs). <www.census.gov.ph/data/pressrelease/2001/of00tx.html> [Accessed 15 March 2002] Philippine Government (1987). Constitution of the Republic of the Philippines.
<http://www.chanrobles.com/philsupremelaw1.htm> [Accessed 7 August 2003].
Philippine Overseas Employment Administration (POEA) (2002a). Migrant
Workers and Overseas Filipinos Act of 1995 (RA8042) with POEA Rules and Regulations Governing Overseas Employment. <http://www.poea.gov.ph> [Accessed 1 March 2003]
Philippine Overseas Employment Administration (POEA) (2002b). Standard
Employment Contract for Seafarers. [WWW ] <http://www.poea.gov.ph> [Accessed 15 April 2003]
Philippine Overseas Employment Administration (POEA) (2003). Deployed Overseas Filipino Workers by Destination [WWW] <http://www.poea.gov.ph> [Accessed 15 April 2003]
Roxas-Lim, Aurora (2001). Ancient Balanghai: A Story of Filipino
Seamanship and Maritime Trade. Quezon City: University of the Philippines Asian Center. Unpublished paper.
Sampson, Helen (2003). Transnational drifters or hyperspace dwellers: an exploration of the lives of Filipino seafarers aboard and ashore.
Ethnic and Racial Studies. Vol. 26 No. 2 (March). Pp. 253-277. Scalabrini Migration Center (2000). The Need for an International Seafarers’
Centre in Manila. A Feasibility Study. Manila: Scalabrini Migration Center.
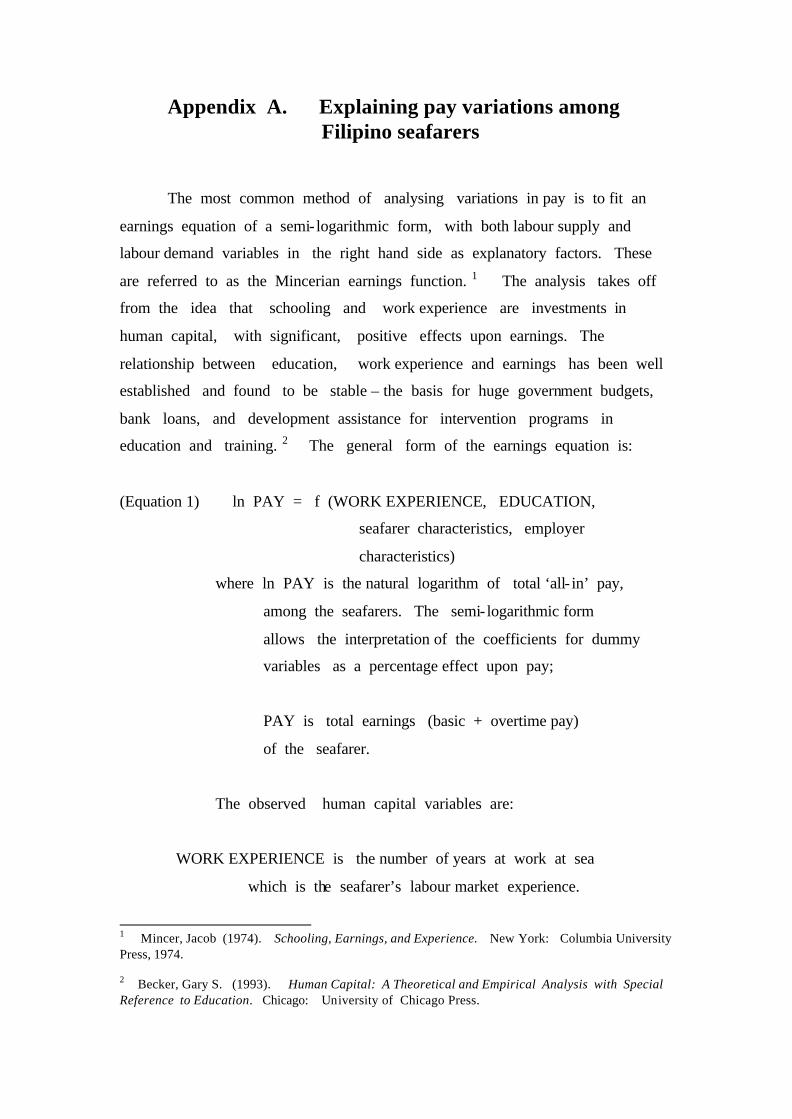
Appendix A. Explaining pay variations among Filipino seafarers
The most common method of analysing variations in pay is to fit an
earnings equation of a semi- logarithmic form, with both labour supply and
labour demand variables in the right hand side as explanatory factors. These
are referred to as the Mincerian earnings function. 1 The analysis takes off
from the idea that schooling and work experience are investments in
human capital, with significant, positive effects upon earnings. The
relationship between education, work experience and earnings has been well
established and found to be stable – the basis for huge government budgets,
bank loans, and development assistance for intervention programs in
education and training. 2 The general form of the earnings equation is:
(Equation 1) ln PAY = f (WORK EXPERIENCE, EDUCATION,
seafarer characteristics, employer
characteristics)
where ln PAY is the natural logarithm of total ‘all- in’ pay,
among the seafarers. The semi- logarithmic form
allows the interpretation of the coefficients for dummy
variables as a percentage effect upon pay;
PAY is total earnings (basic + overtime pay)
of the seafarer.
The observed human capital variables are:
WORK EXPERIENCE is the number of years at work at sea
which is the seafarer’s labour market experience.
1 Mincer, Jacob (1974). Schooling, Earnings, and Experience. New York: Columbia University Press, 1974. 2 Becker, Gary S. (1993). Human Capital: A Theoretical and Empirical Analysis with Special Reference to Education. Chicago: University of Chicago Press.
and SCHOOLING is the number of years for schooling, or
which represents (“dummy variable” for) level of educational
attainment. Schooling, or level of educational attainment has the
following equivalent number of years:
10 years = High school graduate
12 years = Associate nautical science or marine engineering.
13 years = Some college, but not finished.
14 years = Maritime college courses for officers (Bachelor of Science in
Marine Transport, BSMT; Bachelor of Science in
Marine Engineer (BSMarE). Also for those who
completed other college courses.
It is expected that the regression coefficients, which are the first
differentials for the human capital variables should be significantly positive:
(Equation 2) f ‘ (WORK EXPERIENCE) > 0 and
f ‘ (SCHOOLING) > 0.
Earnings are observed to be upward sloping at the start of one’s
employment, reach a peak and eventually decline. A quadratic form is
estimated by using the square of the work experience variable in the
regression analysis, and expected to have a negative sign. The same logic
holds for years of schooling. The earnings curve starts first with a
positive slope, reaches a peak, and declines as indicated by the negative
coefficient.
Other variables representing education could be tested to examine
whether or not they are significant in explaining variations in pay among the
seafarers, such as the nature of the maritime course, the type of school,
or whether the seafarer had a certificate of licensure from the Professional
Regulation Commission.
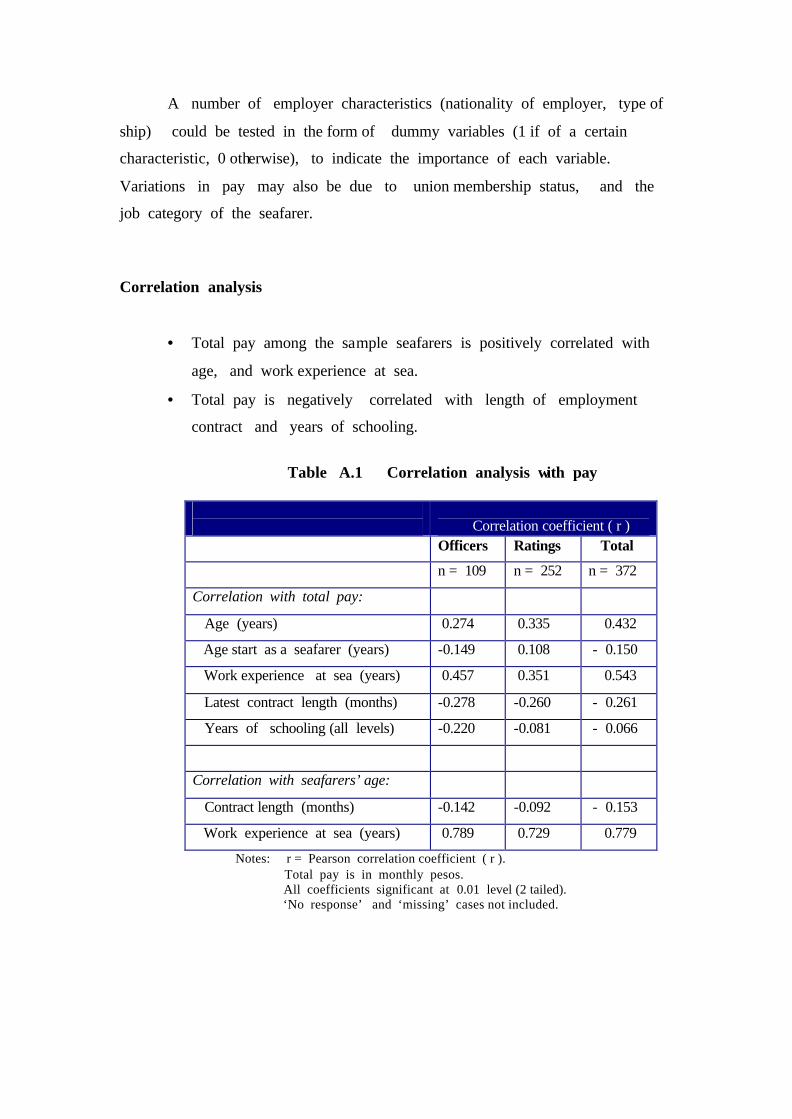
A number of employer characteristics (nationality of employer, type of
ship) could be tested in the form of dummy variables (1 if of a certain
characteristic, 0 otherwise), to indicate the importance of each variable.
Variations in pay may also be due to union membership status, and the
job category of the seafarer.
Correlation analysis
• Total pay among the sample seafarers is positively correlated with
age, and work experience at sea.
• Total pay is negatively correlated with length of employment
contract and years of schooling.
Table A.1 Correlation analysis with pay
Correlation coefficient ( r )
Officers Ratings Total
n = 109 n = 252 n = 372
Correlation with total pay:
Age (years) 0.274 0.335 0.432
Age start as a seafarer (years) -0.149 0.108 - 0.150
Work experience at sea (years) 0.457 0.351 0.543
Latest contract length (months) -0.278 -0.260 - 0.261
Years of schooling (all levels) -0.220 -0.081 - 0.066
Correlation with seafarers’ age:
Contract length (months) -0.142 -0.092 - 0.153
Work experience at sea (years) 0.789 0.729 0.779
Notes: r = Pearson correlation coefficient ( r ). Total pay is in monthly pesos. All coefficients significant at 0.01 level (2 tailed). ‘No response’ and ‘missing’ cases not included.
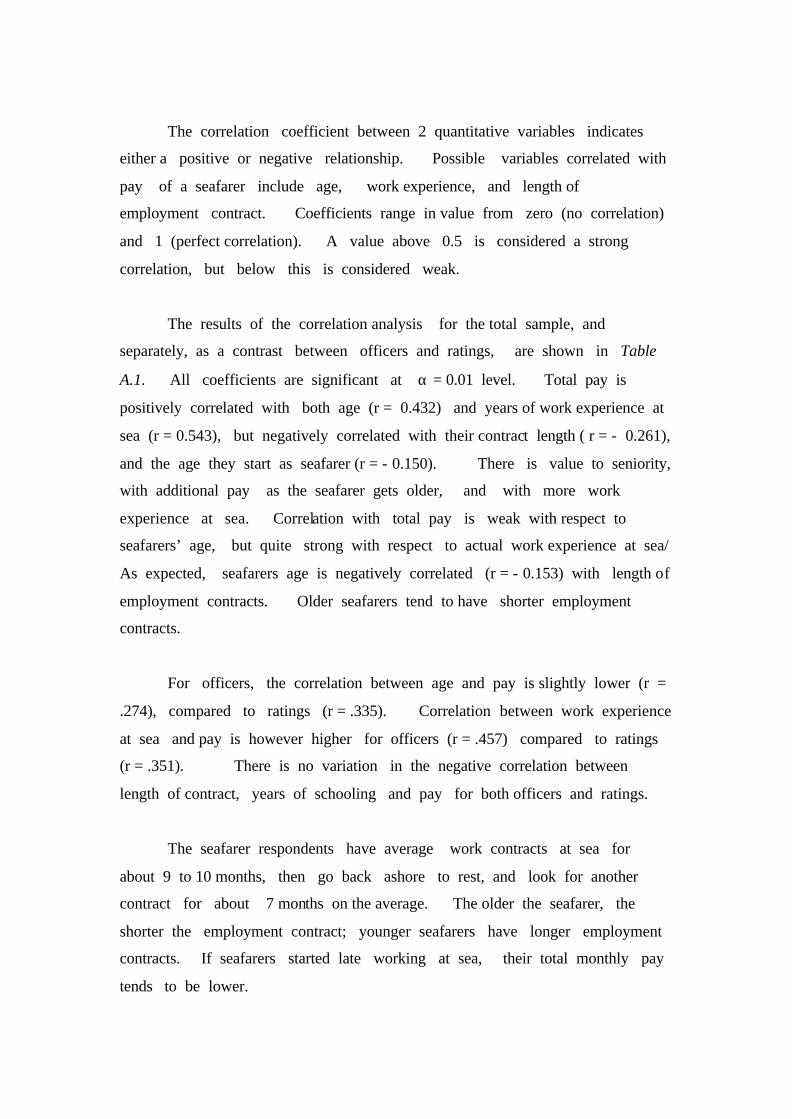
The correlation coefficient between 2 quantitative variables indicates
either a positive or negative relationship. Possible variables correlated with
pay of a seafarer include age, work experience, and length of
employment contract. Coefficients range in value from zero (no correlation)
and 1 (perfect correlation). A value above 0.5 is considered a strong
correlation, but below this is considered weak.
The results of the correlation analysis for the total sample, and
separately, as a contrast between officers and ratings, are shown in Table
A.1. All coefficients are significant at α = 0.01 level. Total pay is
positively correlated with both age (r = 0.432) and years of work experience at
sea (r = 0.543), but negatively correlated with their contract length ( r = - 0.261),
and the age they start as seafarer (r = - 0.150). There is value to seniority,
with additional pay as the seafarer gets older, and with more work
experience at sea. Correlation with total pay is weak with respect to
seafarers’ age, but quite strong with respect to actual work experience at sea/
As expected, seafarers age is negatively correlated (r = - 0.153) with length of
employment contracts. Older seafarers tend to have shorter employment
contracts.
For officers, the correlation between age and pay is slightly lower (r =
.274), compared to ratings (r = .335). Correlation between work experience
at sea and pay is however higher for officers (r = .457) compared to ratings
(r = .351). There is no variation in the negative correlation between
length of contract, years of schooling and pay for both officers and ratings.
The seafarer respondents have average work contracts at sea for
about 9 to 10 months, then go back ashore to rest, and look for another
contract for about 7 months on the average. The older the seafarer, the
shorter the employment contract; younger seafarers have longer employment
contracts. If seafarers started late working at sea, their total monthly pay
tends to be lower.
The results of regression analysis of variations in pay among the
seafarers suggest a good fit, and are presented in Table A.2. The F -
statistic for the earnings equation is 36.79, which is significant at 1
percent or higher. The explanatory power of the variables included in the
analysis of the earnings variation is 55 percent, which means that 45
percent (100 less 55 percent) of the explanation in pay variations is from
other factors not included in the equation. 3
The following sections present the main results of the regression
analysis about pay variations of the sample Filipino seafarers with a
stylised version of the human capital model.
Is schooling significant?
The higher the number of years of schooling, the higher is the
educational level, and hence earnings should be higher. The results show
that years of schooling is not significant (standardised beta coefficient = -
1.012, t value = - 1.045). It has the wrong sign (negative). This means
that among the Filipino seafarers, particularly the non-officers in the survey,
the level of education is not significantly related to pay.
Seafarers completed a maritime course in college, but not all
could find a job as an officer aboard, thus they accept jobs as non-officers.
This is the reason why the dummy variable for seafarers, particularly for the
non-officers who had a maritime college degree is negative and significant
(beta = -0.243, t-value = -3.012). This is further confirmed by the fact that the
beta coefficient for those who passed the licensure examinations as officers
is not significant.
How strong is the seniority factor among Filipino seafarers?
3 The SPSS software allows for regression analysis using the “enter” method for each variable in the theoretical Mincerian model for the earnings function.
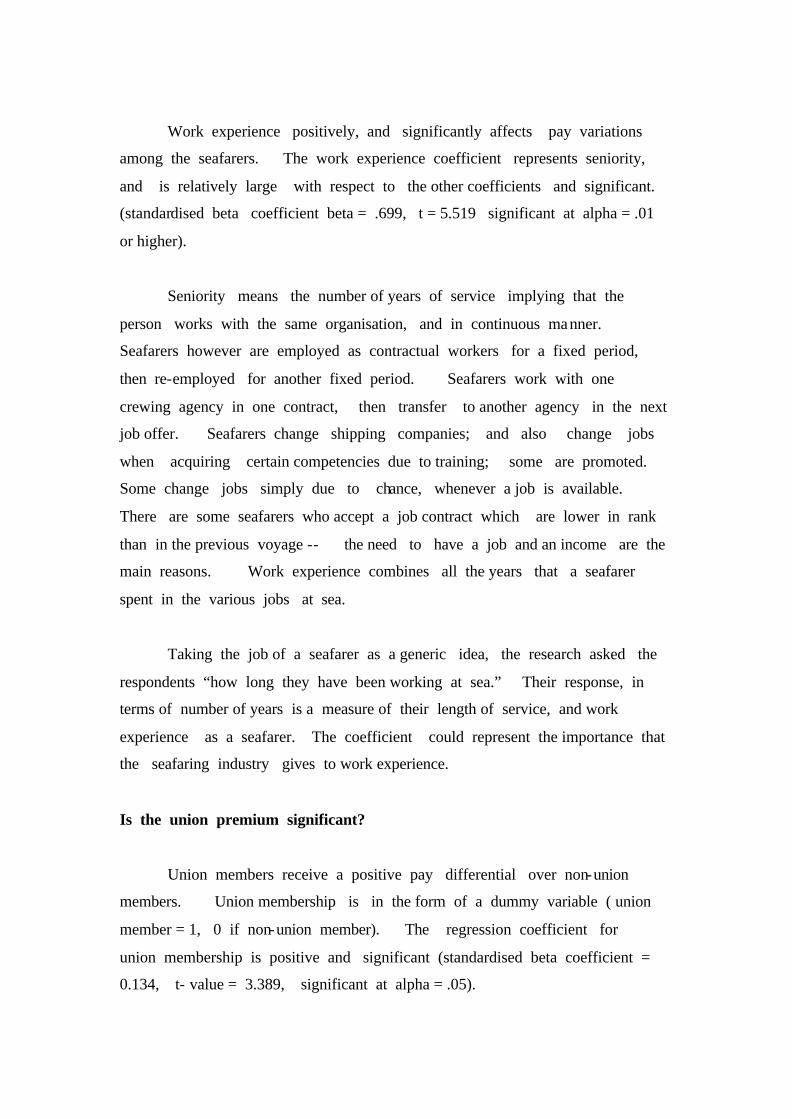
Work experience positively, and significantly affects pay variations
among the seafarers. The work experience coefficient represents seniority,
and is relatively large with respect to the other coefficients and significant.
(standardised beta coefficient beta = .699, t = 5.519 significant at alpha = .01
or higher).
Seniority means the number of years of service implying that the
person works with the same organisation, and in continuous manner.
Seafarers however are employed as contractual workers for a fixed period,
then re-employed for another fixed period. Seafarers work with one
crewing agency in one contract, then transfer to another agency in the next
job offer. Seafarers change shipping companies; and also change jobs
when acquiring certain competencies due to training; some are promoted.
Some change jobs simply due to chance, whenever a job is available.
There are some seafarers who accept a job contract which are lower in rank
than in the previous voyage -- the need to have a job and an income are the
main reasons. Work experience combines all the years that a seafarer
spent in the various jobs at sea.
Taking the job of a seafarer as a generic idea, the research asked the
respondents “how long they have been working at sea.” Their response, in
terms of number of years is a measure of their length of service, and work
experience as a seafarer. The coefficient could represent the importance that
the seafaring industry gives to work experience.
Is the union premium significant?
Union members receive a positive pay differential over non-union
members. Union membership is in the form of a dummy variable ( union
member = 1, 0 if non-union member). The regression coefficient for
union membership is positive and significant (standardised beta coefficient =
0.134, t- value = 3.389, significant at alpha = .05).
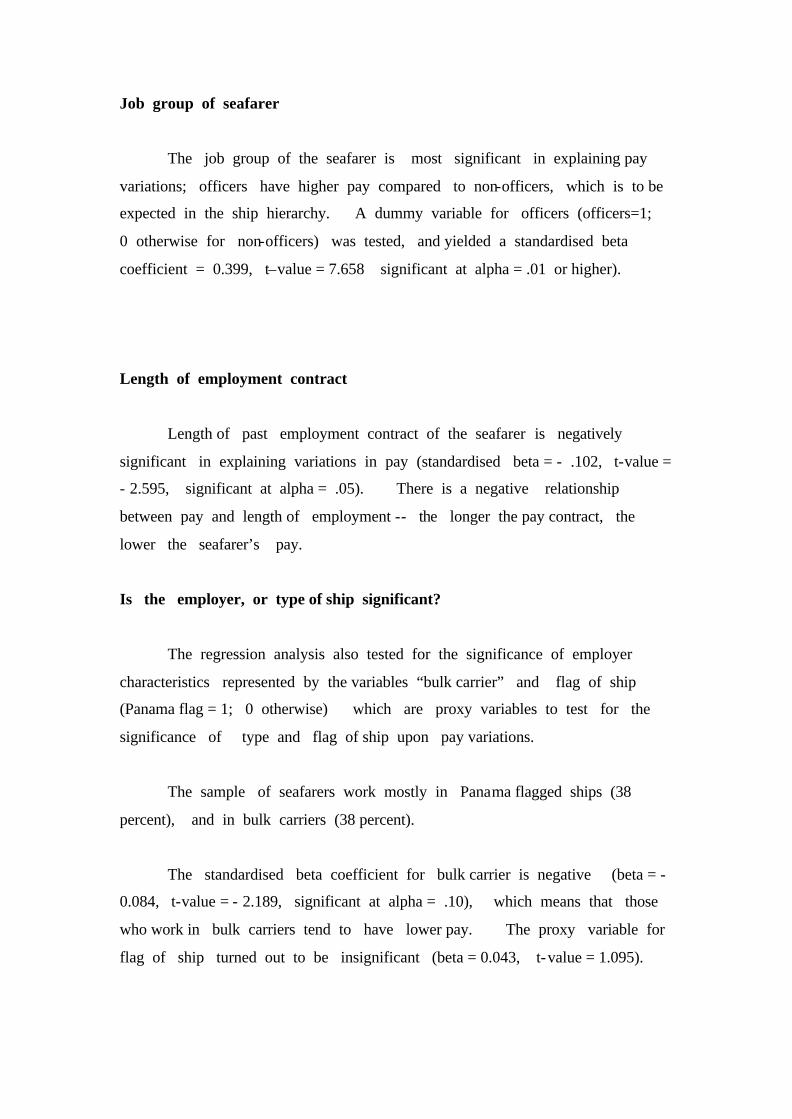
Job group of seafarer
The job group of the seafarer is most significant in explaining pay
variations; officers have higher pay compared to non-officers, which is to be
expected in the ship hierarchy. A dummy variable for officers (officers=1;
0 otherwise for non-officers) was tested, and yielded a standardised beta
coefficient = 0.399, t–value = 7.658 significant at alpha = .01 or higher).
Length of employment contract
Length of past employment contract of the seafarer is negatively
significant in explaining variations in pay (standardised beta = - .102, t-value =
- 2.595, significant at alpha = .05). There is a negative relationship
between pay and length of employment -- the longer the pay contract, the
lower the seafarer’s pay.
Is the employer, or type of ship significant?
The regression analysis also tested for the significance of employer
characteristics represented by the variables “bulk carrier” and flag of ship
(Panama flag = 1; 0 otherwise) which are proxy variables to test for the
significance of type and flag of ship upon pay variations.
The sample of seafarers work mostly in Panama flagged ships (38
percent), and in bulk carriers (38 percent).
The standardised beta coefficient for bulk carrier is negative (beta = -
0.084, t-value = - 2.189, significant at alpha = .10), which means that those
who work in bulk carriers tend to have lower pay. The proxy variable for
flag of ship turned out to be insignificant (beta = 0.043, t-value = 1.095).
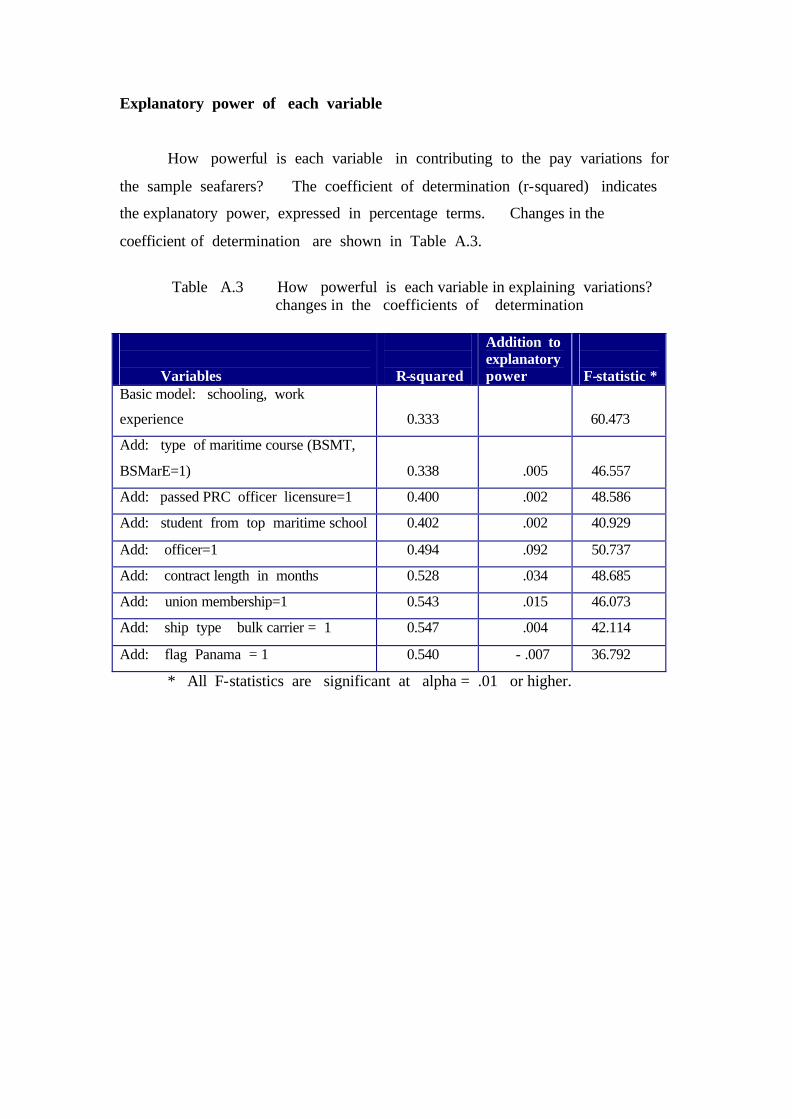
Explanatory power of each variable
How powerful is each variable in contributing to the pay variations for
the sample seafarers? The coefficient of determination (r-squared) indicates
the explanatory power, expressed in percentage terms. Changes in the
coefficient of determination are shown in Table A.3.
Table A.3 How powerful is each variable in explaining variations?
changes in the coefficients of determination Variables
R-squared
Addition to explanatory power
F-statistic *
Basic model: schooling, work
experience
0.333
60.473
Add: type of maritime course (BSMT,
BSMarE=1)
0.338
.005
46.557
Add: passed PRC officer licensure=1 0.400 .002 48.586
Add: student from top maritime school 0.402 .002 40.929
Add: officer=1 0.494 .092 50.737
Add: contract length in months 0.528 .034 48.685
Add: union membership=1 0.543 .015 46.073
Add: ship type bulk carrier = 1 0.547 .004 42.114
Add: flag Panama = 1 0.540 - .007 36.792
* All F-statistics are significant at alpha = .01 or higher.
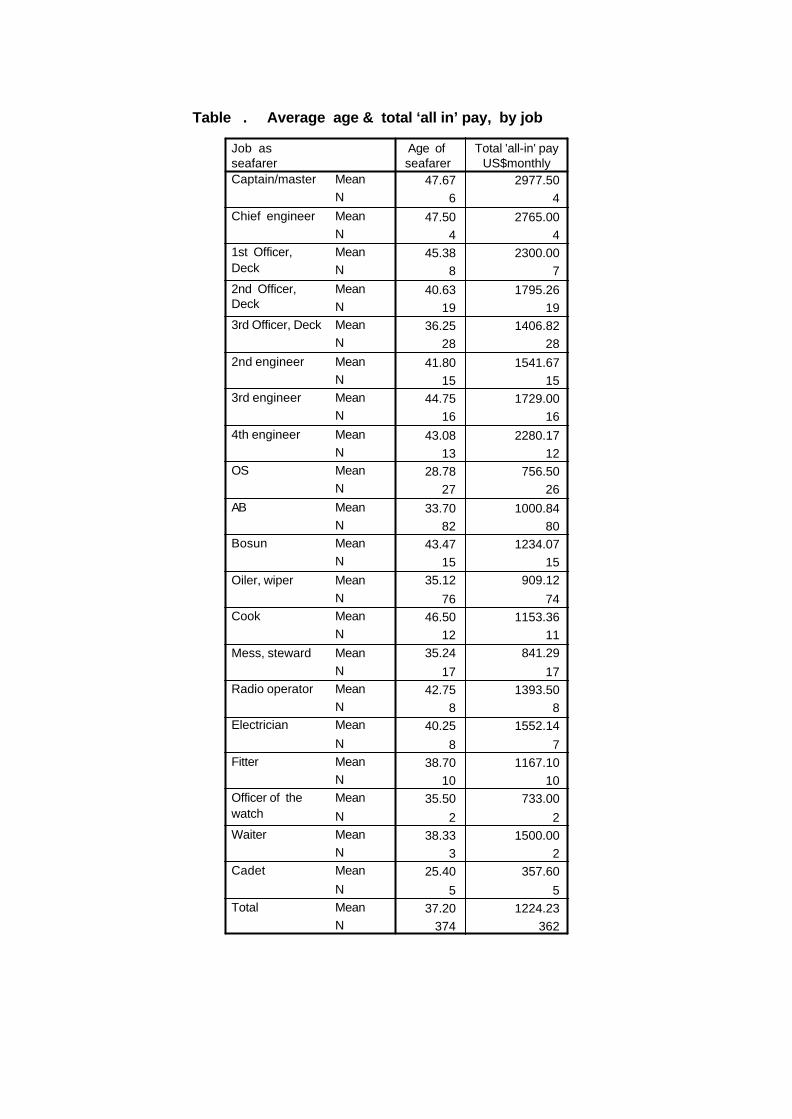
Table . Average age & total ‘all in’ pay, by job
47.67 2977.506 4
47.50 2765.004 4
45.38 2300.008 7
40.63 1795.2619 19
36.25 1406.8228 28
41.80 1541.6715 15
44.75 1729.0016 16
43.08 2280.1713 12
28.78 756.5027 26
33.70 1000.8482 80
43.47 1234.0715 15
35.12 909.12
76 7446.50 1153.36
12 1135.24 841.29
17 1742.75 1393.50
8 840.25 1552.14
8 738.70 1167.10
10 1035.50 733.00
2 238.33 1500.00
3 225.40 357.60
5 537.20 1224.23
374 362
MeanN
MeanNMeanN
MeanNMeanN
MeanNMeanN
MeanNMeanN
MeanNMeanN
MeanNMeanN
MeanNMeanNMean
NMeanNMean
NMeanNMean
NMeanN
Job as seafarerCaptain/master
Chief engineer
1st Officer,Deck
2nd Officer,Deck
3rd Officer, Deck
2nd engineer
3rd engineer
4th engineer
OS
AB
Bosun
Oiler, wiper
Cook
Mess, steward
Radio operator
Electrician
Fitter
Officer of thewatch
Waiter
Cadet
Total
Age of seafarer
Total 'all-in' payUS$monthly