
Philip Noden and Anne West The Early Years Single Funding ... Final... · The Early Years Single...
102
Philip Noden and Anne West The Early Years Single Funding Formula: National policy and local implementation Report Original citation: Noden, Philip and West, Anne (2016) The Early Years Single Funding Formula: National policy and local implementation. Clare Market Papers, 22. London School of Economics and Political Science, Department of Social Policy, London, UK. ISBN 978-1-909890-36-7 This version available at: http://eprints.lse.ac.uk/67880 Originally available from Education Research Group (ERG) Available in LSE Research Online: September 2016 © 2016 Philip Noden and Anne West This document is distributed under the terms of the Creative Commons Attribution License: https://creativecommons.org/licenses/by/4.0/ which permits unrestricted use, distribution, and reproduction in any medium, provided the original author and source are credited. LSE has developed LSE Research Online so that users may access research output of the School. Copyright © and Moral Rights for the papers on this site are retained by the individual authors and/or other copyright owners. Users may download and/or print one copy of any article(s) in LSE Research Online to facilitate their private study or for non-commercial research. You may not engage in further distribution of the material or use it for any profit-making activities or any commercial gain. You may freely distribute the URL (http://eprints.lse.ac.uk) of the LSE Research Online website.
Transcript of Philip Noden and Anne West The Early Years Single Funding ... Final... · The Early Years Single...
Philip Noden and Anne West The Early Years Single Funding Formula: National policy and local implementation Report Original citation: Noden, Philip and West, Anne (2016) The Early Years Single Funding Formula: National policy and local implementation. Clare Market Papers, 22. London School of Economics and Political Science, Department of Social Policy, London, UK. ISBN 978-1-909890-36-7 This version available at: http://eprints.lse.ac.uk/67880 Originally available from Education Research Group (ERG) Available in LSE Research Online: September 2016 © 2016 Philip Noden and Anne West This document is distributed under the terms of the Creative Commons Attribution License: https://creativecommons.org/licenses/by/4.0/ which permits unrestricted use, distribution, and reproduction in any medium, provided the original author and source are credited. LSE has developed LSE Research Online so that users may access research output of the School. Copyright © and Moral Rights for the papers on this site are retained by the individual authors and/or other copyright owners. Users may download and/or print one copy of any article(s) in LSE Research Online to facilitate their private study or for non-commercial research. You may not engage in further distribution of the material or use it for any profit-making activities or any commercial gain. You may freely distribute the URL (http://eprints.lse.ac.uk) of the LSE Research Online website.

The Early Years Single Funding Formula: National policy and local
implementation
by
Philip Noden and Anne West
September 2016
Education Research Group Department of Social Policy
London School of Economics and Political Science
Clare Market Papers No. 22
2
© 2016 Philip Noden and Anne West This document is distributed under the terms of the Creative Commons Attribution License: https://creativecommons.org/licenses/by/4.0/ which permits unrestricted use, distribution, and reproduction in any medium, provided the original author and source are credited. Education Research Group Department of Social Policy London School of Economics and Political Science Houghton Street LONDON WC2A 2AE Published by: LSE Academic Publishing ISBN: 978-1-909890-36-7
Preface The authors would like to thank the members of the project advisory group for their very helpful comments and feedback. Thanks also to Dr Jonathan Roberts for his expertise, support and prose. The research was funded by the Nuffield Foundation. The Nuffield Foundation is an endowed charitable trust that aims to improve social well-being in the widest sense. It funds research and innovation in education and social policy and also works to build capacity in education, science and social science research. The Nuffield Foundation has funded this project, but the views expressed are those of the authors and not necessarily those of the Foundation. More information is available at www.nuffieldfoundation.org

3
Table of Contents
EXECUTIVE SUMMARY ..................................................................................................... 4
1. INTRODUCTION ..................................................................................................... 10
2. THE EYSFF POLICY: OBJECTIVES AND IMPLEMENTATION ......................................... 13
3. FORMULA DESIGN AND FUNDING OUTCOMES: ALL LOCAL AUTHORITIES 2014-15.... 19
4. CASE STUDY FORMULAE ......................................................................................... 32
5. CONCLUSION ......................................................................................................... 54
ANNEX 1 ........................................................................................................................ 57
ANNEX 2 ........................................................................................................................ 61
ANNEX 3 ........................................................................................................................ 64
ANNEX 4 ........................................................................................................................ 84
REFERENCES................................................................................................................... 98

4
Executive summary Given the complexity of early years provision, creating an effective and efficient funding system for publicly funded early education is challenging and important. The funding arrangements affect the sustainability, quality and flexibility of provision. The funding mechanism interacts not only with the schools funding system, but also with market-based private provision. In some areas almost all early education provision for 3 and 4 year olds is provided by nursery classes. In other areas there are no nursery classes and all provision is within private, voluntary or independent (PVI) settings. In 2011, following concerns about the inadequacy and inequity of prior funding arrangements, the Government introduced a locally determined Early Years Single Funding Formula (EYSFF) as the mechanism for funding the free early entitlement across the diverse range of providers. This report describes in detail how that policy was implemented at local level. It draws on budget data for 2014-15 from 150 local authorities in England and case study evidence relating to nine of those areas. It provides a detailed picture of how the local formulae have been variously constructed, how funds have been distributed to different types of providers, and how formulae have addressed different policy priorities. The ‘core principles’ for the EYSFF stated it should:
• Support effective and efficient distribution of resources at the local level; • Facilitate greater flexibility of provision so that parents have greater
choice in how they use the free entitlement; • Preserve diversity and choice in the market; • Incentivise improvements in the quality of provision and recognise the
ongoing costs associated with quality; • Support the narrowing of achievement gaps and recognise the additional
costs associated with children from deprived backgrounds; • Be clear and transparent.
In designing formulae, local authorities had to strike a balance between the various policy goals and in response to changing guidance from central government. Formulae had to include a ‘base rate’, which could vary according to the type of provider, and a deprivation supplement. They could also include various supplementary payments, in particular relating to the quality, flexibility and sustainability of provision. Local authorities vary substantially in the design of their funding formulae. In 43 local authorities a single base rate was used across all types of provision. 55 authorities used one base rate for each of the main types of provision (PVI provision, nursery classes and, where applicable, nursery schools) and those rates were not equal. Fifty-two local authorities used different base rates for

5
‘sub-types’ of provision within at least one of the main types. Among these authorities there was no uniformity in the ‘sub-types’ of provision identified to receive different base rates, rather they were chosen to reflect variations in the cost of different sub-types of provision. Such ‘sub-types’ could, for example, identify a different base rate for childminders rather than all other PVI provision, or a different rate for small schools compared with larger schools. Overall 90% of funding was distributed via base rates, 4% through the deprivation supplement, 2% through quality supplements, 1% through flexibility supplements and the rest through other supplements. Fifteen of the sixteen possible combinations of the different types of supplement were represented among formulae. This again reflects the immense variety in formula design. Across England, the average payment per hour across the three main types of provision was £3.96 in PVI settings, £4.08 for nursery class provision and for nursery school provision it was £7.13. The case for providing a higher level of funding for nursery schools rests on their very strong reputation for quality. Ofsted’s annual report for 2015 reported that 58% of nursery schools were graded outstanding (compared with 13% of all early years providers). Where childminders were paid a different rate than other PVI providers (that is, when they were identified as a separate ‘sub-type’ of provision) this rate showed marked variation, sometimes being substantially less than the rate paid for nursery class provision and sometimes substantially more. Most early education provision for 3 and 4 year olds is provided by PVI providers or nursery classes rather than nursery schools which account for less than 4% of provision. We compared the average level of funding per hour received by PVI providers with the average level of funding received for nursery class provision. In 81 local authorities the average payment for nursery class provision exceeded the average payment per hour for PVI provision. Payments for PVI provision were higher, on average, than payments for nursery class provision in 61 authorities. Across the local authorities, the average payment per hour for PVI provision ranged from £3.24 to £5.23. For nursery class provision, average payments ranged from £2.64 to £5.62 per hour. We compared levels of expenditure across the 150 local authorities. Higher levels of overall expenditure on early years provision, higher average payments to PVI settings, and higher average payments for nursery class provision were all associated with local area characteristics. In particular, higher levels of spending were associated with higher proportions of children living in low income households and spending levels also showed regional variation (and in particular, higher payments within inner London). Controlling for these

6
variables, the political control of local authorities (Labour, Conservative or ‘other’) was not associated with the level of expenditure either overall or within sectors. We also examined the size of the nursery class premium. (The nursery class premium for each local authority was calculated as the average payment made for nursery class provision minus the average payment made for PVI provision. In 81 authorities the class premium was positive while in 61 it was a negative figure – indicating that the average rate paid for PVI provision exceeded the average rate paid for nursery class provision.) In keeping with our findings relating to the level of spending across local authorities, we found that the size of the nursery class premium was associated with the proportion of hours provided by the PVI sector. That is, a higher proportion of provision within PVI settings was associated with a larger nursery class premium. The average size of the nursery class premium was larger in Conservative controlled authorities than in Labour controlled authorities (15p compared with 4p). However, when we controlled for the proportion of provision within PVI settings, Labour controlled authorities were associated with a larger nursery class premium than Conservative authorities. At the average level of PVI provision (56%) the nursery class premium in Labour authorities was estimated to be 22p larger for Labour authorities than Conservative authorities. However, more than 80% of Conservative authorities have higher levels of PVI provision than the average (associated with a larger premium) and more than 80% of Labour authorities have less than the average level of PVI provision (associated with a smaller premium). In addition, controlling for the proportion of PVI provision, authorities using formulae with multiple base rates for different subtypes of provision had smaller nursery class premiums than those using formulae with a single base rate.1 Nine local authority areas were selected as case studies to gain a more contextualised understanding of the design of funding formulae. The areas varied in a number of characteristics including political control, area deprivation, region, formula design and the size of the class premium. They illustrated well that formulae need to be understood as individual entities and in relation to local circumstances. The case studies again illustrated the immense variation in formula design. They also suggested that different approaches to design were taken in response to local circumstances including, for example, a need to improve the quality of provision or a shortage of flexible provision. It was also clear that the approach taken in relation to base rates and supplements did not provide a shortcut to gaining an understanding of an explicit or implicit rationale for the formula. 1 When variables for both political control and formula design were included in the model, along with the proportion of provision in PVI settings, neither reached the level of statistical significance.

7
The case studies also drew attention the wide range of operating models of early education providers and to their differing prospects, and vulnerabilities, in relation to changes in funding rates or to an increase in the entitlement from 15 hours to 30 hours. Policy implications Central government plans to introduce a national funding formula for distributing funds from central government to local government (DfE, 2016). The proposals, their origins and, in the light of our research, their likely consequences, are described in this report (see Annex 4).2 The proposed national funding formula will replace the current allocation system using the Dedicated Schools Grant (DSG). The DSG is distributed to local authorities on the basis of their level of expenditure in 2005-06. These allocations may not be closely related either to the needs of local populations or to the cost of provision. The proposals would also modify how local authorities can distribute resources locally. Importantly, the proposals would require all local funding formulae to use a single base rate by 2019-20 and also state that the government is ‘minded’ to disallow supplementary payments based on quality. Alongside the consultation document, the DfE has calculated, for each local authority, the hourly rate of funding each authority would receive in 2017-18 and also (on the basis of some strong assumptions about the distribution of resources within local authorities) an illustrative average hourly rate that a provider might expect to receive in 2017-18. The proposed reforms will generate substantial turbulence in funding levels – across local authorities, across phases within local authorities, across sectors and between providers. The proposals represent a shift in resources across local authorities. The consultation document reports that while 112 local authorities will see an increase in their funding rate, in 38 there would be a reduction in funding (these are described as ‘overfunded’ authorities). However, because it is proposed that 95% of funds are passed on to providers (93% in the first year of operation), in most of these areas providers would receive a higher rate per hour, on average, than was received in 2015-16. In such areas a key question will be whether the reduction in central expenditure can be achieved without either increasing costs for providers or reducing the quality of provision. In some areas the changes to the DSG also represent a shift of resources across educational phases within local authorities. That is, 20 of the 38 ‘overfunded’ authorities received additional funds for schools in 2015-16 as they belonged to the ‘least fairly funded’ local authorities for school provision. In short, in relation to the balance of funding between early years provision and the years of
2 Some of the conclusions presented below arise from the analysis presented in Annex 4.
8
compulsory education, the proposals place much greater control in the hands of central government. Notably however, the balance struck across these educational phases has not been based on an analysis of the efficiency of investing in different phases of education. On the basis of the proposals, and making strong assumptions about the distribution of resources within local authorities, the DfE has calculated an illustrative average hourly rate that a provider might expect to receive in 2017-18. In some authorities the illustrative hourly rate for 2017-18 is lower than the average funding rate received in 2015-16. For nursery class provision, the illustrative rate is lower than the average funding level in 2015-16 in 23 local authorities, for PVI provision the rate is lower than that previously received in five areas and in a further 13 areas the illustrative rate is lower than the average payment to both provider types in 2015-16. In the case of nursery schools, additional funds have been provided to support funding rates although this is only guaranteed for two years, thus putting at risk their long-term viability and so reducing the availability of high quality early years education. The early years national funding formula consultation document describes the impact of the proposals by analysing the local authority budget data used in this study. Our findings suggest that, on the basis of that data, central government cannot be confident as to the consequences of the planned reforms, either in relation to the sustainability of providers or for protecting improvements in the quality of provision. This is for two reasons. First, the Section 251 proforma data does not provide information as to the funding rates received either by individual providers or by groups of providers. Second, it does not provide any insight into the vulnerability of providers of different types and in different areas to the introduction to the 30 hour entitlement. With the prospect of substantial turbulence in funding levels, with increases and decreases in funding seen across local authorities, across sectors of provision within local authorities, and across different providers, some local authorities will inevitably need to give a high priority to ensuring providers remain sustainable. Yet with the proposals that local authorities use a single base rate for all provision, and that 90% of funding flows through that base rate, they will have fewer tools at their disposal. In particular, the consultation states the government is also minded to disallow the inclusion of quality supplements in local formulae. Thus to the extent that formulae have successfully created incentives to improve the quality of provision, those benefits will be removed. The proposals for changes to the funding arrangements for the free early education entitlement are intended to support the delivery of the 30 hour entitlement for working parents of 3 and 4 year olds. That entitlement will see a

9
welcome and substantial reduction in the childcare costs of the families concerned. However, it is also important that reforms are implemented without placing at risk either the sustainability of early education providers or the quality of provision available.

10
1. Introduction The free entitlement to early education in England has a high public profile. The 2015 election campaign saw each of the main political parties include an expansion of the entitlement in their manifesto. Despite this national profile, the pattern of provision of early education varies substantially across the country, and the funding mechanism through which early education is supported also varies across authorities. The world of early years education is complex. Three- and four-year-olds, and some two year olds, are entitled to 570 hours of free early education per year. This entitlement may be provided within nursery schools, nursery classes in primary schools (referred to through this report as nursery classes), in independent schools, in day care settings, in sessional playgroups and by childminders. Indeed, it may be provided at settings which do not sit easily within those categories – by sessional providers offering flexibility, by governor run provision3 or by private or voluntary providers operating within schools. Given the complexity of the early years, creating an effective and efficient funding system for the free early education entitlement is both challenging and of significant policy importance. It potentially affects the sustainability of provision and also its quality and flexibility, it interacts not only with the schools funding system, but also with market-based private provision offered outside the free entitlement. In 2011, following concerns about the inadequacy and inequity of prior funding arrangements, the Government introduced a locally determined Early Years Single Funding Formula (EYSFF) as the mechanism for funding the free early education entitlement (FEEE) across the diverse range of providers.4 This report describes in detail how that policy was implemented at local authority level in England. It draws on budget data from 1505 local authorities and case study evidence relating to nine of those areas to provide a detailed picture of how the local formulae have been variously constructed, how funds have been distributed to different types of providers, and how formulae have addressed quality, deprivation, flexibility and sustainability. The report offers timely insight into the complexity of early years funding as the Government seeks both to amend the funding system and to expand the free early years entitlement to 30 hours per week. Sections 2 and 3 describe the EYSFF policy and its implementation process. Section 4 examines formula design and funding outcomes. Section 5 considers in particular the differences in funding outcomes for two key groups: private voluntary and independent providers (PVI) maintained nursery classes. Section
3 Governor run provision is managed by a school governing body but run, in effect, as a PVI setting rather than as a nursery class. 4 The EYSFF, which distributed funds for the 3 and 4 year old entitlement, is the key focus of this report. Funding for the two year old entitlement is distributed on a different basis, with a national funding rate adjusted according to area costs. Local authorities then fund two year old provision paying the same local base rate to all providers. 5 City of London and the Isles of Scilly have been excluded from the analysis.

11
6 reports findings from nine case study areas, describing the approaches taken to formula design and the factors included in formulae. Section 7 presents conclusions and reflects on the findings in the context of continuing policy change. However, before going on to describe the Early Years Single Funding Formula policy which supports that provision, it is important to understand some of the institutional background to that policy, the institutions which deliver early education, and also the changing policy environment. The free early education entitlement is delivered by a range of institutions among which three main clusters may be distinguished. One long established group of providers comprise maintained schools - primary schools with nursery classes and a much smaller number of nursery schools. A second group emerged from the preschool movement, initially providing parent-led sessional playgroups, though now more likely to be described as preschools and to employ professional staff. The third group comprise private day care settings set up to meet the childcare needs of working parents. It is important to understand that these clusters do not provide an exhaustive set of categories of providers. They do, however, draw attention to some key differences of orientation across different providers. The role of the government in the provision and funding of early years provision has had a faltering history over the past century (see West and Noden, 2016). Indeed, it was not until the 1990s that public funding for the education of all 4-year olds came onto the policy agenda of central government. Until that point, the development of early education services was at the discretion of local authorities. In England in 1994 some 77% of 4 year olds were being educated in maintained schools either full-time or part-time, of whom 51% were in reception classes and 26% in nursery schools or nursery classes (Gillie and Allen,1996).6 Notably, there was very substantial variation across local authorities in the proportion of four-year-olds in nursery classes, ranging from 0% to 61%, while the proportion reported to be attending nursery or reception classes was reported to range from 24% and 95% (DfEE, 1995). In addition to the 77% of 4 year olds attending nursery or reception classes in 1994, the same source reports that 19% attended a private, voluntary or independent setting while 4% had no pre-school place (Gillie and Allen, 1996). The 19% would have included children attending a sessional provider, usually described as a preschool or playgroup and run by voluntary sector providers, and also children attending day nurseries. Against this backdrop of varied provision, central government involvement in early education policy took a leap forward in 1996 when the then Conservative Government introduced a voucher scheme. Parents of four-year-olds could apply 6 Note the statistics quoted here related to all four-year-olds – that is, including four-year-olds attending reception classes. This is because in 1994 there was no uniformity in the age at which children were admitted to reception classes. In all of the figures quoted elsewhere in this report, ‘rising fives’ attending reception classes are excluded.
12
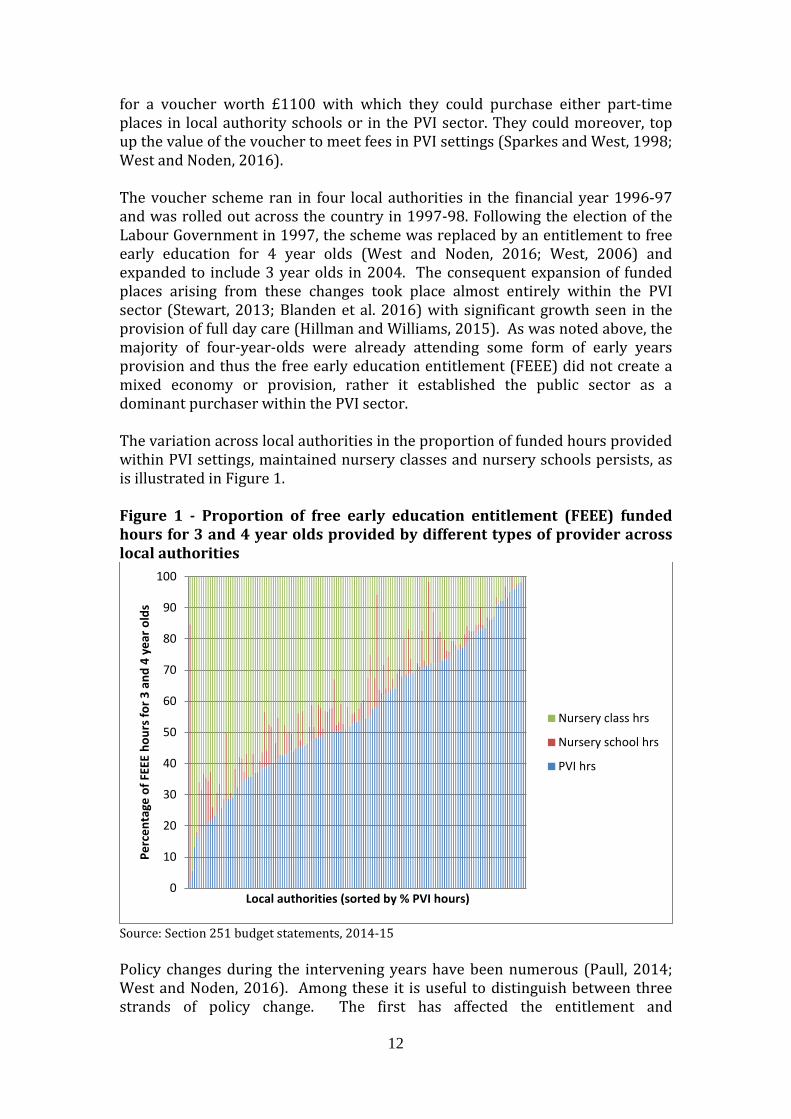
for a voucher worth £1100 with which they could purchase either part-time places in local authority schools or in the PVI sector. They could moreover, top up the value of the voucher to meet fees in PVI settings (Sparkes and West, 1998; West and Noden, 2016). The voucher scheme ran in four local authorities in the financial year 1996-97 and was rolled out across the country in 1997-98. Following the election of the Labour Government in 1997, the scheme was replaced by an entitlement to free early education for 4 year olds (West and Noden, 2016; West, 2006) and expanded to include 3 year olds in 2004. The consequent expansion of funded places arising from these changes took place almost entirely within the PVI sector (Stewart, 2013; Blanden et al. 2016) with significant growth seen in the provision of full day care (Hillman and Williams, 2015). As was noted above, the majority of four-year-olds were already attending some form of early years provision and thus the free early education entitlement (FEEE) did not create a mixed economy or provision, rather it established the public sector as a dominant purchaser within the PVI sector. The variation across local authorities in the proportion of funded hours provided within PVI settings, maintained nursery classes and nursery schools persists, as is illustrated in Figure 1. Figure 1 - Proportion of free early education entitlement (FEEE) funded hours for 3 and 4 year olds provided by different types of provider across local authorities
Source: Section 251 budget statements, 2014-15 Policy changes during the intervening years have been numerous (Paull, 2014; West and Noden, 2016). Among these it is useful to distinguish between three strands of policy change. The first has affected the entitlement and
0
10
20
30
40
50
60
70
80
90
100
Perc
enta
ge o
f FEE
E ho
urs f
or 3
and
4 y
ear o
lds
Local authorities (sorted by % PVI hours)
Nursery class hrs
Nursery school hrs
PVI hrs

13
arrangements for early years provision. These include the expansion of the entitlement from 33 weeks to 38 weeks per year and from 12.5 hours to 15 hours per week, the ‘stretched’ offer7 and the introduction of the single point of entry to reception classes.8 A second strand of policy changes has created a unifying framework for early years provision including consolidating the regulatory framework within Ofsted and introducing the Early Years Foundation Stage as a shared curriculum. The third strand of policy changes relates to how central government funds both early education and how it funds schools. These changes include the incorporation of early education funding into the Dedicated Schools Grant distributed through the ‘spend plus’ mechanism (see Noden and West, 2008), the identification of an early years block within that grant (from 2013-14), and the planned introduction of a national funding formula for early years which was announced in November 2015. The EYSFF policy relates closely to all three of these strands. In relation to the first strand it is of course the key means through which early education provision is supported. In relation to the second strand, it provides another element within the process of unifying the early years field – providing a single mechanism through which a diverse array of providers receive a key element of their funding. In relation to the third strand, the EYSFF provides the lower tier of resource distribution – that is, the mechanism through which local government distributes funding to early education providers (see West and Noden, 2016).
2. The EYSFF policy: objectives and implementation The introduction of the Early Years Single Funding Formula (EYSFF) was announced in June 2007. In a written statement to Parliament Jim Knight MP, then Minister for Schools and 14-19 Learners stated:
all authorities will be required to introduce a new funding formula to cover early years provision in both maintained and PVI settings, and this will incorporate a standardised transparent method for setting the basic unit of funding per pupil. (HC Deb, 25 June 2007, c1WS)
Initial work began with a small number of local authorities described as Formula Development Partners who introduced a single funding formula in 2009-10. All local authorities were provided with guidance describing the steps to be taken in designing a funding formula and with a timetable for that work (DCSF, 2008; 2009a; 2009b). Before going on to summarise the policy objectives stated in the guidance, and to consider local responses, it is important to understand that the EYSFF underwent a difficult birth. By the summer of 2009 the House of Commons Children, Schools and Families Select Committee was aware of alarm among providers of early years education 7 The ‘stretched offer’ enabled parents to take the 570 hours of the free entitlement spread over more than 38 weeks. 8 At the same time as these reforms ‘demand side’ policies such as tax credits and Employer Supported Childcare have also influenced the use of early education and childcare provision.

14
regarding the new funding system. While seeking to create a ‘level playing field’, some providers, most notably nursery schools, were liable to lose out substantially from the new formulae. This, in part, precipitated an enquiry by the Select Committee which reported in 2010 (Children, Schools and Families Committee, 2010). Despite the committee’s reservations, their report concluded that the concept of a single funding formula was not flawed and that the policy should continue. The emerging concerns were also noted within central government. Dawn Primorolo MP, then Minister of State for Children, Young People and Families, wrote to local authority directors of children’s services in October 2009 stating that local authorities will want to ensure that
[while] no child is disadvantaged by the type of provider that they attend… I am clear that the single funding formula should not be used as a vehicle to close, or close by strangulation, good quality nursery school provision.
Then in December 2009 a delay was announced to the introduction of the policy from April 2010 to April 2011 (although local authorities thought to be ready were able go ahead from April 2010).9 Policy objectives and the role of the formula The guidance issued to local authorities set out various ‘core principles’ relating to the development and the operation of the formula (DCSF, 2008 p9). Additions were made to these principles in the 2009 guidance (DCSF, 2009a), and the changes are shown below in italics. The development of an EYSFF should:
• Support effective and efficient distribution of resources at the local level; • Facilitate greater flexibility of provision so that parents have greater
choice in how they use the free entitlement; • Preserve diversity and choice in the market; • Incentivise improvements in the quality of provision and recognise the
ongoing costs associated with quality; • Support the narrowing of achievement gaps and recognise the additional
costs associated with children from deprived backgrounds; • Be clear and transparent (p17).
While these might all be considered to be desirable objectives local authorities would need to strike a balance between the various policy goals. For example, how much of the available resources should be devoted to facilitating flexibility and how much to incentivising improvements in quality? Similarly, the objective to ‘preserve diversity and choice in the market’ was clearly orientated to maintaining stability in current provision and ensuring that a single type of
9 In March 2010, DCSF reported that nine pathfinder local authorities implemented an EYSFF in April 2009, 62 would from April 2010 and 81 from April 2011.

15
provision did not monopolise provision. In contrast, other objectives clearly involve facilitating change, such as facilitating greater flexibility and incentivising improvements in the quality of provision. The point here is not that the objectives were mutually exclusive, but rather that they necessarily involved trade-offs. Also of note are the additions made to the objectives between 2008 and 2009 (shown in italics) and the shift in emphasis to supporting the costs associated with high quality provision rather than merely incentivising improvements. The core principles then continued, listing further items relating to the operation of the formula, specifically addressing the role of the formula in supporting a mixed economy of provision. These are listed in full below. Items have been emboldened to emphasise that the principles did not state that different providers should receive the same level of funding. Rather, they stated that the same factors should be taken into account in determining allocations across sectors, and that the level of funding should reflect the cost of provision. It is also important to note that the guidance allowed a great deal of freedom for local decision making in relation to the design of the EYSFF. With regards to the operation of the formula:
• The same factors should be taken into account when deciding the level of funding for each sector;
• Decisions must be transparent and any differences between the sectors should be justifiable and demonstrable;
• The level of funding should be broadly cost-reflective and all the main cost elements should have been considered explicitly;
• There should be no perverse incentives and any change in the formula must not endanger sufficiency of provision;
• The formula must be based on common cost information from both the PVI and maintained sectors and all costs and public sources of incomes should be considered;
• Settings should be funded on the basis of participation, not places or similar factors. Participation must be counted on a termly basis, at the least, and this will be required in regulation;
• An additional factor to support sufficiency and sustainability will be allowed but this must not be used widely and must have clear criteria;
• The formula must take into account the sustainability of all settings, giving sufficient stability to all sectors to plan for the future and improve quality;
• Transition from the current funding mechanism to the future funding mechanism must be planned and managed carefully, and based on a clear impact assessment;
• The application of the formula in different settings should be based on common operating principles wherever possible; All aspects of the proposed EYSFF must be the result of partnership working with all those involved, and final decisions on structure and operation of the formula should be made only after widespread consultation. (pp17-18) [bold text added, italic text shows additions made to DfE guidance issued in 2009]

16
As well as the numerous core principles to be accommodated, it is also important to reflect on the different function of a single funding formula for providers of different types, and indeed to parents and children. To consider first providers, schools are well used to formula based funding and indeed it is a key element of the quasi-market in which they operate (West et al., 2009). During the years of compulsory schooling, schools are unable to charge for the education they provide – that is, in contrast to conventional markets, they are unable to offer their service at a lower price to attract more children, or at a higher price in order to attract those seeking a premium product. Rather, the quasi-market is designed to encourage quality competition and not price competition.10 On the other hand many PVI providers operate in a conventional market featuring both price and quality competition (Sparkes and West, 1998). Providers may be selling additional hours of childcare to parents who require more than 570 hours of childcare per year or indeed to the parents of children who do not qualify for the free entitlement. In this arena providers are free to set their own prices according to what the market will bear. It is also important to consider that a theme in the debate preceding introduction of the formula was the desire for a ‘level playing field’ (West and Noden, 2016). The metaphor of course implies creating an environment for a fair competition although this could imply a number of different things, for example:
- paying the same amount for the early education of each child within an area (which we might describe as equal funding),
- distributing resources so providers of different types were enabled to provide good quality early education (which we might describe as uniform quality),
- distributing resources so different types of provision should be equally able to cover their costs if they operated at the same level of occupancy (which we might describe as equal sustainability)
Parents, policymakers and other stakeholders may of course have different views as to what constitutes quality in early education. While the ‘uniform quality’ approach to creating a level playing field provides a lever to policymakers to shape the quality of provision, the equal funding and equal sustainability approaches do not. In addition, it is important to note that the role of parental choice also differs in each case. Thus, for example, only if the level playing field implied ‘equal funding’ would parental preferences have no consequence for the level of public expenditure. That is, in the absence of an equal funding approach, if parental preferences change over time and take up increases in a particular type of provider, then the cost to the local authority will also change.
10 Since September 2012 schools can charge for additional hours of early years provision which are not required to provide the FEEE however the quasi-market remains the funding mechanism for most school provision.

17
The implementation process Local authorities were provided with a timeline and a series of steps to follow in developing their formulae. The steps were to set up a working group, establish an understanding of provider costs, design their formula, undertake an impact assessment and develop transitional proposals. The working group was to be representative of providers on a broadly proportionate basis covering nursery classes, nursery schools, day nurseries, playgroups, larger and smaller operators, and settings in deprived and less deprived areas, and from different geographical areas. They were also encouraged to draw on the understanding of representative provider groups such as the National Day Nurseries Association and Preschool Learning Alliance. The first phase of activity was to develop an understanding of provider costs through a cost survey and to develop a separate typical cost model. Appendices to the 2008 guidance (DCSF, 2008) provided examples of how to undertake the cost survey and also an example of a framework for a typical cost model. This included budget lines for more than sixty items (for example Nursery Nurse salary cost or Liability insurance) and five columns corresponding to providers of different types (namely a 2 form entry nursery class, maintained nursery school, PVI day nursery, Preschool, Independent school). One specific issue which the 2008 guidance notes local authorities would face, was whether actual costs or aspirational costs should be included – exemplified by ‘the actual costs which PVI providers typically pay their staff, or the rate that the LA may desire them to pay to attract and maintain staff of the appropriate level of qualification and quality’ (DCSF, 2008, p15). Here it was advised that local authorities should operate within known resource constraints. The approach implied here might be characterised as reflecting an equal sustainability notion of a level playing field in which, owing to resource constraints, funding allocations would, for example, recreate existing differences in pay rates across sectors. The broad structure of the formula was described in DCSF guidance as (DCSF, 2008): ( Basic hourly
rate + Hourly
supplements ) X Number of
hours participation
+ Other supplements
This rate may vary depending on the “type” of provider
Additional amounts per hour for extra “need” or to recognise policy objectives such as improving quality
The method of counting the level of participation must be the same for all providers
In some circumstances, (e.g. sufficiency) it may be appropriate to provide lump sum amounts

18
The guidance stated that two broad approaches had emerged from work with the Formula Development Partners – either a single base rate with supplements or multiple base rates with fewer supplements – and that either of these approaches to formula design was acceptable. While the structure of the formula was retained from 2008 onwards, the role of different elements of the formula has changed over time. There were changes of emphasis in the guidance and also in subsequent regulations relating to formula design, for example, in relation to the function of base rates and supplements. The 2008 and 2009 guidance documents both present the particular combination of base rates and supplements as if this were simply an arithmetical choice. Base rates could by themselves address cost differences between types of setting but so too could supplements, for example supplements could relate to:
rent, rates, a ‘London fringe’ uplift, an administration element, and a payment of head teacher costs for nursery schools (DCSF, 2008, p18).
On the other hand in the next paragraph it was also stated that supplements could be used to address the needs of individual children or to provide incentives to drive local objectives. The latter role, of driving local objectives, was to become more prominent in subsequent guidance. Similarly there were shifts of emphasis in relation to base rates. For example, advice as to the likely content of future guidance and regulations, which was made available to local authorities in March 2009 and based on conclusions drawn from work with Formula Development Partners, provided a strong message in relation to base rates in particular, stating:
Authorities who set one base rate for all PVI settings and one for all maintained settings are continuing unacceptable differences between settings which cannot be defended in a single formula. Rates must be set to enable a level playing field in the market and encourage quality of provision through raising the qualifications and training of staff regardless of where they work. (DCSF, 2009b) [Bold text in the original]
While the letter does not describe what would constitute acceptable and unacceptable cost differences, it is clear that the letter wished to emphasise an ‘equal funding’ or ‘uniform quality’ notion of the level playing field. The subsequently issued Schools and Early Years Finance Regulations 2012 relating to the local funding formula however took a slightly different approach. Differential rates of funding could be applied on the basis of ‘unavoidable cost differences’ between different types of provider – with ‘unavoidable’ relating to costs incurred by virtue of a statutory requirement. (Notably, the scale of differential funding could only be based on actual cost differences in the case of business rates and Private Finance Initiative contributions.) On the other hand after a consultation (DfE, 2012a), subsequent statutory guidance proposed simplifying formulae and made further stipulations in

19
relation to both base rates and supplements stating that the number of base rates should be kept to a minimum and that any supplements should ‘help drive positive outcomes for children’ (DfE, 2013a; 2014a).11 In short, at different times the base rates and supplements have been described in different ways, as summarised in Table 1, addressing cost differences, differentiating on the basis of unavoidable cost differences or providing incentives. Table 1 - Changes in the identified purposes of base rates and supplements Base rate Supplement 2008 and 2009 guidance
Used in combination to address cost differences Or to drive positive outcomes
March 2009 ‘captured learning’
Must not use a single rate for PVIs and a single rate for maintained schools as this would be “continuing unacceptable differences”
To reflect needs of settings
Regulations 2012
Funding may differentiate between settings on the basis of “unavoidable cost differences” as defined in statute
To incentivise desired behaviour
Permitted list includes both cost items and incentives, though factors must not be based on actual costs
Guidance 2013 Must address unavoidable cost differences, number should be kept to a minimum
Should help drive positive outcomes
3. Formula design and funding outcomes: all local authorities 2014-15
As well as promoting the simplification of formulae, the 2012 consultation (DfE, 2012a) announced that information relating to budget allocations arising from the formula would be collected from local authorities and published. This information provides the data examined in this section. Local authorities were required to submit information on a proforma provided by the DfE. The funding proforma includes several rows relating to the single funding formula comprising base rates, supplements paid relating to deprivation, quality, flexibility, sustainability and ‘other’ supplementary items. The dataset is administrative rather than designed for research purposes. Nevertheless it is the main source of information regarding expenditure on the free early education entitlement (e.g. National Audit Office, 2016; Public Accounts Committee, 2016). The analysis which follows uses the 2014-15 budget data supplemented by local
11 Notably the relevant 2012 Statutory Guidance (DfE, 2012) also instructed that local authorities ‘should not intervene in the private business of providers outside the provision of the entitlement’.
20
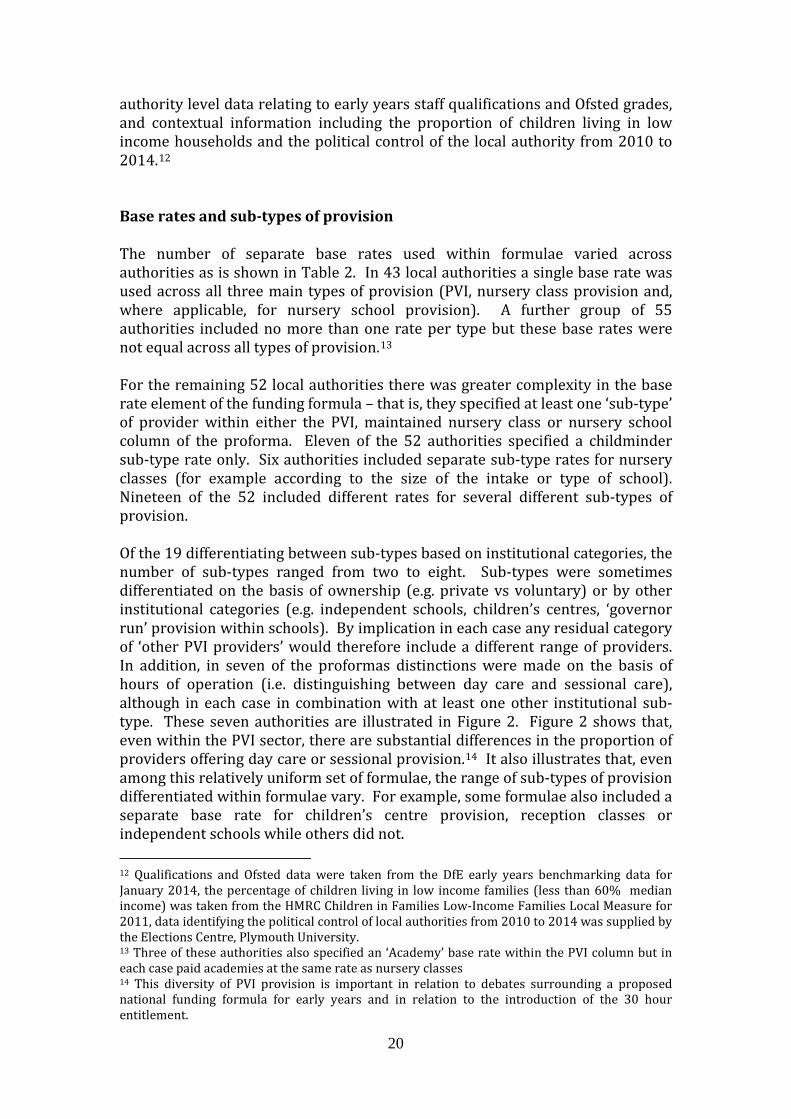
authority level data relating to early years staff qualifications and Ofsted grades, and contextual information including the proportion of children living in low income households and the political control of the local authority from 2010 to 2014.12 Base rates and sub-types of provision The number of separate base rates used within formulae varied across authorities as is shown in Table 2. In 43 local authorities a single base rate was used across all three main types of provision (PVI, nursery class provision and, where applicable, for nursery school provision). A further group of 55 authorities included no more than one rate per type but these base rates were not equal across all types of provision.13 For the remaining 52 local authorities there was greater complexity in the base rate element of the funding formula – that is, they specified at least one ‘sub-type’ of provider within either the PVI, maintained nursery class or nursery school column of the proforma. Eleven of the 52 authorities specified a childminder sub-type rate only. Six authorities included separate sub-type rates for nursery classes (for example according to the size of the intake or type of school). Nineteen of the 52 included different rates for several different sub-types of provision. Of the 19 differentiating between sub-types based on institutional categories, the number of sub-types ranged from two to eight. Sub-types were sometimes differentiated on the basis of ownership (e.g. private vs voluntary) or by other institutional categories (e.g. independent schools, children’s centres, ‘governor run’ provision within schools). By implication in each case any residual category of ‘other PVI providers’ would therefore include a different range of providers. In addition, in seven of the proformas distinctions were made on the basis of hours of operation (i.e. distinguishing between day care and sessional care), although in each case in combination with at least one other institutional sub-type. These seven authorities are illustrated in Figure 2. Figure 2 shows that, even within the PVI sector, there are substantial differences in the proportion of providers offering day care or sessional provision.14 It also illustrates that, even among this relatively uniform set of formulae, the range of sub-types of provision differentiated within formulae vary. For example, some formulae also included a separate base rate for children’s centre provision, reception classes or independent schools while others did not. 12 Qualifications and Ofsted data were taken from the DfE early years benchmarking data for January 2014, the percentage of children living in low income families (less than 60% median income) was taken from the HMRC Children in Families Low-Income Families Local Measure for 2011, data identifying the political control of local authorities from 2010 to 2014 was supplied by the Elections Centre, Plymouth University. 13 Three of these authorities also specified an ‘Academy’ base rate within the PVI column but in each case paid academies at the same rate as nursery classes 14 This diversity of PVI provision is important in relation to debates surrounding a proposed national funding formula for early years and in relation to the introduction of the 30 hour entitlement.

21
Table 2 - Numbers of local authorities taking different approaches to base rates Approach to base rates Total One base rate 43 One base rate per type 55 At least one ‘sub-type’ 52 Of which: Childminder sub-type 11 Class sub-types (e.g. by size) 6 Multi-institutional sub-types 19 By other criteria 16 Source: Section 251 budget statements, 2014-15 The final group of sixteen authorities included different base rates for provision identified not solely on the basis of institutional type. Additional sub-divisions could be based on, for example, the size of the provider, staff qualifications, access to outdoor space, or for children with different attendance patterns (e.g. attending during different terms of the year or attending on a part-time or full-time basis). Figure 2 - Percentage of hours provided by different sub-types of provider among local authorities specifying separate base rates by sub-types of provider
Source: Section 251 budget statements, 2014-15 Across local authorities, on average 90% of funds were budgeted to be allocated through the base rates. The budget proforma included lines for four specific types of supplement – a compulsory deprivation supplement, and optional supplements for quality, flexibility, sustainability and ‘other’ supplements. For each specific optional supplement, more than half of proforma returns did not include any money budgeted in the specific supplement line. The ‘other’ supplement line however included a budgeted allocation in 99 of the proformas.
0
10
20
30
40
50
60
70
80
90
100
PVI Full day care
PVI Childminder
PVI Sessional
PVI Independent school
Children's centre
Nursery school
Reception
Academy
Schools

22
Table 3 - Average across 150 local authorities in proportion of funding allocated through different formula elements
% N Of which make payments to:
PVI Nursery classes Nursery schools Base rates 90 150 Deprivation 4 150 Quality 2 70 67 55 39 Flexibility 1 43 41 31 19 Sustainability 0.2 20 10 9 9 Other supplements 3 99 42 51 80 Source: Section 251 budget statements, 2014-15 For each provider type, the proportion of the aggregate funds budgeted through base rates and supplements varied. While around 90% of PVI and nursery class funding flowed through the base rate element this was true for around 70% of nursery school funding. As supplementary payments could be made under four types of optional supplement it was possible for the supplements to appear in sixteen different combinations (e.g. quality and sustainability, flexibility and other, quality only etc.). Fifteen of the sixteen possible combinations of supplements were represented among formulae. The most common patterns were ‘other’ supplements only (39), quality and other (24), no supplements (18) and quality only (16). Six formulae recorded allocating funding through all four of the optional supplement lines. Table 4 shows the combination of the number of base rates and supplements across the formulae. The 2014-15 data suggests formulae using a single base rate distributed the same proportion of funds through base rates as those using multiple rates. The difference in the number of supplements used in association with formulae including multiple base rates compared with a single base rate (1.8 vs 1.4) is statistically significant but not substantively large. That is, the two types of model proposed in the 2008 and 2009 guidance – a single base rate with a relatively high level of supplements or multiple base rates with fewer supplements – are not strongly reflected in the data. Table 4 - Approach to base rates and number of optional supplements used across local authorities
Base rates Number of optional supplement types Mean
(range = 0-4) N %
funds 1+ 2+ 3+ 4
Single base rate 43 89 88% 58% 30% 9% 1.8 3 base rates 55 90 88% 39% 9% 0% 1.4 Sub-types 52 89 88% 40% 17% 4% 1.5 Source: Section 251 budget statements, 2014-15

23
A quality supplement was the specific optional supplement type most frequently used (70 formulae). In 28 cases a criterion for receiving the supplement was specified and it related to staff qualifications and in 22 cases the supplement was reported to be based on an Ofsted judgement (five authorities used both qualifications and Ofsted). In addition, as we saw in relation to base rates, a small number of authorities included a qualifications criterion to determine which base rate would be payable. Payments through a flexibility supplement were present for 43 authorities and, as we saw earlier, a small number incorporated flexibility into their criteria for distinguishing between sub-types of provision. Smaller numbers made allocations listed in the sustainability and other supplements lines of the proforma. Average funding levels for PVI providers, nursery classes and nursery schools As we saw earlier, nursery schools were treated somewhat differently within single funding formulae. For England as a whole, the average funding outcomes per hour for PVI, nursery class and nursery school provision under each of the budget lines are shown in Table 5. The average payment per hour for nursery schools through five of the six lines exceeded the average payments both for PVI settings and for maintained nursery classes. The only exception related to quality payments for which the average for nursery classes was slightly higher than for nursery schools. In addition we see that the largest discrepancies were either through base rate allocations or ‘other’ supplement items. Table 5 - Average payment per hour through different formula elements across England (470m hours of provision, zero values are included in the calculation of averages)
PVI Nursery class Nursery school
Base rate £3.68 £3.66 £5.07 Deprivation £0.12 £0.23 £0.32 Quality £0.09 £0.13 £0.10 Flexibility £0.03 £0.02 £0.05 Sustainability £0.00 £0.00 £0.13 Other £0.03 £0.05 £1.44 Total £3.96 £4.08 £7.13
Source: Section 251 budget statements, 2014-15 Nursery schools face disproportionate costs compared with other providers as they are required to employ a headteacher and, when compared with nursery classes within primary schools, must cover all premises costs and other overheads from a relatively small number of pupils. The particular costs associated with nursery school provision were acknowledged within the 2008 implementation guidance (where it was also stated that there was no intention to threaten the viability of nursery schools through the introduction of the formula) (p55, DCSF, 2008).

24
The case for treating nursery schools as a special case within formulae however also rests on their very strong reputation for quality. Ofsted’s annual report for 2015 reported that 58% of nursery schools were graded outstanding (compared with 13% of all early years providers). Childminder base rates In 35 local authorities a separate base rate was specified for childminders as opposed to other types of PVI provider. In each case, the number of hours anticipated to be provided by childminders was always small, representing less than 1% of the total hours provided across England. Variation across authorities in the base rates for childminders was particularly marked. While the average base rate payable to childminders was £4.24 per hour, the range in base rates was from £2.47 per hour to £7.06 per hour. The value of the childminder rate was compared with the base rate payable to nursery classes (or, for local authorities with no provision within nursery classes, the modal base rate for PVI providers). The variation was from 63% to 189% of the value of the nursery class / modal PVI base rate (with a mean across local authorities of 118%). Budgeted funding outcomes for nursery classes compared with PVI providers We now consider the average funding outcomes for two key provider groups, PVI providers and nursery classes. Together they provide the majority of free entitlement hours for 3 and 4 year olds. Figure 3 illustrates the gap in average funding per hour for PVI settings and maintained classes, showing to which budget element (base rates or supplements) the gap in the average funding rate was attributable. Each vertical bar represents a local authority, showing differences in the average funding per hour budgeted to be paid to PVI providers and maintained settings. The bar for an individual local authority may extend both above and below the horizontal. Elements shown above the horizontal axis indicate that the average payment to PVI providers exceeded the average payment to maintained nursery classes, and vice versa for elements extending below the horizontal axis. The colour of the line indicates whether the difference in the average funding rate arose from a difference in base rates (blue lines), deprivation supplements (red), quality supplement (green), flexibility (purple), sustainability (turquoise) or other (orange). For each of the three groups the grey line shows the net difference in average payments per hour for PVI providers compared with maintained nursery classes. The first block of authorities shows those using a single base rate for all providers. Consequently there could be no difference in average funding levels arising from the base rate element and hence there are no blue lines in that block. We also see that despite operating with a single base rate, some of the formulae allocate relatively substantial additions to schools through supplements, most notably quality supplements based on employing qualified teachers. In the second and third blocks, most of the lines are coloured blue,

25
Figure 3- Source of difference in average funding outcomes for nursery classes and PVI providers
Source: Section 251 budget statements, 2014-15
-2.00
-1.50
-1.00
-0.50
0.00
0.50
1.00
1.50
Clas
ses
rece
ive
mor
e
D
iffer
ence
in £
per
hou
r
PVI
re
ceiv
e m
ore
FEEE funding per hour (PVI compared with class) Single base rate One rate per type Base rates for sub-types
Other
Sustainability
Flexibility
Quality
Deprivation
Base rate
Labour council
Conservative council
Other council
Net difference (PVI vs class)

26
indicating that most of the net difference in average payments were attributable to differences in base rates. Across all three blocks, red lines tend to appear below the horizontal rather than above it. This indicates that funding allocated through deprivation supplements tends to benefit children attending schools rather than PVI providers. Conversely, where there are differences in average payments arising from a flexibility supplement, shown in purple, these tend to benefit PVI providers (therefore appearing above the horizontal line). It is also apparent formulae including a single base rate were more likely to have average funding outcomes favouring schools rather than PVI providers (67% with higher average funding levels for nursery class provision) compared with formulae with separate base rates for different sub-types of provision (44% of which had higher funding rates for nursery class provision. (The nine case study areas discussed later in the report are also labelled on the diagram.15) A key interest was in the funding outcomes arising from different EYSFF, and in particular the funding per hour received by maintained nursery classes compared with PVI providers. The average funding levels per hour for PVI providers and maintained nursery classes across local authorities are shown in Figure 4. Figure 4 - Local authorities’ average £ per hour paid to maintained nursery classes and PVI providers
Source: Section 251 budget statements, 2014-15
15 Pseudonyms have been used because interviewees were told that no individuals or areas would be named in reports arising from the research.
2.00
3.00
4.00
5.00
6.00
2.00 3.00 4.00 5.00 6.00
Aver
age
£ pe
r hou
r pai
d to
PVI
Average £ per hour paid to maintained nursery classes

27
The figure illustrates that while 81 local authorities anticipated spending more per hour on average for maintained nursery class provision than for PVI provision (shown below the diagonal), 61 authorities anticipated spending more per hour on PVI provision than on maintained nursery class provision. (Proforma statements for five authorities did not report any funds budgeted for nursery classes and these are not shown in the diagram.) Across the local authorities, the average payment per hour for PVI provision ranged from £3.24 to £5.23. For nursery class provision, average payments ranged from £2.64 to £5.62 per hour. One key interest was in identifying factors associated with the difference in average funding outcomes per hour for maintained nursery class provision compared with PVI provision. We describe this as the ‘nursery class premium’, calculated by subtracting the average expenditure per hour at PVI settings from the average expenditure per hour for nursery class provision. Thus in an authority which spent more per hour on nursery class provision than on PVI provision, the nursery class premium was positive and for the 61 authorities where expenditure per hour in PVI settings exceeded that in nursery classes, the nursery class premium was a negative figure. In relation to the nursery class premium, two related potential explanatory hypotheses were proposed. First, we wished to examine whether the political control of local authorities was related to the size of the nursery class premium. In short, nursery class provision was more widespread and long established in many Labour controlled, urban areas (see West and Noden, 2016) and we wished to examine whether, in Labour controlled areas, a commitment to public provision of early education through schools was reflected in higher average EYSFF allocations to schools than to PVI settings. A related potential explanatory factor for differences in spending levels across sectors was also considered: we examined whether, in areas in which one type of provider predominated, the dominant sector could exert greater influence on the design of the formula (for example through the early years reference group) which could then be reflected in consequent funding outcomes. Finally, we also examined whether the size of the nursery class premium was associated with the approach taken to base rates – that is, the use of a single base rate, one base rate per type, or multiple base rates. As a first step, we also examined area characteristics that were associated with the average level of expenditure in nursery class settings, in PVI settings and the average level of expenditure across all types of setting. Levels of average spend per hour across local authorities We examined whether the dependent variables (total expenditure per hour, expenditure per hour on nursery class provision and expenditure per hour on PVI provision) were associated with local area characteristics. The area characteristics comprised the region, the level of area deprivation and the balance of provision between PVI and maintained nursery class and nursery school provision. All of these characteristics have played a role in the

28
distribution of resources to local authorities from central government and this may be reflected in the expenditure levels within local authorities (see West and Noden, 2016). In addition we also examined the political control of the local authority. (Descriptive statistics, correlations and multiple regression models relating to the discussion are shown in Annex 1, in which Models 1 to 3 relate to the level of spending.) In relation to the average level of expenditure across all types of provision (Annex 1 Table A1.4, Model 1), higher expenditure was associated with area deprivation. A one percentage point increase in the proportion of children living in low income households was associated with a 2p increase in the hourly rate paid to providers. Expenditure levels in inner London were 75p higher than in the reference region (Yorkshire and Humberside) and this difference was statistically significant. In addition each percentage point increase in the proportion of provision in nursery schools was associated with a 1p increase in overall expenditure. Controlling for the other variables in the model, political control was not significantly associated with the level of overall expenditure. In relation to average spending per hour in PVI settings (Annex 1 Table A1.4, Model 2) again deprivation was associated with a higher level of expenditure per hour (1p for each 1 percentage point increase). Inner London authorities again spent more than authorities in the reference region (Yorkshire and Humberside) as did authorities in the South East, though authorities in the North East, North West and West Midlands all spent less per hour than the reference region. In addition, as the percentage of provision taking place within the PVI sector increased the amount spent per hour in PVI settings decreased by about half a penny (£0.004). Once again, political control was not significant. Finally, in relation to spending per hour on nursery classes (Annex 1 Table A1.4, Model 3), again spending increased by 2p for each one percentage point increase in the proportion of children from deprived households and spending was significantly higher in inner London (£0.49). Interestingly, as the proportion of provision within the PVI sector increased by one percentage point, expenditure per hour within nursery classes increased by 1p, and the same increase in the hourly spend on nursery classes was associated with a one percentage point increase in the level of provision in nursery schools. (Again, political control was not significantly associated with expenditure.) Thus a higher proportion of provision within PVI settings was associated with a lower average level of spending at PVI settings (Model 2). Meanwhile a higher level of provision in PVI settings was associated with a higher average level of spending in schools (Model 3). The notable absence of differences in expenditure levels according the political control of local authorities is illustrated in Table 6. It shows the local authority average levels of expenditure across Labour, Conservative and other areas in reported average spending per hour within maintained nursery class settings,

29
PVI settings, nursery schools and across all settings.16 We see that the Conservative controlled areas and ‘other’ areas planned to spend more, on average, per hour on maintained nursery classes than Labour controlled areas and, conversely, that Labour controlled areas spent more per hour on average at PVI settings than was spent in Conservative controlled areas. However, none of the differences shown are statistically significant. Nevertheless, it is perhaps noteworthy that the differences in average spending levels across sectors were in the opposite direction than had been hypothesised. Table 6 - Average across local authorities grouped by political control in average spend per hour of provision in different types of provision
Political control N
Average spending per hour
Nursery classes
PVI settings
Nursery schools
All settings
% hrs provided in PVI settings
Conservative 53 £4.09 £3.93 £7.19 £4.05 71
Labour 67 £4.03 £3.99 £7.26 £4.17 41
Other 25 £4.15 £3.97 £7.02 £4.17 59
Total 145 £4.07 £3.97 £7.19 £4.13 Source: Section 251 budget statements, 2014-15 Nursery class premium Moving on to consider the factors associated with the nursery class premium, as was noted earlier we had hypothesised that the premium may be associated with the political control of local authorities or with the presence of a dominant sector. (The relationship between the nursery class premium and the proportion of provision within the PVI sector is shown in Annex 1 Table A1.5 Model 4a.) The proportion of provision within the PVI sector was significantly associated with the nursery class premium. At the average level of PVI provision (56%) the nursery class premium was £0.11. A one percentage point increase in the proportion of provision within the PVI sector was associated with an increase in the nursery class premium of 1p (and conversely a decrease of one percentage point with a decrease in the nursery class premium of 1p). This is not surprising when we consider our findings in relation to the level of expenditure described earlier. As the proportion of provision in the PVI sector increased across authorities, the level of spending on PVI provision fell while the level of spending on nursery class provision increased. Our original hypothesis was however that a dominant sector (for example majority provision within the PVI sector) may exert greater influence over the formula design process and that this would be reflected in formula outcomes (a smaller or negative nursery class
16 Care should be taken here as the figures in Table 6 comprise the average spend across local authorities in the average spend per hour on provision within the maintained nursery class, PVI and nursery schools.
30
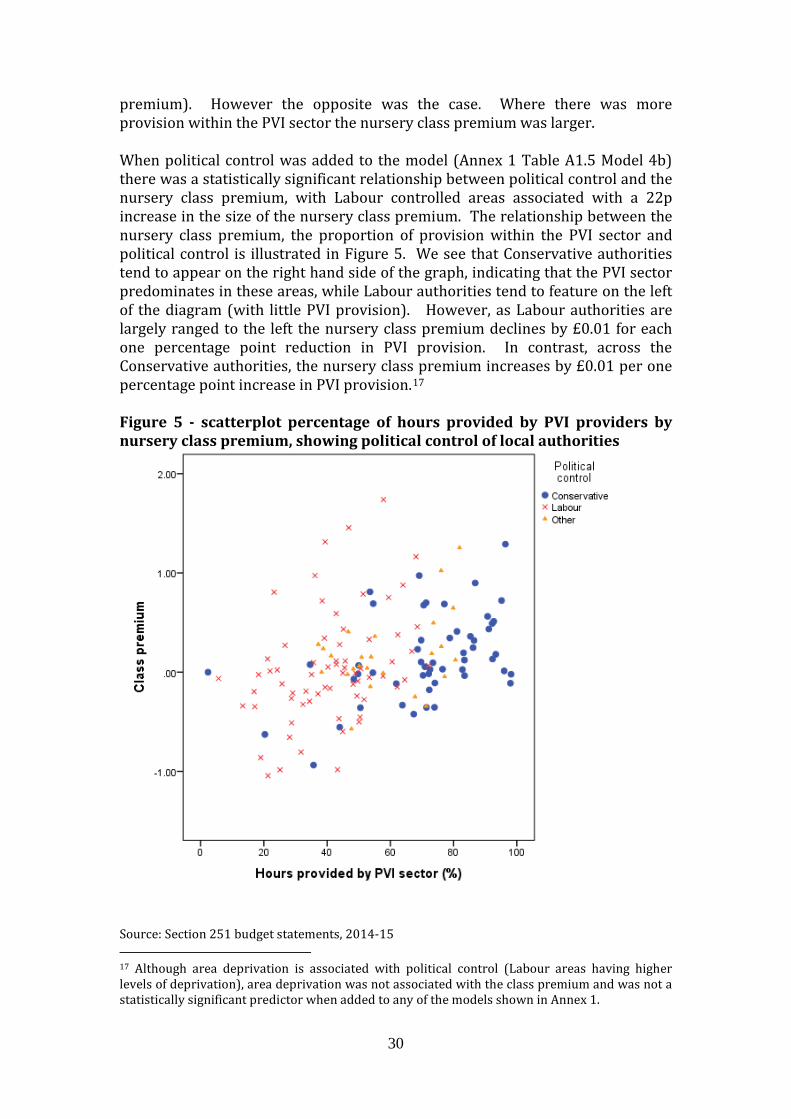
premium). However the opposite was the case. Where there was more provision within the PVI sector the nursery class premium was larger. When political control was added to the model (Annex 1 Table A1.5 Model 4b) there was a statistically significant relationship between political control and the nursery class premium, with Labour controlled areas associated with a 22p increase in the size of the nursery class premium. The relationship between the nursery class premium, the proportion of provision within the PVI sector and political control is illustrated in Figure 5. We see that Conservative authorities tend to appear on the right hand side of the graph, indicating that the PVI sector predominates in these areas, while Labour authorities tend to feature on the left of the diagram (with little PVI provision). However, as Labour authorities are largely ranged to the left the nursery class premium declines by £0.01 for each one percentage point reduction in PVI provision. In contrast, across the Conservative authorities, the nursery class premium increases by £0.01 per one percentage point increase in PVI provision.17 Figure 5 - scatterplot percentage of hours provided by PVI providers by nursery class premium, showing political control of local authorities
Source: Section 251 budget statements, 2014-15 17 Although area deprivation is associated with political control (Labour areas having higher levels of deprivation), area deprivation was not associated with the class premium and was not a statistically significant predictor when added to any of the models shown in Annex 1.

31
Finally, we examined whether the size of the premium was related to the number of base rates used in the formula (Annex 1 Table A1.5 Model 4c). The reference category was authorities using a single base rate for all types of provision. In this model the negative association between the use of multiple base rates and the size of the nursery class premium approached, but did not reach, the conventional level for statistical significance. In addition when the approach to base rates was included in the model the political control of the authority also ceased to be statistically significant. When the political control of the local authority was removed as a predictor (Annex 1 Table A1.5 Model 4d) this produced the most parsimonious model which is represented in Table 7. As can be seen the nursery class premium is £0.17 for an authority using a single base rate, and with the average proportion of provision within the PVI sector (56%). And for each one percentage point increase in the proportion of provision within PVI settings, the nursery class premium increases by £0.01. Finally, the nursery class premiums in areas with one base rate for each main type of provision do not differ significantly from those with a single base rate. However nursery class premiums are significantly lower in areas with multiple base rates. Table 7 – Model predicting the nursery class premium Adjusted square = 0.155 B Nursery class premium at average level of PVI provision (intercept) 0.17* One percentage point increase in % of hrs provided by PVI settings 0.01** Formula with one base rate per type -0.01 Formula with multiple base rates -0.19* Note: The coefficients (B) represent pounds and pence. **p<0.01, * P<0.05 The relationship between the proportion of PVI provision and the nursery class premium is consistent with several plausible interpretations. First, minority providers may be particularly valued. That is, formulae may have been designed in order to protect a mixed economy of provision or to encourage greater diversity of provision. For example, in an area dominated by nursery class provision in schools, the formula may have been designed to give greater support to PVI providers which may be more likely to offer more flexible hours. Conversely, in areas with very few nursery classes, formulae may have been designed to ensure primary schools had an incentive to continue providing early years education. A second plausible interpretation is that minority providers place less pressure on total budgets than majority providers. In short, it may be easier to be relatively generous to a small segment of provision. Third, in local areas with relatively few maintained nursery classes, those classes may have been

32
deliberately located in low income areas unlikely to be well served by a PVI market.18
4. Case study formulae Nine local authority areas were selected as case studies. They were selected to ensure they reflected variation in a number of characteristics. They varied by political control from 2010 to 2014 including four Labour authorities, four Conservative and one which had both a Liberal Democrat administration and no overall control during the period. The areas varied in relation to deprivation with four authorities drawn from the most deprived quartile of areas (Braxfield Borough, Arabin, Foxberry and Comerford). The case study areas were drawn from a number of different regions (three from the North West and one from each of the East, South East, North East, East Midlands and West of England). Three were selected where the EYSFF used a single base rate, three with one base rate per type and three using multiple base rates (as shown in Figure 3). This was to ensure that variation in the range of approaches to formula design which were observed in the Section 251 proforma data were reflected across the cases. In this section we present findings from the case studies. A more detailed description of each of the cases can be found in Annex 3. Table 8 - Characteristics of nine case study areas19 PVI % High
deprivation Comerford Large town <30% Lab Arabin City <30% Lab Dalrymple Metropolitan
authority Lab
Braxfield Borough Outer London borough
Lab
Foxberry Metropolitan authority
Lab
Kneller City Other Beecroft Rural >80% Con Howsonshire Large shire county >80% Con Whitbreadshire Large shire county >80% Con
18 To investigate this relationship further we calculated a nursery class premium excluding all funding flowing through the deprivation supplement. However the relationship between the nursery class premium and the proportion of hours provided in PVI settings remained statistically significant. An alternative possibility is that in areas with little nursery class provision the type of provision may itself be taken as a marker for need. 19 Pseudonyms have been used as interviewees were told no individuals or areas would be named in any reports arising from the project.

33
The average funding per hour for free early education entitlement provision in PVI, maintained nursery classes and nursery schools is shown in Table 9, along with the percentage of overall spending on the 3 and 4 year old entitlement which was reported as central expenditure or contingency funding. As was represented in Figure 3, we see in Whitbreadshire, Foxberry, Kneller and Howsonshire, average funding outcomes per hour were higher for provision in maintained nursery than in PVI settings. In contrast in Arabin and Comerford, average payments for PVI provision were higher than for nursery classes. In relation to nursery school provision funding per hour was highest in Beecroft and lowest in Arabin, Braxfield Borough and Howsonshire. Table 9 - Case study areas’ average funding per hour of provision in different types of setting, and percentage of funds reported as central expenditure or contingency spending20 Average per hour
Central spending21
Contingencies22
PVI Nursery classes
Nursery schools
Comerford 3.93 3.59 1% 0% Arabin 4.22 3.71 4.30 2% 5% Dalrymple 4.18 4.09 5.57 8% 1% Braxfield Borough 4.39 4.23 7.01 4% 0% Foxberry 3.65 4.24 10% 1% Kneller 4.00 4.36 6.36 11% 0% Beecroft 3.64 3.77 7.90 6% 6% Howsonshire 4.03 4.39 5.44 3% 0% Whitbreadshire 4.13 5.03 6.79 9% 2% Source: Section 251 budget statements, 2014-15 The proportion of FEEE provision within nursery classes in 2014-15 echoed the pattern of the nursery school and nursery class provision for four-year-olds reported in 1994-95, as is shown in Figure 6. In each local authority Schools Forum papers relating to the single funding formula were examined and a local authority officer was interviewed. These sources of information were supplemented where possible with further documentary sources (e.g. Early Years Reference Group papers), local authority held data and interviews with stakeholders who had knowledge of local funding arrangements and involvement in the design of the local funding formula. Interviews were carried out with a total of 47 interviewees, 22 of whom were local authority officers working either in finance teams or early years teams and
21 Central spending included a wide range of items including the cost of additional support for children with Special Educational Needs and Disabilities, training grants, childminder drop ins as well as interventions with providers in response to concerns raised by Ofsted and the costs associated with 22 Contingency funding was retained, for example, to cover the cost of increased take up during the year,

34
22 of whom were early education providers (e.g. PVI setting managers or headteachers).23 Figure 6 - Percentage of free early education entitlement for 3 and 4 year olds provided within nursery classes in 2014-15 compared with percentage of 4 year olds attending nursery classes or nursery schools in 1994-95
*Local government boundaries changed between 1994-95 and 2014-15 Source: Section 215 budget statements 2014-15 and DfEE (1996) To understand the case studies, described below, it is useful to make some distinctions in the approaches used relating to base rates and to supplements. Base rates could provide equal funding across types of setting or strive to create equal sustainability across settings or could be unequal for other reasons. The phrase ‘equal sustainability’ suggests base rates were intended to enable different types of provider to break even at a particular level of occupancy. (Of course, it should be recognised that in reality the costs of different settings vary and so this should perhaps be regarded more as an aspiration or rationale rather than an achievable goal.) Authorities could also allocate unequal base rates to different types of provider for other reasons. Two rationales for unequal base rates were present. In some cases unequal base rates were coupled with a supplementary payment intended as an incentive to lower funded PVI providers to employ staff with higher qualifications, and in others it was linked with a specific cost difference between sectors. We may also distinguish between types of supplements. Some were only payable to particular types of provider and based on differences in provider costs (referred to as ‘type-specific’ supplements). ‘Equal supplements’, in contrast, refers to those payable at the same rate to different types of provider, and 23 Local authority interviewees comprised 11 members of early years teams and 11 finance officers. Providers comprised 14 PVI managers (two of whom were also members of the schools forum), four headteachers (two of whom were members of the schools forum), three childminders, one other early years representative who was a member of a schools forum and four interviewees not linked with the case study areas (a DfE representative, a representative from a provider group, and two other providers).
0102030405060708090
100
1994-95
2014-15

35
‘proportionate supplements’ refer to cases where the supplement was determined as a proportion of the base rate paid to the provider. The different approaches to base rates and optional supplements are presented first, followed by a discussion of the implementation of the compulsory deprivation supplement. Approaches taken to base rates and optional supplements are addressed first because, within some formulae, there was a clear interaction between these elements. Howsonshire’s formula is described first. The formula was relatively simple, involving multiple base rates but no optional supplements. Whitbreadshire and Beecroft are then described, both of which featured a single base rate with optional supplements of different types, including a quality supplement payable on the basis of staff qualifications. The third group of cases comprises Dalrymple, Kneller and Foxberry. These formulae include both varying base rates and supplements which included a quality supplement based on staff qualifications. Comerford is then described separately as almost all provision was funded through a single base rate with no optional supplement for quality but rather a supplement relating only to flexibility. Finally Arabin and Braxfield Borough are considered, both of which provide unequal payments to providers of different types which arise from specific cost differences, and neither of which include a quality supplement based on qualifications. Providers’ perspectives on some aspects of the local formula or its operation are also included in the discussion. These are particularly important as they illustrate the diversity of types of providers, their different models of operation and how they interact differently with the local funding formula. Equal sustainability – the case of Howsonshire The Howsonshire formula was heavily based on a cost analysis carried out in 2009. It included six separate base rates with no optional supplements. It can be understood to closely resemble one of the models recommended in the 2008 and 2009 implementation guidance (DCSF, 2008; 2009a) – a formula with several base rates and few supplements. As we see in Table 10, the separate rates, listed in order of the number of hours provided, were for PVI preschools, PVI day nurseries, maintained nursery classes, PVI independent schools, maintained nursery schools and childminders. PVI preschools were distinguished from PVI day nurseries according to the number of weeks they were open per year and also the number of hours per day. The lowest base rate was set at the same level as the pre-existing nursery education grant funding which predated the EYSFF (see West and Noden, 2016). During the design process in Howsonshire, consultants were employed by the local authority to collect cost data and to propose a formula for consideration by the early years reference group and schools forum. A member the schools forum and EYRG who had been involved in formula design described some of the detailed decisions made when identifying costs. These included, for example, determining that day care managers should not be included within childcare

36
Table 10 - Nine case study authorities - average spend per hour in different types of setting through different formula elements (source S251, 2014-15)
% FEEE hrs in provider type
Provider type Base rate Deprivation
Quality Flexibility
Sustainability Other Total
Ofsted Qualifications Hours per
day Weeks per year
Howsonshire 1 PVI childminder 4.61 0.06 4.67
33 PVI day nursery 4.01 0.10 4.11
5 PVI independent school 4.01 0.04 4.05
46 PVI preschool 3.82 0.13 3.95
13 Nursery class 4.27 0.12 4.39
2 Nursery school 5.32 0.12 5.44
Whitbreadshire 87 PVI 3.90 0.04 0.17 0.01 4.13
13 Class 3.90 0.23 0.90 5.03
<1 Nursery school 3.90 0.16 0.90 1.83 6.79
Beecroft 83 PVI 3.25 0.06 0.01 0.05 / 0.08 0.01 / 0.16 0.01 3.64
15 Nursery class 3.25 0.16 0.02 0.01 / 0.24 0 / 0.07 0.01 3.77
1 Nursery school 3.25 0.13 0.05 0 / 0.25 0 / 0.20 4.02 7.90
Dalrymple 19 PVI without professional 2.50 0.35 0 / 0.27 0.26 3.38
30 PVI with professional 3.60 0.35 0.04 / 0.38 0.61 4.70
1 PVI childminder 3.32 0.27 0 / 0.50 0.34 4.43
43 Nursery class 3.60 0.49 4.09
7 Nursery school 4.36 0.56 0.65 5.57
Kneller 55 PVI 3.69 0.02 0.16 0.13 4.00
25 Nursery class 4.10 0.22 0.04 4.36

37
20 Nursery school 5.57 0.53 0.26 6.36
Foxberry 43 PVI 3.03 0.14 0.22 0.26 3.65
57 Nursery class 3.39 0.25 0.27 0.34 4.24
Comerford 1 Childminders 2.60 0.10
0.48 3.93
12 PVI other 3.39
87 Nursery class 3.39 0.17 0.02 3.59
Arabin 29 PVI 4.00 0.06 0.04 0.07 0.05 4.22
69 Nursery class 4.00 0.08 0.04 -0.41 3.71
2 Nursery school 4.00 0.10 0.05 0.10 0.05 4.30
Braxfield Borough 41 PVI 3.90 0.17 0.32 4.39
53 Nursery class 3.75 0.20 0.28 4.23
6 Nursery school 6.04 0.24 0.73 7.01

38
ratios whereas preschool managers should be counted in ratios. She was also clear that the control of local authority expenditure had also been a key consideration during the formula design period:
There were assumptions that had to be made… [on ratios and qualified teachers] and as far as [the consultants] were concerned it had to be OFSTED minimum requirement and the minimum wage going up on a sliding scale… So [they] in effect underestimated the salary costs?
The actual salary costs at that moment, yes they did… because they said ‘you don’t have to, if you choose to that is your choice, you don’t have to’ and in a way… I can understand why the constraints were there because if they’d done it on what the actual cost was at that time for delivery [then the local authority] wouldn’t have been able to afford to cover those rates [Schools Forum and EYRG member, Howsonshire]
If we consider the core principles for the policy described earlier, the Howsonshire formula was strongly orientated towards an ‘effective and efficient’ distribution of resources and stability rather than change. It attempted to identify an equal sustainability level of funding, insofar as it would enable different types of provision to break even at a particular occupancy level – but in doing so it would recreate any differences in pay rates associated with the different qualification profiles of staff in the different types of setting. The persistence of low rates of pay was illustrated, for example, by a small private preschool operating in a rural setting. It had a capacity for 14 two to four-year-olds and offered sessional care with some flexibility to attend for additional hours. While the FEEE funding level was £3.82 per hour, additional hours were charged at £5.60 per hour. Staff pay rates ranged from £6.70 per hour to £8.30 per hour – which was also the level of remuneration received by the proprietor. Had it been permissible, she would have liked to charge top up fees for the entitlement funded hours. She also explained that some staff were employed for very low numbers of hours so that their employment did not affect benefit claims. Similarly low pay levels were reported by other providers (both in Howsonshire and elsewhere). This is, of course, not a surprise as childcare has been identified as a low pay sector (Low Pay Commission, 2014). The Howsonshire formula did not include optional supplements. The formula was clear insofar as providers did not need to understand or predict the outcome of supplements (aside from the deprivation supplement). However, by 2015, its fifth year of operation, it was not clear to some providers why base rates had been set at different levels. In late 2015 the authority began a series of workshops with providers regarding the introduction of the proposed 30 hour entitlement, to clarify the terms of the provider agreement in relation to top up charges and to propose changing the local funding formula from April 2016. At consultation events providers were highly critical of the formula and, in particular, felt the different base rates were

39
unfair. Providers argued that as they were providing the same curriculum to the same group of children they should be paid the same rate. This view was echoed by the managers of a preschool: Manager 1 - … it is very unfair because we’re [a preschool], we get paid three
pounds eighty two an hour for the funded children… but we all have to follow the same curriculum. We’re all having to achieve the same outcomes –
Manager 2 - But we’re definitely the poor relations. Overall, the average payment for provision in nursery classes and nursery schools was higher than at PVI settings although the highest average rate was paid for the very small proportion of hours provided by childminders. A single base rate with type-specific supplements and equal supplements - Whitbreadshire and Beecroft Like Howsonshire, both Whitbreadshire and Beecroft were areas with relatively low levels of historic nursery class provision but for which average levels of funding per hour were higher for nursery class provision than for PVI provision. The Whitbreadshire formula exemplified the other formula design suggested in the 2008 and 2009 guidance (DCSF, 2008; 2009). That is, it featured a single base rate with multiple supplements, some of which clearly related to costs, while others could be described as driving policy objectives. Interviewees suggested that maintaining the pre-existing balance of provision was a key objective for the design of the formula. So what were the key local objectives?… So you said to retain the mix of
provision… Yeah, absolutely…it was to kind of the status quo that you had to – had to
maintain the status quo [Finance manager, Whitbreadshire] A relatively large supplement was based on qualifications. An additional 90p per hour was payable to settings employing staff with Qualified Teacher Status (QTS) although the qualifying criteria were exacting. Teachers were required to be enrolled in the teachers’ pension scheme and employed under the School Teachers Pay and Conditions Document (STPCD). In effect, it was difficult for PVI providers (other than academies) to qualify for this supplement and so it can be seen as a ‘type-specific’ supplement. A lower rate of 30p per hour was however payable to settings employing staff with Early Years Professional Status (EYPS) or employing teachers (but not under the terms of the STPCD). As we also see in Table 10, an average of 90p per hour was paid through the quality supplements for provision in schools

40
(indicating that every hour qualified for the supplement) whereas an average of 17p per hour was paid in PVI settings (because only some PVI settings employed staff with higher qualifications). Although the formula included some elements which could be seen as encouraging change (such as the EYPS supplement and a small flexibility supplement) other elements were clearly orientated towards maintaining existing funding levels, such as the QTS supplement and also the fact the single base rate was set at the level of the pre-existing nursery education grant. Interestingly, the cost analysis carried out within the authority during the initial phase of the EYSFF implementation process identified that sessional providers had higher costs than full day care providers. As a result a sessional supplement (10p per hour) was included in the formula in 2010-11. However the supplement was then removed as it conflicted with the competing objective of encouraging more flexible provision. This illustrates that even within an individual formula, supporting different types of provision on the basis of their costs may come into conflict with other policy objectives. The Beecroft formula bore a number of similarities with the Whitbreadshire formula. That is, it included a single base rate, and supplements playing different apparent functions. A substantial type-specific lump sum was again payable to nursery schools and was evidently based on costs as it comprised a balancing payment designed to bring nursery school total income up to a particular level. Smaller sustainability payments (£2000) were made to group settings in areas classified as rural. Other supplements were however seen as providing incentives to improve the quality or flexibility of provision through equal payments to providers of different types. The formula included a 25p supplement for employing a qualified teacher (rather less than the 90p supplement in Whitbreadshire) and a 20p supplement for employing a member of staff with EYPS. The schools finance manager in Beecroft observed that it was debatable whether the base rate payment plus the QTS supplement should really be regarded as a separate base rate as all hours provided in school nursery classes qualified for the supplement. An additional 5p supplement was payable to settings which achieved an outstanding Ofsted grade. As we see in Table 10, higher average payments per hour were made to nursery schools (5p) than to nursery classes (2p) or PVI settings (1p). This implies that all provision in nursery schools was in outstanding settings and that a higher proportion of provision in nursery classes had been graded outstanding than was the case for PVI provision. Finally, the formula included two supplements for settings offering sessions of at least 4 or 6 hours. The Beecroft formula included the largest number of separate payment elements across the case study areas. However, when presented with various options to simplify the formula, the Early Years Reference Group chose to retain the existing formula. They clearly valued the stability and predictability of funding

41
outcomes under the existing formula over simplifications which would inevitably create winners and losers. In particular, it was noted in minutes that the Schools Forum also felt that ‘funding should be offered to outstanding nurseries and to encourage staff to improve their qualifications’. Nursery class provision in Beecroft received an average payment per hour of £3.77, the second lowest funding level across the nine authorities (although higher than Beecroft’s average payment for PVI provision). A headteacher of a primary school explained that her school’s nursery unit required a subsidy from the main school budget. The provision comprised 104 part-time places organised on the traditional five mornings or five afternoons per week model, along with 16 places for two year olds entitled to free provision. Nonetheless she believed this represented a good investment because of the benefit of high quality early education on later educational outcomes. This view was echoed by a second Beecroft headteacher whose school accommodated a PVI early education provider on site. Although she regarded this as the highest quality provision within the town she explained that she would like to replace it with a nursery class when the contract expired. Although the setting employed staff trained to NVQ level 3, she stated:
I think it is a very long way from the knowledge developed by a teacher on a three year degree course.
In contrast to the example of a nursery unit requiring support from the main school budget, at other settings income from provision for 3 and 4 year olds could provide a subsidy to other provision. The manager of a private day care provider for children aged 0-5, judged to be outstanding by Ofsted, explained that income from provision for three- and four-year-olds had in previous years provided a subsidy for the care of younger children within the setting. For provision which was not funded by the FEEE the setting charged parents on a half day or full day basis for babies and one year olds, and per session for three- and four-year-olds (with sessions running from 0730-0900, 0900-1200, 1200-1500 and 1500-1800). The pricing arrangements smoothed parents’ preschool childcare costs (rather than requiring them to pay higher rates when a child was younger owing to the higher staffing ratios required). However, during the last financial year provision for three- and four-year-olds had not produced a surplus, despite operating at capacity. This was because the proportion of hours supported by FEEE funding had increased (Beecroft’s average payment for PVI provision was £3.64 per hour). The proportion paid through parental fees had correspondingly diminished (for which prices ranged from £4.58 to £6.50 per hour). The prospect of a free entitlement to 30 hours of childcare paid at the existing entitlement rate was very threatening as it would further reduce the number of hours paid for at higher rates.

42
Unequal base rates with supplements including a quality supplement based on qualifications – Dalrymple, Kneller and Foxberry A markedly different rationale and model was developed in Dalrymple. In keeping with some other areas, the cost information gained during the EYSFF design process was not seen as a sufficiently solid basis from which to design a formula. The response of the key participants in the design process was instead to develop an activity-led funding formula based on school costs. An equal level of funding was then also made available to PVI settings on condition that they employed a member of staff with either QTS or EYPS. As the schools finance manager explained:
we didn't think it was fair to give schools more money - because we should be giving the private providers enough money to get that same quality of staff
The formula included three key base rates – a rate for maintained nursery classes (£3.60), an equal rate for PVI providers employing staff with QTS or EYPS, and a lower rate (£2.50) for PVI settings without staff qualified to this level. In addition there was a base rate for nursery schools which included the cost of employing a headteacher, and a base rate for childminders. Supplements for flexibility were tied to longer opening hours and the number of weeks the setting was open each year, with each of these criteria leading to proportionate 10% and 15% increments on the applicable base rate. These were described as purely incentive payments and not linked to costs. The formula was clearly orientated to change rather than maintaining stability and sought to promote higher quality provision by providing an incentive to employ more highly qualified staff. This appears to have been effective as the percentage of children attending private and voluntary providers with staff with QTS/EYPS rose from 45% in 2013 to 60% in 2014 and 68% in 2015. The corresponding figures for England as a whole were 41%, 46% and 47%. (A comparison across the case study areas is shown in Annex 2 Figure A2.1.) The design of the formula was perceived to be fair by the PVI representative on the Schools Forum. She managed two private day care settings which also offered after school care (with minibus collections from nearby schools) and holiday care. She explained that she had been involved in the formula design process as a member of the EYRG:
we had these discussions about the level playing fields and… schools were very much ‘well we need more money because… we have to have a Head [and] the wages are set… by the Government,’ whereas… whatever was left over at the end of the week was my wage… Thankfully people saw that well why should my job not be as important as somebody else’s job… and we all agreed that if you were graduate or teacher led then you got a higher base rate which I thought was really fair, and then there was a management amount put in for the private sector and so it ended up where it felt a level playing field at that stage

43
Unusually, at the two settings she managed, both of which were graded outstanding, parents were charged a single hourly rate (£3.55 per hour) regardless of how many hours they purchased. The setting was very popular and she reported parents would often sign up for hours which did not suit them in the hope they later got the opportunity to change their pattern of use. For this provider, the hourly rate paid by the local authority was higher than that paid through parental fees and thus an increase in the proportion of hours paid for through the free entitlement, for example through the proposed 30 hour entitlement for working parents (as long as it was paid at the existing rate) was financially attractive for the setting. Kneller and Foxberry, though setting off from different starting points, had both moved on a trajectory towards the approach of Dalrymple. Foxberry’s original formula design held similarities with Howsonshire. The original formula, introduced in 2010-11, included separate base rates for preschools, day care, nursery classes and the highest rate payable for provision in independent schools. The formula was however reviewed in 2011. A consultant was engaged who examined provider costs and found wide variation. Consequently the formula was simplified to include just two base rates: one for maintained nursery classes (£3.36) and one for PVI providers (£3). In addition a complex array of supplements was simplified. Thereafter a 10% increment was payable for settings rated good or outstanding by Ofsted. In addition, a second proportionate supplement (10% of the base rate) was payable for settings employing at least 70% of staff with a Level 3 qualification. This supplement potentially brought the payment for PVI providers close to the base rate for nursery classes. However, as all provision within schools also qualified for the supplement this did not reduce the overall funding gap between PVI providers and maintained nursery classes. The Kneller formula had however entirely closed the gap with a type-specific quality supplement available for PVI settings which were led by staff with QTS or EYPS. This brought the funding level for such PVI settings up to that for nursery classes (though not nursery schools). Thus Kneller also gave priority to providing an incentive for quality. Like Foxberry, this arrangement arose from a redesign of the original formula. The funds required to support this qualification-based supplement were raised in part by halving the size of the flexibility supplement. The paper to schools forum explained that in view of the need to increase capacity to meet demand for the new entitlement for two year olds it was counterproductive to maintain a subsidy intended to compensate for under-occupancy. In short, Kneller had explicitly prioritised quality over flexibility. This was also reflected in a paper presented to the Schools Forum in 2014 which stated that one of the ‘underlying principles and objectives’ of the formula was that:
The PVI base rate plus quality factor should be approximately equal to the nursery class base rate

44
A single base rate and an equal supplement for flexibility - Comerford Although Comerford’s formula included multiple base rates in 2014-15 this was, in reality, an aberration. In 2014-15 the formula included one base rate for PVI group settings and maintained nursery classes (£3.39), and in that year a lower base rate for childminders (£2.60) was introduced. However, it was anticipated that 99% of provision would be in either nursery classes or PVI group settings. The following year, having received complaints about this lower rate for childminders, the formula was adjusted to pay the same base rate to all providers. Thus Comerford operated with a single base rate both before 2014-15 and from 2015-16 onwards, and even during 2014-15 the separate base rate only applied to a tiny proportion of hours. In addition to the mandatory deprivation supplement, the formula included a flexibility supplement of 85p per hour, payable per hour for each child who attended a setting for more than three hours on any day. While 57% of funded hours within PVI settings qualified for the supplement, only 3% of hours provided within schools received the enhancement.24 As a headteacher and the former chair of the schools forum described the formula design:
We were very anxious the formula should be the same across schools and so equal amounts should be available to schools and PVI providers because they are of course dealing with the same children. [Headteacher, Comerford]
Again, relating the formula design to the nationally specified policy objectives for the EYSFF, the formula was based on equal funding for providers from different sectors with equal incentives to provide flexible provision, although as we have seen, the flexibility was much more likely to be offered by the PVI providers Unequal funding arising from funding adjustments relating to specific costs – Arabin and Braxfield Borough The Arabin and Braxfield formulae both illustrate that apparent equality or inequality between funding rates can be misleading. Prior to 2014-15 the schools formula in Arabin allocated less money to schools if they included a maintained nursery unit. That was because it was assumed in the schools formula that early years pupils would also contribute to premises costs. However, such a deduction 24 Although it was very unusual for provision within Comerford schools to qualify for the flexibility supplement there was some innovation. For example, one school operated a nursery class, wraparound care open to early years children and also PVI preschool on site. The nursery class offered some places in patterns of four hours per week (including lunch) for three days, three hours on one day and one day off. As the nursery class was oversubscribed, places were allocated to children living within the school’s catchment on the basis of their age. Consequently children attended the school nursery class for three terms only and a full class of Foundation Stage 2 age children was admitted each September. Notably however the headteacher observed that the flexibility payments did not cover the additional cost of offering flexible arrangements.

45
was then disallowed within the schools formula by changes to regulations. The deduction was therefore removed and consequently premises costs were fully funded from within the schools formula. To compensate for this change the early years formula was also adjusted to remove the contribution previously made to school premises costs. This was to ensure the costs would not, thereafter, be double funded. An abatement was therefore added to the early years formula which deducted £0.41 per hour from its allocations to maintained nursery classes. Although it was listed as a supplement, as it applied to all hours in nursery classes the effect was the same as reducing the base rate. Thus the abatement was introduced because of a change to how school premises costs were treated within the local schools funding formula. Therefore in the year before this change (2013-14) the early years funding proforma showed that in Arabin, schools and PVI providers, on average, were paid similar amounts per hour. In 2014-15 however, PVI providers appeared substantially better supported than schools. The total income of those schools however remained unchanged across the two years.25 In addition to this unusual abatement, the formula included small supplements for quality, based on Ofsted ratings, and for flexibility. A local authority officer recalled that the formula had been designed to comply with the guidance of the time:
the supplements - that was a mandatory requirement at that point, but of course now it’s all been lifted - but we still have the supplements… – that was to enhance the PVI… rate really, so the aim was to create a level playing field…
Notably she also felt that the seriousness of the decisions being made at the time of formula design had not been well understood, either within central government or within the local authority. Although the authority would have liked to revise the formula, resources were not available to support the requisite consultation, and with the prospect of policy change relating to the 30 hour offer for working parents, she reported the consensus among both officers and providers was that the existing formula should be retained. When asked what form an alternative formula should take, she proposed a model similar to that of Dalrymple or Kneller:
I’d have to think properly about this, but I would have a supplement directly linked to increasing the quality of the workforce and therefore probably their qualification and then their salary. Completely flat lining across the board.
Braxfield Borough provided a related example (related, that is, to the Arabin abatement) of a compensatory allocation resulting in ostensibly unequal base 25 Kneller, described earlier, illustrated the opposite effect from 2013-14 to 2014-15 with apparently equal budget allocations in 2013-14 followed by substantially higher allocations to schools in 2014-15.

46
rates. In Braxfield, PVI settings received a higher base rate than nursery classes (£3.90 compared with £3.75). The difference in base rates was originally introduced because money was top sliced from the early years block and transferred to the schools block in order to cover the early years pupils’ contribution to schools’ business rates. In order to make a similar, corresponding contribution to PVI providers, 15p extra was paid through the PVI base rate. That is, allocations of public funds which were not visible within the EYSFF explained an unequal allocation within the formula. Conversely other examples of invisible allocations included local authorities (and indeed other landlords) providing premises at reduced rents. Hence equal allocations within formulae can sometimes conceal other forms of subsidy. The Braxfield formula also included a relatively large quality supplement based on Ofsted results which had originated as a 10% increment for providers judged good and 15% for those judged outstanding. As a local authority officer explained:
When…these formulae and things first came into place… just over 40% of our childcare providers were ‘Good’ or ‘Outstanding’, so it was a pretty kind of dire situation, really. So, I think right from the beginning we were clear that we wanted to have a formula that… improved the quality of the childcare provision within the local authority, and that there was some kind of incentive to improve, and that people were funded at a level that meant that they were able to deliver a quality provision.
In 2013 70% of children benefitting from the free entitlement attended settings judged good or outstanding, in 2014 this had risen to 89% and in 2015 this stood at 88%.26 The corresponding figures for England as a whole were 80%, 84% and 85%. As in other authorities, the interviewee did not attribute the improvement in Ofsted grades solely to the incentives within the funding formula. Nevertheless, the formula did reflect local priorities. Compulsory deprivation supplement The highest proportion of funds paid through a deprivation supplement was in Dalrymple where 10% of funds were distributed on the basis of deprivation. Other case study authorities paid 2-4% of their funds through a deprivation supplement. The incidence of deprivation was measured in different ways in different authorities, and deprivation allocations were then also calculated in different ways. However, one means of comparing the size of allocations for deprivation across the different authorities is to use the DfE’s estimate for the number of child hours in each authority qualifying for the Early Years Pupil Premium as this 26 Percentages are calculated from the number of 3 and 4 year olds benefitting from funded early education as a proportion of the total number attending settings for which an Ofsted rating was successfully matched (source DfE SFR 23/2013 Table 10, DfE SFR 20/2014 Table 15a, SFR 20/2015 Table 13a).

47
provides a consistent measure of deprivation (albeit for 2015-16). This approach also enables a comparison to be made between allocations made for deprivation through the EYSFF and those through the EYPP. Figure 7 illustrates the variation in the level of deprivation expenditure across authorities in this way. The blue line, by way of comparison, shows the 53p allocation made under the EYPP policy. Notably in none of the case study areas had the funding formula been adjusted in response to the introduction of the EYPP. Figure 7 - Budgeted expenditure through the deprivation supplement 2014-15 divided by the number of hours qualifying for the EYPP 2015-16
Source: Section 251 budget data, 2014-15 and DfE Early years pupil premium allocations: 2015-16 One authority used Mosaic geodemographic data to distribute its deprivation funding and eight authorities used the Income Deprivation Affecting Children Index (IDACI) to distribute resources for deprivation. The index is a measure of the probability that a child in a defined area, comprising about 650 households, comes from a deprived household.27 Each area therefore has an IDACI score. Areas are also placed in decile bands (across England) according to that score, and also in six IDACI bands defined by the DfE. Each of these three measures of area deprivation (IDACI score, IDACI decile band and DfE IDACI band28) were used by different case study authorities. In some authorities deprivation funds were distributed on the basis of individual children qualifying for a supplementary payment – and the payment was made regardless of which setting they attended. For example in Dalrymple 88p per hour was payable for children with a home address in one of England’s most
27 The areas comprise lower layer super output areas, a standard geographical unit for census data. 28 DfE produced six bands of IDACI scores using the 2010 data, with each band containing roughly the same proportion of children. The top three deciles would correspond to bands 6, 5, 4, 3 and part of band 2. The IDACI data is updated periodically. The 2010 index was used to distribute funds in 2014-15. The IDACI data was then updated in the autumn of 2015 affecting 2016-17 onwards.
00.20.40.60.8
11.21.41.61.8
2
£ de
priv
atio
n fu
ndin
g pe
r EYP
P qu
alify
ing
hour

48
deprived 30% of areas, and in Braxfield Borough payments of 25p, 70p and £1 were made for children living in the DfE’s IDACI bands 4, 5 and 6. Thus these authorities varied in how far (and hence how thinly) their deprivation funding was spread. In Foxberry children from the most deprived 30% of areas triggered a 10% increment on the base rate. In other areas children’s IDACI scores were used to calculate an aggregate score for each setting. In Beecroft an £0.005 (a half penny) was paid per hour for each 1% of children at a setting who lived in England’s most deprived 30% of areas. While this description sounds complex it can be re-described as £0.50 per hour for each qualifying child. A complicating factor in Beecroft was that children attending childminders only qualified for a £0.06 supplement if they lived in these areas. This distinction was made on the grounds that it would be disproportionate for children attending childminders to qualify under the £0.005 per hour per 1% of children formulation as one child could comprise 100% of children receiving the entitlement in a childminder setting. Kneller distributed funds based on the IDACI band of each pupil’s home postcode. Notwithstanding Beecroft’s payments to childminders, in these areas the average payment per hour for provision in different types of setting reflects the incidence of children from deprived areas across those types of settings. The payments suggest that in four of the five areas schools were serving children from more deprived areas of the local authority. This difference was most substantial in the case of Kneller. The notable exception is Howsonshire where we see that a higher average deprivation payment per hour was made for provision in preschools than in any other type of setting. In Arabin and Whitbreadshire the allocations could neither be translated back into a per pupil figure nor used as a consistent indicator of the incidence of deprivation across types of setting. This is because Arabin paid a supplement if more than 50% of children at a setting lived in the most deprived 20% of areas. Consequently payment of the supplement depended on the concentration of deprived children at a particular setting. In addition it included a transitional mechanism to smooth over abrupt changes in a setting’s deprivation income. Differently again, Whitbreadshire calculated an aggregate setting level IDACI score in order to identify the most deprived 25% of settings, to which the total quantity of deprivation funding was then distributed on the basis of the setting’s average score. Finally, the allocation calculation for Comerford involved a unit which did not correspond to either hours, days or children although the average deprivation payment for provision in schools again exceeds that in the PVI sector. The different methods of allocating resources relating to deprivation could have substantial effects on the allocations received. Thus, for example, in Dalrymple an £0.88 per hour supplement was paid for every hour, regardless of the setting attended. In contrast, in Whitbreadshire only 25% of settings could receive deprivation payments. (The implications of these differences of approach are illustrated for a hypothetical set of providers at Annex 2.2.)

49
Interviewees referred to a number of rationales for the distribution of funding based on deprivation. These included meeting the extra costs associated with disadvantaged children (such as increased attendance at meetings) which would be consistent with the proportionate allocation approach used by Foxberry. Others emphasised narrowing the attainment gap or supporting providers with intakes less likely to purchase additional hours of childcare. For example, a schools finance manager in Comerford, where almost 90% of provision is within maintained settings, explained:
the original idea behind [the deprivation supplement] was that the children from a deprived background potentially present more of a challenge to bring them up to the expected level and standard for them entering reception. So it was that little bit of extra funding to be able to bring them up to the same level as their peers, if you like.
A contrasting answer was provided to the same question in Beecroft where 83% of provision was within PVI settings:
Was there a particular reason why the deprivation funding was set up in that way? Well the economics of running childcare in the more deprived areas are tougher aren't they because you're not able to sell additional hours.
That is, in an area where most provision was within maintained settings, funds for deprivation funding could be regarded as additional funding whereas in an area in which private providers predominated deprivation funding was described as compensating for the lack of availability of other funds to meet provider costs. Thus even in relation to deprivation payments, formulae reflect implicit rationales or assumptions about underlying business models. Funding formulae and control of expenditure The formulae varied in how amenable they were to enabling expenditure to be contained within the early years block. For example, in Whitbreadshire the total amount of deprivation funding was described as a ‘movable feast’ with the total quantity to be distributed determined each year. Thus, for example, the increase in the proportion of settings qualifying for the qualification-based supplement from one year to the next had been balanced by a decrease in the amount paid out on the basis of deprivation. In contrast, in other areas the unit of funding attached to each formula element was defined explicitly within the formula leaving less room for manoeuvre. For example, in Beecroft there had been an expansion in the number of primary schools offering nursery classes, rising from 24 in 2010 to 29 in 2016. As an officer remarked:

50
the jeopardy for us is that it costs us 20 pence an hour more to put a child through the school based system than it does through the PVI system.
It is also important to note that the newly opened nursery classes in Beecroft were located in more affluent parts of the authority, also implying a movement of expenditure to less deprived areas. A further area of concern for the authority arising from schools opening new nursery classes was a potential reduction in the availability of year round providers which could follow. Dalrymple had also seen an increase in the number of schools offering nursery classes, rising from 55 in 2010 to 63 in 2016, with nursery classes seen by headteachers as potentially a cost effective means of raising pupils’ subsequent educational attainment. As in Beecroft, the EYSFF only included fixed elements, to be distributed on a per qualifying unit basis. Consequently as the qualifications profile of local providers had improved, the base rates payable had been reduced by 1.5% each year (in line with schools’ MFG protection) so that total expenditure could be contained within the Early Years block. Unavoidable judgements – different modes of operation, additional hours and maintaining a ‘free’ entitlement As we saw, even the allocation of funding for deprivation reflected different assumptions about providers modes of operation. Other assumptions necessarily had to be made relating to providers’ business models. This was illustrated in relation to the approach taken to premises costs by interviewees in both Beecroft and Whitbreadshire when they described their deliberations when designing formulae:
The difficulty with premises costs was that you either own it or you don't. If you own it, how much of that mortgage do you put towards the cost of delivery? Because how much of that mortgage is actually investment in your business which you will ultimately then sell and get a return on. And in some cases actually we found that there were multiple limited companies [with the same directors], one was actually the property portfolio, which owned the nursery building… and the other limited company was actually delivering the services from that building. So we actually took a view that where folks were purchasing the building that it wasn't appropriate to put it into this formula because it was… ultimately going to be something that the business took away (Beecroft, Schools finance manager) potentially, a PVI provider could be renting a [village] hall… or it could be paying for the mortgage on an asset, which then they will inherit, won’t they?... Prickly issues, aren’t they? (Whitbreadshire, Schools Finance manager)

51
In examining the costs associated with provision, it was impossible to avoid difficult judgements as to the appropriate level of support to cover premises costs. In the case of Braxfield Borough, the authority had recently carried out an analysis of the unit costs relating to the premises of its PVI providers. (This was calculated as the sum of annual mortgage or rent and business rates, divided by the total deliverable childcare hours per year, and it therefore did not include, for example, costs relating to maintenance). The unit costs are represented in Figure 8 (plotted against the total annual premises costs) showing that they found a wide range in unit costs, both for term-time only providers and 51 week providers. The analysis was carried out to investigate whether a 15p per hour increment for PVI providers should be retained within the formula (the EYRG and schools forum concluded that it should be). Figure 8 - Braxfield Borough’s analysis of unit costs relating to mortgages, rent and business rates
Source: Braxfield Borough data Figure 8 does however also show several providers with substantially higher unit costs for premises. In Whitbreadshire it was also observed that there were substantial variations in premises costs across different areas of the local authority. However it was also noted that in higher rent areas, providers often benefitted from a greater opportunity to sell additional hours to parents (at a higher rate than was paid by the local authority). This draws attention to the fact that when designing formulae, judgements also had to be made relating to the operating models of providers. It is also notable that local authorities took different approaches to providers charging what were effectively top up fees to parents. For example, officers from different authorities described their approaches:
we are getting more and more settings trying to charge top ups, registration fees, deposits, ways of charging for extras from the parent or
£0.00
£0.05
£0.10
£0.15
£0.20
£0.25
£0.30
£0.35
£0.40
£0.45
0 20000 40000 60000
Uni
t cos
t (co
st p
er
hour
of d
eliv
erab
le c
hild
care
)
Annual cost of mortgage, rent and business rates
38 week provider
Year round provider
52
making families take on extra hours that they don't necessarily want… So that's why we decided to do these workshops because we were finding it was such a big issue… we could start to talk about you've signed a contract, it is a contract, it’s legally binding, this is what you sign up to say you will do… but what that has come back with is… ‘well OK if we can't do that, we can't afford to keep going’... (Early years manager, Howsonshire)
With the backing of the portfolio holder and council members, the authority had produced a guide for parents regarding their rights to the free early education entitlement. In addition, the authority made use of compliance manager to respond to allegations of contract infringement. Almost 130 cases had been referred to the manager during the previous year. In Beecroft, the finance manager was aware of similar cases but took the view the local authority should not intervene in private arrangements about additional charges:
What we can't control is a provider that chooses to be quite creative about how they charge effectively a top up fee. There are examples of a very high lunch charge being applied but if a parent has voluntarily entered into that, then that’s not for us to comment on or be involved with. The key for us is that that morning session was free without any condition to then take the lunch hour, but if parents want to pay x amount for the lunch hour, which was disproportionately higher than the cost of that hour, that’s a private matter.
It is striking that a markedly different approach is taken in relation to school admissions and charging policies. In Braxfield Borough an even more detached view was taken, that if providers wished to make additional charges, the onus was on the parent to find an alternative:
there are some providers – not too many, but a handful… – who charge more for the hours that the people buy beyond the free early education, and we’re OK with that, as long as we say, ‘Well, the key thing is you have to be able to explain to the parent, you know, what hours they’ve got free and what you’re charging them for and how you’ve come to that figure… If you’re saying that to the parent, and they’re absolutely clear why, then they make a choice: either they’re happy with what you’re telling them and they buy what… you’re selling; or they go, “No, actually, that doesn’t seem justified to me”, and they’ll go elsewhere.’
However, the early years manager also acknowledged that it was not always easy to find out the prices charged by alternative providers, a fact which also presented a challenge for the local authority:
the local authority has a statutory duty to provide as much information to parents as possible [including prices]… but how can we meet that

53
requirement if even on their own websites they don’t publish what their [prices] are?... If I was a parent… I’d want my nursery to be able to give me something that says, ‘This is what the fees are.’ But it’s like the world’s best-kept secret, in some of the places.
Providers’ operating models vary substantially, as does the degree to which they rely on charging parents for provision not included within the free entitlement. Notably, this reliance is crucially affected not only by the rate paid for FEEE hours through the EYSFF but also by the number of hours provided by the entitlement and also the regulations to ensure that the entitlement is provided free of charge. Conclusions from the case studies We examined nine case study areas in greater detail to understand how their local funding formulae were designed. The areas reflected variation as regards a number of characteristics including location, area deprivation and political control, and also in the design and average funding outcomes of their formulae. The case studies illustrated the immense variation in formula design. Notably, the approach taken to base rates did not provide a shortcut to providing an understanding of an implicit rationale for the formula. Howsonshire did not include any optional supplements in the formula. The formula comprised separate base rates for different types of provision and a compulsory deprivation supplement. The rationale for the formula was that different types of provision should be ‘equally sustainable’ (that is, equally able to cover their costs) if they operated at the same level of occupancy. As provider costs rose but funding allocations remained static the formula became increasingly unpopular and difficult to defend to providers as different funding rates were paid to different types of provider and this was perceived to be unfair. The formulae of the other areas using multiple base rates (Dalrymple and Comerford) were not however taking an equal sustainability approach. Kneller and Foxberry had both revised their original formulae, reducing the number of base rates used and, concomitantly moved away from attempting to reflect the differing costs of different sub-groups of providers. Formulae within seven authorities included an element relating to quality. While the Whitbreadshire formula included supplements to increase the rate paid to PVI providers who had improved their staff qualifications profile, the supplement for employing a teacher was in effect a type-specific supplement to maintained settings. Beecroft made a similar, though smaller, payment for which the conditions were less restrictive. Dalrymple and Kneller had however both developed formulae in which payments to PVI providers could equate to those made to maintained nursery classes if providers held EYPS or QTS qualifications. That is, conditions were attached to achieving ‘equal funding’. In Foxberry PVI providers needed to clear a lower hurdle, relating to the proportion of staff holding a level 3 qualification, in order to qualify for a lower supplement. Braxfield Borough, in contrast, had introduced a quality supplement linked with

54
Ofsted judgements. Each of these formulae reflect, to differing degrees, a ‘uniform quality’ orientation to achieving a level playing field. It is notable that provision in Arabin and Comerford took place predominantly within maintained schools. In Arabin, local authority officers involved in the design process stated that a priority had been to increase the rate paid to PVI providers and that encouraging more flexible provision had also been a priority. Similarly in Comerford, where almost 90% of provision was within schools, flexibility took priority over including a quality supplement in the formula. Despite being selected in part due to using multiple base rates, the Comerford formula perhaps most closely approximates to an ‘equal funding’ orientation to the level playing field. The case studies have illustrated amply that formulae need to be understood as individual entities and in relation to local circumstances. In addition, as is illustrated by Arabin and Braxfield Borough, formulae need to be understood in relation to funding allocations which may not necessarily be visible within formulae. In relation to the allocation of deprivation funding, again the cases reflected marked variation. They also suggested that formulae had been designed with differing assumptions according to the local pattern of provision. Finally, the case studies drew attention the wide range of operating models of early education providers and to their differing prospects, and vulnerabilities, in relation to changes in funding rates or to an increase in the entitlement from 15 hours to 30 hours.
5. Conclusion In this report we have examined the implementation of the Early Years Single Funding Formula, drawing on documentary evidence relating to the policy, section 251 budget proforma returns, and by examining policy implementation within nine local authority areas. Local variation has been a persistent feature in the provision of early education in England. The pattern of provision has emerged as a patchwork, largely driven by local decision-making over an extended period, though linked with, and implicitly supported by, central government policy. During the last twenty years, national government involvement in policy has been overlaid on this landscape, first through the introduction of the nursery voucher and then through its replacement, the free early education entitlement. Against this backdrop, the EYSFF was introduced to provide a standardised, transparent means of distributing resources at the second tier of resource allocation – that is, from local government to individual providers. The rationale for the policy initially urged local authorities to distribute resources equally - on a per child basis, regardless of the type of provision (West and Noden, 2016). However, while this stipulation was quickly dropped, the related idea of creating

55
a level playing field on which providers of different types could compete to provide early education to children has proved more persistent and periodically resurfaced in policy documents. Notably the numerous stated policy objectives for the EYSFF changed over time. However, the efficient and effective distribution of resources, promotion of quality, flexibility and preservation of diversity and choice remained constant. However, guidance as to formula design has changed substantially. Nevertheless at each stage a great deal of scope was left for local policymakers to design formulae which addressed local priorities. In this report we have seen that the competing objectives, changing guidance and local decision-making are all reflected in the budget data provided by local authorities through section 251 returns. Perhaps not surprisingly, formulae do not always accord with the most recent guidance and thus, for example many formulae continue to include supplementary payments which could not easily be described as driving local policy objectives. Similarly guidance has changed as to the appropriate number of separate base rates to include in a formula and again variations in approaches are reflected in the data. Also notable, and characteristic of the sector, is the huge variety of sub-types of provision identified in funding formulae. These could reflect differences of ownership, opening hours, facilities or numerous other characteristics. In relation to creating a level playing field the threat that ‘equal funding’ would constitute to nursery schools in particular was noted as early as 2009 and they continue to be treated as exceptions within many formulae. In effect, this type of provision is treated as a proxy for high quality provision. Funding for early education provided by childminders is again often treated as an exception although funding rates show marked variation. In relation to funding outcomes for maintained nursery class provision compared with provision in the PVI sector we again see substantial variation. However, this variation was not in the form that had been anticipated by the researchers. Local authorities in urban areas had been in the forefront of the provision of nursery education within primary schools prior to the introduction of the nursery voucher policy. However, as reflected in 2014-15 budget statements, a high level of provision within schools was not associated with a larger ‘nursery class premium’. In fact, the reverse was the case. Formulae in areas with more provision in the PVI sector were more likely, on average, to favour school provision while areas with less PVI provision paid more per hour to PVI settings. One interpretation would be that local formulae promote diversity by favouring minority providers. This could arise for numerous reasons. For example, in areas with substantial provision within schools there could be a perceived shortage of full day care provision. Alternatively, in areas with predominantly PVI provision, nursery classes may be perceived as a residual service provided in areas of social need. The case studies provided some evidence in support of each of these explanations. Another, more prosaic, explanation would be that authorities find it easier to be generous when smaller budgets are at stake.

56
In our introduction we noted that different approaches could be taken to creating a level playing field between, in particular, nursery classes and PVI group providers (which together provide the majority of early education provision). These were described as ‘equal funding’, ‘uniform quality’ and ‘equal sustainability’ orientations. The case studies provided examples of each orientation to providing a level playing field – although in several cases more than one of these orientations was reflected in the local formula design. The case studies illustrated the need to understand local funding formulae in relation to local circumstances. In some cases formulae had been designed by explicitly choosing to focus more on one policy objective rather than another. They also showed that formula allocations can be based on numerous and diverse elements. Changes to their design may have unpredictable consequences to which an extra layer of unpredictability is added by providers’ varying operating models. Notwithstanding the previous discussion, two key conclusions may be drawn. First, local authorities were provided with numerous objectives to address when designing their funding formulae and were given great freedom in how they could be designed. They have clearly exercised that freedom. The formulae are too varied and their component parts too interlinked to be easily analysed, understood and summarised through the data currently collected via the s251 early years proforma. Second, it is also clear that while different balances were struck between those policy objectives, it would be wrong to describe the varied funding arrangements as a postcode lottery. Rather, formulae must be understood as individual entities and implemented in response to particular local circumstances, and in the light of specific guidance from central government.

57
Annex 1 Descriptive statistics, correlations and models relating to section 3 Table A1.1 Descriptive Statistics N Minimu
m Maximum
Mean Std. Deviation
Average spend per hour on PVI 150 3.24 5.23 3.96 .39 Average spend per hour on nursery classes
145 2.64 5.69 4.07 .56
% of hours provided by PVIs 150 2.32 100 56.42 22.47 % of hours provided by nursery schools
150 0 82.37 5.96 9.17
% of low income children 150 6.6% 46.1% 21.4% 7.4% Class premium 145 -1.04 1.74 0.11 0.49 Average spend per hour on all provision
150 2.98 5.81 4.11 0.50
Table A1.2 - Average spend per hour in PVI settings, maintained class
settings and class premium by region
N PVI
Nursery class (N=145) All types
Class premium (N=145)
North East 12 3.85 3.75 3.93 -0.10 North West 23 3.69 3.91 3.91 0.22 Yorks and Humberside 15 3.97 3.97 4.05 0.00 East Midlands 9 3.84 3.86 3.92 -0.02 West Midlands 14 3.76 3.80 3.84 0.05 East 11 4.06 4.14 4.22 0.08 Inner London 13 4.58 4.67 5.06 0.10 Outer London 19 4.04 4.11 4.17 0.06 South East 19 4.08 4.27 4.20 0.20 South West 15 3.85 4.21 3.92 0.35 Total 150 3.96 4.07 4.11 0.11
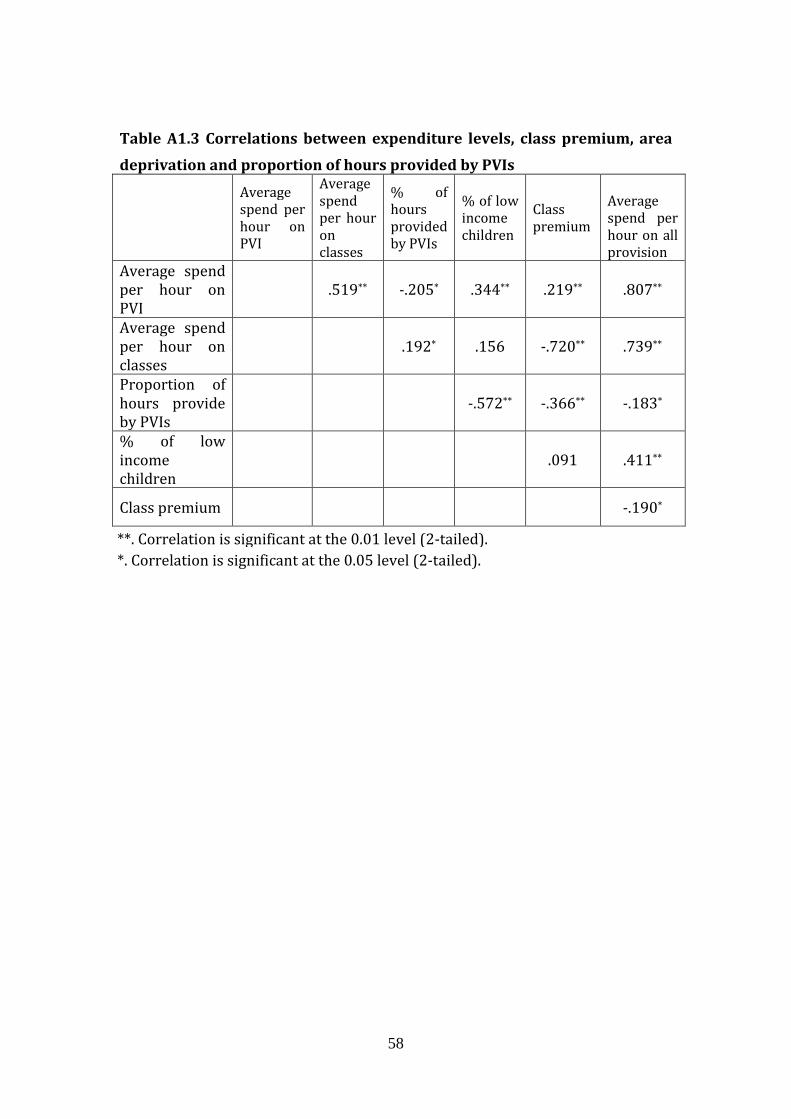
58
Table A1.3 Correlations between expenditure levels, class premium, area deprivation and proportion of hours provided by PVIs
Average spend per hour on PVI
Average spend per hour on classes
% of hours provided by PVIs
% of low income children
Class premium
Average spend per hour on all provision
Average spend per hour on PVI
.519** -.205* .344** .219** .807**
Average spend per hour on classes
.192* .156 -.720** .739**
Proportion of hours provide by PVIs
-.572** -.366** -.183*
% of low income children
.091 .411**
Class premium
-.190*
**. Correlation is significant at the 0.01 level (2-tailed). *. Correlation is significant at the 0.05 level (2-tailed).

59
Table A1.4 – Models relating to levels of spending Model 1 Model 2 Model 3 DV
Average spend per hour on all types of provision
Average spend per hour on PVI provision
Average spend per hour on nursery class provision
Adjusted r square 0.473
0.395
0.211 B SE B SE B SE
(Constant) 4.00 0.12 3.97 0.10 3.94 0.17 % deprived children (centred on average) 0.02 ** 0.01 0.01 * 0.01 0.02 * 0.01 Region (reference category Yorkshire and Humberside)
North East -0.22
0.14 -0.25 * 0.12 -0.12
0.20 North West -0.18
0.12 -0.28 ** 0.10 -0.16
0.17
East midlands -0.22
0.16 -0.15
0.13 -0.21
0.23 West Midlands -0.25
0.14 -0.25 * 0.12 -0.21
0.19
East 0.22
0.15 0.18
0.13 0.03
0.21 Inner London 0.75 ** 0.16 0.42 ** 0.13 0.49 * 0.22 Outer London 0.11
0.13 0.07
0.11 0.11
0.17
South East 0.23
0.14 0.25 * 0.12 0.15
0.19 South West -0.07
0.15 0.04
0.13 0.02
0.22
% of hours provided by PVI (centred on average) 0.00
0.00 -0.004 * 0.00 0.01 * 0.00
% of hours provided by nursery schools 0.01 ** 0.00 0.00
0.00 0.01 * 0.01
Political control Labour -0.03
0.11 -0.09
0.09 0.06
0.15
Other 0.09
0.10 -0.01
0.08 0.10
0.14
**p<0.01, *p<0.05

60
Table A1.5 - Nursery class premium models DV nursery class premium Model 4a Model 4b Model 4c Model 4d Adjusted r square 0.128 0.143
0.165
0.155
B SE B SE B SE B SE Intercept .153 .067 -.011 .070 .063 .089 .171 .069 % of hours provided by PVI (centred on avg) .011 ** .002 .010 ** .002 .008 ** .002
Political control
(reference category Conservative) Labour .220 * .107 .195 + .106
Other .162 .113 .144 .112
Approach to base rates One base rate per type
.008 .093 .024 .093
Multiple base rates
-.182 + .093 -.188 * .094 **p<0.01, p<0.05, +p<0.1

61
Annex 2 Additional figures accompanying section 4 Figure A2.1 - Case study areas proportion of 3 and 4 year old children benefitting from free early education entitlement attending settings employing staff with QTS/EYT/EYPS, 2013 to 201529
Source: DfE (2013c) SFR 23/2013 Table 1a and 9a, DfE (2014c) SFR 20/2014 Table 2a and 14a, DfE (2015c) SFR 20/2015 2a and 12a.
29 The diagram shows the number of 3 and 4 year olds benefitting from funded early education places in maintained nursery schools or nursery classes and the number of 3 and 4 year olds benefitting from funded early education at PVI providers with staff with QTS/EYT/EYPS who work directly with 3 and 4 year olds, divided by the number of 3 and 4 year olds benefitting from funded early education places in maintained nursery schools, nursery classes and PVI settings
0102030405060708090
100
PVI settings
Maintained settings

62
Figure A2.2 - Case study areas proportion of 3 and 4 year olds benefitting from early education who attend a setting which matched to Ofsted inspection ratings and was rated either good or outstanding
Source DfE: (2013c) SFR 23/2013 Table 10, DfE (2014c) SFR 20/2014 Table 15a, DfE (2015c) SFR 20/2015 Table 13a.
60%
65%
70%
75%
80%
85%
90%
95%
100%
2013
2014
2015

63
Deprivation allocations across 12 notional settings The potential difference that differing methods of allocating deprivation funding are illustrated below for a hypothetical group of 180 children attending 12 settings of different size, 60 of whom live within deprived areas and in which the total allocation for deprivation equates to 50p per hour for the 60 qualifying children. We see that approaches such as those of Whitbreadshire and Arabin would produce much more concentrated allocations deprivation funding than for example Dalrymple. Table A2.1 Hypothetical distribution of children across settings Setting 1 2 3 4 5 6 7 8 9 10 11 12 Total children 26 26 26 16 16 16 16 16 8 8 3 3 Children qualifying for deprivation funding 14 9 6 9 8 3 2 1 3 2 2 1 Figure A2.3 - Deprivation payment per deprived child per hour across 12 notional settings
0
0.5
1
1.5
1 2 3 4 5 6 7 8 9 10 11 12
50p per pupil (cf Dalrymple)
Settings with 50% of children from deprived postcodes qualify forpayment (cf Arabin)25% of settings with most deprived children qualify for payment (cfWhitbreadshire)

64
Annex 3 Case study summaries Howsonshire formula design Table A3.1 Base rate Deprivation £4.61 PVI childminder £4.01 PVI day nursery £4.01 PVI independent school £3.82 PVI preschool £5.43 Maintained nursery school £4.27 Maintained nursery class
Rates of 10p, 20p, and 30p paid according to children’s home postcode.
97% 3% Figure A3.1
The formula included six different base rates, albeit that the same rate was paid to PVI day nurseries as to PVI independent schools. The deprivation supplement, set at 10p, 20p and 30p per hour according to children’s home postcode, was the only supplement. The distinction between full day care providers and preschools was on the basis of opening hours and the number of weeks the setting was open during the year. This was consequently the means of addressing differing costs associated with settings offering flexibility. The local authority’s initial cost survey in 2008 achieved a very poor response rate and this resulted in the authority appointing consultants to assist in developing a typical cost model and proposing a formula. Despite the poor
0
1
2
3
4
5
6
7
8
£ pe
r hou
r
% of hours budgeted within different forms of provision
Howsonshire base rates (solid) and average outcomes (lines)
PVI pre-school PVI day nursery PVI independent Childminder Class Nursery

65
response rate, the report was nevertheless able to identify that in 2007-08 PVI settings were funded at about 70% the rate received by maintained nursery classes (funded per place rather than on the basis of participation). The typical cost model was designed so that, for a particular type of provision, a typical setting would break even if it operated at 75% occupancy. The complexities of identifying which management costs and what level of premises costs should be covered for day care settings compared with sessional providers were addressed and then reflected in the different base rates. In the period since the formula’s introduction in April 2011 providers received a flat rate increase of 11p per hour in 2012 followed by a freeze in rates in subsequent years. As a member of the schools forum remarked:
over the years there's been various times where the local authority reviewed the funding… and it’s become far more simplistic.
In late 2015 the authority began consulting with providers regarding the introduction of the 30 hour entitlement and proposing changes to the local funding system from April 2016 (any changes were subsequently delayed to 2017). At consultation events providers were very critical of the differences in base rates, suggesting that as different types of provider delivered the same curriculum to the same children they should he paid at the same rate. Proposals to reduce the number of base rates to three were made to the Schools Forum in May 2016. The highest rate was proposed for nursery schools, an intermediate rate for maintained nursery classes, day nurseries, independent schools and childminders, and a lower rate for pre-schools. However whether the changes would involve an increase in rates or a decrease (for some providers) would depend on the consequences of any proposed national funding formula.

66
Whitbreadshire formula design Table A3.2 Base rate Deprivation Quality Flexibility Nursery
school £3.90 25% most
deprived settings in the authority receive £0.01 to £1.10 per hour
EYPS £0.40 QTS £0.90 Quality lump sum £2000
£0.05 per hour for flexibility
£87,036 lump sum
92% 2% 6% 0% 0% Figure A3.2
The formula included a single base rate for all providers (£3.90) with supplements for deprivation, quality, flexibility, and a nursery school lump sum. The deprivation factor was payable to the 25% most disadvantaged settings in the authority. The disadvantage score was calculated using children’s postcodes to compute an aggregate score from Mosaic geodemographic data. The amount payable then depended on the setting’s score relative to the minimum qualifying threshold score. The total amount to be distributed was determined each year. A larger proportion of funding was distributed via a quality supplement. This was made up of two elements. A setting could qualify for the qualified leader rate (£0.90) if it employed a qualified teacher who was paid under the statutory
0
1
2
3
4
5
6
7
8 Whitbreadshire base rates (blocks) and average funding outcomes (lines)
PVI Nursery class Nursery School

67
teachers’ pay terms and conditions and for the EYPS rate (£0.30) if the setting employed a EYP or QTS but under different terms and conditions. A ‘quality lump sum’ payment was also available to settings if they received a good or outstanding Ofsted judgement. This was made up of a fixed payment of £300 and an addition of £0.05 to the hourly rate up to a maximum of £2000. The flexibility supplement of £0.05 was available to settings open from 0800 to 1800 and which did not restrict entitlement places to pre-set sessions. Interestingly the formula underwent several changes from its introduction to the present. The initial analysis of provider costs in spring 2009 found that sessional providers had higher unit costs than full day care providers. This came as a surprise to the authors of the report. Nevertheless, the findings led to the inclusion of a £0.10 ‘sessional supplement’ from April 2010. In 2011-12 a flexibility supplement was introduced and the EYRG recognised that the sessional supplement could act as a disincentive to provide flexibility. Consequently the sessional supplement was removed but a £0.10 addition was made to the base rate so that no providers would lose out from this change. Before the introduction of the single funding formula PVI providers had received a flat rate of £3.76 per hour in 2009-10. The authority was not a pathfinder authority which introduced the EYSFF in April 2010. However it chose to introduce the formula - for PVI providers only - in that year. The number of hours qualifying for quality payments based on qualifications increased from 2013-14 to 2014-15. The corresponding increase in expenditure was balanced by a reduction in expenditure per hour for deprivation and a reduction in expenditure for flexibility.
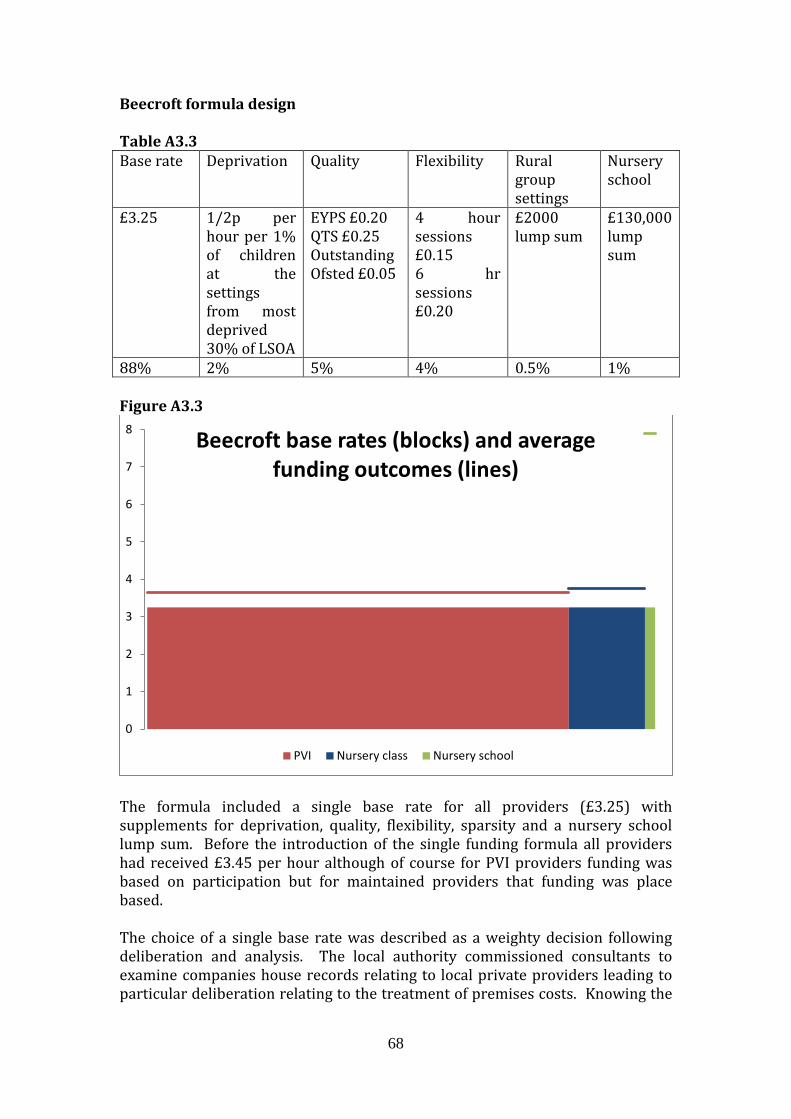
68
Beecroft formula design Table A3.3 Base rate Deprivation Quality Flexibility Rural
group settings
Nursery school
£3.25 1/2p per hour per 1% of children at the settings from most deprived 30% of LSOA
EYPS £0.20 QTS £0.25 Outstanding Ofsted £0.05
4 hour sessions £0.15 6 hr sessions £0.20
£2000 lump sum
£130,000 lump sum
88% 2% 5% 4% 0.5% 1% Figure A3.3
The formula included a single base rate for all providers (£3.25) with supplements for deprivation, quality, flexibility, sparsity and a nursery school lump sum. Before the introduction of the single funding formula all providers had received £3.45 per hour although of course for PVI providers funding was based on participation but for maintained providers that funding was place based. The choice of a single base rate was described as a weighty decision following deliberation and analysis. The local authority commissioned consultants to examine companies house records relating to local private providers leading to particular deliberation relating to the treatment of premises costs. Knowing the
0
1
2
3
4
5
6
7
8 Beecroft base rates (blocks) and average funding outcomes (lines)
PVI Nursery class Nursery school
69
capacity of the private settings and their level of FEEE provision a unit cost was calculated which became the base rate. The cost of this base rate did not absorb all the available resources and the balance was distributed across supplements which were intended to provide incentives to providers. A 20p per hour supplement was available to providers able to offer sessions of 6 hours, and 15p if sessions of 4 hours were available. The number of PVI providers unable to offer six hour sessions declined from 61 in 2010-11 to 34 in 2016-17. Quality supplements of 25p were payable to providers employing staff with QTS (for which all maintained providers qualified) and 20p for EYPS, with a further 5p supplement for outstanding providers. There was growth in the number PVI providers employing staff with higher qualifications with most of the growth being in those with EYPS. The supplement for outstanding providers was proposed in response to providers’ views expressed during consultation. The deprivation supplement was calculated as a 0.5p increase in the hourly rate for each 1% of children living in the most deprived areas (bottom 30% of LSOAs). Notably another way of expressing this calculation would be to say that each deprived child attracted an extra 50p of funding per hour. Deprived children attending childminders however attracted a supplement of 6p per hour as it was felt that a 50p increase would be disproportionate. A rural lump sum payment (£2000) was payable to 19 group settings located in rural areas in which the sparse population meant it was difficult for this mixed group of providers to cover their fixed costs. Finally, a lump sum payment of £47,933 was received by one nursery school. This figure represented the funding shortfall arising for the school from the shift to the new formula. This lump sum was increased by the schools forum to £130,000 in 2014 bringing it into line with the lump sum payment received by all other maintained schools. By 2013 there had been concern arising from the absence of cash increases in rates paid over several years. Schools Forum minutes report that the base rate of £3.25 would by then have increased to £3.66 had it kept pace with inflation. The early years reference group and schools forum considered amending the formula to reduce the number of supplements and increase the base rate. As the paper notes: The childcare market is fragile and the current formula largely sustains provision… amending the formula may, on the whole, have a negative impact on delivery of the free entitlement. The minutes also note that concern was expressed that providers who had upgraded their qualifications profile could then lose funding. It was decided to maintain the original formula.

70
From 2014 it became easier for schools to change their age range and consequently three schools had opened new nursery units. Notably, while the original group of schools with nursery units were located in more deprived areas of the authority, the new nursery units were located in more affluent areas. This raised two concerns for the authority, namely the likely increase in funding required to deliver early education in maintained schools rather than PVI settings, and the possibility of a reduction in available provision from 52 week providers.

71
Dalrymple formula design Table A3.4 Base rate Deprivation Flexibility Maintained nursery class £3.60 PVI group setting with professional £3.60 PVI group setting without professional £2.50 Childminder £3.32 Nursery school £4.36
£0.88 per hour for children from the most deprived 30% of LSOA
With a professional: 7-8 hours £0.36 More than 8 hours £0.54 Open 50 weeks or more £0.54 Without a professional: 7-8 hours £0.25 More than 8 hours £0.37 Open 50 weeks or more £0.37 Childminder: More than 8 hours £0.50 Open 50 weeks or more £0.50
81% 10% 9% Figure A3.4
While the Dalrymple funding formula appears relatively complex, it was based on a clear rationale. In common with other areas, the authority had found it difficult to collect robust cost data. In response, a school-based activity-led formula was developed which specified the cost of provision within schools. PVI settings were then also able to receive the same level of funding if they employed qualified staff. As the schools finance manager explained:
0
1
2
3
4
5
6
7
8 Dalrymple base rates (blocks) and funding outcomes (lines)
PVI with professional PVI without professional Childminder
Nursery class Nursery school

72
we didn't think it was fair to give schools more money - because we should be giving the private providers enough money to get that same quality of staff
The unit cost for staffing within schools was based on a staff team comprising a main scale teacher and one and a half teaching assistants (all at specified salary points) for every 26 children, with an additional contribution of 3% to cover supply costs. Similarly specific unit costs were calculated relating to premises (based on 2.3 square metres per child), administration and management. PVI providers could then have access to the same level of funding if they employed staff with either qualified teacher status or Early Years Professional Status. For PVI settings without staff qualified to this level staffing costs were based on the cost of employing a senior nursery nurse room leader and 1.5 nursery nurses for every 16 children, again supported by 3% for supply costs. Allocations for premises, management, administration and support costs were set to match those for schools. Nursery schools were treated in the same way although with an addition to the management allocation component of the base rate to cover the cost of employing a headteacher. The deprivation supplement comprised £0.88 per hour for each child with a home address in the most deprived 30% LSOAs nationally with the initial deprivation budget was based on the proportion of the DSG which related to deprivation at that time (this was shown in the DCSF’s DSG allocation spreadsheet). The original deprivation supplement was made up of two elements. One comprised a payment based on the location of the premises, responding to the target that all settings in deprived areas should have two graduates. However when that target was abolished, that element of the funding was merged with the per pupil payment (to create the £0.88 payment). The flexibility supplements were calculated as 10% and 15% increments on the relevant base rates payable to settings offering long opening hours or open for more than 50 weeks per year. The main areas of disagreement during the implementation process were reported to relate to nursery schools, which, despite receiving more per hour than PVI providers or maintained schools, received a low level of funding relative to nursery schools in other areas. The second area of sensitivity involved the inclusion of an element of profit within the formula. A 6% addition to the base rate was labelled as a ‘sustainability’ payment, based on guidance for an appropriate element for working capital but which could also be considered as a profit element for private providers. The local authority’s modelling of the impact of the introduction of the formula showed the maintained nursery schools would lose substantially (from 6% to 60% of the previous year’s funding). While about 60% of primary schools gained from the formula only about 33% of PVI settings did so. The largest losers

73
among PVI settings were those without an early years professional and which were located in less deprived areas. Two such playgroups ceased to function after the introduction of the formula and, in addition, one of the nursery schools also closed. As the qualification levels among providers have improved and increased the proportion of payments attracting a higher base rate this has put pressure in the schools block of the DSG. In response, a cut of 1.5% was made to the base rates so that, for example, the base rates for group settings with professionals were reduced from £3.60 to £3.54. Such a reduction was made in two consecutive years in order to keep expenditure under the formula within the Early Years block of the DSG. In addition the 7-8 hour flexibility band was also removed in 2015-16 leaving only the 15% enhancement for providers open for at least 8 hours and a 15% enhancement for settings open for 50 weeks per year.

74
Kneller formula design Table A3.5 Base rate Deprivation Quality Flexibility £3.69 PVI £4.10 Nursery class £5.57 Nursery school
Average setting score based on IDACI bands of children’s home addresses
£0.41 for PVIs employing EYPS or QTS
£0.11 6 hr + day with range or start and finish times £0.23 8 hours + with range of start and finish times
91% 4% 2% 3% Figure A3.5
More than half of funded provision was within PVI settings, a quarter within nursery classes and a fifth, a substantial proportion relative to other authorities, within nursery schools. The formula included different base rates for the three main types of providers (£3.69 for PVI settings, £4.10 for nursery classes and £5.57 for nursery schools). Four percent of funding was distributed via a deprivation supplement, very little of which was allocated to PVI settings. A £0.41 quality supplement was payable to PVI settings which employed highly qualified staff holding EYPS or QTS – and this quality addition would bring their hourly funding rate up to that received by nursery classes. About 40% of funded hours within PVI settings qualified for this supplement.
0
1
2
3
4
5
6
7
8 Kneller base rates (blocks) and funding average funding outcomes (lines)
PVI Nursery class Nursery school

75
The authority was not approved as a pathfinder area and thus introduced a single funding formula in 2011. The formula was however modified in 2013. Changes were made at that time to base rates and each of the supplements. At that time the formula included different base rates for sub-types of providers (£3.88 for childminders, £3.69 for PVI, £3.68 for nursery classes and £5.15 for nursery schools). The original base rate for schools had taken account of the allocations to schools for premises and management costs made within the schools formula. This was no longer possible owing to changes to the schools funding formula regulations and so additional allocations were made via the early years formula to contribute to meeting these costs. Interestingly at the same time as increasing the base rate for all maintained schools by 42p per hour, the quality supplement was also increased from 31p to 41p. This meant that it was possible for a PVI provider with suitably qualified staff to receive the same funding rate as schools. The paper to schools forum described this arrangement – whereby PVI providers could receive the same level of funding as maintained nursery classes – as an underlying principle for the formula. Changes to the flexibility supplement were also introduced. It was observed in the paper to schools forum that they had been originally introduced to guard against the risk of voids at settings offering flexible places. The paper notes that the demand for places was higher than ever (especially because of the new 2 year old entitlement) and the supplement was, in effect subsidising inefficiency. Consequently the flexibility supplements were halved.

76
Foxberry formula design Table A3.6 Base rate Deprivation Quality £3.39 maintained nursery class £3.03 PVI
10% of base rate for children in most deprived 30% LSOAs
10% base rate for good or outstanding 10% for PVI with 60%+ staff qualified to level 3
81% 5% 14% Figure A3.6
As shown by the 2014-15 budget statement, most of Foxberry’s free entitlement provision for 3 and 4 year olds was provided by maintained nursery classes (57%). The formula included a base rate of £3.39 for maintained nursery classes and £3.03 for all PVI providers along with deprivation and quality supplements. The deprivation supplement comprised a payment worth about 10% of the relevant base rate. The quality supplement involved two elements. A good or outstanding Ofsted rating also attracted a 10% supplement. A 10% quality payment was also paid to settings with more than 70% of staff trained to level 3. The 2014-15 budget anticipated 78% of hours in PVI settings and 100% of hours in maintained settings would qualify for this qualifications-based supplement. The formula, as originally proposed for approval by the Schools Forum in February 2010, was however somewhat more complex.
0
1
2
3
4
5
6
7
8 Foxberry base rates (blocks) and average funding outcomes (lines)
PVI Nursery class

77
The initial cost analysis identified hourly base rates for different sub-types of providers as identified below: Play group £2.66 Private day nursery £2.97 Maintained nursery class £3.78 Independent school £4.04 It included flexibility supplements for session lengths of 3-5 hours (4p), more than 5 hours (5p) and for sessions offered over more than 38 weeks per year (5p). The quality supplements relating to qualifications had the same criterion for schools as in 2014-15 although they attracted an additional 7p rather than 10% of the base rate. In the case of PVI settings 7p was awarded to settings with all staff at level 3. Deprivation funding was similarly less generous with the most deprived 10% of LSOAs attracting 7p, the next decile 6p and the third decile 5p. In order to protect settings from budget changes it was proposed that all settings should receive at least £3.31 per hour which was the 2009-10 hourly rate under the nursery education grant. It was planned that the transitional funding was to be phased out and funds transferred to increase the funding allocated through supplements. The formula was however reviewed in February 2011 leading to the changes seen in the 2014-15 formula. A cost survey had shown a wide range of costs across different types of providers and so it was decided to simplify the formula by having just two base rates, as shown below: Table A3.7 Base Rate by type of Provider 2011/2012 2010/2011 Play Group 3.00 £2.66 Private Day Nursery 3.00 £2.97 Maintained Class 3.36 £3.78 Independent school 3.00 £4.04 In addition it was believed the supplements were too small to provide a genuine incentive. Consequently they were reduced in number and increased in size, funded by the savings made in the base rates. The transitional guarantee of funding per hour equal to the nursery education grant level (£3.31) was also retained although it was anticipated very few providers would qualify.

78
Comerford formula design Table A3.8 Base rate Deprivation Flexibility £3.39 all group settings £2.60 childminders
Weights per pupil based on IDACI bands
£0.85 for sessions of more than 3 hours
93% 4% 2% Figure A3.7
Early education provision within the authority was dominated by maintained schools with the 2014-15 budget indicating 87% of funded hours were expected to be provided within nursery classes. Every primary school in the authority had a nursery class. In contrast the majority of funded provision for 2 year olds was provided within the PVI sector. In 2014-15, the formula included a single base rate for all group providers (£3.39) and a lower base rate for childminders (£2.60) with supplements for deprivation and flexibility. Deprivation funding was allocated on the basis of children’s home postcode. Each child’s IDACI score contributed to an aggregate score for the setting which would then place each setting in one of six deprivation bands. Through the deprivation supplement the average payment per hour to PVI settings was 10p while for nursery classes it was 17p. The prominence of maintained provision was reflected in the formula design. The flexibility element, £0.85 per hour, was available for children attending for more than three hours per day (the standard session length for a school). The
0
1
2
3
4
5
6
7
8 Comerford base rates (blocks) and funding outcomes (lines)
PVI Childminder Nursery class

79
supplement was described in relation to the additional staffing required by a school to supervise children through the lunch hour. However, by 2014/15 very few schools offered this form of flexible provision while most of the PVI provision qualified for the supplement. Consequently the average funding outcome per hour for PVI providers was much higher than the average funding outcome for nursery classes because of the effect of the flexibility supplement. The formula in operation in 2014-15 was very similar to that used in 2011-12. However it differed substantially from the 2010-11 formula when the authority had been a pathfinder for the introduction of the EYSFF. In that year a temporary formula was used with a £2.98 base rate, quality lump sum for settings with EYPS and a graduated scale of supplements for flexibility. Papers presented to the Schools Forum describe the process through which the formula was modified. The quality supplement was removed on the grounds that few PVI settings qualified for a EYPS supplement and that such qualified staff then tended to move on to be employed in schools. The PVI members of the Early Years Reference Group initially favoured simplifying the formula by incorporating all supplements into the base rate. However, modelling showed that PVI settings would lose out under such an arrangement and so PVI representatives subsequently favoured retaining the flexibility supplement. Conversely schools representatives argued children should attract the same level of funding and this should not be based on setting characteristics. The local authority proposed a compromise model which saw the quality supplement removed and a single flexibility supplement which would largely flow to PVI settings as they offered greater flexibility. The only subsequent change to the formula was the introduction of a childminder base rate in 2014-15. However the local authority had received complaints regarding the lower base rate paid to childminders and in 2015-16 this was revised so there was a single base rate payable to all providers.

80
Arabin formula design Table A3.9 Base rate Deprivation Quality Flexibility Healthy
snacks Premises abatement
£4 £0.10 where more than 50% of children in a setting lived in the most deprived 20% of LSOA
Good Ofsted grade £0.05 Outstanding Ofsted grade £0.10
£0.10
£0.05 per hour in PVIs and nursery schools
-£0.41 per hour taken from nursery classes
103% 2% 1% 1% 0.5% -7% Figure A3.8
The formula includes a single base rate for all providers (£4) with supplements of up to £0.10 for deprivation, quality, flexibility and healthy snacks. Most notably, the 2014-15 formula included a deduction of £0.41 per hour in the allocations to nursery school classes and this resulted in an average allocation for classes which was lower than the base rate. The deprivation supplement was payable at settings in which 50% or more of children lived in the most deprived 20% of LSOAs. (This included the majority of areas of the local authority). Settings also qualified for the supplement if the proportion exceeded 50% over the previous two years.
0
1
2
3
4
5
6
7
8 Arabin base rates (blocks) and average funding
outcomes (lines)
PVI Class Nursery school

81
Supplements of £0.05 to £0.10 were also included for providers rated ‘good’ (£0.05) or ‘outstanding’ (£0.10) by Ofsted and who met flexibility criteria (£0.10) of offering the early education entitlement for more than three hours per day and over a minimum of 44 weeks per year. In several ways the formula draws attention to the potentially complex relationship between early years funding arrangements and the funding system for schools. First, although the authority’s impact analysis prior to introducing the formula in April 2010, showed that the formula would increase allocations to maintained schools by 14% it also noted that this was entirely misleading. This is because, of 69 schools with nursery classes, 58 schools had their budgets topped up by the Minimum Funding Guarantee in 2009-10. Consequently for most of the schools early years pupils were triggering larger payments than were allocated by the funding formula. Second, when the EYSFF was initially introduced the schools funding formula (allocating resources from reception onwards) included a per pupil allocation to cover premises costs, which assumed early years pupils would also contribute to covering those premises costs. This approach was later however not permitted within the schools funding regulations. Consequently, in order to prevent premises costs being double funded an abatement of £0.41 per hour was introduced into the EYSFF, reflected in the 2014-15 figures shown in the diagram above.

82
Braxfield Borough formula design Table A3.10 Base rate Deprivation Quality £3.90 PVI £3.75 Nursery class £6.04 Nursery school
£0.25/£0.70/£1.00 For IDACI bands 4, 5 and 6
PVI Good £0.36 Nursery school Good £0.56 Nursery class Good £0.35 PVI Outstanding £0.54 Nursery school Outstanding £0.83 Nursery class Outstanding £0.52
88% 7% 7% Figure A3.9
The formula included one base rate for each main type of provider. The base rate for all PVI providers was £3.90 with a lower rate for maintained nursery classes (£3.75) and a higher nursery school base rate (£6.04), with supplements for deprivation and quality only. The origin of the difference in nursery class and PVI base rates was that there was a transfer from the early years block to the schools block to cover the early years portion of the cost of school business rates. With the exception of the business rates element the base rates for nursery classes and PVIs were identical because the analysis of staffing costs found little difference between the unit costs of different providers, owing to working at different ratios. It is clear that the difference in school and PVI base rates therefore did not arise from a ‘bottom up’ analysis of costs.
0
1
2
3
4
5
6
7
8 Braxfield Borough base rates (blocks) and average funding outcomes (lines)
PVI Nursery class Nursery school

83
The deprivation supplement was paid at different rates for children living in the highest three IDACI bands. The quality supplement was based on Ofsted grades although it was paid at different rates for different providers representing a percentage increase on the base rate. No flexibility factor was included because when two settings piloted fully flexible hours they found too many voids were created so that the settings were not financially viable and, in addition, it was reported that the settings felt more like a crèche than an educational environment. Instead there were three basic patterns of opening hours across the authority: 0800 to 1800, sessional providers and providers offering five hours over three days. Few providers offered combinations of these patterns. The formula has undergone substantial change both before the 2014-15 formula represented above and especially since that date. Prior to 2014-15 the quality supplement was modified. The original formula had Ofsted as the criterion for a quality payment. It was then suggested by providers that it should include a number of indicators including staff qualifications and turnover, and completion of a self-improvement plan. However data collection was onerous and caused delays to payment and so the formula reverted to the simple Ofsted indicator. Substantial changes were made for 2016-17. The formula was reviewed in the winter of 2015-16 and providers were consulted on changes which had been proposed by a working party of providers. Funds within the early years block were available for redistribution because the revision of IDACI, for the first time since 2010, saw substantially fewer areas qualifying for deprivation funding and because of an accumulated underspend of 2 year old trajectory funding. A temporary increase of 1.5% was made to the base rates. In addition, there was a temporary 2.5% increase to the base rate - described as a one-off quality supplement (payable to all providers) for 2016-17. Finally, the £0.15 payment for business rates was separated from the base rate and shown as a premises supplement payable to PVI providers (but not including childminders). The temporary changes were made pending the creation of a national funding formula for early years from 2017-18.
84
Annex 4 National policy and local implementation – the August 2016 proposals for a national funding formula Introduction In this Annex we describe the process of policy development that has led to current proposals in the 2016 Consultation document (DfE, 2016) for a national funding formula for early years. We suggest that this process is best understood in two phases, from 2011 to 2014, and from 2015 to 2016. During the first phase, the policy was closely related to proposals for a national funding formula for schools. In the period from 2015 onwards however the proposals have been closely linked with the introduction of an entitlement to 30 hours of childcare for working parents of three- and four-year-olds. Having described its origins from 2011-2014, then from 2015-2016, we then briefly summarise the proposals presented in the consultation document issued on 11th August 2016 and go on to discuss what light our research findings cast on the proposals. In particular we note changes in the identified purpose of a national funding formula and consider whether the DfE has reason to be confident that the proposed national funding formula can achieve the stated policy objectives. The stated overarching policy objectives are to:
- Ensure that there continue to be sufficient childcare places as we expand the free entitlement
- Enable all children to benefit from high quality provision - Ensure that the specific needs of individual children are met - Deliver affordable and flexible childcare that meets the needs of working
parents (DfE, 2016, para 72, p22) 2011 to 2014: early years funding and school funding reform Discussion of introducing a national funding formula for early years began within the first year of the operation of the EYSFF policy (DfE, 2011a). It is important to understand that, in 2011, the idea of a national funding formula for early years is best understood as a by-product of the desire to reform school funding rather than, in itself, being the driving force for reform.30 However, as plans for school funding reform progressed, plans also began to crystallize in relation to a national funding formula for early years. This would
30 For example, a 2011 consultation noted, ‘The funding for free early education is included within the overall school funding system… If a fair funding formula is introduced for reception to year 11 provision, there will obviously be implications for how free early education funding will operate… The relationship… will need to be clarified.’ (DfE, 2011a). It is also notable that the 2011 proposals explicitly ruled out creating an early years formula which determined allocations to individual settings.

85
provide a formula-based mechanism to distribute resources from central government to local government which was not based purely on the previous level of spending. It was also acknowledged that there was a need for careful implementation and transitional protection (DfE, 2012a; DfE, 2013b). That is, the putative formula was conceptualised as providing a consistent and transparent means of distributing resources from central government to local government. To facilitate the transition to a national funding formula for schools the DSG was split into ‘notional blocks’ from 2013-14. These blocks were based on local authorities’ budget data for 2012-13. (The variation in budgeted expenditure per hour on early education for 3 and 4 year olds is illustrated in Annex Figure A4.1.) In relation to the schools block, additional resources were provided to support schools in the ‘least fairly funded authorities’ from 2015-16 onwards. Notably additional funding for early years was not provided and remained ‘cash flat’ from 2013-14 to 2016-17.31 Thus during the period 2011 to 2014, proposals for funding reform relating to the free early education entitlement were closely tied to proposed reforms relating to schools funding and, in particular, with the replacement of the ‘spend plus’ method for allocating the Dedicated Schools Grant.32 Thus they were focused primarily on addressing inequalities of funding across areas.
31 Beneficiary authorities are listed in DfE (2014). 32 Given the marked change of emphasis which was to follow, it is interesting to note the comments of the then Parliamentary Under-Secretary of State to the House of Lords Affordable Childcare Committee in November 2014. House of Lords Select Committee on Affordable Childcare Committee, 26 November 2014, HL 117 2014-15, Ev 174 Wednesday 26th November 2014 Sam Gyimah, MP, Parliamentary Under-Secretary of State, Department for Education: There is a tension here, especially with a general election in the offing, and being tempted to offer more and more when I do not think that is necessarily the solution. More broadly on the 15 hours, there are some other parties who would say, “Why do you not offer 25 hours?”, for example. But the EPPSE evidence tells us that a little and often is best. Also, I am not sure that providers necessarily want to deliver 25 hours of state-subsidised childcare, because it limits their ability to offer other childcare that may come to them at a higher rate, to be brutally honest. The increased cost of that is quite enormous. Going from something like 15 hours to 25 hours would cost an extra £1.5 billion at least. Lord Sawyer: I cannot take any more time, but in the meantime, thank you Minister. The Chairman: We must move on, but Baroness Tyler, would you like to pick up the point about Ofsted that came up. Baroness Tyler of Enfield: Briefly, you talked about ways of driving up quality. A number of people who have given evidence to this Committee have questioned whether the current assessment framework that Ofsted is using is sufficient to secure the quality improvements that I think we would all like to see in the outcomes for children. Sam Gyimah: I think that we should focus relentlessly on quality. If our stated objective is to help with early education but to narrow the gap, it follows that we have to focus relentlessly on that.
86
2015 to 2016 – early years funding and the 30 hour Conservative manifesto pledge A moment of transformation, however, arose from the 2015 general election campaign. First, the 30 hour entitlement for working parents was a key manifesto pledge for the Conservative party. Second, the party announced that a Conservative government would increase the hourly funding rates paid to providers (Lepper, 2015; Gyimah, 2016). From this point, the development of a national funding formula became increasingly enmeshed with the commitment to offering 30 hours of childcare to working parents. In order to enable the Childcare Bill (the legislative means of delivering the 30 hour commitment) to pass through Parliament, a review of childcare costs was conducted in the summer of 2015 (Jarrett, 2016) This culminated in the publication of an analytical review in November 2015 (DfE, 2015a). The review identified the government’s estimate of the unit cost of providing one hour of early education for 3 and 4 year olds within maintained nursery classes (£4.37), private group based full day care open for 51 weeks per year (£4.25), voluntary sessional 38 week providers (£3.81) and childminders (£5 or £6.1233).34 At the same time, it was announced that a national funding formula for early years would be introduced from 2017-18 – coinciding with the roll-out of the 30 hour offer. A policy statement was issued in December 2015 to support Members of Parliament in their scrutiny of the Childcare Bill (DfE, 2015b). In a section headed Early Years National Funding Formula it stated (p7):
85In terms of how the funding is actually distributed to local authorities we are aware that there are historical inconsistencies and inefficiencies with the current funding system for three- and four-year-olds and we want to make adjustments to the rate to reflect local circumstances. On 25th November the Chancellor announced that the government will introduce a national funding formula for early years in 2017-18. This is to ensure that funding is transparently and fairly distributed between different types of providers and different parts of the country. We want councils to be able to afford to pay providers a sustainable rate and ensure that as much funding as possible reaches the front line. We have committed to consulting widely in the New Year on these issues, including on the transitional arrangements for the local authorities who will be most affected. [bold and italics added]
Thus while proposals for a national funding formula from 2011 to 2014 concerned the distribution of resources from central government to local 33 Two figures were identified for childminders, the higher figure assuming childminders wages corresponded with those of similarly qualified childcare worker and the lower figure assumed childminder wages were equal to the national minimum wage. 34 The estimates were somewhat lower than the CEEDA (2014) estimate of £4.55 per hour for PVI provision which is also referred to in the report.

87
government, the 2015 policy statement also addressed the fair and transparent distribution ‘between different types of providers’. The consultation anticipated in the New Year was delayed, eventually issued in August 2016. The relationship between a national funding formula and the 30 hour entitlement was made explicit in the first four paragraphs of the Consultation document (DfE, 2016, p.5).
‘1. To implement the 30 hours of free childcare, we need early years providers to deliver enough free childcare places to meet the needs of the nearly 400,000 families who will be eligible… 2. …To deliver successfully our manifesto commitment, we need to persuade significant numbers of providers to switch parent-paid hours for government-funded hours. As market rates exceed government funded rates, this is a significant challenge which we can only meet if we can distribute our early years budget as effectively and fairly as possible.
In short, the consultation is explicit, from its first sentences, that a national funding formula is conceived as a means of delivering the 30 hour entitlement. It continues (DfE, 2016, p.5):
3. The current early years funding system is manifestly not capable of doing this. The principal problem is the way in which the Government allocates funding to local authorities based on historic council expenditure. This leads to significant variations in funding for local authorities which correlate neither with provider costs nor market prices. They are therefore impossible to justify or explain. 4. There are also problems with the way in which some local authorities distribute their government allocations to providers… which leads to a non-level playing field between those from the maintained sector and those from the private / voluntary sector. This matters to 30 hours delivery, as the majority of 30 hours places will need to be delivered by the private / voluntary sector.’
The government has committed to several objectives:
- to ensure funding is transparently and fairly distributed between different types of providers and different parts of the country;
- to raise the hourly funding rate; - and to increase the free entitlement to 30 hours of childcare for 3 and 4
year olds whose parents work.35 Yet the redistributions implied by the creation of a national funding formula are not easily reconciled with the increased allocations implied by the second two. 35 The additional 15 hours will be available to families where both parents are working (or the sole parent is working in a lone parent family), and each parent earns, on average, a weekly minimum equivalent to 16 hours at national minimum wage or national living wage, and less than £100,000 per year.

88
The proposals The key elements of the proposals involve a formula for distributing funds from central to local government with some transitional protection for local authorities over a two year period. The proposed reforms would not determine funding allocations to individual providers but retain a role for a local funding formula. However the proposals also include substantial changes to the parameters within which local funding formulae could be designed. The proposals are described in full in the consultation document and are summarised below (DfE, 2016).
a) Distribution from central government to local government:
- a national formula to distribute funds from central government to local authorities from 2017 which is not based on previous expenditure levels
- the national funding formula would include a universal base rate - in effect, the number of entitlement hours provided to 3 and 4 year olds (distributing 89.5% of funds) and additional educational needs elements relating to FSM (8%), English as an Additional Language (1.5%), and Disability Living Allowance (1%)
- each formula element would be adjusted to reflect area costs and overall about 15% of allocations would be attributable to the area cost adjustment (the area cost adjustment was calculated assuming 80% of costs should be adjusted in line with the general labour market measure, 10% in line with a Nursery and Preschool Rateable Cost Adjustment and the other 10% of costs assumed to be the same across all areas)
b) Transitional protection for local authorities - funding reductions from central government to local government would
not exceed 5% in the first year or 5% in the second year
c) Distribution from local government to providers - 93% of funds would be passed on to providers in the first year, 95%
thereafter - EYSFF would use a single base rate from 2019-20 at the latest - 90% of funds to providers would be distributed through the base rate - A mandatory deprivation supplement would be retained, with optional
supplements for sparsity, flexibility, efficiency and delivery of the additional 15 hours
- On the use of quality supplements ‘we are minded not to retain a quality supplement… Quality is an expectation of government and parents, rather than an optional extra. This should not only be guaranteed by the use of supplements.’ (p43)
Several elements of the proposals are worthy of particular note. First, the findings of the Review of Childcare Costs (DfE, 2015a) appears to play little overt role in the proposals.36 Indeed, the consultation document suggests the review
36 Its key role may be in relation to the choice of area cost adjustment.

89
‘indicated that the costs of providing childcare are broadly comparable for a school nursery class, a private nursery or a charitable pre-school.’ (para 142, p35). It then goes on to state that ‘it cannot be fair that in some local authorities a child’s early education is funded at a lower level simply because of the type of setting they attend’ – taking, what we have described in the main report as an ‘equal funding’ approach to the ‘level playing field’. However an exception is made in relation to nursery schools, acknowledging that they have a different cost structure and should be supported owing to their reputation for quality and their location in disadvantaged areas. Supplementary funding for nursery schools is therefore provided although only guaranteed for two years. It is also noteworthy that the area cost adjustment does not correspond to that used for distributing either school funding, two year old entitlement funding or the methodology described by the DCLG (DCLG, 2013). In contrast to the other methods, it includes a substantial 10% weighting for a Nursery and Preschool Rateable Cost Adjustment. The impact of the proposals We now consider the proposals presented in the consultation document, drawing also on findings from our research on the public funding of early education. The consultation document, and accompanying spreadsheets (DfE, 2016) provide illustrative early years block allocations to local authorities under the proposed national funding formula and, in addition, ‘an illustrative hourly rate that a provider might expect to receive for 3-4 year old funding in 2017-18’. The consultation document reports that under the proposals 112 local authorities would see an increase in the rate of funding per hour of universal entitlement provided and 38 ‘overfunded’ local authorities would see a reduction.i In addition it reports that if local authorities moved immediately to using a single base rate for all provision, and if all supplements were distributed evenly across different types of providers, then PVI provision in 88% of authorities would see an increase in the rate received (compared with the average rate reported in 2015-16 benchmarking tables) and maintained nursery classes in 78% of authorities would see an increase in average rates. In what follows we have sought to recreate the comparisons reported in the consultation document. On this basis, 62 local authorities would see a reduction in one of these three rates (overall funding rate received by the local authority, average rate payable to PVI providers or average rate payable for maintained nursery class provision) and 88 authorities would see an increase in all three

90
rates. The different combinations of losses for the 68 authorities are shown in Figure A4.1.37 Figure A4.1 - Consultation proposals: 62 local authorities seeing a reduction in either the overall rate received (LA), the average rate payable to PVI providers (PVI) or the average rate payable to maintained nursery class providers.
37 Figures shown are derived from spreadsheet 1 issued with the consultation document ‘Illustrative allocations under early years national funding formula’. The 38 ‘overfunded’ local authorities are identified on the basis of: 78% of MNS funding [j] + universal and additional 3-4 year old funding [i])/((3-4 year old universal funding PTE [a] + additional 3-4 year old funding for working parents PTE [f])*570)) – LA hourly rate for 3-4 year olds for 2016-17 as identified through 2016-17 baselines exercise. While we have sought to reproduce the calculations reported in the DfE consultation document it is notable that the calculation includes ‘formula only’ outcomes (applicable after the first two years) and includes Maintained Nursery School Funding (although this is only guaranteed for two years). It is also notable that to arrive at a ‘baseline rate’ the expenditure total reported in the baseline year (2016-17) - as agreed through the rebaselining exercise carried out by the Education Funding Agency - has then been divided by the number of 3-4 year olds recorded in the January 2016 census. However, for the three authorities for which the DSG allocation figure for 2016-17 matches the agreed baseline figure, it appears that, in order to produce an hourly rate, the total spending was divided by a different number of children than the number which was used to generate the budget in the first place. Consequently it appears that the baseline rates shown may be misleading.
LA
Nursery Class PVI
5 3
4
9
21
18 2

91
Turbulence ahead 1.Change in central government to local government allocations The 88 authorities not shown in Figure A4.1 would each see an increase to their indicative local authority rate. In addition, the illustrative provider rate would represent an increase on average spending in both PVI settings and nursery classes compared with 2015-16. As we see in Figure A4.1, under the proposals 38 local authorities will see a fall in income from central government per hour of early education provided according to the DfE’s impact analysis for the consultation. In contrast 88 would see increases in the three indicative rates payable to providers (PVI and nursery class). The ten local authorities seeing the largest increase in funding from central government per hour of universal provision are shown in Table A4.1.38 All ten areas shown are London Boroughs of which eight are outer London boroughs. Table A4.1 - Change in funds received by local authority from central government (£ per hour of early education provided) Local authority Change (£ per hour) Hounslow £1.86 Richmond upon Thames £1.74 Greenwich £1.52 Kingston upon Thames £1.45 Merton £1.42 Harrow £1.42 Wandsworth £1.42 Barking and Dagenham £1.35 Hammersmith and Fulham £1.34 Havering £1.32
Source: Sheet 1 – Excel – illustrative allocations under early years national funding formula, available at: https://consult.education.gov.uk/early-years-funding/eynff Corresponding figures for the worst affected local authorities are shown in Tables A4.2 and A4.3. Of the 10 authorities seeing the largest fall in hourly rate, all ten are among the 21 local authorities for which the illustrative provider rate is higher than the average rate paid to PVI and to maintained nursery classes in 2015-16. One reason why the funding rate received by a local authority may decrease but their provider rates increase is the stipulation that at least 95% of funding must be passed on to providers from year two (excluding contingency funds). In short, for some authorities this will imply a substantial cut in central expenditure. A key question in these authorities will be how far reductions in
38 The authorities seeing the largest increase in their total budget for the universal entitlement provision for 3 and 4 year olds would be Surrey (a £12m increase arising from an increase in the hourly rate of £1.18), Hertfordshire (£8m from a £0.70 increase) and Essex (£7m from a £0.60 increase). The ten authorities seeing the largest increase notably also include Leeds (£6m from a £0.80 increase) and Manchester (£4m from a £0.79 increase).

92
central expenditure can be achieved without either increasing provider costs or reducing the quality of provision. The authorities seeing the largest fall in budgets are a diverse group among which Suffolk, Kirklees, Gloucestershire and Tower Hamlets would see the largest reductions. However, being ‘overfunded’ for early years provision does not imply also being correspondingly well resourced for school provision – despite the fact that both school and early years provision are funded through the Dedicated Schools Grant. This is illustrated if we consider the DfE’s distribution of additional funds for schools in the ‘least fairly funded’ authorities (allocations were made from 2015-16 onwards). The DfE provided additional funds to 68 local authority areas so that the level of funding per pupil reached a minimum threshold defined by the DfE (DfE, 2014b). Interestingly, 20 of the 68 areas deemed ‘least fairly funded’ for schools also appear in the 38 areas deemed to be ‘overfunded’ for early years provision. Tables A4.2 and A4.3 - Local authorities seeing largest reduction in funding received from central government per hour provided, and (Table A4.3) local authorities seeing the largest fall in total funding
Local authority
Change (£ per hour)
Total budget change (£ 000s) Local authority
Change (£ per hour)
Camden -£0.95
-1,294 Suffolk -£0.44 Islington -£0.84
-883 Kirklees -£0.22
Tower Hamlets -£0.76
-832 Gloucestershire -£0.16 Lambeth -£0.63
-811 Tower Hamlets -£0.76
Bristol -£0.52
-808 Bristol -£0.52 Hackney -£0.51
-802 Camden -£0.95
Halton -£0.51
-783 North Yorkshire -£0.29 Rutland -£0.50
-727 Islington -£0.84
Ealing -£0.49
-620 Derbyshire -£0.36
Southwark -£0.45
-588 Cheshire West and Chester -£0.22
Source: Sheet 1 – Excel – illustrative allocations under early years national funding formula, available at: https://consult.education.gov.uk/early-years-funding/eynff The particular balance of funding between school provision and early years provision within a local authority can have emerged for numerous reasons. Among these, local decision-making will have played a role (West and Noden, 2016). However, under national funding formula arrangements, the decision as to the balance between expenditure on early education and expenditure on schools will now lie in the hands of central government. For authorities in which there is a shift of funds between early years and school provision this will inevitably cause disruption. However this shift in resources is

93
not based on evidence as to the most efficient allocation of resources across age groups. 2. Illustrative hourly rates Moving on we now consider how the ‘illustrative average hourly rate that a provider might expect to receive’ compares with average rate actually received by providers in 2015-16. As we see in Table A4.4, the ten authorities where providers would see the largest gains in hourly rates for PVI provision are all in London, as are nine of the ten authorities seeing the largest rise in rates for schools. Table A4.4 – For PVI provision and maintained nursery class provision, ten authorities with the largest gain in the rate a provider might expect to receive in 2017-18 compared with the average rate received in 2015-16 PVI gain
Nursery class gain
Camden £3.36
Islington £3.54 Kensington and Chelsea £3.23
Camden £3.26
Westminster £3.10
Harrow £2.90 Hammersmith and Fulham £2.91
Tower Hamlets £2.82
Tower Hamlets £2.83
Lambeth £2.71 Lambeth £2.79
Hammersmith and Fulham £2.67
Harrow £2.53
Kensington and Chelsea £2.61 Islington £2.52
Kingston upon Thames £1.87
Southwark £2.46
Halton £1.83 Ealing £2.36
Greenwich £1.69
Source: Sheet 1 – Excel – illustrative allocations under early years national funding formula, available at: https://consult.education.gov.uk/early-years-funding/eynff In 13 local authorities the illustrative rate was lower than the average rate paid to both PVI providers and to maintained schools in 2015-16. For a further 23 the rate was lower than the average rate for maintained nursery classes (but not for PVI providers) and for five areas it was lower for PVI providers (but not maintained nursery classes). The largest losses when illustrative rates are compared with average rates paid in 2015-16 are shown in Table A4.5.

94
Table A4.5 - For PVI provision and maintained nursery class provision, ten authorities with the largest reduction in the rate a provider might expect to receive in 2017-18 compared with the average rate received in 2015-16
Local authority Change to PVI rate Local authority
Change to nursery class rate
Slough -£0.64
Hampshire -£2.37 North Lincolnshire -£0.50
Thurrock -£1.38
Bradford -£0.41
Kent -£0.92 Stoke-on-Trent -£0.33
Birmingham -£0.84
Bolton -£0.24
Plymouth -£0.69 Stockport -£0.17
Shropshire -£0.65
Brighton and Hove -£0.15
Somerset -£0.64 Dorset -£0.12
Northamptonshire -£0.61
North Yorkshire -£0.12
Liverpool -£0.58 Hampshire -£0.11
Poole -£0.52
Source: Sheet 1 – Excel – illustrative allocations under early years national funding formula, available at: https://consult.education.gov.uk/early-years-funding/eynff While these comparisons imply that there would be a great deal of funding turbulence for some types of provider in some areas, these are only comparisons of changes in average rates. For individual providers changes in funding rates could be larger or smaller. There are several reasons why the degree of turbulence in the local funding rates received by providers could be expected to be substantial. First, the proposals require that all local authorities distribute funding to providers using a single base rate and that 90% of funds are distributed through that base rate. Two thirds of authorities use more than one base rate, as was discussed in the main report, while half of authorities currently distribute more than 10% of funds through supplements. Second, the proposals state the government is minded to rule out the use of quality supplements within funding formulae. This is at present the most widely used type of supplement and can be central to pursuing locally determined policy objectives. Indeed, it can be central to achieving central government’s overarching policy objective which relates to the quality of provision. However as we saw in the main report, quality supplements relating to staff qualifications in particular can produce funding outcomes which central government may consider to be at odds with other stated policy objectives – and in particular to ensure that sufficient funds are channelled to support PVI settings which are expected to provide most of the additional hours required through the 30 hour entitlement (see above, paragraph 4 of the consultation document). Third, providers within a single authority may currently be paid at numerous different rates. This is true even when we ignore the variations in payment rates which arise from additional payments through the compulsory deprivation supplement. For example, across nine case study authorities the smallest

95
number of different rates payable to providers was five. In one authority providers could receive 56 different rates. Conclusion We have seen that the proposal for a national funding formula for early years, while originating from plans for a national funding formula for schools, is now presented as a means of enabling the delivery of the 30 hour entitlement for working parents. The proposals comprise not only a formula for distributing funds from central government to local government but also include substantial changes to the rules governing the EYSFF. The proposals leave many questions unanswered, in particular the future funding of nursery schools, and how funding levels will respond to future cost pressures. The most notable changes to the rules surrounding the design of EYSFF are the use of a single base rate by 2019-20, the distribution of 90% of funds through that base rate, and the announcement government is minded to disallow the use of quality-related supplements. As we have seen in the main report, this would have substantial effects as most formulae include more than one base rate and because quality supplements are the most common type of supplement. We have suggested that the reforms will create substantial turbulence across local authorities, within local authorities, across sectors and also across providers. While the consultation document acknowledges that 38 areas will see a reduction in funding, the number which would see a reduction in the average rate paid to providers compared with the average rate paid to providers either in the nursery class sector or the PVI sector is larger. Local authorities may seek to ameliorate the worst effects of the funding changes through redesigning their local funding formulae. As the consultation acknowledges, some elements of local formula design appear to be rational reactions to particular local circumstances. In the light of the proposed changes to local funding formulae, local authorities will inevitably need to shift their focus from achieving local objectives and towards ameliorating the highly unpredictable effects of the proposed reforms. In addition, they will often need to ameliorate those effects but with less flexibility (owing to the requirements that 90% of funding flow through a single base rate and to the possible removal of quality-related supplements). Early education and childcare is provided by a patchwork of different types of providers, with very different operating models. Central government is not in a position to predict the local impact of the funding reforms it has proposed. Even less predictable is the effect of the proposals - and also of the entitlement to 30 hours of free provision - on the sustainability of that diverse range of providers and on their ability to maintain the improvements in the quality of provision.

96
The potential impact of funding changes were summarised succinctly by the manager of a private day care setting:
I have some parents who work five days a week and pay £185. At the moment I get £4.68 an hour for entitlement funding because I qualify for all the supplements. If the government pays, say, £4 per hour for thirty hours, that’s £120. (Private setting manager)
Speaking in April 2016, some months before the consultation was published, this appeared a pessimistic projection. However it proved prescient. For the relevant local authority, £4.06 is the ‘illustrative average hourly rate that a provider might expect to receive’ in 2017-18.

97
Figure A4.1 2014-15 DSG hourly rate for 3 & 4 year olds
*Calculated as (Early Years Guaranteed Unit of Funding*0.6)/570 Source: Dedicated Schools Grant: allocations 2014 to 2015, available at: https://www.gov.uk/government/publications/dedicated-schools-grant-2014-to-2015
-
1,000.00
2,000.00
3,000.00
4,000.00
5,000.00
6,000.00
7,000.00
8,000.00
9,000.00
10,000.00
-
1.00
2.00
3.00
4.00
5.00
6.00
7.00
8.00
9.00
10.00
EY G
uara
ntee
d un
it of
fund
ing
£ pe
r hou
r *

98
References Blanden, J., Del Bono, A., McNally, S. and Rabe, B. (2016) Universal pre-school education: the case of public funding with private provision, The Economic Journal, 126, 682-723. CEEDA (2014) Counting the cost: an analysis of the delivery costs for funded early years education and childcare, Stockton-on-Tees: CEEDA. Children, Schools and Families Committee (2010) The early years single funding formula, HC131 2009-10, London: The Stationery Office. Department for Children, Schools and Families (2008) Implementation of a single funding formula for early years: Interim guidance for local authorities July 2008, London: DCSF. Department for Children, Schools and Families Department for Children, Schools and Families (2009a) Implementing the early years single funding formula: practice guidance July 2009, London: DCSF. Department for Children, Schools and Families (2009b) March 2009 ‘Captured Learning’ available at: http://webarchive.nationalarchives.gov.uk/20100519154004/http://dcsf.gov.uk/everychildmatters/resources-and-practice/ep00403/ Department for Communities and Local Government (DCLG) (2013) Methodology guide for the Area Cost Adjustment 2013/14, London: DCLG. Department for Education (DfE) (2011a) A consultation on school funding reform: rationale and principles, London: DfE. Department for Education (DfE) (2011b) A consultation on school funding reform: Proposals for a fairer system, London: DfE. Department for Education (DfE) (2012a) School funding reform: next steps towards a fairer system, London: DfE. Department for Education (DfE) (2012b) Statutory guidance for local authorities on the delivery of free early education for three- and four-year-olds and securing sufficient childcare, London: DfE. Department for Education (DfE) (2012c) School funding reform: arrangements for 2013-14, London: DfE. Department for Education (DfE) (2013a) Early education and childcare: statutory guidance for local authorities, London: DfE. Department for Education (DfE) (2013b) Consultation on proposed changes to the role of the local authority in early education and childcare, London: DfE.

99
Department for Education (2013c) Provision for children under five years of age in England: January 2013, SFR 23/2013, London: DfE. Department for Education (DfE) (2014a) Early education and childcare: Statutory guidance for local authorities, London: DfE. Department for Education (DfE) (2014b) Fairer school funding: arrangements for 2015 to 2016, London: DfE. Department for Education (2014c) Provision for children under five years of age in England: January 2014, SFR 20/2014, London: DfE. Department for Education (2015a) Review of childcare costs: The analytical report – an economic assessment of the early education and childcare market and providers’ costs, London: DfE. Department for Education (2015b) Childcare Bill: Policy statement, December 2015, London: DfE. Department for Education (2015c) Provision for children under five years of age in England: January 2015, SFR 20/2015, London: DfE. Department for Education (2016) An early years national funding formula and changes to the way three- and four-year-old entitlements to childcare are funded, London: DfE. Department for Education and Employment (DfEE) (1994) Statistics of education: schools in England 1995, London: HMSO. Department for Education and Employment (DfEE) (1995) Statistics of education: schools in England 1995, London: HMSO. Department for Education and Employment (DfEE) (1996) Statistics of education: schools in England 1995, London: HMSO. Gambaro, L., Stewart, K. and Waldfogel, J. (2013) A question of quality: Do children from disadvantaged backgrounds receive lower quality early years education and care in England? CASE Working Paper, London: LSE. Gillie, C and Allen, G. (1996) Nursery education and grant-maintained schools Bill Research paper 96/8, London: House of Commons Library. Gyimah, S. (2016) ‘Work with us on 30 hours’, Nursery World, Available from: http://www.nurseryworld.co.uk/nursery-world/opinion/1156031/work-with-us-on-30-hours Hillman, J. and Williams, T. (2015) Early years education and childcare: lessons from the evidence and future priorities, London: Nuffield Foundation.

100
Jarrett, T. (2016) Childcare Bill 2015-16: analysis for Commons Report Stage (Bill 107), Briefing paper Number 7397, London: House of Commons Library. Lepper, J. (2015) Conservatives offer funding boost for free childcare scheme, Children and young people now, Available from: http://www.cypnow.co.uk/cyp/news/1150850/conservatives-offer-funding-boost-for-free-childcare-scheme (accessed 14/9/2016) Low Pay Commission (2014) National minimum wage low pay commission report 2014, Cm 8816, London: The Stationery Office. National Audit Office (2016) Entitlement to free early education and childcare, HC853, London: The Stationery Office. House of Commons Committee of Public Accounts (Public Accounts Committee) (2016) Entitlement to free early years education and childcare, 2016-17, HC224, London: The Stationery Office. Noden, P. and West, A. (2008) The Funding of English Primary Education (Primary Review Research Survey, 10/1), Cambridge: University of Cambridge Faculty of Education. Paull, G. (2014) Can government intervention in childcare be justified? Economic Affairs, 34, 1, 14-34. Rumbold, A. (1990) Committee of Inquiry into the quality of the educational experience offered to 3 and 4 year olds, chaired by Mrs Angela Rumbold CBE MP, London: HMSO. Sparkes, J. and West, A. (1998) An evaluation of the English nursery voucher scheme 1996-97, Education Economics, 6, 2, 171-184. Stewart, K. (2013) Labour’s record on the under fives: policy, spending and outcomes 1997-2010, Social policy in a cold climate working paper, SPCCWP04, London: Centre for Analysis of Social Exclusion, LSE. Stewart, K., Gambaro, L. and Waldfogel, J. (eds) (2014) An equal start? Providing quality early education and care for disadvantaged children, Bristol: Policy Press. UK Parliament (2012) Schools and Early Years Finance Regulations 2012, SI 2012/2991 West, A. (2006) The pre-school education market in England from 1997: Quality, availability, affordability and equity, Oxford Review of Education, 32, 3, 283-301. West, A. and Noden, P. (2016) Public funding of early years education in England: An historical perspective, London: LSE.

101
West, A., Pennell, H. and Hind, A. (2009) Quasi-regulation and principal-agent relationships: Secondary school admissions in London, England, Educational Management, Administration and Leadership, 37, 6, 784-805. West, A., Roberts, J. and Noden, P (2010) Funding early years education and care: Can a mixed economy of providers deliver universal high quality provision? British Journal of Educational Studies, 58, 2, 155-179.


