Philadelphia’s Anti-Violence Initiative Reduction Group... · the shooting victims were children...
39
Philadelphia’s Anti-Violence Initiative By: Tolulope Adeleye, Dennis Feldman, Kiersten Gibson-Cooper, Alex Harris, Arthur Jackson, Rebecca Kaufman, Matthew Kravchuk, Tatiana Olaru, Thomas Poole, Tyler Row, and Elizabeth Slivjak, 8/8/2012
Transcript of Philadelphia’s Anti-Violence Initiative Reduction Group... · the shooting victims were children...

Philadelphia’s Anti-Violence Initiative
B y : T o l u l o p e A d e l e y e , D e n n i s F e l d m a n , K i e r s t e n G i b s o n - C o o p e r , A l e x H a r r i s , A r t h u r J a c k s o n , R e b e c c a K a u f m a n , M a t t h e w K r a v c h u k , T a t i a n a O l a r u , T h o m a s P o o l e , T y l e r R o w , a n d
E l i z a b e t h S l i v j a k ,8/8/2012

1
Table of Contents
Writer Biographies .......................................................................................................................... 2
Executive Summary ........................................................................................................................ 3
Statistics .......................................................................................................................................... 4
GunStats .......................................................................................................................................... 9
Media ............................................................................................................................................ 14
Community Engagement .............................................................................................................. 16
Appendix ....................................................................................................................................... 21

2
Writer Biographies Tolulope Adeleye Rahway, NJ – MPH, -Drexel University, 2013 – Department of Behavioral Health and Intellectual Disability – Her area of interest is overall health and wellness focusing on mental health. Dennis Feldman Los Angeles, CA - B.A., -Political Science, Saint Joseph's University, 2012 - Mayor's Commission on Aging Kiersten Gibson-Cooper Laverock, PA, - B.A., -Temple University, 2013 - She is a rising senior majoring in African-American Studies. This summer, she has been interning at the Mayor's Office of Community Services. In the future she hopes to attend graduate school for social policy. Alex Harris Austin, TX - B.A., -St. John's College, Santa Fe NM - City Planning Commission, Strategic Planning Division - Alexander is interested in land policy, particularly in how land taxes are structured and how they impact both urban and agricultural interests. He intends to apply for research fellowships and eventually get a Ph.D in economics. Arthur Jackson III Oakland, CA - MPP, H. John Heinz III School of Public Policy and Management, Carnegie Mellon University, 2013 - Office of Budget and Program Evaluation - Arthur is interested in urban policy, public budgeting, government efficiency, and education. Rebecca Kaufman Philadelphia, PA - MSW, Temple University, 2013 - Deputy Mayor's Office of Health and Opportunity - Rebecca's educational focus is in community and policy, with strong interest in children and families. Matthew Kravchuk Philadelphia, PA - Holy Family University - 2012 - Majoring in Criminal Justice with a double-minor in Pre-Law and Political Science - Matthew is currently pursuing a career as an Officer in the United States Marine Corps, with eventual hopes of law school. Tatiana Olaru Greenfield, MA – Middlebury College – Majoring in Political Science. Office of the Managing Director – PhillyRising Thomas Poole Havertown, PA - B.A., -Temple University - Majoring in Political Science - Thomas will be returning to Temple University as a junior this coming fall. He hopes to continue studying Political Science to attain his Masters and eventually attend University of Penn Law School. His ultimate career goal is to enter politics and become a Senator the state of Pennsylvania.
Tyler Row New Cumberland, PA – B.A., -Temple University, 2013 – Majoring in History, Political Science & Economics Minors,– Philadelphia Police Department, Grants Management Unit – Tyler is interested in attending law school in the future. Elizabeth Slivjak Philadelphia, PA – University of Pennsylvania, 2013 – Mayor's Office of Community Services - At Penn, Elizabeth is pursuing a major in History and a minor in Psychology. In the future, she hopes to attend law school.

3
Executive Summary The first strategic goal of Mayor Michael Nutter is to make Philadelphia one of the safest cities in America. This report aims to provide an examination of the nature of violent crime in Philadelphia as well as review the city's main crime reduction efforts that support the Mayor's first strategic goal. Philadelphia has the highest homicide rate among large U.S. Cities, at 19.6 homicides per 100,000 individuals; this rate is twice that of Los Angeles and New York City. From 2007 to 2010 the number of homicides declined by 22%, resulting in nearly 30,000 fewer victims of serous crime in comparison to 1998. However, in 2011 there was an increase in the number of homicides by 5%. As of July 31, 2012, there have been 207 homicide victims. This number outpaces 2011’s year-to-date number of 190. In addition, from 2007 to 2010, more than half of the shooting victims were children and young adults, while 73% of arrested murder offenders were between the ages of 18 and 34. In 2008, the Philadelphia Police Department released their Five Year Plan for crime reduction. This plan aims to better align resources, infrastructure, and increase the effectiveness of reducing crime. This report identified six central performance measure goals including: decreasing the number of homicides by 25%, decreasing the number of shooting victims by 20%, decreasing Part 1 crimes by 20%, increasing the number of guns taken off the streets by 5%, increasing in homicide clearance rates by 60%, and increasing the clearance rate for all violent crimes from 5% to 25%. In an effort to successfully meet these performance measures, the City has employed a series of initiatives aimed at reducing violence. These strategies include: Smart Policing Strategies, the GunStat program, PhillyRising Collaborative, Community Engagement Strategies, and the effective utilization of social media.
• The Smart Policing Strategy involves using evidence-based techniques to reduce violent crime. This strategy involves increasing foot patrol presence, which in a controlled experiment resulted in a 22% reduction in crime and a 13% increase in arrests, where active foot patrols were utilized.
• The GunStat Initiative is a multi-agency collaboration among the City, Commonwealth, and Federal partners that identifies and reports on the worst offenders in some of the highest crime areas. Chaired by the Police Commissioner and based on the CompStat Model, these offenders are monitored from arrest through incarceration and the parole period.
• The PhillyRising Collaborative targets neighborhoods through Philadelphia that are plagued by chronic crime and quality of life concerns, and establishes partnerships with community members to address these issues. The PhillyRising Team coordinates the actions of the City agencies to empower neighbors to realize their vision for their community.
• Community Engagement is a multi-component initiative to work with and connect to the neighborhoods identified by GunStat and develop a more trusting relationship with the

4
government. This effort partners with city officials with organizations active in these areas in an effort to resolve gun violence and rebuild communities impacted by gun violence.
• Media strategies have been incorporated in the effort to reduce violent crime. The utilization of popular social networking sites, technology, and television helps to encourage community members to participate in the strides to make Philadelphia safer.
As a result of the City’s wide range of efforts aimed at violence reduction, we recommend strengthening the City’s preexisting efforts by:
• Developing a unified metrics system for agencies and programs that are working in the violence prevention field
• Developing a strong network for agencies and programs that support violence reduction efforts with the end goal of sharing information and effective collaboration
Statistics
Total Part 1 Crimes & Part 1 Violent Crimes
Part 1 crime provides a long term perspective of total crime in the City of Philadelphia. Part 1 crime is comprised of two major components, violent crime and property crime. 1998 represented an all time high in Part 1 crime with totals reaching 106,078. As of 2011, the number had decreased nearly 30,000 to 75,534, with much of this decline due to a significant drop in auto theft. Property crimes account for nearly 75 percent of all Part 1 crimes from 2007 to 2011.
82,974 83,351
75,05174,006
75,634
68,000
70,000
72,000
74,000
76,000
78,000
80,000
82,000
84,000
86,000
2007 2008 2009 2010 2011
2007-2011 Total Part I Crimes
21,17920,771
19,16318,535
17,559
15,000
16,000
17,000
18,000
19,000
20,000
21,000
22,000
2007 2008 2009 2010 2011
2007-2011 Part 1 - Violent Crimes
Figure 1 Figure 2

5
Homicide & Shooting Victims
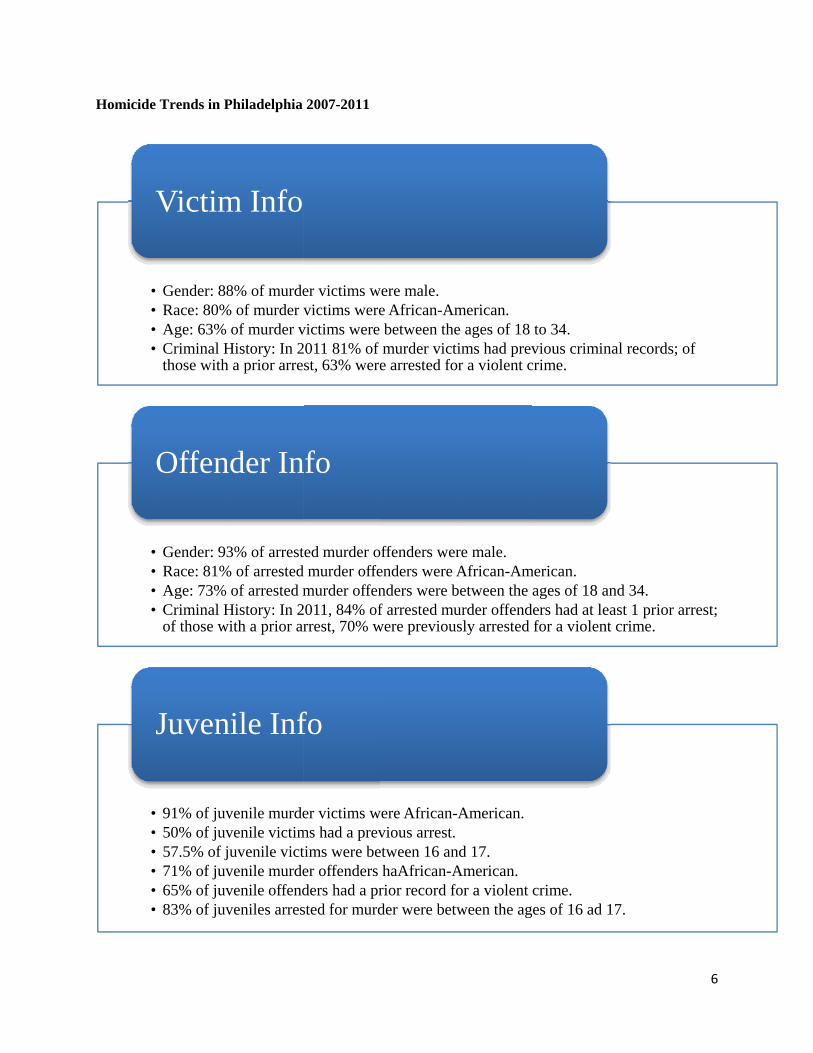
Since 2007, the City has made significant strides in reducing Part 1 crimes. However, homicide remains a challenge. Through July 2012, 208 individuals lost their lives to homicide. From 2007 to 2011, African American males accounted for 81% of offenders arrested for homicide and 80 percent of all victims. 63 percent of homicide victims were between the ages of 18-34. In 2011, 81 percent of murder victims had previous criminal records, of those with a prior arrest 63 percent were arrested for a violent crime. From 2007 to 2010 the number of homicides declined 22 percent. However, 2011 marked a slight increase of 5 percent from the previous year. Homicides are also up when comparing the years 2011 and 2012 through the month of July.
Between 2007 and 2009, the number of shooting victims declined by 400. Then, in 2010, for the first time since 2005-2006 the City experienced an increase in both homicides and shooting victims. While shooting victims declined in 2011, homicides continued to increase and that trend has continued as of July 2012. This trend in the shooting victims and homicides indicate that there is not a direct correlation between the number of shooting victims and homicides. That is, homicides are not simply a percentage of shooting victims. From 2007 to 2011 22% of all shooting victims resulted in homicide
391 332 305 306 324
1,7301,597
1,3661,478 1,421
0
200
400
600
800
1,000
1,200
1,400
1,600
1,800
2,000
2007 2008 2009 2010 2011
Homicides
Shooting Victims
2007-2011
Homicides vs. Shooting Victims Figure 3
Homicide
••••
••••
••••••
e Trends in P
• Gender: 88• Race: 80%• Age: 63% • Criminal H
those with
Victim
• Gender: 93• Race: 81%• Age: 73% • Criminal H
of those w
Offen
• 91% of juv• 50% of juv• 57.5% of j• 71% of juv• 65% of juv• 83% of juv
Juven
Philadelphia
8% of murde% of murder v
of murder vHistory: In 2h a prior arres
m Info
3% of arrest% of arrested
of arrested mHistory: In 2
with a prior ar
nder In
venile murdevenile victimuvenile victvenile murdevenile offendveniles arres
nile Inf
2007-2011
er victims wvictims were
victims were 011 81% of st, 63% were
ed murder omurder offe
murder offen011, 84% ofrrest, 70% w
nfo
er victims wms had a prevtims were beer offenders ders had a prsted for murd
fo
were male.e African-Ambetween themurder victe arrested fo
offenders werenders were Anders were bf arrested mu
were previou
were African-vious arrest.etween 16 an
haAfrican-Arior record foder were bet
merican. e ages of 18 tims had prevor a violent c
re male.African-Am
between the urder offendsly arrested
-American.
nd 17.American.for a violent ween the ag
to 34. vious crimin
crime.
merican.ages of 18 a
ders had at lefor a violent
crime.es of 16 ad 1
nal records; o
and 34.east 1 prior at crime.
17.
6
of
arrest;

7
Other Trends of Interest
Methods of Homicide
The percentage of gun related homicide has fallen from 84.1% in 2007 to 81.5% in 2011. The reduction in the percentage of gun related homicide is due to a decrease in the numbers of gun related homicides, not by any increase in other method.
Homicide Victims Criminal History & Offenders by Age
Evidence indicate that juveniles with and without prior offenses become victims of homicide at nearly the same rate. This is not true of adults. Adults with prior criminal histories are overwhelmingly more likely to be the victim of a homicide. From 2007 to 2007, adults with prior criminal history
050
100150200250300350400450
2007 2008 2009 2010 2011
Other
Gunshot
StrangulationKnife/Edged WeaponPhysical AssaultBlunt Force TraumaArson
0
50
100
150
200
250
300
350
400
450
2007 2008 2009 2010 2011
Juveniles without Priors
Juveniles with PriorsAdults Without PriorsAdults with Priors
0
50
100
150
200
250
300
2007 2008 2009 2010 2011
Adult
Juvenile
2007‐2011
2007‐2011
Adult and Juvenile Homicide Victims
2007‐2011
Homicide Offenders
Figure 5 Figure 6
Figure 4.

8
accounted for 75 percent of all homicides. In 2011, 84 percent of adult homicide offenders had at least 1 prior arrest, of those with a prior arrest 70 percent were previously arrested for a violent crime.
Homicide Victims & Offenders by Race
How is the City Performing?
In 2008, through its Crime Fighting Strategy and Five-Year Plan, the City of Philadelphia set out to reduce crime by more effectively allocating resources. This new effort includes a collaborative process with the communities, city agencies, academic institutions, and law enforcement focused on preventing crime and disorder, and bringing those who commit crime to justice.
0
50
100
150
200
250
300
350
400
450
2007 2008 2009 2010 2011
2007-2011 Homicide Victims by Race
Hispanic
Native American
Asian/Pacific Islander
Black
White0
50
100
150
200
250
300
2007 2008 2009 2010 2011
2007-2011 Homocide Offenders by Race
Hispanic
Native American
Asian/Pacific IslanderBlack
White
Crime Fighting Strategy Performance Goals Measure 2007
(Base) 2008 2009 2010 2011 2007-2011
Reduction in the number of Homicides by 25%
391 -15.5%
-8.8%
1.3%
5.9%
-17.9%
Decrease the number of shooting victims by 20%
1,730 -9.9% -2.6% 6.2% -2.7% -9.1%
Reduce Part I crimes by 20%
82,074
.5%
-10.0%
1.7% 2.0% -6.1%
Increase the number of guns taken off the streets by 5%
4,911
1.8%
-18.7%
-2.2%
-.2%
-19.2%
Increase homicide clearance rate to 65%
58.6%
74.9%
75.7%
70.3%
60.2%
Increase the clearance rate for all violent crime 50%
45.9%
51.8%
51.8%
49.2%
49.3%
Figure 7 Figure 8
Figure 9

9
Conclusion
Since 2007, the City of Philadelphia has made major strides in reducing homicides and removing illegal firearms from the street, and prosecuting those who commit violent crime. While the City still faces problems eliminating crime, it is very close to meeting its performance goals. More importantly, the City of Philadelphia has become a much safer city.
GunStat
Historical Context
The Philadelphia GunStat program is chaired by both District Attorney Seth Williams and Police Commissioner Charles Ramsey, and was implemented in January of 2012 by Mayor Michael Nutter. GunStat is based on the CompStat Model, which is a management style of crime reduction, first implemented by New York City Police Commissioner William Bratton in 1994. This model has shown a significant reduction in crime in targeted areas of New York City over the past eighteen years. This reduction is crime is due to the CompStat Model’s use of rapid deployment of personnel and resources, allowing for more arrests through tailored policing strategies.
Mission and Goals
Philadelphia’s version of CompStat, known as GunStat, focuses on the prevention of gun crime, by targeting violent offenders in designated hotspot areas. The mission of GunStat is to utilize criminal intelligence for precise targeting and prosecution in Philadelphia’s most violent neighborhoods. GunStat utilizes: centralized monitoring, coordinating, rapid decision-making, and prioritization of resources to support both investigations and prosecution. In conclusion, GunStat aims to enhance the quality of life for the citizens of Philadelphia by preventing shootings and homicides.
GunStat is a program created as a measure to identify high-risk individuals in “hotspot” neighborhoods within the City of Philadelphia and to share information across government agencies in a coordinated effort to reduce gun violence. The missions of GunStat are
(1) To identify violent repeat offenders, increase the investigations surrounding these offenders, and to reduce the amount of gun crimes in the City,
(2) To increase the collaboration between departments within City government in order to share data and
(3) To promote safety within “hotspot” neighborhoods through the use of community development organizations.
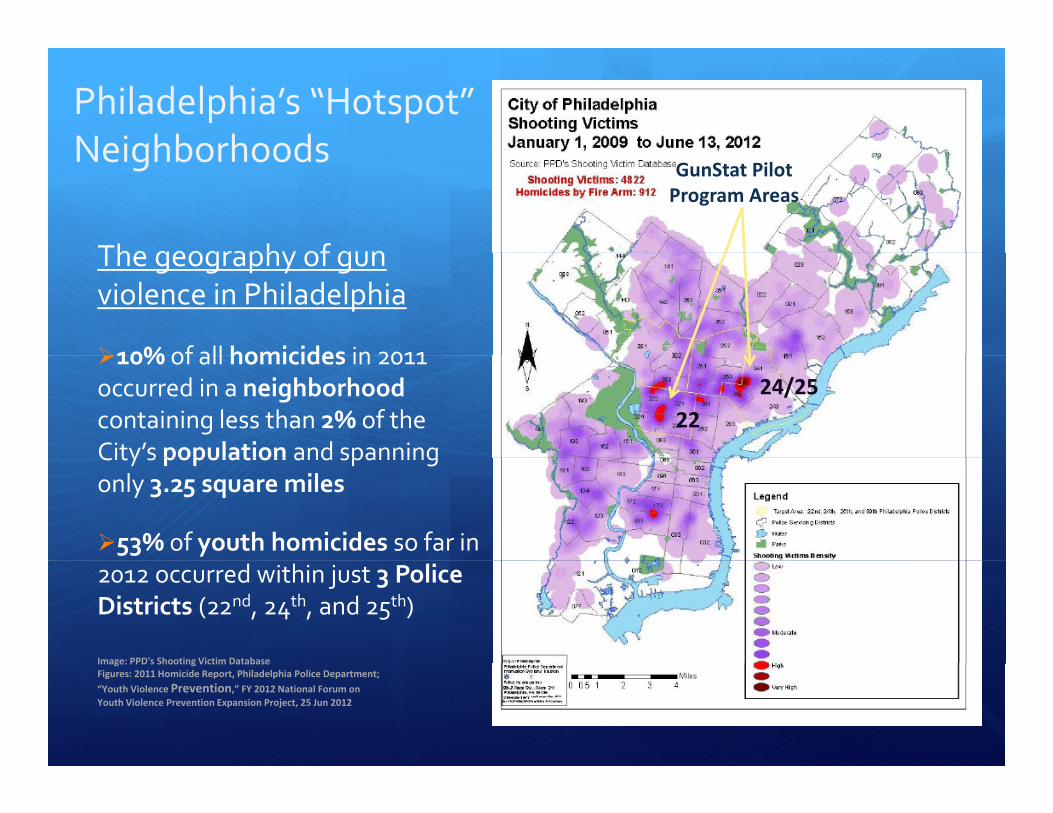
“Hotspot” Neighborhoods
One critical component in addressing Philadelphia’s gun violence epidemic is to understand the extent to which gun violence is concentrated within specific neighborhoods within the City. A handful of specific neighborhoods in Philadelphia have a noticeably higher level of gun violence as compared to the total statistical average for the City of Philadelphia as a

10
whole. It is the role of GunStat to focus geographically on a handful of neighborhoods where a significantly higher concentration of gun violence occurs.
The primary hotspot neighborhoods in the City of Philadelphia are located within a handful of Police Districts. One of these hotspot neighborhoods is located within the adjacent 22nd and 39th Police Districts in Western North Philadelphia. The adjacent 24th and 25th Districts in Eastern North Philadelphia contain another hotspot neighborhood, as do the adjacent 1st and 17th Districts in Western South Philadelphia and the 15th District in Southern Northeast Philadelphia. Within these four Police Districts, the neighborhoods that face the most threatening gun violence problem include:
• District 15: Frankford to Mulberry, Drye to Brill • District 22/26: Huntington to York, Germantown to Fairhill • District 22: Lehigh to Cumberland, 29th to 31st • District 22/39: Cambria to Oakdale, 23rd to 27th • District 17/1: Watkins to Snyder, 21st to Point Breeze/23rd • District 24/25: Tioga to Allegheny, E to I to Kensington • District 12: Kingessing to Woodland, 51st to 54th
A map illustrating the geographical component to gun violence in Philadelphia is presented on the following page.
A few alarming statistics illustrate how geographically concentrated Philadelphia’s gun violence crisis is. In 2011, the 22nd District in Western North Philadelphia contained a higher number of young shooting victims between the ages of 14-25 than any other District in the City. Ten percent of homicides that occurred in the City of Philadelphia occurred in the 22nd District in a neighborhood containing less than 2 percent of the City’s population and spanning only 3.25 square miles.1 Over half (52.9 percent) of all youth homicides that occurred so far in 2012 took place within the same three Police Districts (22nd, 24th, and 25th).2
This geographical dimension to gun violence is critical to PPD’s effort to decrease gun violence citywide. PPD, through the GunStat initiative, has launched its effort toward neighborhoods within the 22nd and 39th Districts in Western North Philadelphia and the 24th and 25th Districts in Eastern North Philadelphia as part of the pilot stage of the program. GunStat will be expanded to address gun violence in other hotspot neighborhoods after PPD learns lessons from the pilot program and refines its program once they pilot stage is complete. The effort will focus around uncovering what connections top offenders have to hotspot neighborhoods. GunStat will also continue to increase its effort toward prioritizing local, state, federal, and private strategic “place-based” investments toward these communities
1 “Youth Violence Prevention: FY 2012 National Forum on Youth Violence Prevention Expansion Project.” June 25, 2012. 2 Ibid.

11

12
Coordination and Collaboration
In a collaborative effort to reduce gun violence in the city of Philadelphia, GunStat connects criminal justice, law enforcement and community partners to facilitate better tracking of persons who commit gun crimes.
Current law enforcement procedure operates on an information warehousing system; a paradigm. Information can often be organized ineffectively and poorly validated. Information can also be difficult to research, and much of the information is often of marginal relevance for decision makers. GunStat however sets a broad set of stakeholders and perspectives, using multiple agencies with multiple decision makers. GunStat serves as a common repository of information of gun violence in targeted areas for decision makers, with hopes of leading to faster and better investigative and prosecutorial decisions.
It is essential that the Police and the District Attorney’s Office work in a partnership to execute the GunStat mission statement. These two parties must utilize information, such as: offender names, geography, and actual incidents of gun violent. This information can then be applied to the GunStat criteria in order to connect individual offenders with individual offenses. The police are responsible for: identifying offenders, identifying organizations, executing warrants, and making arrests in clear cases. Subsequently, the district attorney’s office is responsible for taking the next step. In response to the police performing their duties, the district attorney is responsible for: revoking bail and probation, approving executive warrants, assigning cases, and initiating grand juries. During monthly GunStat meetings, police officers, prosecutors, and court officials meet in order to review GunStat findings. Before each meeting, agencies submit reports that include a wide range of data about each of the pending cases and provide information about current performance.
The City of Philadelphia also works closely with the First Judicial District and the State to provide enhanced probation and parole supervision of gun crime offenders. The District Attorney’s Office provides courts with sentencing memo’s and victim impact statements in gun-related cases to improve outcomes.
GunStat already works to identify and create community based organizations willing to work with the police to address gun violence in their neighborhoods. PhillyRising, an initiative out of the Managing Director’s Office, is a coordinated multi-agency response to neighborhoods throughout Philadelphia plagued by crime and low quality of life. PhillyRising works with communities to address unmet needs then develops customized solutions for neighborhoods. The PhillyRising model is based on three policy driven outcomes: improved coordination, measurable results, and assigned geographic accountability. Most importantly, this initiative attempts to reduce crime in all forms in each PhillyRising neighborhood. As a way to achieve this, PhillyRising establishes community and town hall meetings in order build sustainable, responsive solutions to the concerns of residents living and working in each neighborhood. Next, through the partnership of PhillyRising and its neighborhoods, this collaboration develops cost-effective methods for improving service delivery to each neighborhood. Finally, PhillyRising helps those living and working in the PhillyRising neighborhoods realize their vision for their community.

13
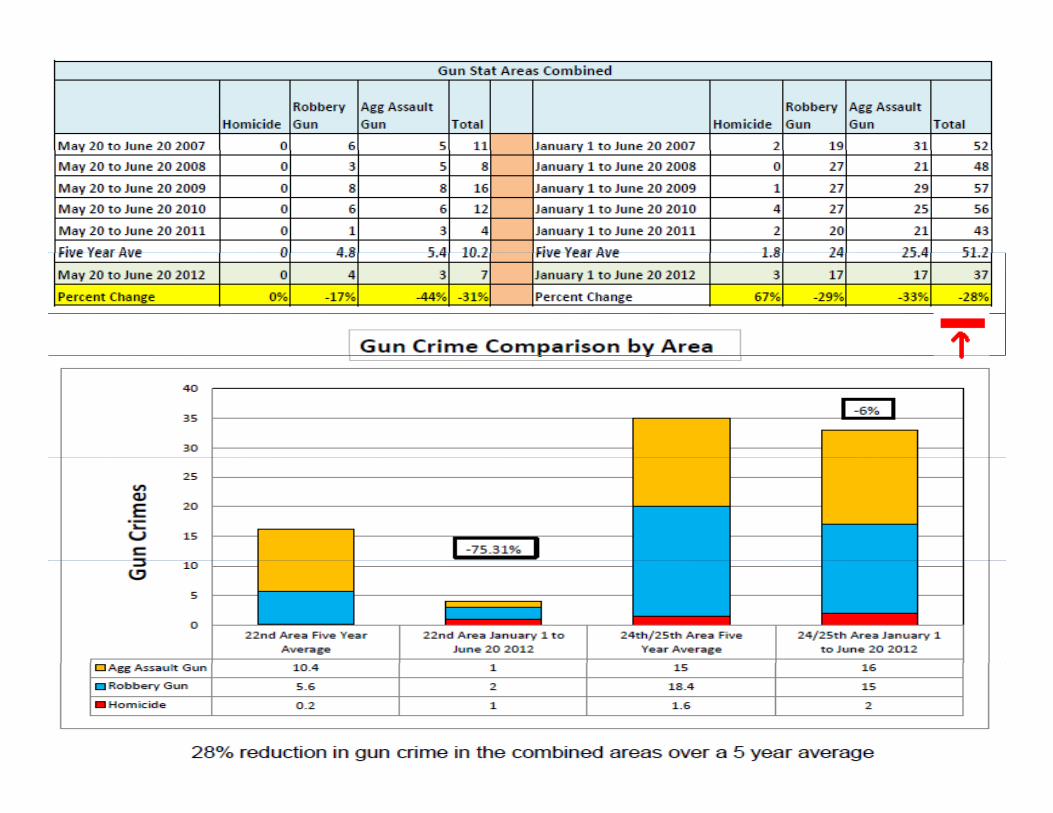
GunStat Results to Date
The PPD Mapping and Analysis Unit have begun tracking the progress of the GunStat pilot program. Since GunStat is still in its pilot program stage, and operating only within two (2) Police Districts, there remains some difficulty in determining with accuracy the trajectory of gun violence crime in the areas where GunStat has already been initiated. The most accurate method to track the change (or lack of change) of gun violence in GunStat neighborhoods is to track the frequency in the occurrence of three types of crimes: (1) homicides, (2) robberies during which a gun was involved and (3) aggravated assaults during which a gun was involved.
The PPD Mapping and Analysis Unit tracks the frequency of each of these three forms of gun-related violent crimes in both the 22nd District hotspot area and the 24th/25th District hotspot area. The PPD has tracked gun violence during the six-month period of January 20, 2012 through June 20, 2012 against the five year average (January 20, 2007 through June 20, 2011) for that same six-month period. PPD mapping also tracked the average for the one-month period of May 20, 2012 through June 20, 2012 against the five-year average for that same one-month period. The PPD then combined the numbers for these two hotspot areas to form a chart that shows the combined average of gun violence change in the two areas where GunStat has been implemented.
The results of the pilot program show that so far the overall trajectory of gun violence in GunStat neighborhoods has been downward. The one-month period of May 20 through June 20 indicates a 31 percent drop of gun violence in GunStat neighborhoods as compared against the five-year average for that same one-month period (May through June). The six-month period of January 20, 2012 through June 20, 2012 indicates a 28 percent drop in gun violence in GunStat neighborhoods as compared to the five-year average of the same six-month period (January through June). While it remains difficult to determine with complete accuracy the effects of the GunStat program in the neighborhoods where it has already been implemented, it appears that so far the numbers are moving in a better direction.
Summary & Conclusion GunStat began in January, 2012, as a program similar to CompStat, a New York inititive created in 1994. It was only recently introduced, making the project around 7 months old. Police focus on offenders with criminal history that tend to repeat their crimes in specific areas. After crimes are reported and recorded, Police GIS mapping department’s use data to update police district maps highlighting these violent “Hotspots.” These areas are then defined as targets for police to monitor more closely for illegal activity and/or violent crimes.
After an arrest, Police discuss their findings with the DA’s office. Through GunStat PPD and the DA partner to get violent offenders convicted as quickly and efficiently as possible, while also incorporating other investigations and updating the status of current court activity. Community outreach programs also move into these “Hotspot” areas in order to make positive effects in the neighborhood. The belief is that if a community is just as involved as the city in rebuilding itself, the community will begin to flourish. In this way, police apprehend suspects while citizens in the area prevent them from returning again.
14
Since January, the Police Department and the DA’s office have met once a month to give reports on current investigations, and recent criminal activity. The results have been viewed as successful; however, the program is young and has yet to reach a point where it can be called a total success. The most important thing to note is that people within the city’s government are talking about the issues and cooperating to solve them in a new way. Other police districts outside of the “hotspot” areas have noticed the improvements so far and are trying to also take part in the project. GunStat is a huge step in the right direction for Philadelphia, a city trying to reduce its history of violent crime.
Media
Introduction
Within the City of Philadelphia’s broad effort to fulfill its anti-violence initiatives are several mediums of communication designed to better connect residents of the city with officials and agencies. Among the City's newly established crime fighting measures, there is particular language used to summarize the City’s objectives. Article 3 of Mayor Nutter’s Crime Fighting Measures, released on January 26, 2012, simply calls for an increased line of communication between citizens, Philadelphia Police Department, and Public Safety Officials. The City of Philadelphia has expanded its accessibility in an effort to encourage public cooperation in the apprehension of violent criminals. Over the course of the past year, the City’s media presence consists of, but is not limited to, Philadelphia Police Department (PPD) blogs, Philadelphia’s Most Wanted via WHYY-TV, PPD’s text tipline, social media, PPD’s email tipline, and a video surveillance program.
Crime Fighting: Social Media
The Philadelphia Police Department is consciously embracing social media as a real time form of communication relevant to combating violent crime. Specifically, the PPD’s heightened visibility on Facebook, Twitter, and YouTube has proven valuable in both proactive and reactive instances motivated by criminal activity. Initially, the PPD’s Facebook page (http://www.facebook.com/phillypolice) is a useful hub for communication between the PPD and other agencies, as well as the greater public.
With over 45,000 subscribers, the PPD’s Facebook page alerts residents of crime and wanted suspects in the form of status updates, and informs the public of general happenings within the department. The PPD’s twitter account (http://twitter.com/phillypolice) serves a similar purpose, and the department’s recent Twitter initiative further localizes the line of communication. Namely, the PPD has assigned individual twitter accounts to officers of different districts throughout the city. With these accounts, policemen, such as Commanding Officer Joel Dales (http://twitter.com/ppdjoeldales), can tweet the beat of their respective districts. Finally, the PPD’s YouTube account (http://www.youtube.com/user/PhiladelphiaPolice) is a vital component of the department's "Video Villains" program that posts unsolved crime surveillance videos hoping for tips. Since 2011, the PPD has posted 225 videos to YouTube that have received more than 1.5 million views, resulting in solving 85 cases. Along with the utilization of popular social networking sites, the Philadelphia Police Department has created a blog (http://blog.phillypolice.com/).The blog consists of current news, crime alerts, events, and

15
detailed behind the scenes information within the department - all available to the public. The blog serves as a foundation to keep residents of Philadelphia involved and up to date with the current events directly from the PPD.
The incorporation of social media encourages participation from the community and ultimately empowers residents to play a significant role in the reduction of violent crime in the city. The City of Philadelphia continues to convey the notion that residents are as vital, if not more so, to the safety of the community as law enforcement officials. Thus, the diverse methods of communication between the City and residents are essential to realizing lasting impacts.
Crime Fighting: Technology & Media
Technological advances such as cellular phones, email, and television are also being applied toward the crime fighting initiative to increase all lines of communication between law enforcement and the community. The Philadelphia Police Department’s email tipline ([email protected]) encourages residents to submit any and all tips related to violent crime, and allows for users to easily attach videos and photos. Additionally, the email platform provides users with the option to submit information anonymously. Another anonymous method the Philadelphia Police Department introduced was their text message tip line. Individuals are able to text a short code (PPDTIP: 773847) and report violent crime, suspicious behaviors, and various forms of criminal activity. As of August 2012, the City of Philadelphia has received 3,600 credible web tips.
In addition, the City of Philadelphia has launched a program that will provide citizens and businesses with financial support to install exterior surveillance video cameras to observe public spaces and increase public safety. While the development of this program is ongoing, it intends to provide cash reimbursements to retailers to help those businesses pay for surveillance cameras in large commercial corridors. An expansion of this program could potentially allow for homeowners to apply for similar assistance in the future.
Television provides people with a clear picture of suspects, hotspots, and various locations where crime have taken place. It also aids as a method toward crime reduction. In an attempt to build upon the crime reduction strategies, Philadelphia’s Most Wanted list was incorporated on the local television network WHYY-TV. The list included one hundred criminals that were wanted by the Philadelphia Police Department and the network encouraged viewers to submit any information regarding the individuals suspected. Due to this incorporation, 867 of the original 100 Most Wanted individuals in Philadelphia have been captured.
Conclusion
The City of Philadelphia is taking strides toward limiting the communication gap between law enforcement and the community. The specificity of the measures presented by the city and enacted by the Philadelphia Police is meant to simultaneously galvanize public cooperation and disrupt cycles of violent crime. The continuation of crime fighting through technology and media outlets will revolutionize the perception of Philadelphia internally as well as externally. Undoubtedly, there is still work to be done; however, the Philadelphia Police Department and Public Safety are tirelessly working to engage the community and change the culture of violent crime.

16
Community Engagement
Introduction
As part of a sustained effort to reduce violent crime in the City of Philadelphia, Community Engagement is a proactive initiative aimed at improving communities plagued with chronic violent crime. Community engagement is based on the idea of building strong, trusting relationships between city officials, law enforcement, community organizations, and neighborhood residents. These partnerships not only help to reduce gun violence, but also foster a rebuilding and strengthening of communities ravaged by violent crime.
The Mayor’s Community Partnership Process Design outlines three key objectives for the City’s Community Engagement approach to violence reduction. These objectives include:
1. Addressing unmet community needs and building partnerships for sustainable results in community strengthening and safety.
2. Dedicating limited resources to community agencies and initiatives that have maximum impact on areas most affected by violent crime.
3. Promoting broad and proactive information sharing across relevant and necessary organizations and communities.
Addressing unmet community needs and building partnerships for sustainable results in community strengthening and safety
Addressing unmet community needs is at the core of Philadelphia’s strategy for reducing violent crime. In addition, efforts to build partnerships between city officials and community organizations prove crucial in reducing violent crime in Philadelphia. The City builds partnerships between its own agencies, members of law enforcement, and community organizations to ensure these violence reduction efforts are sustained and neighborhoods are kept safe. While there are many agencies that address unmet community needs, two examples stand out, namely the PhillyRising Collaborative and The Youth Violence Reduction Partnership (YVRP).
PhillyRising
The PhillyRising Collaborative addresses unmet community needs and builds partnerships for sustainable results in community strengthening and safety. Founded in the spring of 2010, PhillyRising operates through the Managing Director’s Office as a collaborative between city agencies, community organizations, and residents seeking to alleviate quality of life concerns in high crime areas. PhillyRising’s operations are truly unique - residents of these high crime neighborhoods, not the City, identify the community’s needs. Based on these constituent-defined needs, the PhillyRising collaborative develops specific strategies for fighting crime, improving service, building solutions, and developing a progressive vision of the community as a whole. While PhillyRising’s services and programs are vast, some activities include organizing youth activities, community clean-ups, and job training fairs.

17
PhillyRising is an example of an effective partnership between the City of Philadelphia and its constituents living in high crime areas. For instance, as of March 2012, Hartranft, PhillyRising’s first community, saw an average drop of 16% in violent crime. By establishing partnerships, maximizing resources, communicating differently, and most importantly, working with communities, PhillyRising helps derive solutions from communities that make those communities stronger and safer.
The Youth Violence Reduction Partnership (YVRP)
YVRP aims to reduce violence among young offenders by providing youth with intensive supervision and positive support. YVRP is a collaborative effort between city agencies, law enforcement, and nonprofit agencies. The partners in this multi-agency effort include the District Attorney's Office, both juvenile and adult probation offices and courts, the Philadelphia Police Department, the School District, and the Philadelphia Anti-Drug/Anti-Violence Network (PAAN).
Since 1999, YVRP worked primarily with African-American and Hispanic males, ages 14 to 24 living in the 12th, 19th, 22nd, and 25th police districts. As part of the program, each YVRP participant, or youth partner, is assigned a probation officer-street worker team. YVRP probation officers meet regularly with youth partners in their neighborhoods about three times per month. Additionally, the street-workers meet with youth partners about six times per month to address the root causes of crime. Street-workers provide youth partners with resources and positive supports that include counseling or drug treatments, crisis intervention services, and mentoring.
YVRP effectively demonstrates the value of building partnerships in order to reduce violent crime in Philadelphia. With an integrated case management strategy like YVRP’s, these partnerships help to bridge gaps by utilizing proactive strategies for fighting crime. These partnerships not only address unmet community needs, but also prove proactive in their efforts of actively engaging youth partners and obtain valuable intelligence about the community.
Strategy 1.1 - Addressing unmet community needs and building partnerships for sustainable results in community strengthening and safety.
PhillyRising and YVRP are incredibly valuable tools for addressing unmet community needs and building partnerships for sustainable results. However, like all cities, Philadelphia must maintain its efforts in communities in order to sustain long-term results. PhillyRising and YVRP are suited to contribute to the development of strategies for increased sustainability and maintenance in the communities they serve. Namely, these programs could facilitate dialogue focused on how communities can maximize the positive effect of recent change in their neighborhoods. PhillyRising and YVRP already engage residents in these types of discussions. At the same time, however, the City must take advantage of the partnerships built by these programs to work towards to improving the collective mentality of communities. The City of Philadelphia and its residents must sustain efforts and assume accountability for improvements led by PhillyRising and YVRP.

18
Dedicating limited resources to community agencies and initiatives that have maximum impact on areas most affected by violent crime.
As part of Philadelphia’s efforts to reduce violent crime, the City looks to dedicate its limited resources to community agencies and initiatives that have maximum impact on areas most affected by violent crime. Along with providing resources to agencies working within these high-crime areas, the City seeks to reduce violent crime by funding those programs proven to be most successful. Furthermore, the City maximizes its impact on crime by dedicating resources to agencies that work specifically with individuals who have high risk factors to committing violent crimes.
The Mayor’s Office of Re-Integration Services for Ex-offenders (RISE)
The Mayor’s Office of Re-Integration Services for Ex-offenders (RISE) works to reduce recidivism and violent crime in Philadelphia by promoting successful reintegration for ex-offenders returning to the City from county, state, and federal prisons. Specifically, RISE promotes reintegration by finding sustainable employment for ex-offenders. In order to boost job attainment, RISE provides education and skills training for ex-offenders, including GED preparation and job readiness training. Also, RISE maintains community partnerships with local businesses and nonprofits to promote job placement. By enabling ex-offenders to participate and compete in the economy, RISE reduces the likelihood that ex-offenders will return to criminal activity in order to make a living. Additionally, RISE provides life skills training and programs that equip ex-offenders with the tools to function as responsible and productive members of society. Programs include community and personal responsibility training, as well as a life coaching mentorship program.
RISE proves effective in maximizing the impact of its resources because it focuses its efforts on reducing crime among ex-offenders, a population who have high risk factors to committing violent crime. In 2011, the Department of Corrections released 4,567 inmates from Philadelphia County prisons to communities across the state. Yet, the three-year re-incarceration rate is 46.7% for this group. More broadly, the recidivism rate in Philadelphia for local, state, and federal offenders is about 60%. By working to reduce recidivism rates in Philadelphia, RISE takes a direct and proactive approach to reducing violent crime in the City.
Out-of-School-Time Programs
The Out-of-School-Time (OST) network of programs provides afterschool and summer programs to more than 20,000 Philadelphia youth ages 5 to 21. Out-of-School-Time provides a wide range of programs for youth, including nearly 200 programs funded by the Department of Human Services. OST also maintains the Recreation Department’s After School program in 85 Rec Centers and the Library’s Literacy Enrichment After-school Program (LEAP) at all city branches. Each of these OST programs aim to support youth during the critical weekday hours of 3:00 PM - 6:00 PM as well as full time during the summer months.

19
In an effort to strengthen this system and reduce fragmentation, the City sought and was recently awarded a 3-year Wallace Foundation grant to build an “OST System of Systems.” The intent is to develop an enhanced infrastructure driven by improved and integrated data and to reach an accord on a set of appropriate outcome measures for the different programs. Further, by creating a Coordinating Entity, the City aims to form a citywide OST system and effectively utilize limited resources for maximum impact.
Strategy 2.1 - Dedicating limited resources to community agencies and initiatives that have maximum impact on areas most affected by violent crime.
Both RISE and Out-of-School-Time Programs highlight the City’s efforts to dedicate limited resources to areas and initiatives that have maximum impact on reducing violence. While both of these agencies prove effective, more needs to be done to ensure that city funding most effectively impacts reduction of violent crime. To have maximum impact on reducing crime, the City of Philadelphia and community organizations need to collaborate in the development of a standard, evidence-based metrics system. This metrics system will clearly spell out the City and organizations’ expected outcomes for Community Engagement and violence reduction. This metrics system will also be used to evaluate community organizations’ progress in reducing crime. The metrics system should include basic demographic data, including information about population and area served. Demographic data will provide the City with a better idea as to populations and areas being effectively served; demographic data will also give the City a clearer understanding of communities and areas in need of further assistance. Furthermore, because a standard metrics system will provide the City with a better grasp of unmet community needs, participation in this standard metrics system should be critical in determining whether or not an organization receives future City funding.
Promoting broad and proactive information sharing across relevant and necessary organizations and communities.
This objective entails a commitment to sustaining strong neighborhoods by enabling neighborhood access to resources and decision making, while simultaneously increasing involvement of community members.
Mayor’s Engaging Communities Dialogue
Held in April 2012 at St. Joseph’s University, The Mayor’s Engaging Communities Dialogue sought to promote broad and proactive information sharing among community organizations that focus on violence reduction initiatives. The meeting aimed to coordinate the crime fighting efforts of community organizations in order to focus on “hotspots.” Attending organizations also sought to develop a request for proposal, or RFP, process to determine which organizations the City decides to fund.

20
Improving coordination between these groups helps to ensure each community group’s offerings are catered to the unique needs of each neighborhood. A RFP process not only helps the City allocate its limited resources where it is most needed, but also allows a program’s risks and benefits to be clearly defined. In doing so, these groups will be able to focus their efforts in “hotspots” as a way of reducing violent crime.
Strategy 3.1 - Promoting broad and proactive information sharing across relevant and necessary organizations and communities.
While the Mayor’s Engaging Communities Dialogue took the first steps in facilitating broad and proactive information sharing across necessary organizations, there is a need for more effective communication among the City’s community organizations. Due to the large number of community organizations, it is necessary to streamline methods of communication between groups. By creating a database that provides information about each community organization, this objective can be achieved. This database would be accessible by the City, community organizations, and its constituents. A database would facilitate information sharing among the City and community organizations, while improving collaboration between organization’s anti-violence efforts. Better communication would facilitate a RFP process driven by metrics, enabling the City to fund only the most effective organizations. Furthermore, a database would also provide citizens with the necessary information in determining which organizations are most effective in meeting both their individual and community needs.
Conclusion
Community Engagement relies on the availability of partnerships between city officials and communities, open communication and information sharing, and efficient use of resources. Through Community Engagement, city officials and law enforcement will develop a stronger, more trusting relationship with residents. More importantly, Community Engagement will reduce the prevalence of crime and the fear of crime in hot spot neighborhoods. Community Engagement reduces crime because it offers proactive strategies to ensure the root causes of crime are addressed. Ultimately, Community Engagement efforts must continue to be strengthened in order to reduce crime in the City of Philadelphia.

21
Appendix
GunStat
Areas of Focus
• Hotspot: identify, evaluate, and monitor hotspot areas for high gun activity and communicate accurate geographical information and data analysis to across all law enforcement agencies/departments.
• Violent Offenders: concentrate resources on prosecuting high-risk offenders and communicate information on high risk offenders across all law enforcement agencies/departments.
Objectives
• Promote broad and proactive information sharing across relevant and necessary agencies/departments.
• Utilize accurate, up-to-date data and analysis for effective, strategic decision-making. • Dedicate limited resources to areas and initiatives in order to have maximum impact on reducing
gun violence. • Consistently report, monitor, evaluate, and synthesize results. • Address unmet community needs and build partnerships for sustainable results in community
strengthening and safety.
Process
1. Law Enforcement • The police department makes arrests within the targeted areas.
2. Post Arrest • The district attorney ensures a conviction for targeted offenders.
3. Community • The community contributes by turning in weapons and informing the police department
via tips. 4. Action-oriented Research
• The police department examines the effectiveness of its efforts, and makes changes where necessary.

Examining Violent Crime in Philadelphia
August 8 2012August 8, 2012

Project Background and Agendaj g gBackground: This report aims to provide an examination of violent crime in Philadelphia, as well as review the City’s main crime
Agenda
p , yreduction efforts that support the Mayor’s first strategic goal.
Current Picture of Crime in Philadelphia
g
GunStat Initiative
Social Media Efforts
Community Engagement

ll f h l d l hOverall Picture of Crime in Philadelphia
2007‐2011 Total Part 1 Crimes
2007‐2011 Part 1 ‐Violent Crimes
82,974 83,351
80 000
82,000
84,000
86,000
21,17920,771
20,000
21,000
22,000
75,05175,63474,000
76,000
78,000
80,000
19,163
18,535
17 55917 000
18,000
19,000
74,006
68,000
70,000
72,000
2007 2008 2009 2010 2011
17,559
15,000
16,000
17,000
2007 2008 2009 2010 2011
Source: http://www.phillypolice.com/assets/Making‐Phila‐Safer‐5Yr‐Plan‐8‐31‐11‐FINAL.pdf ‐ June 30 ,12

Homicide and Shooting Victim dReductions Since 2007
2007‐2011 Homicides and Shooting
Victims
2007‐2010 Gun Recovery Goal
1,7301,5971,400
1,600
1,800
2,000
70%
80%
90%
100%
Percentage
1,3661,478 1,421
600
800
1,000
1,200
,4
Homicides
Shooting 30%
40%
50%
60%
Percentage of Goal Unmet
Percentage
391 332 305 306 324
0
200
400
600
2007 2008 2009 2010 2011
Shooting Victims
0%
10%
20%
3
2007 2008 2009 2010
of Goal Met

ff d lEffectiveness in Reducing Violent Crime
Measure % Change2007 (Base)
2008 2009 2010 2011 2007‐2011
Reduce the number of Homicides by 25% 391 ‐15.5% ‐8.8% 1.3% 5.9% ‐17.1%
Decrease the number of shooting victims by 20% 1,730 ‐9.9% ‐2.6% 6.2% ‐2.7% ‐9.1%
Reduce Part I crimes b %by 20% 82,974 .5% ‐10.0% 1.7% 2.0% ‐6.1%
Increase the number of guns taken off the streets by 5% (does not include buybacks)
*4,911 1.8% ‐18.7% ‐2.2% ‐.2% ‐19.2%not include buybacks)
Increase homicide clearance rate to 60% 58.6% 74.9% 75.7% 70.3% 60.2% ‐‐‐‐
Increase the clearance t f ll i l t rate for all violent
crime 5% to 25 % 45.9% 51.8% 51.8% 49.2% 49.3% ‐‐‐‐
Source: http://www.phillypolice.com/assets/Making‐Phila‐Safer‐5Yr‐Plan‐8‐31‐11‐FINAL.pdf June 30 ,12

G SGunStat
Created as a measure to identify high‐risk Created as a measure to identify high‐risk
individuals in “hotspot” neighborhoods p g
within the City of Philadelphia and to share
information across government agencies in
di t d ff t t d a coordinated effort to reduce gun
violence.violence.
Philadelphia’s “Hotspot” NeighborhoodsNeighborhoods
The geography of gun
GunStat Pilot Program Areas
The geography of gun violence in Philadelphia
10% of all homicides in 2011 10% of all homicides in 2011 occurred in a neighborhoodcontaining less than 2% of the City’s population and spanning
24/2522
City s population and spanning only 3.25 square miles
53% of youth homicides so far in
Image: PPD's Shooting Victim Database
2012 occurred within just 3 Police Districts (22nd, 24th, and 25th)
Image: PPD s Shooting Victim DatabaseFigures: 2011 Homicide Report, Philadelphia Police Department;
“Youth Violence Prevention,” FY 2012 National Forum on Youth Violence Prevention Expansion Project, 25 Jun 2012

Coordination and Collaboration
Police Department Office of the District Attorney• Identify offenders
• Identify organizations• Execute warrant• Clear cases
Attorney• Initiate Grand Juries• Assign case• Approve executive warrantswarrants
• Revoke bail & probation
First Judicial District/State• Provide enhanced probation/ parole
PhillyRising• Assist in the interruption of violence throughout Philadelphiaprobation/ parole
supervisionPhiladelphia
• Police nominate neighborhoods
• (Immediate expansion plans are based on PPD’s GunStat priorities)GunStat priorities)

Through the Media’s LensgAnalysis of the perception of Philadelphia through the
media’s lens and the many communication methods toward the reduction of gun violence.

If It Bleeds It Leads!If It Bleeds, It Leads!
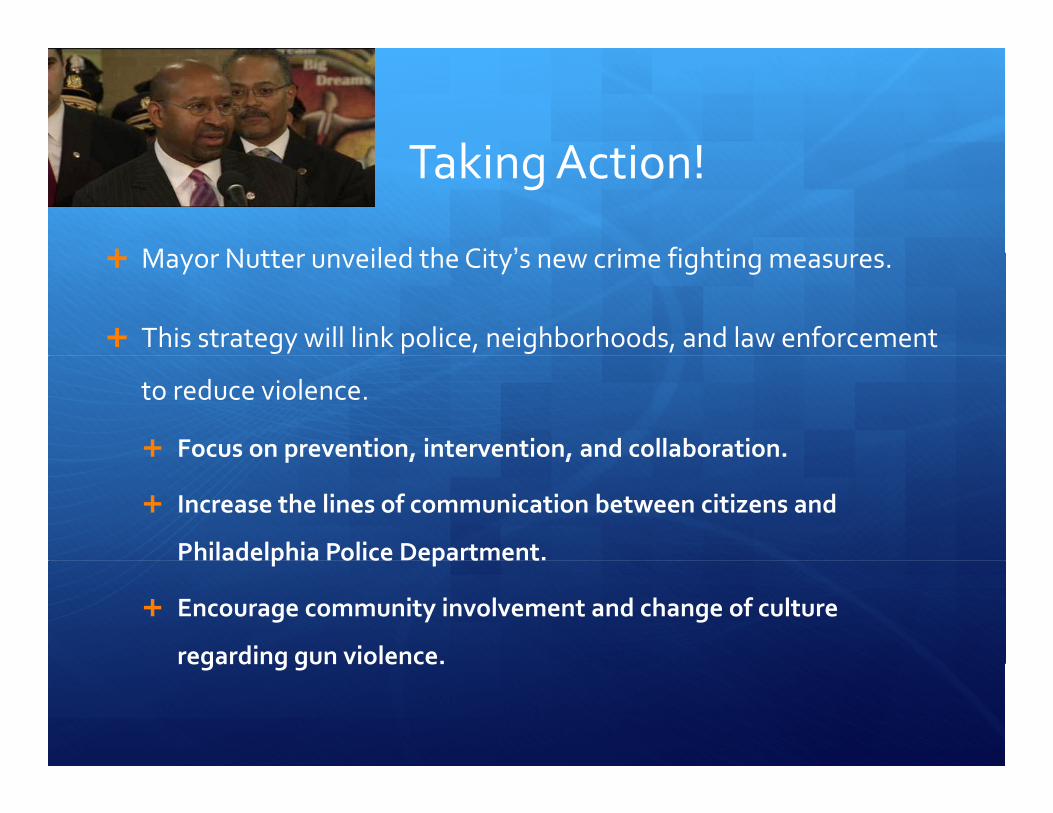
T ki A ti !Taking Action!
M N tt il d th Cit ’ i fi hti Mayor Nutter unveiled the City’s new crime fighting measures.
This strategy will link police, neighborhoods, and law enforcement
to reduce violence.
Focus on prevention, intervention, and collaboration. p , ,
Increase the lines of communication between citizens and
Philadelphia Police Department.ade p a o ce epa t e t
Encourage community involvement and change of culture
regarding gun violence. regarding gun violence.

Crime Fighting Through Mediag g g

C i d Y h ECommunity and Youth Engagement
Community Partnership Process
Process:
1. Proactive initiative
2. Building strong, trusting relationships
3. Rebuilding and strengthening communities

Objective 1 – Addressing unmet community needs and building partnerships for sustainable results in community g p p f ystrengthening and safety
Case Studies
PhillyRising
MIPs work with PhillyRising
PhillyRising
Youth Violence Reduction Partnership (YVRP)p ( )
Moving Forward
Increase sustainability of Increase sustainability of improvements in communities

Objective 2 – Dedicating limited resources to community agencies and initiatives that have maximum impact on areas most affected by violent crime
Case Studies
The Mayor’s Office of Re Integration Services for Ex offenders The Mayor s Office of Re‐Integration Services for Ex‐offenders (RISE)
June 2011 – 57% of those arrested for violent crime have a previous arrest recordarrest record.
Out‐of‐School‐Time Programs
i dMoving Forward
Develop standards and metrics for community organizations

Objective 3 – Promoting broad and proactive information sharing l t d i ti d iti across relevant and necessary organizations and communities
Case StudyCase Study
Mayor’s Engaging Communities Dialogue
Moving Forward
• Create organizational network