Phenotypic identification of subclones in multiple myeloma with different genomic profile,...
34
Phenotypic identification of subclones in iple myeloma with different genomic prof clonogenic potential and drug sensitivity Bruno Paiva University of Navarra, Spain
-
Upload
affymetrix -
Category
Science
-
view
537 -
download
2
Transcript of Phenotypic identification of subclones in multiple myeloma with different genomic profile,...

Phenotypic identification of subclones in
multiple myeloma with different genomic profile,
clonogenic potential and drug sensitivity
Bruno PaivaUniversity of Navarra, Spain

The statements in this presentation are those of theauthor and not of Affymetrix

• Second most common hematological malignancy– Incidence: ~4/100.000 persons/year– Prevalence: 60.000 patients (Europe)– Incidence increases with age: 80% of patients > 60y (rare in <35y)
• Clinical Course: Remitting and Relapsing disease- With current treatment
• 5-year survival 50% - 70%• Potentially cured ~ 10%
Despite the progress in survival with novel agents……. themajority of patients eventually relapses(remains a largely incurable disease)
Multiple myeloma

BM ProBCD10++ CD19+ CD20- CD27- CD38++
BM PreBCD10+ CD19+ CD20het CD27- CD38++
BM/PB ImmatureCD10het CD19+ CD20+ CD27- CD38het
BM/PB/SLT NaiveCD10- CD19+ CD20+ CD27- CD38-
BM Plasma cellsCD10- CD19+ CD20- CD27++ CD38+++ CD138+
PB Plasma cellsCD10- CD19+ CD20het CD27++ CD38++
CD138het
SLT PlasmablastsCD10het CD19+ CD20+ CD27++ CD38+++
CD138-
SLT/PB MemoryCD10- CD19+ CD20+ CD27+ CD38+
SLT GC B-cellsCD10- CD19+ CD20++ CD27het CD38het
B-cell differentiation

Plasma cells: terminally differentiated but…… new-born vs. long-lived
CD19heterogenous
( 80% +ve cells)
CD81heterogenous
( 95% +ve cells)
CD45heterogenous
( 80% +ve cells)
CD56heterogenous
(95% -ve cells)

CNAGEP miRNA
2010
MethylationCytogenetics
1995
FISH
2000 2005
NGS
2013
ISS ISS-FISHTC groups
Advancing technology refines PC characterizationTechnology
Clinical utility
Tx groups GEP sig
Morgan G. Educational Session ASH 2012

Keats JJ, et al. Blood. 2012;120:1067-76. Egan JB, et al. Blood. 2012 120: 1060-1066
Substantial baseline clonal heterogeneity andsubsequent clonal selection under treatment
Bolli N, et al. Nat Commun. 2014;5:2997

SNP-basedmapping array
16q deletions
12p deletions1q gains
5q gains
MM: genetic markers with prognostic significance
FISH analysis
IGH translocationst(4;14)
t(14;16)
t(11;14)
Genomic imbalances
Non-hyperdiplid
1q gains
1p deletions
Monosomy 13
17p deletions
Gene expressionprofiling
TC classification
Molecular classifications(UAMS & Hovon)
70 gene-model(Arkansas group)
15 gene-model(Intergroupe Francophone)
Perez-Simon, Blood 1999; Fonseca Blood 2003; Chang Blood 2005; Gutierrez Leukemia 2007; Avet- Loiseau JCO 2010 & Blood 2011; Boyd Leukemia 2011, Kumar Blood 2012;Zhan Blood 2006, Saughnessy Blood 2007; Deacaux Blood 2008; Broyl Blood 2010; Tapper JCO 2011

Disease models of tumour cell heterogeneity:multiple myeloma
Clones with a distinctpattern of mutations
Bone marrow

Files 1, 2, 3, 4
Identification of subclonal heterogeneity throughgeneration of iPEP (immunophenotipyc expression profiling)
• iPEP for all 23 phenotypic markers analysed plus FSC and SSC was generated forevery single clonal PC
Merging of 4 different tubes using backbone markers
Software calculationof “missing values”

≥2 subclones in 35/116 (30%) newly-diagnosed MM patients
Identification of subclonal heterogeneity throughgeneration of iPEP (immunophenotipyc expression profiling)
Top-markers for identification of distinct phenotypic subclonesCXCR4, CD44, CD19, HLADR, CD54, CD49e, CD138, β7, CD33, CD20, CD81, CD27, CD56
Paino T, et al. Blood 2013;122(21): abstract 531 (oral presentation)

FACS-sorted distinct phenotypic subclones areoften associated with different cytogenetic profiles
Paino T, et al. Blood 2013;122(21): abstract 531 (oral presentation)
Patient
#1
#2
#3
#4
#5
#6
#7
#8
#9
#10
#11
Subclones
CD81+
CD81-
Β7+
Β7-
CD45+
CD45-
CD56-, CD81-
CD56+, CD81+
CD56+
CD56-
CD56+
CD56-
CD19+CD19-
CD38+, SSC↑CD38low SSC↓
CD81-CD81+CD56+CD56-CD56+CD56-
1p
2N2N2N2N2N2N2NNT
11% -1p53% -1p50% +1p50% +1p
2N2NNT2N
29%+1p35%+1p
NTNTNTNT
1q
2N2N
46% +1q77% +1q
2N2N2NNT2N2N
50% +1q50% +1q
2N2NNT2N
29%+1p35%+1p
NTNTNTNT
t(14q32)
negneg80%91%negneg61%56%negneg
67%*15% *negneg26%
84%*negneg24%negnegneg
RB1 (13q14)
2N2N2N
78% del2N
66% del2N2N2N2N
70% del30% del
2N2N2N
87% del2N2N2N
15% del100% del100% del
TP53 (17p13)
2N14% del
2N11% del
2N2N2N2N2N2N
60% del2NNTNT2N
87% del2N2N2N2N
100% del100% del

FACS-sorted distinct phenotypic subclones areoften associated with different cytogenetic profiles
del(14q32): 67%
del(14q32): 15%
60% del(17p13)
0% del(17p13)
70% del(13q14)
30% del(13q14)
Paino T, et al. Blood 2013;122(21): abstract 531 (oral presentation)

Clonal selection after drug exposure: MRD as areservoir of chemoresistant cells
Baseline Cycle 9 MRD Cycle 18 MRD
PCA in merged files
Paino T, et al. Blood 2013;122(21): abstract 531 (oral presentation)

Disease models of PC heterogeneity: myeloma
Clones with a distinctpattern of mutations
Bone marrow
MRD

Cumulative Proportion Event Free Surviving
Cumulative Proportion Surviving
0 12 72 84 9624 36 48 60
Months from diagnosis
0,1
0,5
0,4
0,3
0,2
1,0
0,9
CR vs nCRCR vs PRnCR vs PR
P=0.01P<10-6
P=0.04
0 12 72 84 9624 36 48 60
Months from diagnosis
0,0
0,4
0,3
0,2
0,1
0,8
0,70,7
0,6
0,6
0,5
1,0
0,9
0,8
CR vs nCR or PRnCR vs PR
P<10-5
P=0.07
CR, n=278 nCR, n=124 PR, n=280 PD, n=25
EFS OS
Lahuerta JJ, et al. J Clin Oncol. 2008;26:5775–82.
The deepest the response, the longer the survivalAchievement of CR as a surrogate marker for extended survival

Median: 61m
Median: 62m
P < 0.001P < 0.001 Median: 36m
Median: 141m
160140120100806040200
40
20
0
140120100806040200
40
20
0
MRD monitoring by 4-color flow: patients <65y
• 125 patients in CR after HDT/ASCT (GEM2000)
TTP100
80
60
OS100
80
60
Flow CR (n=71) MRD positive (n=57)Paiva B et al; Blood. 2008; 15;112(10):4017-23 (f/u updated July 2012)

140120100806040200
80 MRD+ (median 0.02% BM clonal PCs) / High-risk: median PFS 22m
P <0.001
60
40
20
0
MRD myeloma cells with high-risk cytogenetics areassociated with faster relapses
PFS
100
MRD+ (median 0.1% BM clonal PCs) / Standard-risk FISH: median PFS 39m
Paiva B, et al. Blood. 2012;119:687-91.

109
108
107
106
105
104
103
102
101
10
0
Presentation
PR
VGPR
CR
cells
MRD
Immune surveillance of undetectable MRD
(Operational cure)
Modified from Morgan GJ, et al. Blood 2013;122: 1332-1334Time to progression
The paradigm of the myeloma treatment
• To achieve (operational) cure or long-term disease control (through immune surveillance),eradicating the maximum number of tumor cells is a prerequisite
• Maximizing cure rates by personalizing therapy is one of the major aims of modern therapy
Tumor
How is thechemoresistant clone?

The pathogenesis of myeloma
Gonzalez, D. et al. Blood. 2007;110(9):3112-21

CASE ID ISOTYPEPeripheral blood B-cells Peripheral
blood NormalPCs
Peripheralblood
MM-PCsNaive IgM+ Memory IgG+ Memory IgA+ Memory
MGUS 1
MGUS 2
MGUS 3
MM 1
MM 2
MM 3
MM 4
MM 5
MM 6
MM 7
IgG
IgG
IgG
IgG
IgA
IgG
IgA
IgG
IgA
IgG
-NT
NT
-------
----
NT
NT
NT
---
----
NT
--
NT
NT
NT
----
NT
--
NT
NT
NT
----
NT
-----
NT
NT
NT
NT
NT
+NT
+++
Circulating B-cells from patients with MM and MGUSare usually devoided of clonotypic B-cells
FACS of highly purified B-cell maturation subsets (>95%)Sensitivity of ASO-PCR (10-4 - 10-5)N.T.: Not tested
The presence of clonal myeloma PCs in PB of myeloma patients is a frequent findingThiago et al. Haematologica 2013

Cell competition for potentially overlapping BM niches
% of BM B-cell subsets
Pro-B Pre-B100%
80%
60%
40%
20%
0%
Smoldering MM
Paiva et al. Leukemia 2011; 25: 697-706
** p ≤.005vs. HA
* p <.05vs. HA
Symptomatic MM
100%
80%
60%
40%
20%
0%
% of BM Lymphoid CD34+ HSC
*** p <.001vs. HA
1,0%
0,8%
0,6%
0,4%
0,2%
0,0%
% of PB clonal PC
Burger et al. Blood 2006 107: 1761-1767
*** p <.001 vs.MGUS and SMM
1.0%
0.8%
0.6%
0.4%
0.2%
0.1%HA
MGUS
0%
MGUS SMM MM
% of normal BMPC
*** p <.001 vs.MGUS and SMM

1. Billadeau. Blood. 1996 1;88(1):289-96.2.3.4.
Schneider. Br J Haematol. 1997; 97(1):56-64.Kumar. J Clin Oncol. 2005 20;23(24):5668-74.Paiva. Leukemia. 2011; 25(4):697-706.
5. Bianchi. Leukemia. 2012 doi: 10.1038/leu.2012.2376.7.8.
Rawstron. Br J Haematol. 1997 ; 97(1):46-55.Luque. Clin Exp Immunol. 1998 ;112(3):410-8.Nowakowski. Blood. 2005 ;106(7):2276-9.
MM-CTCs are present in every stage and predictdisease transformation/aggressiveness
• MM-CTCs are detected in the PB of MGUS (0% - 81%) 1-4,
smoldering MM (50% - 75%) 1,5, symptomatic MM (35% - 87%) 1,2,4,6-9 and
relapse/refractory MM (52%) 10 patients
• The number of MM-CTCs predicts malignant transformation in
MGUS 3 and smoldering MM 5 and inferior OS in symptomatic 8 and
relapsed/refractory MM 10
9. Chandesris. Br J Haematol 2007; 136: 609–614.10. Peceliunas. Leuk Lymphoma. 2012 ; 53(4):641-7.

• Are all BM MM-PCs capable to egress into PB, or only a specific
sub-clone?
• Do MM-CTCs have stem cell-like features and are enriched by
clonogenic cells?
• Does circadian rhythms also affect MM-CTCs?
What is the role of MM-CTCs in the pathogenesis ofmultiple myeloma?

The potential to egress into PB is restricted to aminor sub-clone in the BM…
BM MM-PC vs. CTCs: principle component analysis (APS) of 22 antigensPatient #1
Patient #2
Patient #3
Patient #4
Patient #5
Patient #6
Patient #7
Patient #8
Patient #9
Patient #10
…with an unique profile of integrin and adhesion moleculesPaiva B, et al. Blood. 2013;122(22):3591-8.

MM-CTCsBM MM-PCs
MM-CTCs are mostly quiescent
DRAQ5 + 4-color flow cytometry
% of cells in S-phase (n=10)
P=.005
2.5
2.0
1.5
1.0
0.5
0.0
Paiva B, et al. Blood. 2013;122(22):3591-8.
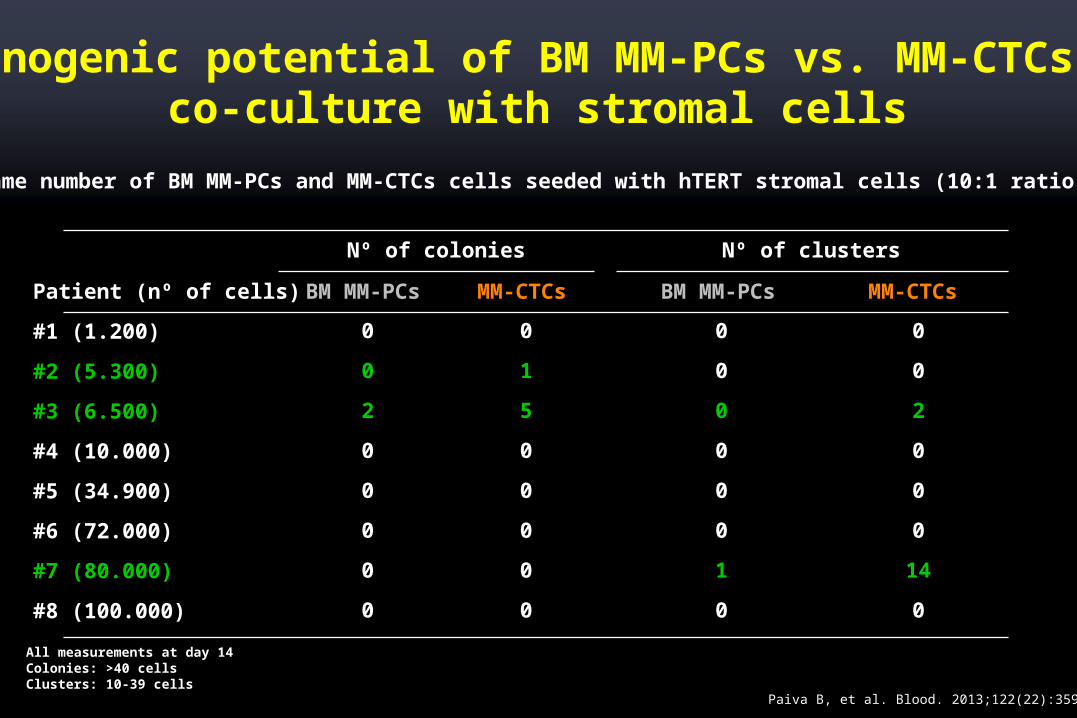
Nº of colonies Nº of clusters
Patient (nº of cells)
#1 (1.200)
#2 (5.300)
#3 (6.500)
#4 (10.000)
#5 (34.900)
#6 (72.000)
#7 (80.000)
#8 (100.000)
BM MM-PCs
0
0
2
0
0
0
0
0
MM-CTCs
0
1
5
0
0
0
0
0
BM MM-PCs
0
0
0
0
0
0
1
0
MM-CTCs
0
0
2
0
0
0
14
0
Clonogenic potential of BM MM-PCs vs. MM-CTCs inco-culture with stromal cells
• Same number of BM MM-PCs and MM-CTCs cells seeded with hTERT stromal cells (10:1 ratio)
All measurements at day 14Colonies: >40 cellsClusters: 10-39 cells
Paiva B, et al. Blood. 2013;122(22):3591-8.

% of Annexin-V + ve cells
MM-CTCsBM MM-PCs
100
80
60
40
20
0
Bortezomib
100
80
60
40
20
0MM-CTCsBM MM-PCs
VRD (BortzLenDex)
100
80
60
40
20
0MM-CTCsBM MM-PCs
Combined (n=7)
P =.320
Paired BM MM-PCs and MM-CTCs show the sameresponse to chemotherapy
• Cytotoxicity measured after 48h• Bortezomib: 2.5nM; Lenalidomide: 1.0 µM; Dexamethasone: 10nM
Paiva B, et al. Blood. 2013;122(22):3591-8.

The SDF1/CXCR4 axis
20h16h8h
4h24h
20h16h
12h 20h16h8h
4h24h
20h16h
12h
CXCR4 (Amount of antigen MFI expression / MM-CTC)
SDF-1α levels (pg/mL)MM-CTCs (median cells/µL)CD34+ HSC (median cells/µL)
MM patients at relapse (n=6)Quantification started at 16:00pm every 4h up to 12:00am next day (when patients' initiated treatment)Time points 16h and 21h have been duplicated to facilitate viewing of the time curve Paiva B, et al. Blood. 2013;122(22):3591-8.

Cytogenetic comparison between paired BM MM-PCs and MM-CTCs: less abnormalities?
• Purity of BM MM-PCs and MM-CTCs FACS sorting ≥95% (n=4)
BM MM-PCs+1q21 (23%)
BM MM-PCs-13q14 (95%)+9q34 (90%)
MM-CTCs+1q21 (28%)
MM-CTCs-13q14 (97%)+9q34 (80%)
BM MM-PCs-13q14 (80%)17p13 (2N)
BM MM-PCsC9C+9q34 (23%)
MM-CTCs13q14 (2N)17p13 (2N)
MM-CTCsC9C9q34 (2N)
Paiva B, et al. Blood. 2013;122(22):3591-8.

pattern of mutations EMD
Disease models of PC heterogeneity: myeloma
Bone marrow
MRDPB-CTC
Clones with a distinct

Tumorprogenitor cell
MGUS SMM MM
A Darwinian view of myeloma treatment

Myelomaprogenitor cell
MGUS SMM
A Darwinian view of myeloma treatment
Early-treatment
Treatment modifies the balancebetween existing and competingsub-clones, resulting in a reductionof clonal complexity

MGUS SMM MMOriginal clone – Drug X resistant
Myelomaprogenitor cell
Drug X sensitive
Triple-drug combinations to target all different clonesAlways consider retreating with a previous therapy that was functional
A Darwinian view of myeloma treatment
Therapy


![New Method to Quantitate Clonogenic Tumor Cells in the ......[CANCER RESEARCH 43, 5451-5455, November 1983] New Method to Quantitate Clonogenic Tumor Cells in the Blood Circulation](https://static.fdocuments.net/doc/165x107/6068d20ce566193e3e18220a/new-method-to-quantitate-clonogenic-tumor-cells-in-the-cancer-research.jpg)