Phenotypic Characterization of Prostate Cancer LNCaP …eprints.qut.edu.au/53843/1/53843.pdf ·...
16
Phenotypic Characterization of Prostate Cancer LNCaP Cells Cultured within a Bioengineered Microenvironment Shirly Sieh 1 , Anna V. Taubenberger 1,2 , Simone C. Rizzi 1 , Martin Sadowski 1,2 , Melanie L. Lehman 2,3 , Anja Rockstroh 2 , Jiyuan An 2 , Judith A. Clements 1,2 , Colleen C. Nelson 1,2,3 , Dietmar W. Hutmacher 1,2 * 1 Regenerative Medicine and Cancer Program, Institute of Health and Biomedical Innovation, Queensland University of Technology, Brisbane, Queensland, Australia, 2 Australian Prostate Cancer Research Centre-Queensland, Queensland University of Technology and Princess Alexandra Hospital, Woolloongabba, Queensland, Australia, 3 Department of Urologic Sciences, Vancouver Prostate Centre, University of British Columbia, Vancouver, British Columbia, Canada Abstract Biophysical and biochemical properties of the microenvironment regulate cellular responses such as growth, differentiation, morphogenesis and migration in normal and cancer cells. Since two-dimensional (2D) cultures lack the essential characteristics of the native cellular microenvironment, three-dimensional (3D) cultures have been developed to better mimic the natural extracellular matrix. To date, 3D culture systems have relied mostly on collagen and Matrigel TM hydrogels, allowing only limited control over matrix stiffness, proteolytic degradability, and ligand density. In contrast, bioengineered hydrogels allow us to independently tune and systematically investigate the influence of these parameters on cell growth and differentiation. In this study, polyethylene glycol (PEG) hydrogels, functionalized with the Arginine-glycine-aspartic acid (RGD) motifs, common cell-binding motifs in extracellular matrix proteins, and matrix metalloproteinase (MMP) cleavage sites, were characterized regarding their stiffness, diffusive properties, and ability to support growth of androgen- dependent LNCaP prostate cancer cells. We found that the mechanical properties modulated the growth kinetics of LNCaP cells in the PEG hydrogel. At culture periods of 28 days, LNCaP cells underwent morphogenic changes, forming tumor-like structures in 3D culture, with hypoxic and apoptotic cores. We further compared protein and gene expression levels between 3D and 2D cultures upon stimulation with the synthetic androgen R1881. Interestingly, the kinetics of R1881 stimulated androgen receptor (AR) nuclear translocation differed between 2D and 3D cultures when observed by immunofluorescent staining. Furthermore, microarray studies revealed that changes in expression levels of androgen responsive genes upon R1881 treatment differed greatly between 2D and 3D cultures. Taken together, culturing LNCaP cells in the tunable PEG hydrogels reveals differences in the cellular responses to androgen stimulation between the 2D and 3D environments. Therefore, we suggest that the presented 3D culture system represents a powerful tool for high throughput prostate cancer drug testing that recapitulates tumor microenvironment. Citation: Sieh S, Taubenberger AV, Rizzi SC, Sadowski M, Lehman ML, et al. (2012) Phenotypic Characterization of Prostate Cancer LNCaP Cells Cultured within a Bioengineered Microenvironment. PLoS ONE 7(9): e40217. doi:10.1371/journal.pone.0040217 Editor: Elizabeth Wilson, University of North Carolina at Chapel Hill, United States of America Received November 17, 2011; Accepted June 6, 2012; Published September 5, 2012 Copyright: ß 2012 Sieh et al. This is an open-access article distributed under the terms of the Creative Commons Attribution License, which permits unrestricted use, distribution, and reproduction in any medium, provided the original author and source are credited. Funding: This work was supported by Queensland University of Technology start up grant for chair Prof. D. W. Hutmacher, Prostate Cancer Foundation of Australia, Australian Canadian Prostate Cancer Research Alliance, Australian Prostate Cancer Research Centre-Queensland and NHMRC grant. The funders had no role in study design, data collection and analysis, decision to publish, or preparation of the manuscript. Competing Interests: The authors have declared that no competing interests exist. * E-mail: [email protected] Introduction Prostate cancer (CaP) is one of the most prevalent malignant diseases among men in western countries. The 5-year survival rate for men diagnosed with localized CaP approaches 100%; whereas, the prognosis worsens rapidly upon CaP progression to advanced and metastatic disease [1–2]. Despite advancement in detection methods and treatments, CaP remains a major cause of cancer death in men. Therefore, it is important to gain a greater understanding of the progression from localized to advanced CaP using relevant physiological systems. Like many other cancer cells, CaP cells have been extensively studied in two dimensional (2D) cultures, through which a significant basic understanding of cancer biology has been gained. However, in native tissues, cells are embedded in extracellular matrix (ECM) that provides not only architectural support, but also chemical and mechanical cues to cells [3–4]. Recently, the importance of the mechanical properties of the tumor microenvironment has been increasingly acknowl- edged. In general, the cancerous tissue and its stroma are stiffer than non malignant tissues due to abnormal deposition and remodeling of the ECM in the stroma [5–7]. In vitro studies and few in vivo studies have demonstrated that stiffness of the surrounding matrix can increase cancer cell growth, modulate cell signaling and facilitate cell invasion [8–11]. Considering the vital role of matrix rigidity, artificial geometric constraints and the high stiffness imposed on cells on 2D tissue culture plastic could affect tumor growth, adhesion, cell polarity, morphology, migra- tion and proteolysis mechanisms [12–15]. In recent years, numerous studies have demonstrated that studying tumors in 3D better reproduces in vivo growth charac- teristics and resistance against chemotherapeutic agents than a 2D approach [16–18]. The most commonly used 3D matrix models are animal derived reconstituted basement membrane extract, Matrigel TM [17,19–20], and rat tail collagen type I matrices [21– 24]. Although these naturally derived matrices have ECM-like biological properties, their inherent characteristics limit the PLOS ONE | www.plosone.org 1 September 2012 | Volume 7 | Issue 9 | e40217
Transcript of Phenotypic Characterization of Prostate Cancer LNCaP …eprints.qut.edu.au/53843/1/53843.pdf ·...

Phenotypic Characterization of Prostate Cancer LNCaPCells Cultured within a Bioengineered MicroenvironmentShirly Sieh1, Anna V. Taubenberger1,2, Simone C. Rizzi1, Martin Sadowski1,2, Melanie L. Lehman2,3,
Anja Rockstroh2, Jiyuan An2, Judith A. Clements1,2, Colleen C. Nelson1,2,3, Dietmar W. Hutmacher1,2*
1 Regenerative Medicine and Cancer Program, Institute of Health and Biomedical Innovation, Queensland University of Technology, Brisbane, Queensland, Australia,
2 Australian Prostate Cancer Research Centre-Queensland, Queensland University of Technology and Princess Alexandra Hospital, Woolloongabba, Queensland, Australia,
3 Department of Urologic Sciences, Vancouver Prostate Centre, University of British Columbia, Vancouver, British Columbia, Canada
Abstract
Biophysical and biochemical properties of the microenvironment regulate cellular responses such as growth, differentiation,morphogenesis and migration in normal and cancer cells. Since two-dimensional (2D) cultures lack the essentialcharacteristics of the native cellular microenvironment, three-dimensional (3D) cultures have been developed to bettermimic the natural extracellular matrix. To date, 3D culture systems have relied mostly on collagen and MatrigelTM hydrogels,allowing only limited control over matrix stiffness, proteolytic degradability, and ligand density. In contrast, bioengineeredhydrogels allow us to independently tune and systematically investigate the influence of these parameters on cell growthand differentiation. In this study, polyethylene glycol (PEG) hydrogels, functionalized with the Arginine-glycine-aspartic acid(RGD) motifs, common cell-binding motifs in extracellular matrix proteins, and matrix metalloproteinase (MMP) cleavagesites, were characterized regarding their stiffness, diffusive properties, and ability to support growth of androgen-dependent LNCaP prostate cancer cells. We found that the mechanical properties modulated the growth kinetics of LNCaPcells in the PEG hydrogel. At culture periods of 28 days, LNCaP cells underwent morphogenic changes, forming tumor-likestructures in 3D culture, with hypoxic and apoptotic cores. We further compared protein and gene expression levelsbetween 3D and 2D cultures upon stimulation with the synthetic androgen R1881. Interestingly, the kinetics of R1881stimulated androgen receptor (AR) nuclear translocation differed between 2D and 3D cultures when observed byimmunofluorescent staining. Furthermore, microarray studies revealed that changes in expression levels of androgenresponsive genes upon R1881 treatment differed greatly between 2D and 3D cultures. Taken together, culturing LNCaP cellsin the tunable PEG hydrogels reveals differences in the cellular responses to androgen stimulation between the 2D and 3Denvironments. Therefore, we suggest that the presented 3D culture system represents a powerful tool for high throughputprostate cancer drug testing that recapitulates tumor microenvironment.
Citation: Sieh S, Taubenberger AV, Rizzi SC, Sadowski M, Lehman ML, et al. (2012) Phenotypic Characterization of Prostate Cancer LNCaP Cells Cultured within aBioengineered Microenvironment. PLoS ONE 7(9): e40217. doi:10.1371/journal.pone.0040217
Editor: Elizabeth Wilson, University of North Carolina at Chapel Hill, United States of America
Received November 17, 2011; Accepted June 6, 2012; Published September 5, 2012
Copyright: � 2012 Sieh et al. This is an open-access article distributed under the terms of the Creative Commons Attribution License, which permits unrestricteduse, distribution, and reproduction in any medium, provided the original author and source are credited.
Funding: This work was supported by Queensland University of Technology start up grant for chair Prof. D. W. Hutmacher, Prostate Cancer Foundation ofAustralia, Australian Canadian Prostate Cancer Research Alliance, Australian Prostate Cancer Research Centre-Queensland and NHMRC grant. The funders had norole in study design, data collection and analysis, decision to publish, or preparation of the manuscript.
Competing Interests: The authors have declared that no competing interests exist.
* E-mail: [email protected]
Introduction
Prostate cancer (CaP) is one of the most prevalent malignant
diseases among men in western countries. The 5-year survival rate
for men diagnosed with localized CaP approaches 100%; whereas,
the prognosis worsens rapidly upon CaP progression to advanced
and metastatic disease [1–2]. Despite advancement in detection
methods and treatments, CaP remains a major cause of cancer
death in men. Therefore, it is important to gain a greater
understanding of the progression from localized to advanced CaP
using relevant physiological systems. Like many other cancer cells,
CaP cells have been extensively studied in two dimensional (2D)
cultures, through which a significant basic understanding of cancer
biology has been gained. However, in native tissues, cells are
embedded in extracellular matrix (ECM) that provides not only
architectural support, but also chemical and mechanical cues to
cells [3–4]. Recently, the importance of the mechanical properties
of the tumor microenvironment has been increasingly acknowl-
edged. In general, the cancerous tissue and its stroma are stiffer
than non malignant tissues due to abnormal deposition and
remodeling of the ECM in the stroma [5–7]. In vitro studies and
few in vivo studies have demonstrated that stiffness of the
surrounding matrix can increase cancer cell growth, modulate
cell signaling and facilitate cell invasion [8–11]. Considering the
vital role of matrix rigidity, artificial geometric constraints and the
high stiffness imposed on cells on 2D tissue culture plastic could
affect tumor growth, adhesion, cell polarity, morphology, migra-
tion and proteolysis mechanisms [12–15].
In recent years, numerous studies have demonstrated that
studying tumors in 3D better reproduces in vivo growth charac-
teristics and resistance against chemotherapeutic agents than a 2D
approach [16–18]. The most commonly used 3D matrix models
are animal derived reconstituted basement membrane extract,
MatrigelTM [17,19–20], and rat tail collagen type I matrices [21–
24]. Although these naturally derived matrices have ECM-like
biological properties, their inherent characteristics limit the
PLOS ONE | www.plosone.org 1 September 2012 | Volume 7 | Issue 9 | e40217

Figure 1. Characterization of PEG-based biomimetic hydrogels. (A) A schematic showing the preparation of biomimetic hydrogels. LNCaPcells were mixed with PEG precursors containing MMP cleavage sites and RGD peptides prior to FXIII-catalyzed polymerization. (B) Global stiffness ofcell-free hydrogels with different PEG content (w/v) was measured using a microtester. A representative stress-strain curve recorded for a 2% PEG gel.The (elastic) Young’s modulus, E, was calculated from the slope of the line fitted to the stress-strain curve at 9–12% strain (middle). A Scatter plot
Characterization of LNCaP Cells Grown in 3D
PLOS ONE | www.plosone.org 2 September 2012 | Volume 7 | Issue 9 | e40217

flexibility of adjusting matrix stiffness without simultaneously
affecting other matrix properties such as proteolytic degradability
and ligand density. Furthermore, MatrigelTM shows batch-to-
batch variations, which decreases the reproducibility of experi-
ments and comparability of data sets between different laborato-
ries. To simplify the otherwise complex cellular interactions of the
multiple components which occur in naturally derived matrices,
there is a growing interest in the use of matrices engineered with
specific biological and biochemical features of natural ECM [25–
28]. These biomimetic matrices allow a more systematic study of
the impact of certain components or properties of the tumor
microenvironment on cancer cells. Therefore, emerging approach-
es in biomaterial science have focused on the development of
synthetic matrices such as hyaluronon-derived or alginate matrices
for culturing cancer cells [25–28]. Another example is PEG-based
hydrogels that are inert themselves in terms of triggering cell
signaling pathways, but can be equipped with biochemical (e.g.
proteolytic degradation sites) and biological functionalities (e.g.
RGD motifs in a controlled fashion) [29]. Advantageously, the
stiffness of such hydrogels can be precisely tuned, independent of
their proteolytic sensitivity and cell ligand density.
Previously, we and others have used MMP-sensitive PEG-based
hydrogels in which RGD motifs are incorporated at a defined
density [13,30–32]. The RGD motifs provide binding sites for cells
via integrins, and the MMP cleavage sequences permit cells to
degrade the matrix, which creates space for cell proliferation and
migration. To this end, a thorough phenotypic characterization of
CaP cells cultured within this biomimetic ECM has not been
reported. In this study, we aimed to establish and validate a 3D
culture system for LNCaP cells that allows modeling of the early
stage avascular tumor formation. To do this, we investigated the
effect of the hydrogel stiffness on cell growth. Thereafter, we
examined morphology, gene expression and protein synthesis of
LNCaP cells grown in 3D hydrogels compared to conventional 2D
cultures. We also used this 3D culture system to study the effects of
the synthetic androgen, R1881, on AR signaling in comparison to
2D cultures [33–34].
Our findings provide insights into the role of the microenvi-
ronment in modulating the cellular and molecular behavior of
cancer cells. Furthermore, we reveal differences in cellular
responses to androgens between 2D and 3D cultures. This model
is a stepping stone for the development of 3D culture systems
replicating the in vivo tumor microenvironment, allowing for the
creation of powerful tools to better understand CaP biology, in
particular in response to androgens.
Results
Mechanical and diffusive properties of biomimetichydrogels are dependent on the PEG content
To mimic the early stage of CaP tumor formation in 3D, we set
out to culture LNCaP cells in biomimetic PEG hydrogels. The
PEG precursors conjugated with MMP cleavage sites and RGD
motifs were incorporated into the hydrogel network to confer
essential biomimetic features of the natural ECM (Figure 1A).
Since mechanical properties of the hydrogel are known to
influence growth, morphology, and invasive phenotype of cancer
cells [5,10,35], we first aimed to optimize the hydrogel’s stiffness
for cell culture. Cell-free PEG hydrogels of varying stiffness were
prepared by adjusting the PEG content to 1.5, 2, 2.5% (w/v). The
stiffness of the hydrogel was determined by unconfined compres-
sion tests using a microtester (Figure 1B, left) and atomic force
microscopy (AFM) indentation measurements (Figure 1C, left)
which were converted to a stress-strain curve (Figure 1B, middle).
While the microtestor probes the global elastic properties of the
PEG hydrogels, the AFM indentation measurements yield
information about their local stiffness distribution (Figure 1C).
Both methods revealed a linear increase in elastic moduli with
augmentation of PEG content and indicated similar elastic moduli,
ranging between approximately 0.8 kiloPascal (kPa) to 10 kPa for
the 1.5% and 2.5% PEG hydrogels, respectively (Figure 1B and
1C, right). AFM measurements revealed a homogenous distribu-
tion of local Young’s modulus, E over the probed hydrogels
(Figure 1C, middle). When the 2.0% hydrogels were tested using
the microtester before and after more than 4 weeks of culture, we
found no significant changes in the overall matrix stiffness (2.5–
4.2 kPa), which was consistent with the variation in the tested 2%
hydrogels (Figure S1). As previously reported in 3D cell cultures
within similar matrices [5,10,35], this indicates that these
biomimetic PEG-based hydrogel are only locally degraded by
the embedded cells, while the overall stiffness is not affected over
the analyzed growth period.
Changes in PEG content are expected to alter the pore size of
the PEG hydrogels [36] which could affect the transfer of small
molecules, such as the synthetic androgen R1881, and also growth
factors present in the medium in our experiments. To estimate the
diffusion of R1881, we measured the diffusion coefficient D, of the
food dye E133 (792 Da), that has a higher molecular weight than
R1881 (284 Da). We found that the median values of diffusion
decreased with increasing PEG content (Figure 1D) from
2.9960.0661026 cm2/s for 1.5% PEG hydrogels to
1.960.1361026 cm2/s for 2.5% PEG hydrogels. To test if
essential growth factors such as Fibroblast growth factor, Vascular
endothelial growth factor and Platelet-derived growth factor (20–
50 kiloDalton, kDa) can also penetrate the hydrogel, we investi-
gated the diffusion of Fluorescein isothiocyanate-conjugated
bovine serum albumin (FITC-BSA) (66 kDa), which has a higher
molecular weight than these growth factors. The diffusion
coefficient of FITC-BSA was lower compared to E133 and
decreased with increasing PEG content (Figure 1D). D values for
1.5–2.5% PEG hydrogels (1.5–3.061027 cm2/s) are within the
same order of magnitude (661027 cm2/s) reported by Ramanujan
et al. (2002) and Erikson et al. (2008) measuring diffusion of BSA in
the softer collagen gels [37–38]. When PEG hydrogels were
incubated with FITC-BSA for 24 hours, we observed widespread
penetration of the FITC-BSA (Figure S2). From these findings we
showing the Young’s moduli measured for different PEG hydrogels (right). Medians are indicated by the red bars. (C) Local stiffness of cell-freehydrogels with different PEG content (w/v) was measured using atomic force microscopy (AFM). A pyramidal shaped AFM cantilever was used toconduct indentation measurements. A representative force versus tip-sample-separation curve is shown below the AFM schematic. The red linerepresents the fit used to approximate the approach curve with a Hertzian indentation model. Young’s moduli measured for a 2% PEG hydrogel isnormally distributed in the range of 4 kPa (middle). Scatter plot shows the median Young’s moduli measured for different hydrogels (right). Red barsrepresent the medians. Both microtester and AFM indentation measurements yield similar Young’s moduli and show a linear increase in stiffness withPEG content. (D) Box plots show the diffusion coefficients, D measured for the food dye E133 (794 Da) and FITC-BSA (66 kDa) in cell-free hydrogels atdifferent PEG content. Values of D for E133 are one order of magnitude greater than for FITC-BSA. At least three samples were measured from threeindependent experiments.doi:10.1371/journal.pone.0040217.g001
Characterization of LNCaP Cells Grown in 3D
PLOS ONE | www.plosone.org 3 September 2012 | Volume 7 | Issue 9 | e40217
may conclude that, although transfer of R1881 and growth factors
may be slowed down in gels with higher PEG content, the pore
size of all gels is sufficiently large to provide embedded cells with
soluble factors from the culture medium.
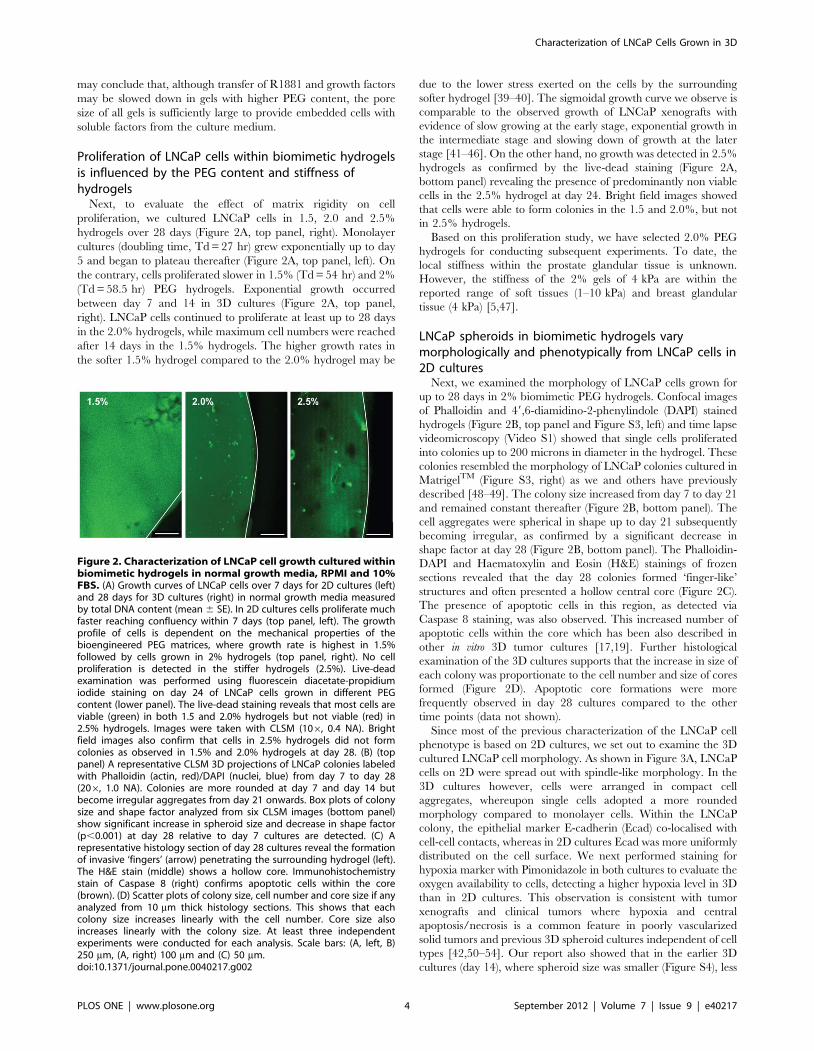
Proliferation of LNCaP cells within biomimetic hydrogelsis influenced by the PEG content and stiffness ofhydrogels
Next, to evaluate the effect of matrix rigidity on cell
proliferation, we cultured LNCaP cells in 1.5, 2.0 and 2.5%
hydrogels over 28 days (Figure 2A, top panel, right). Monolayer
cultures (doubling time, Td = 27 hr) grew exponentially up to day
5 and began to plateau thereafter (Figure 2A, top panel, left). On
the contrary, cells proliferated slower in 1.5% (Td = 54 hr) and 2%
(Td = 58.5 hr) PEG hydrogels. Exponential growth occurred
between day 7 and 14 in 3D cultures (Figure 2A, top panel,
right). LNCaP cells continued to proliferate at least up to 28 days
in the 2.0% hydrogels, while maximum cell numbers were reached
after 14 days in the 1.5% hydrogels. The higher growth rates in
the softer 1.5% hydrogel compared to the 2.0% hydrogel may be
due to the lower stress exerted on the cells by the surrounding
softer hydrogel [39–40]. The sigmoidal growth curve we observe is
comparable to the observed growth of LNCaP xenografts with
evidence of slow growing at the early stage, exponential growth in
the intermediate stage and slowing down of growth at the later
stage [41–46]. On the other hand, no growth was detected in 2.5%
hydrogels as confirmed by the live-dead staining (Figure 2A,
bottom panel) revealing the presence of predominantly non viable
cells in the 2.5% hydrogel at day 24. Bright field images showed
that cells were able to form colonies in the 1.5 and 2.0%, but not
in 2.5% hydrogels.
Based on this proliferation study, we have selected 2.0% PEG
hydrogels for conducting subsequent experiments. To date, the
local stiffness within the prostate glandular tissue is unknown.
However, the stiffness of the 2% gels of 4 kPa are within the
reported range of soft tissues (1–10 kPa) and breast glandular
tissue (4 kPa) [5,47].
LNCaP spheroids in biomimetic hydrogels varymorphologically and phenotypically from LNCaP cells in2D cultures
Next, we examined the morphology of LNCaP cells grown for
up to 28 days in 2% biomimetic PEG hydrogels. Confocal images
of Phalloidin and 49,6-diamidino-2-phenylindole (DAPI) stained
hydrogels (Figure 2B, top panel and Figure S3, left) and time lapse
videomicroscopy (Video S1) showed that single cells proliferated
into colonies up to 200 microns in diameter in the hydrogel. These
colonies resembled the morphology of LNCaP colonies cultured in
MatrigelTM (Figure S3, right) as we and others have previously
described [48–49]. The colony size increased from day 7 to day 21
and remained constant thereafter (Figure 2B, bottom panel). The
cell aggregates were spherical in shape up to day 21 subsequently
becoming irregular, as confirmed by a significant decrease in
shape factor at day 28 (Figure 2B, bottom panel). The Phalloidin-
DAPI and Haematoxylin and Eosin (H&E) stainings of frozen
sections revealed that the day 28 colonies formed ‘finger-like’
structures and often presented a hollow central core (Figure 2C).
The presence of apoptotic cells in this region, as detected via
Caspase 8 staining, was also observed. This increased number of
apoptotic cells within the core which has been also described in
other in vitro 3D tumor cultures [17,19]. Further histological
examination of the 3D cultures supports that the increase in size of
each colony was proportionate to the cell number and size of cores
formed (Figure 2D). Apoptotic core formations were more
frequently observed in day 28 cultures compared to the other
time points (data not shown).
Since most of the previous characterization of the LNCaP cell
phenotype is based on 2D cultures, we set out to examine the 3D
cultured LNCaP cell morphology. As shown in Figure 3A, LNCaP
cells on 2D were spread out with spindle-like morphology. In the
3D cultures however, cells were arranged in compact cell
aggregates, whereupon single cells adopted a more rounded
morphology compared to monolayer cells. Within the LNCaP
colony, the epithelial marker E-cadherin (Ecad) co-localised with
cell-cell contacts, whereas in 2D cultures Ecad was more uniformly
distributed on the cell surface. We next performed staining for
hypoxia marker with Pimonidazole in both cultures to evaluate the
oxygen availability to cells, detecting a higher hypoxia level in 3D
than in 2D cultures. This observation is consistent with tumor
xenografts and clinical tumors where hypoxia and central
apoptosis/necrosis is a common feature in poorly vascularized
solid tumors and previous 3D spheroid cultures independent of cell
types [42,50–54]. Our report also showed that in the earlier 3D
cultures (day 14), where spheroid size was smaller (Figure S4), less
Figure 2. Characterization of LNCaP cell growth cultured withinbiomimetic hydrogels in normal growth media, RPMI and 10%FBS. (A) Growth curves of LNCaP cells over 7 days for 2D cultures (left)and 28 days for 3D cultures (right) in normal growth media measuredby total DNA content (mean 6 SE). In 2D cultures cells proliferate muchfaster reaching confluency within 7 days (top panel, left). The growthprofile of cells is dependent on the mechanical properties of thebioengineered PEG matrices, where growth rate is highest in 1.5%followed by cells grown in 2% hydrogels (top panel, right). No cellproliferation is detected in the stiffer hydrogels (2.5%). Live-deadexamination was performed using fluorescein diacetate-propidiumiodide staining on day 24 of LNCaP cells grown in different PEGcontent (lower panel). The live-dead staining reveals that most cells areviable (green) in both 1.5 and 2.0% hydrogels but not viable (red) in2.5% hydrogels. Images were taken with CLSM (106, 0.4 NA). Brightfield images also confirm that cells in 2.5% hydrogels did not formcolonies as observed in 1.5% and 2.0% hydrogels at day 28. (B) (toppanel) A representative CLSM 3D projections of LNCaP colonies labeledwith Phalloidin (actin, red)/DAPI (nuclei, blue) from day 7 to day 28(206, 1.0 NA). Colonies are more rounded at day 7 and day 14 butbecome irregular aggregates from day 21 onwards. Box plots of colonysize and shape factor analyzed from six CLSM images (bottom panel)show significant increase in spheroid size and decrease in shape factor(p,0.001) at day 28 relative to day 7 cultures are detected. (C) Arepresentative histology section of day 28 cultures reveal the formationof invasive ‘fingers’ (arrow) penetrating the surrounding hydrogel (left).The H&E stain (middle) shows a hollow core. Immunohistochemistrystain of Caspase 8 (right) confirms apoptotic cells within the core(brown). (D) Scatter plots of colony size, cell number and core size if anyanalyzed from 10 mm thick histology sections. This shows that eachcolony size increases linearly with the cell number. Core size alsoincreases linearly with the colony size. At least three independentexperiments were conducted for each analysis. Scale bars: (A, left, B)250 mm, (A, right) 100 mm and (C) 50 mm.doi:10.1371/journal.pone.0040217.g002
Characterization of LNCaP Cells Grown in 3D
PLOS ONE | www.plosone.org 4 September 2012 | Volume 7 | Issue 9 | e40217
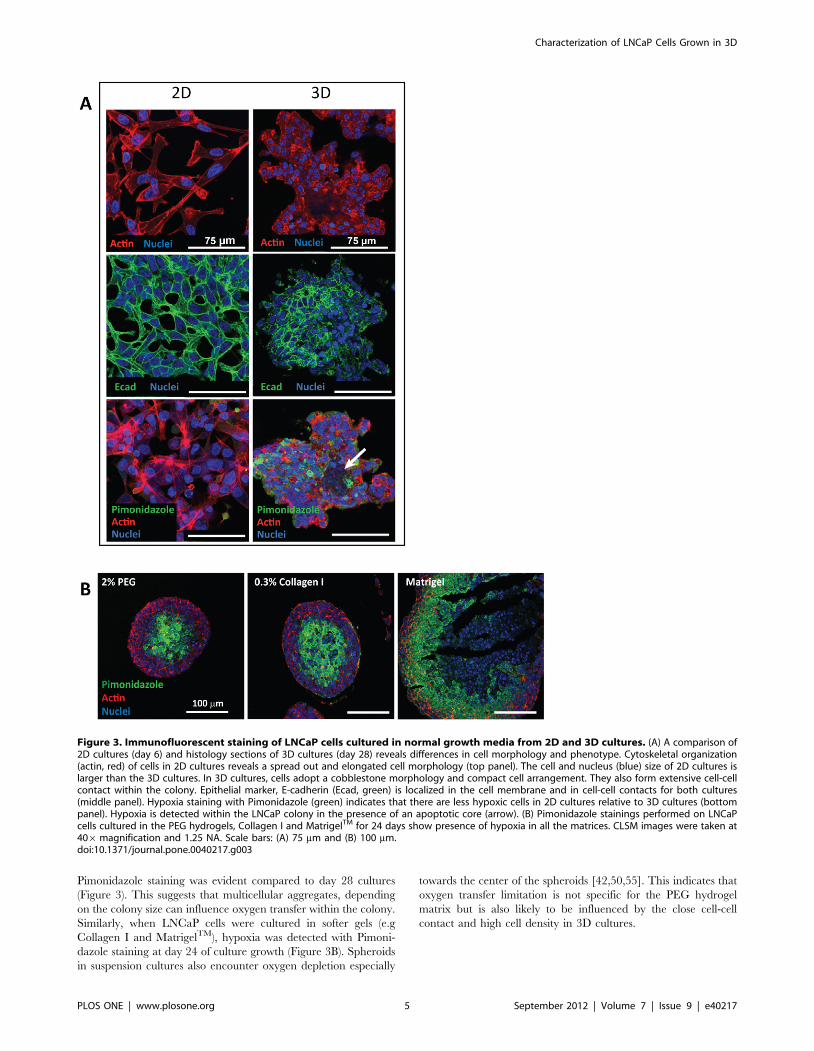
Pimonidazole staining was evident compared to day 28 cultures
(Figure 3). This suggests that multicellular aggregates, depending
on the colony size can influence oxygen transfer within the colony.
Similarly, when LNCaP cells were cultured in softer gels (e.g
Collagen I and MatrigelTM), hypoxia was detected with Pimoni-
dazole staining at day 24 of culture growth (Figure 3B). Spheroids
in suspension cultures also encounter oxygen depletion especially
towards the center of the spheroids [42,50,55]. This indicates that
oxygen transfer limitation is not specific for the PEG hydrogel
matrix but is also likely to be influenced by the close cell-cell
contact and high cell density in 3D cultures.
Figure 3. Immunofluorescent staining of LNCaP cells cultured in normal growth media from 2D and 3D cultures. (A) A comparison of2D cultures (day 6) and histology sections of 3D cultures (day 28) reveals differences in cell morphology and phenotype. Cytoskeletal organization(actin, red) of cells in 2D cultures reveals a spread out and elongated cell morphology (top panel). The cell and nucleus (blue) size of 2D cultures islarger than the 3D cultures. In 3D cultures, cells adopt a cobblestone morphology and compact cell arrangement. They also form extensive cell-cellcontact within the colony. Epithelial marker, E-cadherin (Ecad, green) is localized in the cell membrane and in cell-cell contacts for both cultures(middle panel). Hypoxia staining with Pimonidazole (green) indicates that there are less hypoxic cells in 2D cultures relative to 3D cultures (bottompanel). Hypoxia is detected within the LNCaP colony in the presence of an apoptotic core (arrow). (B) Pimonidazole stainings performed on LNCaPcells cultured in the PEG hydrogels, Collagen I and MatrigelTM for 24 days show presence of hypoxia in all the matrices. CLSM images were taken at406magnification and 1.25 NA. Scale bars: (A) 75 mm and (B) 100 mm.doi:10.1371/journal.pone.0040217.g003
Characterization of LNCaP Cells Grown in 3D
PLOS ONE | www.plosone.org 5 September 2012 | Volume 7 | Issue 9 | e40217

Protein and mRNA levels of LNCaP markers in 3D culturesdiffer from 2D cultures upon stimulation with 1 nMR1881 for 48 h
During the initial stage of CaP, the large majority of tumors are
androgen dependent and responsive; furthermore, the AR
signaling pathway plays an important role in tumor development
and is important throughout progression [56–57]. For this reason,
androgen dependent LNCaP cells are widely used in 2D cultures
for studying androgen receptor (AR) signaling, which is activated
by androgens and analogues such as R1881. In order to expand on
our knowledge of the LNCaP response to R1881 in 2D culture
based experiments, we investigated the effects of R1881 on CaP
marker expression in 3D cultures (Figure 4). Immunofluorescent
staining revealed translocation of AR into the cell nucleus in both
2D and 3D cultures after 7 h of 1 nM R1881 treatment
(Figure 4A). It is well established in 2D culture that once AR
binds to R1881, it is transported to the nucleus where it initiates
transcription of target genes, such Prostate Specific Antigen/
Kallikrein 3 (PSA) [58]. Our preliminary study indicated that AR
target genes, such as PSA, were induced at higher levels after
prolonged R1881 treatment (after 36 h) in both 2D and 3D
cultures (Figure S5A). Hence, we chose for this study a 48 h
R1881 treatment for both cultures. Interestingly, though 2D and
3D cultures responded to the 48 h R1881 treatment, as evidenced
by an increase in the mRNA and protein levels of PSA,
localization of AR in cell nucleus was detected to a lesser extent
in 3D cultures compared to 2D cultures. However, neither
localization nor intensity of the luminal epithelial marker,
Cytokeratin 8 (CK8) was affected by R1881 treatment in 2D or
3D cultures.
To examine the effect of R1881 on levels of proteins, we focused
on the expression of the AR, PSA and CK8 by performing
Western blot analysis. Upon R1881 treatment, PSA and CK8
levels were enhanced in 2D and 3D cultures compared to non
treated ethanol controls although elevation of CK8 protein by
R1881 was not apparent in immunofluorescence staining in 2D
and 3D cultures, which may be attributed to a lack of the
sensitivity (of the antibody used) (Figure 5A, B). Interestingly, in
treated 2D cultures, AR protein levels were elevated when
compared to non-treated controls, indicative of stabilization of
ligand bound AR and/or an increase in AR production [59–60].
In contrast, no significant changes were detected in 3D cultures.
Taken together, this suggests a differential regulation of AR
protein expression in 2D and 3D cultures in response to R1881.
The effect of R1881 on mRNA levels in 2D and 3D cultures was
further investigated by quantitative Real Time-Polymerase Chain
Reaction (qRT-PCR). In accordance with the increased protein
levels, PSA and CK8 mRNA levels increased in both cultures
(Figure 5C). Similar to western blot analysis, the AR mRNA level
was not significantly affected by R1881 treatment in 3D cultures
but did show a declining trend when treatment was prolonged
(Figure S5B). Despite higher AR expression in 2D cultures
compared to 3D cultures, PSA expression was similar between
Figure 4. Phenotypic comparison of LNCaP cells in response to1 nM R1881 in 2D and 3D cultures. (A) Immunofluorescentstainings of LNCaP cells after 7 h treatment with R1881 show co-localization of the AR and cell nucleus in both 2D (day 6) and 3D (day28) cultures (top panel). Corresponding AR localization in both culturesis shown in grayscale images (bottom panel). (B) The cell phenotypes of2D (day 6, left panel) and 3D (day 28, right panel) cultures grown inandrogen depleted media or R1881 supplemented media (48 h) werecompared by immunofluorescent stainings. Proteins of interest are ingreen, actin in red and nucleus in blue. In 2D cultures, AR is localized inthe nucleus and PSA in the cytoplasm upon R1881 stimulation. Withouttreatment, the AR remains in the cytoplasm and PSA is not detected.The luminal epithelial marker, CK8 is detected in both culturesregardless of treatment condition. In 2D cultures, CK8 clearly stains
the filament fibers while in 3D, CK8 is localized at the cell border. In 3Dcultures, extranuclear AR localization is observed in both non treatedand R1881 treated multicellular aggregates. PSA is also producedabundantly in R1881 treated 3D cultures but only at a very low levelwhen not treated. Magnified regions of each specific staining andculture condition (white boxes) are shown below the correspondingimages. CLSM images were taken at 606 magnification (1.4 NA) for Aand 406magnification (1.25 NA) for B. Scale bars: (A) 30 mm, (B) 75 mmand 25 mm (magnified regions).doi:10.1371/journal.pone.0040217.g004
Characterization of LNCaP Cells Grown in 3D
PLOS ONE | www.plosone.org 6 September 2012 | Volume 7 | Issue 9 | e40217

cultures, as shown in Figure 5C. Intriguingly, in non treated
cultures, the baseline PSA mRNA level was significantly higher in
the 3D relative to 2D cultures. AR and PSA mRNA levels in
LNCaP tumor xenografts from intact Non obese diabetic/Severe
Combined ImmunoDefficiency (NOD/SCID) mice (Figure S5C)
were comparable to the R1881 stimulated 3D cultures but not the
2D cultures. Thus, our findings indicate that our 3D cultures
better reflect in vivo tumors.
Androgenic response of LNCaP cells in 3D cultures isaltered compared to 2D cultures under an R1881deprived condition
Given the above differences in PSA and AR expression and AR
localization between 2D and 3D LNCaP cell cultures, we
performed microarray analysis to comprehensively assess tran-
scriptional differences between 2D and 3D LNCaP cell cultures
under androgen deprived and R1881 treated conditions, focusing
on androgen-responsive genes. We found differential regulation of
4157 (1896 up, 2261 down) and 3306 (1304 up, 2002 down)
androgen-responsive genes in R1881-treated 2D and 3D LNCaP
cell culture, respectively. The R1881-treated 2D (2D+R1881) and
3D (3D+R1881) cultures shared 2862 commonly regulated
androgen-responsive genes (1165 up- and 1697 down-regulated
genes) when compared to the respective ethanol controls
(Figure 6A). Interestingly, the fold change in expression level of
898 (31%) of these genes were substantially reduced in 3D+R1881
when compared to 2D+R1881. This was particularly evident for
up-regulated genes, as shown in the scatter plots (Fig. 6A),
suggesting an androgenic response in the absence of androgens
when the LNCaP cells were grown in the 3D culture. Comparison
of the 3D and 2D ethanol controls (3D+EtOHvs2D+EtOH)
revealed that 1469 androgen-responsive genes were differentially
expressed (Figure 6B). This strongly suggests that decreased fold
change of androgen regulated genes in response to R1881 in the
3D culture relative to 2D+R1881 was caused by a strong shift in
the base line expression level of the androgen regulated genes
(Fig. 6B). The difference in base line expression of probes
representing the 1469 androgen regulated genes between 3D
and 2D was evident in both androgen up or down-regulated genes.
This is further supported by our qRT-PCR results that revealed a
significantly higher transcription level of androgen regulated
genes, such as PSA (Figure 5C), Kallikrein 2 and Kallikrein 4
(Figure S6), in untreated 3D cultures compared to untreated 2D
cultures. We then examined 1180 commonly regulated androgen-
responsive genes (483 up- and 697 down-regulated genes) by
pathway analysis with Ingenuity Pathway Analysis (IPA) software.
In support of the strong androgenic response triggered by growing
LNCaP cells in 3D culture, the IPA analysis ranked biosynthesis of
steroids as the top canonical pathway. This ranking was based on
the differential regulation of genes like farnesyl-diphosphate
farnesyltransferase 1 a (FDFT1), 3-hydroxy-3-methylglutaryl-
CoA reductase (HMGCR), isopentenyl-diphosphate delta isomer-
ase 1 (IDI1), lanosterol synthase (LSS) and squalene epoxidase
(SQLE) (results not shown). Furthermore, the top networks listed
by the IPA analysis were associated with lipid and steroid
metabolism (Figure 6C). They contain node molecules like
angiotensinogen (AGT), peroxisome proliferative activated recep-
tor alpha (PPARA) and sterol regulatory element binding
transcription factor 2 (SREBF2). Table 1 illustrates the fold
change in expression levels of a selection of classical androgen
regulated genes and members of the lipid and steroid biosynthesis
network in response to R1881 and culture conditions (2D and 3D).
We have previously shown that LNCaP cells were capable of de
novo steroidogenesis, and that these pathways can be further
induced by external signals such as insulin [61–62]. Altogether,
these results show that growing LNCaP cells in the absence of
androgens in the 3D culture augmented molecular hallmarks of an
androgenic response and activated pathways responsible for
cholesterol and steroid biosynthesis. Future experiments will
address if factors such as increased in cell density and facilitation
of cell-cell communication through homeotypic cell contacts
(Figure 2–4) are responsible for the activation of androgen
regulated genes and/or if de novo steroidogenesis is increased in
the 3D LNCaP cell culture.
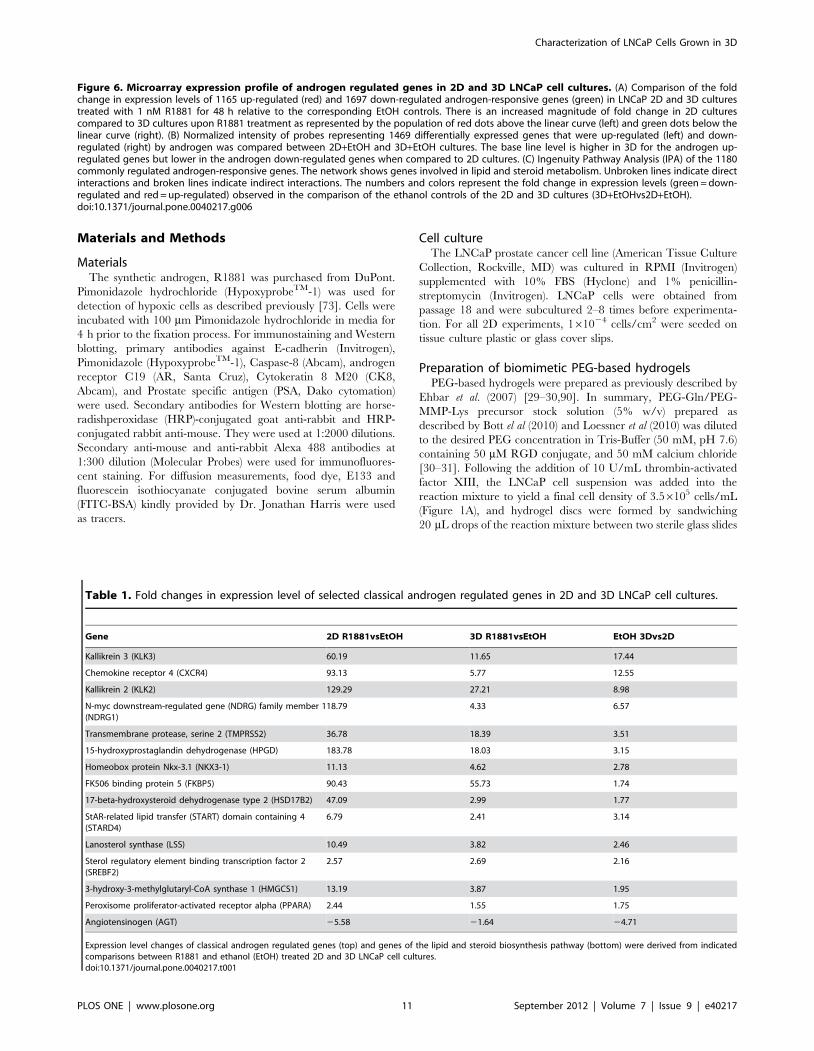
Apart from steroid biosynthesis, other top molecules highlighted
in 3D culture by IPA analysis were associated with cell cycle,
cellular movement, cell morphology and cell-to-cell signaling and
interaction (Figure 7). In the 3D culture compared to 2D under
uninduced condition, there was higher transcription of enzymes
involved in matrix remodeling, particularly lysyl oxidase (LOX), as
well as expression levels of genes encoding for ECM proteins
(collagens, e.g. COL12A1). There was also a higher expression of
genes such as neurogelin 1 (NLGN1) and neurexin 1 (NRXN1),
suggesting a greater cell differentiation capacity in the 3D
microenvironment. We also found lower expression levels of genes
related to focal adhesion formation and actomyosin contractility,
such as vinculin (VCL) and Rho-associated, coiled-coil containing
protein kinase 2 (ROCK2) in 3D cultures may be also related to
the lower stiffness experienced by the cells within the hydrogel
compared to 2D. These molecular changes reflect the difference in
cell morphology of 2D and 3D cultured cells as also reported by
others [12,63–66].
Discussion
This study presents a phenotypic and genotypic comparison
between LNCaP cells cultured within microenvironments engi-
neered with specific functionalities to represent the tumor
microenvironment and LNCaP cells grown on 2D tissue culture
plastic. The acknowledgement of the role of the tumor cell
microenvironment in modulating cell signaling, migration and
differentiation amongst other cellular responses has led to the
utilization of 3D in vitro cultures for cancer studies. Evidence from
previous studies shows that 3D cultures are by far more
physiologically representative of the cancer microenvironment
than monolayer cultures. To date, the most common approaches
used in in vitro to generate 3D compact aggregates (also sometimes
known as spheroid), that approximate the in vivo tumors is by
liquid-overlay and embedding cells in either natural or synthetic
ECM hydrogels [55,67–68]. By culturing the cells within the
synthetic PEG hydrogels, this promotes a 3D cell-cell and cell-
matrix interactions as oppose to the otherwise restricted geometry
of 2D surface. While natural hydrogels are more commonly used
for culturing cancer cells, the biophysical, biochemical and
biological properties of natural hydrogels cannot be independently
tailored. On the other hand, the synthetic hydrogel that allows
better definition of its biochemical and biophysical properties is
emerging as a potential substitute for the natural hydrogels in
cancer research [24]. In this study, LNCaP cells were cultured
within the synthetic PEG hydrogel functionalized with key
biomimetic features of the natural ECM, specifically cell binding
RGD motifs and MMP cleavage sequences. Addition of these
peptides provides adhesion sites for cells and allows controlled
matrix degradation by MMP activity [30], similar to the in vivo
situation. Through characterization of the bioengineered micro-
environment as well as the cell behavior, we have established and
validated a 3D culture system that allows studying of some aspects
Characterization of LNCaP Cells Grown in 3D
PLOS ONE | www.plosone.org 7 September 2012 | Volume 7 | Issue 9 | e40217
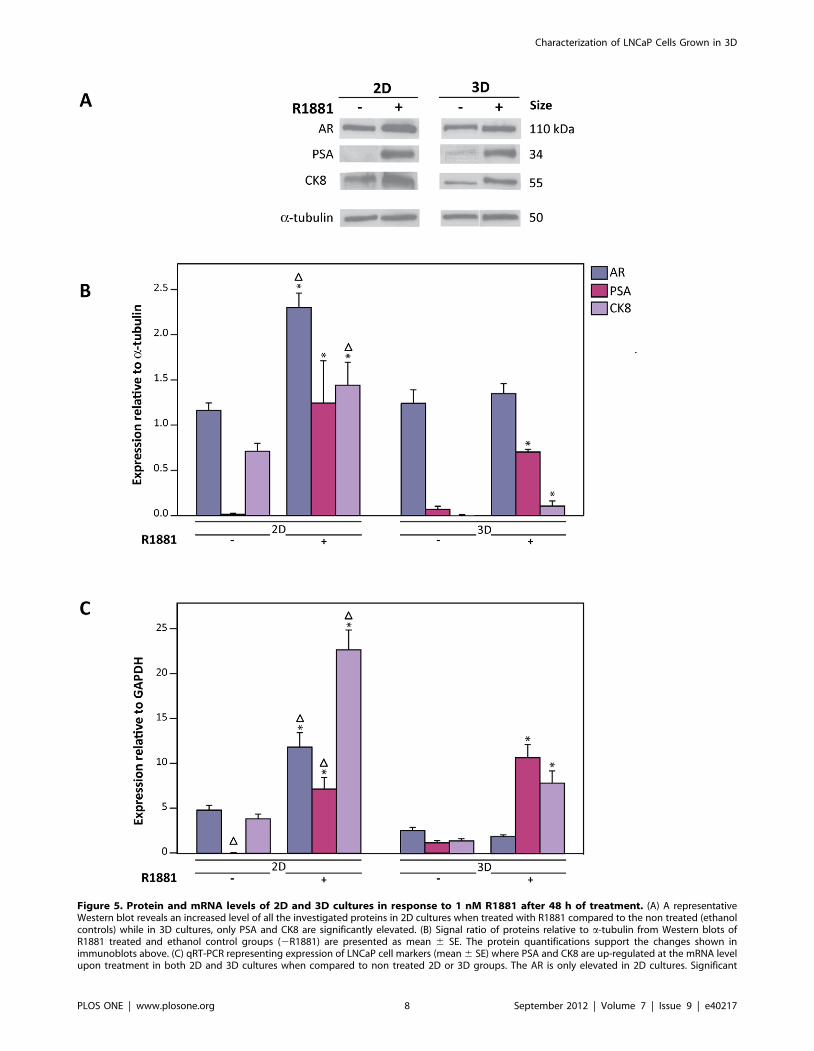
Figure 5. Protein and mRNA levels of 2D and 3D cultures in response to 1 nM R1881 after 48 h of treatment. (A) A representativeWestern blot reveals an increased level of all the investigated proteins in 2D cultures when treated with R1881 compared to the non treated (ethanolcontrols) while in 3D cultures, only PSA and CK8 are significantly elevated. (B) Signal ratio of proteins relative to a-tubulin from Western blots ofR1881 treated and ethanol control groups (2R1881) are presented as mean 6 SE. The protein quantifications support the changes shown inimmunoblots above. (C) qRT-PCR representing expression of LNCaP cell markers (mean 6 SE) where PSA and CK8 are up-regulated at the mRNA levelupon treatment in both 2D and 3D cultures when compared to non treated 2D or 3D groups. The AR is only elevated in 2D cultures. Significant
Characterization of LNCaP Cells Grown in 3D
PLOS ONE | www.plosone.org 8 September 2012 | Volume 7 | Issue 9 | e40217
of tumor-like morphogenesis and their response to hormone
agonist stimulation.
Matrix properties, such as ligand composition and stiffness have
been shown to influence properties which are associated with the
malignancy of tumor cells, such as migration, morphology and
proliferation [8–10,69]. An in vitro study by Tilghman et al (2010)
reported that the growth of multiple cancer cell lines is either
dependent or not dependent on the matrix rigidity. This
observation in vitro can help to predict the cell line’s response to
certain ECMs in vivo [10]. We also investigated if the LNCaP cells
were sensitive to the change in matrix stiffness. The stiffness of
these biomimetic hydrogel matrices can be easily tuned by altering
their dry-mass content. This allowed us to profile the growth of
cells cultured in the biomimetic hydrogels of three different
stiffnesses with constant cell ligand densities. As anticipated, the
increasing dry-mass content from 1.5 to 2,5% contributes to the
matrix stiffness. Consistent with earlier studies which used different
cell types cultured in the same synthetic hydrogels [30–31], we
showed that matrix stiffness has a strong influence on LNCaP cell
growth in 3D. While cells in softer matrix were able to proliferate
faster, in stiffer matrix (2.5% PEG, 8 kPa), growth was impeded.
We ruled out nutrient deficiency as the reason for non growth in
2.5% hydrogels, as our study had shown that molecules of
molecular weight up to 66 kDa, a range that encompasses most
growth factors, could penetrate the hydrogels. Moreover, cells
close to the surface of the 2.5% hydrogel were not able to grow
despite having full access to nutrients. Similarly, as shown earlier
by Bott et al.(2010), human dermal fibroblasts in stiff hydrogels
were viable but did not proliferate into multicellular aggregates
such as normally observed in softer matrices [30]. Therefore, we
conclude that the higher rigidity of the 2.5%, compared to 1.5 and
2% hydrogels, may be the cause of inhibition of LNCaP cell
growth. The proliferation of LNCaP cells in 2% hydrogels is
comparable to the growth of in vivo tumor and CaP xenografts, in
terms of the growth pattern and rate [44–46,70–71]. The 2%
hydrogels are not only compatible for LNCaP cell growth in a
manner that recapitulate the slow growing tumor but also
resemble the stiffness of glandular tissues (4 kPa) and other soft
tissues [5,72].
In addition to the growth kinetics of LNCaP cells in the 3D
cultures, morphological features of the LNCaP multicellular
colonies show resemblance to in vivo tumors, such as compact
cell-cell adhesion and the presence of hypoxia and apoptotic cores.
Hypoxia and apoptotic cores are frequently detected and observed
in numerous in vitro 3D models of LNCaP cells and other tumor
cells, as well as in vivo tumors [17,41–42,50–51,73–74]. In our
study, presence of hypoxia and lack of nutrients could explain the
growth kinetics in the 3D cultures. As the size of the colony size
increased, nutrient and oxygen access to cells located at a greater
radial distance from the colony periphery may decrease. This
finding was exemplified by a greater Pimonidazole stained region
in larger LNCaP colonies (day 28) compared to smaller colonies
(day 14). As these aggregates reached a critical size, the nutrient
deprived cells may become quiescent or undergo cell death, which
may lead to apoptotic/necrotic core formations. Additionally, loss
of matrix attachments experienced by cells in the centre may also
lead to anoikis [75]. While apoptotic cores are not always apparent
in vascularized in vivo tumors, heterogeneously distributed hypoxic
regions are detected in these tissues [76–78]. Therefore, our 3D
model which only allows growth of the LNCaP colonies up to a
certain size or cell density is more representative of an early
development of avascular/poorly vascularized tumors rather than
a vascularized tumor. All these features that reflect characteristics
of avascular tumors, however, are not present in 2D cultures.
Multiple ‘finger-like’ structures were detected in LNCaP
colonies after 28 days of cultures. Similar ‘fingering’ phenomenon
was also described by Anderson et al.(2006), where adaptive tumor
cells in spheroids acquired the fingering structure under nutrient
or oxygen depleted conditions [79]. This morphology is also
associated with collective cell migration, which occur when cancer
cells in aggregates invade 3D matrices [80–81]. This could also be
related to the gain of invasive traits by cells in spheroids grown for
a longer period of time [49], indicating that cells could become
more invasive in a microenvironment with prolonged metabolite
or mechanical stress. These stresses are also constantly exerted
upon growing tumor cells and are believed to selectively favor
survival of the more aggressive cell phenotype [79,82].
Our data further indicated a differential kinetics in the cellular
response to the synthetic androgen, R1881 among 2D and 3D
cultures. Up-regulation of PSA was evident with 48 h treatment of
R1881 in 2D and 3D cultures suggesting R1881-mediated
activation of AR. Although the dynamics of the AR have been
extensively explored, the AR machinery system is still not fully
understood. Our study showed that, contrary to 2D cultures, the
nuclear AR was greatly reduced in the 3D cultures after prolonged
(48 h) treatment with R1881 but did not hinder induction of
androgen target genes as also reported by Kesler et al (2007) [83].
However, distinct nuclear AR was observed at the early stage (7 h)
of R1881 stimulation, indicating the AR import to the nucleus did
occur and was not impaired.
Clearly, the kinetics of AR turnover within 48 h of R1881
stimulation in 3D cultures differs from 2D cultures while still
maintaining the expression of androgen responsive gene, PSA. In
the absence of R1881, expression of androgen responsive genes,
such as KLK2 and 4, was higher in 3D cultures compared to 2D
cultures despite the absence of R1881. Microarray gene analysis
also showed that genes responsible for cholesterol and steroid
biosynthesis were also elevated in 3D untreated cultures. We
hypothesize that the increase in cell-cell interaction/cell density
could elevate the baseline expression of the androgen regulated
genes (unpublished data). Indeed, studies have shown that
integrins and hypoxia can influence AR activity by altering the
sensitivity of AR to androgens [84–89].
In conclusion, the bioengineered LNCaP tumors reflect in vivo
tumors to more extensively than 2D cultures. Morphologically,
they bear resemblances to avascular tumors, and phenotypically,
like early androgen responsive CaP, they can be induced to
respond to androgen in a manner similar to LNCaP xenografts.
The discrepancies we described in the androgen response and AR
transport between 2D and 3D cultures highlights the importance
of the microenvironment and should be further investigated.
Considering the role that AR and androgen play in CaP
progression, we may need to further investigate the mechanisms
of AR signaling in a 3D context. Therefore, we suggest that this
3D model will be of great value in extending our understanding of
tumor cell biology and may be utilized in designing a more
physiological in vitro drug screening platform, which may help to
advance CaP clinical outcomes.
difference (p,0.05) between treated and non-treated samples within similar groups (either 2D or 3D cultures) is denoted by (*) and between similartreatment of different groups are denoted by (D). Triplicate samples were analyzed from at least three independent experiments.doi:10.1371/journal.pone.0040217.g005
Characterization of LNCaP Cells Grown in 3D
PLOS ONE | www.plosone.org 9 September 2012 | Volume 7 | Issue 9 | e40217

Characterization of LNCaP Cells Grown in 3D
PLOS ONE | www.plosone.org 10 September 2012 | Volume 7 | Issue 9 | e40217
Materials and Methods
MaterialsThe synthetic androgen, R1881 was purchased from DuPont.
Pimonidazole hydrochloride (HypoxyprobeTM-1) was used for
detection of hypoxic cells as described previously [73]. Cells were
incubated with 100 mm Pimonidazole hydrochloride in media for
4 h prior to the fixation process. For immunostaining and Western
blotting, primary antibodies against E-cadherin (Invitrogen),
Pimonidazole (HypoxyprobeTM-1), Caspase-8 (Abcam), androgen
receptor C19 (AR, Santa Cruz), Cytokeratin 8 M20 (CK8,
Abcam), and Prostate specific antigen (PSA, Dako cytomation)
were used. Secondary antibodies for Western blotting are horse-
radishperoxidase (HRP)-conjugated goat anti-rabbit and HRP-
conjugated rabbit anti-mouse. They were used at 1:2000 dilutions.
Secondary anti-mouse and anti-rabbit Alexa 488 antibodies at
1:300 dilution (Molecular Probes) were used for immunofluores-
cent staining. For diffusion measurements, food dye, E133 and
fluorescein isothiocyanate conjugated bovine serum albumin
(FITC-BSA) kindly provided by Dr. Jonathan Harris were used
as tracers.
Cell cultureThe LNCaP prostate cancer cell line (American Tissue Culture
Collection, Rockville, MD) was cultured in RPMI (Invitrogen)
supplemented with 10% FBS (Hyclone) and 1% penicillin-
streptomycin (Invitrogen). LNCaP cells were obtained from
passage 18 and were subcultured 2–8 times before experimenta-
tion. For all 2D experiments, 161024 cells/cm2 were seeded on
tissue culture plastic or glass cover slips.
Preparation of biomimetic PEG-based hydrogelsPEG-based hydrogels were prepared as previously described by
Ehbar et al. (2007) [29–30,90]. In summary, PEG-Gln/PEG-
MMP-Lys precursor stock solution (5% w/v) prepared as
described by Bott el al (2010) and Loessner et al (2010) was diluted
to the desired PEG concentration in Tris-Buffer (50 mM, pH 7.6)
containing 50 mM RGD conjugate, and 50 mM calcium chloride
[30–31]. Following the addition of 10 U/mL thrombin-activated
factor XIII, the LNCaP cell suspension was added into the
reaction mixture to yield a final cell density of 3.56105 cells/mL
(Figure 1A), and hydrogel discs were formed by sandwiching
20 mL drops of the reaction mixture between two sterile glass slides
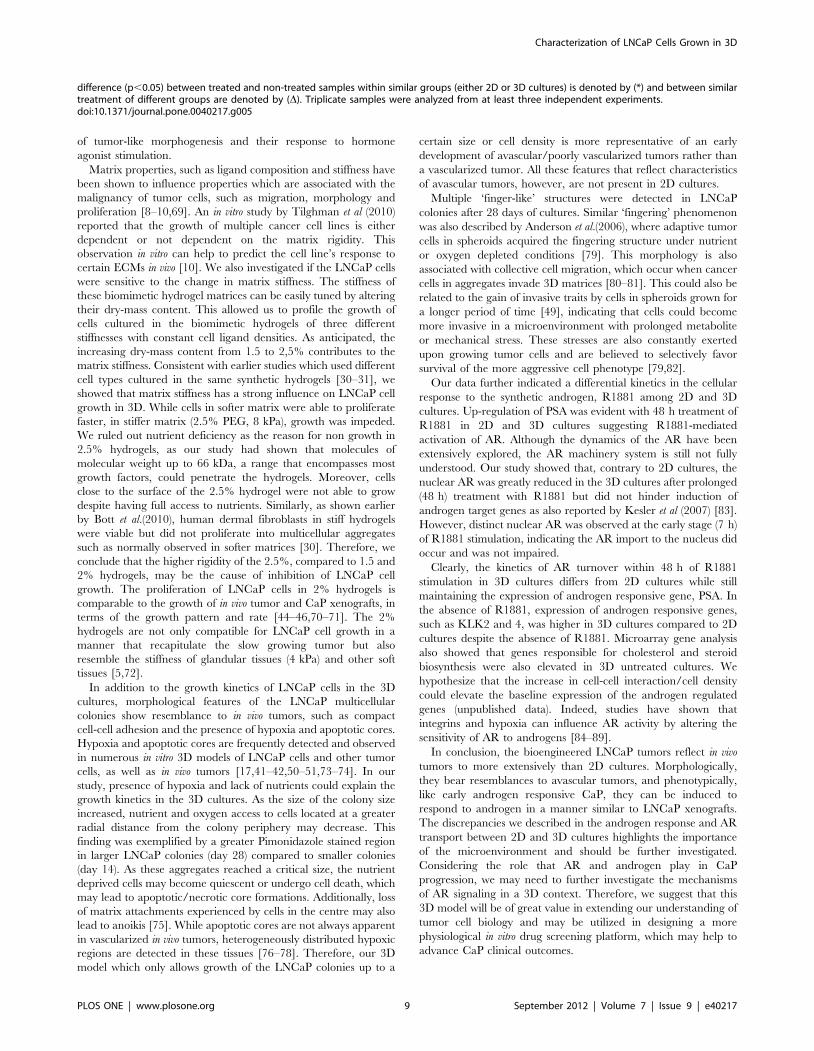
Figure 6. Microarray expression profile of androgen regulated genes in 2D and 3D LNCaP cell cultures. (A) Comparison of the foldchange in expression levels of 1165 up-regulated (red) and 1697 down-regulated androgen-responsive genes (green) in LNCaP 2D and 3D culturestreated with 1 nM R1881 for 48 h relative to the corresponding EtOH controls. There is an increased magnitude of fold change in 2D culturescompared to 3D cultures upon R1881 treatment as represented by the population of red dots above the linear curve (left) and green dots below thelinear curve (right). (B) Normalized intensity of probes representing 1469 differentially expressed genes that were up-regulated (left) and down-regulated (right) by androgen was compared between 2D+EtOH and 3D+EtOH cultures. The base line level is higher in 3D for the androgen up-regulated genes but lower in the androgen down-regulated genes when compared to 2D cultures. (C) Ingenuity Pathway Analysis (IPA) of the 1180commonly regulated androgen-responsive genes. The network shows genes involved in lipid and steroid metabolism. Unbroken lines indicate directinteractions and broken lines indicate indirect interactions. The numbers and colors represent the fold change in expression levels (green = down-regulated and red = up-regulated) observed in the comparison of the ethanol controls of the 2D and 3D cultures (3D+EtOHvs2D+EtOH).doi:10.1371/journal.pone.0040217.g006
Table 1. Fold changes in expression level of selected classical androgen regulated genes in 2D and 3D LNCaP cell cultures.
Gene 2D R1881vsEtOH 3D R1881vsEtOH EtOH 3Dvs2D
Kallikrein 3 (KLK3) 60.19 11.65 17.44
Chemokine receptor 4 (CXCR4) 93.13 5.77 12.55
Kallikrein 2 (KLK2) 129.29 27.21 8.98
N-myc downstream-regulated gene (NDRG) family member 1(NDRG1)
18.79 4.33 6.57
Transmembrane protease, serine 2 (TMPRSS2) 36.78 18.39 3.51
15-hydroxyprostaglandin dehydrogenase (HPGD) 183.78 18.03 3.15
Homeobox protein Nkx-3.1 (NKX3-1) 11.13 4.62 2.78
FK506 binding protein 5 (FKBP5) 90.43 55.73 1.74
17-beta-hydroxysteroid dehydrogenase type 2 (HSD17B2) 47.09 2.99 1.77
StAR-related lipid transfer (START) domain containing 4(STARD4)
6.79 2.41 3.14
Lanosterol synthase (LSS) 10.49 3.82 2.46
Sterol regulatory element binding transcription factor 2(SREBF2)
2.57 2.69 2.16
3-hydroxy-3-methylglutaryl-CoA synthase 1 (HMGCS1) 13.19 3.87 1.95
Peroxisome proliferator-activated receptor alpha (PPARA) 2.44 1.55 1.75
Angiotensinogen (AGT) 25.58 21.64 24.71
Expression level changes of classical androgen regulated genes (top) and genes of the lipid and steroid biosynthesis pathway (bottom) were derived from indicatedcomparisons between R1881 and ethanol (EtOH) treated 2D and 3D LNCaP cell cultures.doi:10.1371/journal.pone.0040217.t001
Characterization of LNCaP Cells Grown in 3D
PLOS ONE | www.plosone.org 11 September 2012 | Volume 7 | Issue 9 | e40217
(separated by 1.5 mm spacers) pre-coated with SigmaCote
(Sigma). Hydrogels were allowed to polymerize at 37uC for 20–
40 min in an incubator (Binder Gmbh, Germany) before being
transferred to 24 well plates filled with growth medium. Medium
was changed every 4 days.
Mechanical testing of hydrogelsTo measure the global stiffness of cell-free hydrogels of 1.5, 2.0
and 2.5% PEG content, unconfined compression tests were
conducted using an Instron microtester (Instron). Measurements
were performed at 30% strain with displacement of 0.45 mm/
min, using a 5 N cell load. During compression, hydrogels were
maintained at 37uC in a moist condition. The elastic (Young’s)
modulus was extracted from the linear region of the stress-strain
curve (9–15%) according to the equation E = F/A/L/L0. F = force
applied to sample, A = cross section area which the force is
applied, L = the amount of change in hydrogel thickness, L0 = the
original thickness of the hydrogel.
Local stiffness of the hydrogels was examined by atomic force
microscopy (AFM) indentation measurements using a NanoWi-
zard II from JPK Instruments (Berlin, Germany). Pyramidal-
shaped cantilevers (MLCT, Veeco) were calibrated in situ using
built-in procedures of the AFM software. Coverslips with hydrogel
discs were mounted into the temperature-controlled chamber of
the instrument (Petridishheater, JPK Instruments). The measure-
ments were conducted at 37uC in PBS. To measure the elastic
(Young’s) modulus, E of the PEG hydrogels, the cantilever was
approached at a speed of 2 mm/sec onto the hydrogel until a
contact force of 0.8 nN was reached. From the recorded force
versus tip-sample-separation curves (Figure 1C, left), the elastic
modulus was extracted using procedures implemented into the
JPK IP software. This procedure applied a Hertzian fit assuming a
pyramidal indenter with half-angle-to-face of 17.5u, and a
Poisson’s ratio of 0.5. For each gel, the elastic modulus was
measured on at least 50 different spots on the gel. At least four gels
Figure 7. Heat map of gene expression level comparing untreated 3D cultures to 2D cultures (3D+EtOHvs2D+EtOH). The fold changein expression levels of genes related to cellular functions are represented by the colors in the heatmap. The green color denotes a decrease inexpression in 3D cultures relative to 2D cultures and the red color denotes an increase in 3D cultures relative to 2D cultures. The fold change between21.5 to +1.5 is considered not significant (NS). The differential expression of these molecules suggests that LNCaP cells grown in 3D may assumedifferent roles in cell-cell signaling and interactions from the 2D cultures.doi:10.1371/journal.pone.0040217.g007
Characterization of LNCaP Cells Grown in 3D
PLOS ONE | www.plosone.org 12 September 2012 | Volume 7 | Issue 9 | e40217

from independent preparations were analyzed for each PEG
concentration.
Diffusion measurementsCell-free hydrogel reaction mixtures of different PEG contents
were pipetted into a pasteur pipette of approximately 2 mm
diameter and allowed to polymerize at room temperature for
20 min. Then, the food dye, E133 (792 Da) (1:1000 dilution) or
FITC-BSA (66 kDa) (1 mg/mL) was injected into the pasteur
pipette to come in contact with the hydrogel before incubation at
37uC. After 110 min (E133) and 50 min (FITC- BSA), the
hydrogel-tracer solution intersections were imaged using a Nikon
Eclipse microscope equipped with a Nikon Digital camera
DXM1200C (Coherent Scientific). From the grey scale images,
an intensity profile was plotted over the region from the gel-tracer
solution interface to the tracer-absent position using image J. The
intensity profile was fitted to the following equation f(x) = a*erfc
(x/2!Dt) using IGOR Pro (wavemetrics).
D = diffusion coefficient, a = intensity of the tracer, x = distance
of measured tracer from the gel-tracer interface and t = duration of
hydrogel exposure to the tracer.
R1881 treatment for 2D and 3D culturesBoth 2D and 3D cultures were maintained in androgen-
deprived media (RPMI media containing 5% charcoal stripped
serum) for 48 h prior to androgen treatment. Androgen depriva-
tion was initiated when cultures reached 70–80% confluency for
2D cultures and on day 24 for 3D cultures. Media were then
changed to androgen- deprived media containing 1 nM R1881.
The cultures were treated with R1881 for 48 hr before imaging or
protein and RNA extraction. 2D and 3D cultures incubated for
another 48 hr in androgen-deprived media in the absence of
R1881 (with 0.008% ethanol) were used as controls.
Proliferation assay for 2D and 3D culturesFor 2D cultures, cells were plated in 24 well plates and
harvested daily from day 1 to day 7 by adding 200 mL of
Proteinase K (0.5 mg/mL). The cell suspension was incubated at
56uC for 12 h and stored at 280uC before a Pico Green
(Invitrogen) proliferation assay was performed as reported
elsewhere [91]. For 3D cultures, hydrogels of different PEG
concentrations was harvested at day 1, 7, 14, 21 and 28 and also
subjected to digestion with 300 mL of Proteinase K for 16 hr prior
to a Pico Green assay. The digested cell suspension mixture was
diluted with phosphate buffered saline/ethylenediaminetetraacetic
acid (PBS/EDTA) buffer to allow readout within the range of the
standard curve between 10 ng/mL and 2 mg/mL DNA. All
samples were assayed in triplicate from three biological samples
Live-dead stainingAt day 24 of 3D cultures, hydrogels with cells were washed with
PBS and incubated in 2 mg/mL fluorescein diacetate (FDA) solution
diluted in PBS for 30 min at 37uC. Cells were then incubated for
another 5 min in 20 mg/mL propidium iodide (PI) solution before
washing thoroughly with PBS. Hydrogels were immediately
analysed using a Leica SP5 confocal microscope (Leica). Z stacks
over a range of 150 mm were imaged and 3D projections were
created using the Leica Image Processing software.
Phalloidin-DAPI staining and spheroid size and shapecharacterisation
Cells were fixed in 4% formaldehyde/PBS, permeabilised in
0.2% Triton X-100 and stained with 0.8 U/ml rhodamine
conjugated Phalloidin (Invitrogen) and 2 mg/ml 49,6-diamidino-
2-phenylindole (DAPI) [Invitrogen] for 40 min as described [92].
Fluorescent confocal images stacks over a range of 100–200 mm
were captured with Leica SP5 laser scanning confocal microscopy
(CLSM). From the 3D projections, the size and shape factor of the
spheroid were measured using Image J software.
Immuno/fluorescent stainingLNCaP cells were either cultured in normal growth media or
treated with R1881 as described previously. For 2D cultures,
LNCaP cells were cultured on glass cover slips. 2D and 3D
cultures were fixed with 4% paraformaldehyde/PBS for 30 min.
Hydrogels from 3D cultures were either stored in 4uC or processed
for cryosection. Hydrogels for cryosection were prepared by
immersing them in OCT Tissue Teck/PBS (1:1) solution for
45 min followed by another 45 min in OCT Tissue Tek
(ProSciTech Pty Ltd). Then, the hydrogels were loaded into
cryomoulds, fully immersed in OCT Tissue Tek and frozen with
liquid nitrogen. Hydrogels were stored at 280uC until ready for
sectioning. 7 mm thick sections were permeabilized with 0.2%
Triton-X for 10 min and blocked for 1 hr with 1% BSA solution
before incubation in primary (Ecad, 1:100, Pimonidazole, 1:100,
AR, 1:200, PSA, 1:200 and CK8, 1:200) and fluorescently
conjugated secondary antibodies. Samples were counterstained
with Phallodin and DAPI for 40 min. Images were captured using
Leica SP5 CLSM (Leica).
Cell lysate preparation and Western blotting assays2D and 3D cultures of treated and non treated groups were
harvested for lysate preparation in lysis buffer (1% Triton X-100,
150 mM NaCl, 10 mM Tris/HCl, pH 7.5, 1 mM EDTA and
25 mM NaF) containing protease inhibitor cocktail (Roche). For
3D cultures, hydrogels were dispersed using a pipette to release the
embedded spheroids. 20 mg of protein was loaded onto a 10%
sodium dodecyl sulphate (SDS) polyacrylamide gel and separated
by electrophoresis for 2 h at 120 V. Proteins were transferred to a
nitrocellulose membrane by wet transfer for 1 h at 100 V. After
primary antibodies (AR, 1:2000, PSA, 1:3000 and CK8,1:1000)
and secondary HRP conjugated secondary antibody incubation,
chemiluminescent Pierce ECL Western Blotting Substrate
(Thermo Scientific) was added and membranes were exposed on
X-ray films.
RNA isolation and quantitative Real Time-PCR (qRT-PCR)RNA extraction was performed with Trizol (Invitrogen)
according to the manufacturer’s instruction. For 3D cultures,
three hydrogels were pooled before adding Trizol reagent. RNA
concentrations were quantified using a Nanodrop-1000 (ND-
1000). Samples with a 260/280 ratio higher than 1.7 were used for
subsequent procedures. The samples were then treated with
DNAse Amp grade I and reverse-transcribed using the cDNA
synthesis method for the qPCR kit (Invitrogen). QRT-PCR was
performed using the 7900HT Fast Real-Time PCR System
(Applied Biosystems) and data analyzed with SDS2.3 software as
described previously [92]. The sequences of all primers are as
follows:
GAPDH, 59-GCAAATTCCATGGCACCGT-39 and
59- TCGCCCCACTTGATTTTGG-39,
PSA, 59-AGTGCGAGAAGCATTCCCAAC-39 and
59- CCAGCAAGATCACGCTTTTGTT-39,
AR, 59- CTGGACACGACAACAACCAG-39 and
59- CAGATCAGGGGCGAAGTAGA-39, and
CK8, 5- CTGGGATGCAGAACATGAGTATTC-39 and
59- GTAGCTGAGGCCGGGGCTTGT-39.
Characterization of LNCaP Cells Grown in 3D
PLOS ONE | www.plosone.org 13 September 2012 | Volume 7 | Issue 9 | e40217

Microarray gene expression profilingTriplicates of each condition were prepared for microarray
profiling which was performed on a custom Agilent 46180 k oligo
array. This microarray incorporates Agilent human gene expres-
sion protein-coding probes as well as non-coding probes; with the
probes targeting exonic regions, 39UTRs, 59UTRs, as well as
intronic and intergenic regions. RNA was isolated with Trizol,
followed by clean-up using a RNeasy Mini Kit (Qiagen) and
DNAse on column treatment according to the manufacturer’s
protocol. RNA samples were analyzed by a Bioanalyzer (Agilent)
to ensure the RNA was of high quality. 200 ng of RNA from each
group was amplified and labeled according to the protocol for
One-Color Microarray-Based Gene Expression Analysis (Low
Input Quick Amp Labeling Kit, Agilent). The input RNA was
reversed transcribed into cDNA, using an oligo-dT-promoter
primer which introduces a T7 promoter region. The subsequent in
vitro transcription uses a T7 RNA polymerase, which simulta-
neously amplifies target material and incorporates cyanine 3-
labeled CTP. cDNA synthesis and in vitro transcription were
performed at 40uC for 2 h, respectively. The labeled cRNA was
purified with Qiagen’s RNEasy mini spin columns and quantified
using a Nanodrop-1000. 1650 ng cRNA from each sample were
loaded onto 46180 k custom microarray which contains the
Agilent 44 k probe set (design number 014850) and allowed to
hybridize at 65uC for 17 h. The arrays were scanned with the
Agilent Microarray Scanner G2565CA.
Microarray data analysisThe microarray data were processed with Agilent Feature
Extraction Software (v10.7). A quantile between array normaliza-
tion was applied and differential expression was determined using
a Baysian adjusted t-statistic from a Linear Models for Microarray
Data (LIMMA) linear model. The p-values were corrected for a
false discovery rate of 5%. Normalized gene expression data of the
experiment are Minimum Information About a Microarray
Experiment (MIAME) compliant and have been submitted to
Gene Expression Omnibus (GEO) with the accession number
GSE33610. The gene expression levels are presented as log2 and
were compared between two groups with a t-test. Genes that were
significantly different between two groups were identified with a p
value of , = 0.05, and an average fold change of . = 1.5. The
androgen-responsive gene filter was generated from 46180 k
microarray data of DHT- and R1881-treated LNCaP 2D cell
cultures and consists of 6598 genes commonly regulated by both
androgens (Lehman M and Nelson CC, unpublished results). The
microarray data from the 2D and 3D cultures were processed with
the androgen-responsive gene filter to compare their regulation in
response to treatment (R1881 versus ethanol) and culture
conditions (2D versus 3D). The filtered gene lists were examined
by Ingenuity Pathway Analysis (IPA, Ingenuity Systems Inc.) for
functional annotation and gene network analysis.
Statistical analysisUnivariate ANOVA post hoc Least Significant Difference
(LSD) tests were used to determine the statistical significance of
data between more than two conditions for hydrogel stiffness,
diffusivity, spheroid size and shape factor measurements, qRT-
PCR and Western blot.
Supporting Information
Figure S1 Mechanical properties of 2% PEG-basedbiomimetic hydrogels after culture with LNCaP cells.(A) A small variation of the hydrogel’s stiffness was detected
between day 1 to day 54 cultures. (B) The volume of hydrogels
remains unchanged from day 1 to day 28. Each grid box
represents 1 mm61 mm.
(TIF)
Figure S2 3D confocal image projections of 1.5–2.5%PEG hydrogels after 24 h immersion in 1 mg/mL FITC-BSA- solution. Images of the cut surface were taken to examine
the penetration of the FITC-BSA- (66 kDa) across the thickness
(1.5 mm) of the hydrogel discs (green). It shows that BSA-FITC
can still saturate the 2.5% PEG hydrogel. Dotted lines demarcate
the border of the hydrogels. Scale bars: 100 mm.
(TIF)
Figure S3 3D confocal image projections of the ofLNCaP cells grown in the PEG hydrogel and MatrigelTM.LNCaP cells were embedded in the PEG hydrogels as single cells
(left) and allowed to be cultured up to 28 days. Cells cultured
within Matrigel form spheroids with well defined shape similar to
cells grown in PEG hydrogels (right). CLSM images were taken at
206magnification (0.7 NA) for PEG hydrogel and 406 (1.25 NA)
for MatrigelTM. Scale bars: 100 mm.
(TIF)
Figure S4 Immunofluorescent staining of LNCaP cellsgrown in the 2% PEG-based hydrogels for 14 days.Cultures were pretreated with 100 mm Pimonidazole hydrochlo-
ride for 4 h before being harvested and fixed for cryosectioning.
Pimonidazole (green) is detected in a small region of the LNCaP
colony indicating presence of hypoxic cells. CLSM images were
taken at 406magnification and 1.25 NA. Scale bar: 30 mm.
(TIF)
Figure S5 qRT-PCR of LNCaP cells treated with 1 nMR1881 in 2D and 3D cultures, and LNCaP xenograft. (A)
mRNA level of PSA in 2D and 3D cultures at different treatment
durations shows maximum induction for 3D cultures at 36–48 h
and 48–72 h for 2D cultures. (B) mRNA level of AR changes with
the treatment duration in both cultures. The expression decreased
at 36 h of R1881 treatment in 2D cultures compared to non-
treated (ethanol) controls but increased thereafter. In 3D cultures,
a slight suppression was observed as the treatment was prolonged
for more than 48 h. (C) The LNCaP xenograft from (after 12
weeks of inoculation) intact NOD/SCID mice shows comparable
AR and PSA expression levels to 3D cultures treated with 1 nM
R1881 for 48 h.
(TIF)
Figure S6 qRT-PCR of LNCaP cells under androgendeprived condition in 2D and 3D cultures. LNCaP cells
were cultured in RPMI+5% CSS for 48 h followed by another
48 h in RPMI+5% CSS+ EtOH (0.08%) before being harvested
for RNA isolation. Expression of Kallikrein 2 and Kallikrein 4 are
both significantly higher in 3D compared to 2D cultures.
(TIF)
Video S1 Movie of LNCaP cells embedded in a 2% PEG-based biomimetic hydrogel at day 7 of culture. The video
was taken with widefield microscopy from day 7 to day 12. This
shows that spheroids are formed by cell division within the
spheroid and not by aggregation of neighboring cells. No active
cell migration was observed in the culture.
(WMV)
Acknowledgments
We would like to thank Dr. Travis Klein from Institute of Health and
Biomedical Innovation, Queensland University of Technology for his
Characterization of LNCaP Cells Grown in 3D
PLOS ONE | www.plosone.org 14 September 2012 | Volume 7 | Issue 9 | e40217

assistance in operating the Instron microtester and Dr. Amy A. Lubik of
Australian Prostate Cancer Research Centre-Queensland, Princess Alex-
andra Hospital for helping with the proof reading of the manuscript.
Author Contributions
Conceived and designed the experiments: SS AVT SCR JAC CCN DWH.
Performed the experiments: SS AVT SCR. Analyzed the data: SS AVT
MS MLL AR. Contributed reagents/materials/analysis tools: SS AVT SR
MS AR JA MLL JAC CCN DWH. Wrote the paper: SS AVT MS MLL
AR. Bioinformatics: MLL JA.
References
1. Jemal A, Siegel R, Ward E, Hao Y, Xu J, et al. (2008) Cancer Statistics, 2008.
58: 71–96.
2. PCFA (2012) Prostate Cancer Statistics. Available: http://www.prostate.org.au/articleLive/pages/Prostate-Cancer-Statistics.html. Accessed: 10 January 2012.
3. Cukierman E, Pankov R, Yamada KM (2002) Cell interactions with three-
dimensional matrices. Current Opinion in Cell Biology 14: 633–640.
4. Vogel V, Sheetz M (2006) Local force and geometry sensing regulate cell
functions. Nat Rev Mol Cell Biol 7: 265–275.
5. Paszek MJ, Zahir N, Johnson KR, Lakins JN, Rozenberg GI, et al. (2005)Tensional homeostasis and the malignant phenotype. Cancer Cell 8: 241–254.
6. Krouskop TA, Wheeler TM, Kallel F, Garra BS, Hall T (1998) Elastic moduli of
breast and prostate tissues under compression. Ultrasonic Imaging 20: 260–274.
7. Hoyt K, Castaneda B, Zhang M, Nigwekar P, di Sant’Agnese PA, et al. (2008)
Tissue elasticity properties as biomarkers for prostate cancer. Cancer Biomarkers4: 213–225.
8. Levental KR, Yu H, Kass L, Lakins JN, Egeblad M, et al. (2009) Matrix
Crosslinking Forces Tumor Progression by Enhancing Integrin Signaling. Cell139: 891–906.
9. Kostic A, Lynch CD, Sheetz MP (2009) Differential Matrix Rigidity Response in
Breast Cancer Cell Lines Correlates with the Tissue Tropism. PLoS ONE 4: 1–11.
10. Tilghman RW, Cowan CR, Mih JD, Koryakina Y, Gioeli D, et al. (2010) Matrix
Rigidity Regulates Cancer Cell Growth and Cellular Phenotype. PLoS ONE 5:1–13.
11. Indra I, Beningo KA (2011) An in vitro correlation of metastatic capacity,substrate rigidity, and ECM composition. Journal of Cellular Biochemistry 112:
3151–3158.
12. Yamada KM, Cukierman E (2007) Modeling Tissue Morphogenesis and Cancerin 3D. Cell 130: 601–610.
13. Schwartz MP, Fairbanks BD, Rogers RE, Rangarajan R, Zaman MH, et al.
(2010) A synthetic strategy for mimicking the extracellular matrix provides newinsight about tumor cell migration. Integrative Biology 2: 32–40.
14. Harunaga JS, Yamada KM (2011) Cell-matrix adhesions in 3D. Matrix Biology
30: 363–368.
15. Pathak A, Kumar S (2010) Biophysical regulation of tumor cell invasion: moving
beyond matrix stiffness. Integrative Biology 3 267–278.
16. Ohmori T, Yang J-L, Price JO, Arteaga CL (1998) Blockade of Tumor CellTransforming Growth Factor-[beta]s Enhances Cell Cycle Progression and
Sensitizes Human Breast Carcinoma Cells to Cytotoxic Chemotherapy.Experimental Cell Research 245: 350–359.
17. Fischbach C, Chen R, Matsumoto T, Schmelzle T, Brugge JS, et al. (2007)
Engineering tumors with 3D scaffolds. Nat Meth 4: 855–860.
18. Friedrich J, Ebner R, Kunz-Schughart LA (2007) Experimental anti-tumor
therapy in 3-D: spheroids–old hat or new challenge? Int J Radiat Biol 83: 849–
871.
19. Chu JH, Yu S, Hayward SW, Chan FL (2008) Development of a three-
dimensional culture model of prostatic epithelial cells and its use for the study of
epithelial-mesenchymal transition and inhibition of PI3K pathway in prostatecancer. The Prostate 69 428–442.
20. Yeung TM, Gandhi SC, Wilding JL, Muschel R, Bodmer WF (2010) Cancerstem cells from colorectal cancer-derived cell lines. Proceedings of the National
Academy of Sciences 107 3722–3727.
21. Weaver VM, Petersen OW, Wang F, Larabell CA, Briand P, et al. (1997)Reversion of the Malignant Phenotype of Human Breast Cells in Three-
Dimensional Culture and In Vivo by Integrin Blocking Antibodies. The Journal
of Cell Biology 137: 231–245.
22. Lee GY, Kenny PA, Lee EH, Bissell MJ (2007) Three-dimensional culture
models of normal and malignant breast epithelial cells. Nat Meth 4: 359–365.
23. Doillon CJ, Gagnon E, Paradis RE, Koutsilieris M (2004) Three-dimensionalCulture System as a Model for Studying Cancer Cell Invasion Capacity and
Anticancer Drug Sensitivity. Anticancer Research 24: 2169–2178.
24. Hutmacher DW, Loessner D, Rizzi S, Kaplan DL, Mooney DJ, et al. (2010)
Can tissue engineering concepts advance tumor biology research? Trends in
Biotechnology 28: 125–133.
25. Shu XZ, Liu Y, Palumbo F, Prestwich GD (2003) Disulfide-crosslinked
hyaluronan-gelatin hydrogel films: a covalent mimic of the extracellular matrix
for in vitro cell growth. Biomaterials 24: 3825–3834.
26. Liu Y, Shu XZ, Prestwich GD (2007) Tumor Engineering: Orthotopic Cancer
Models in Mice Using Cell-Loaded, Injectable, Cross-Linked Hyaluronan-Derived Hydrogels. Tissue Engineering 13: 1091–1101.
27. Fischbach C, Kong HJ, Hsiong SX, Evangelista MB, Yuen W, et al. (2009)
Cancer cell angiogenic capability is regulated by 3D culture and integrinengagement. Proceedings of the National Academy of Sciences 106: 399–404.
28. Lutolf MP, Hubbell JA (2005) Synthetic biomaterials as instructive extracellular
microenvironments for morphogenesis in tissue engineering. Nat Biotech 23:
47–55.
29. Ehrbar M, Rizzi SC, Schoenmakers RG, San Miguel B, Hubbell JA, et al. (2007)Biomolecular Hydrogels Formed and Degraded via Site-Specific Enzymatic
Reactions. Biomacromolecules 8: 3000–3007.
30. Bott K, Upton Z, Schrobback K, Ehrbar M, Hubbell JA, et al. (2010) The effect
of matrix characteristics on fibroblast proliferation in 3D gels. Biomaterials 31:
8454–8464
31. Loessner D, Stok KS, Lutolf MP, Hutmacher DW, Clements JA, et al. (2010)
Bioengineered 3D platform to explore cell-ECM interactions and drug resistance
of epithelial ovarian cancer cells. Biomaterials 31: 8494–8506.
32. Lutolf MP, Lauer-Fields JL, Schmoekel HG, Metters AT, Weber FE, et al.(2003) Synthetic matrix metalloproteinase-sensitive hydrogels for the conduction
of tissue regeneration: Engineering cell-invasion characteristics. Proceedings of
the National Academy of Sciences 100: 5413–5418.
33. Herrala A, Kurkela R, Vihinen M, Kalkkinen N, Vihko P (1998) Androgen-
sensitive human prostate cancer cells, LNCaP, produce both N-terminallymature and truncated prostate-specific antigen isoforms. European Journal of
Biochemistry 255: 329–335.
34. Pandini G, Mineo R, Frasca F, Roberts CT, Marcelli M, et al. (2005) Androgens
Up-regulate the Insulin-like Growth Factor-I Receptor in Prostate Cancer Cells.
Cancer Research 65: 1849–1857.
35. Schwartz MA (2010) Integrins and Extracellular Matrix in Mechanotransduc-
tion. Cold Spring Harbor Perspectives in Biology 2:a005066.
36. Lutolf MP, Hubbell JA (2003) Synthesis and Physicochemical Characterization
of End-Linked Poly(ethylene glycol)-co-peptide Hydrogels Formed by Michael-Type Addition. Biomacromolecules 4: 713–722.
37. Ramanujan S, Pluen A, McKee TD, Brown EB, Boucher Y, et al. (2002)
Diffusion and Convection in Collagen Gels: Implications for Transport in the
Tumor Interstitium. Biophysical Journal 83: 1650–1660.
38. Erikson A, Andersen HN, Naess SN, Sikorski P, Davies CdL (2008) Physical and
chemical modifications of collagen gels: Impact on diffusion. Biopolymers 89:
135–143.
39. Helmlinger G, Netti PA, Lichtenbeld HC, Melder RJ, Jain RK (1997) Solidstress inhibits the growth of multicellular tumor spheroids. Nat Biotech 15: 778–
783.
40. Koike C, McKee TD, Pluen A, Ramanujan S, Burton K, et al. (2002) Solid
stress facilitates spheroid formation: potential involvement of hyaluronan.
Br J Cancer 86: 947–953.
41. Ballangrud AM, Yang W-H, Dnistrian A, Lampen NM, Sgouros G (1999)
Growth and Characterization of LNCaP Prostate Cancer Cell Spheroids.
Clinical Cancer Research 5: 3171s–3176s.
42. Takagi A, Watanabe M, Ishii Y, Morita J, Hirokawa Y, et al. (2007) Three-dimensional Cellular Spheroid Formation Provides Human Prostate Tumor
Cells with Tissue-like Features. Anticancer Research 27: 45–53.
43. Tuxhorn JA, McAlhany SJ, Dang TD, Ayala GE, Rowley DR (2002) Stromal
Cells Promote Angiogenesis and Growth of Human Prostate Tumors in a
Differential Reactive Stroma (DRS) Xenograft Model. Cancer Research 62:3298–3307.
44. Denmeade SR, Jakobsen CM, Janssen S, Khan SR, Garrett ES, et al. (2003)
Prostate-Specific Antigen-Activated Thapsigargin Prodrug as Targeted Therapy
for Prostate Cancer. Journal of the National Cancer Institute 95: 990–1000.
45. Hensley HH, Hannoun-Levi J-M, Hachem P, Mu Z, Stoyanova R, et al. (2011)
PKA knockdown enhances cell killing in response to radiation and androgen
deprivation. International Journal of Cancer 128: 962–973.
46. Li Y, Ligr M, McCarron JP, Daniels G, Zhang D, et al. (2011) Natura-Alpha
Targets Forkhead Box M1 and Inhibits Androgen-Dependent and -IndependentProstate Cancer Growth and Invasion. Clinical Cancer Research 17: 4414–
4424.
47. Discher DE, Janmey P, Wang Y-l (2005) Tissue Cells Feel and Respond to the
Stiffness of Their Substrate. Science 310: 1139–1143.
48. Zhang XP, Fournier MV, Ware JL, Bissell MJ, Yacoub A, et al. (2009)
Inhibition of vimentin or beta(1) integrin revert morphology of prostate tumor
cells grown in laminin-rich extracellular matrix gels and reduces tumor growth
in vivo. Molecular Cancer Therapeutics 8: 499–508.
49. Harma V, Virtanen J, Makela¤ R, Happonen A, Mpindi J-P, et al. (2010) A
Comprehensive Panel of Three-Dimensional Models for Studies of Prostate
Cancer Growth, Invasion and Drug Responses. PLoS ONE 5: 1–17.
50. Raleigh JA, Miller GG, Franko AJ, Koch CJ, Fuciarelli AF, et al. (1987)
Fluorescence immunohistochemical detection of hypoxic cells in spheroids andtumours. Br J Cancer 56: 395–400.
Characterization of LNCaP Cells Grown in 3D
PLOS ONE | www.plosone.org 15 September 2012 | Volume 7 | Issue 9 | e40217

51. Zhao D, Constantinescu A, Hahn EW, Mason RP (2001) Tumor Oxygen
Dynamics with Respect to Growth and Respiratory Challenge: Investigation ofthe Dunning Prostate R3327-HI Tumor. Radiation Research 156: 510–520.
52. Franovic A, Gunaratnam L, Smith K, Robert I, Patten D, et al. (2007)
Translational up-regulation of the EGFR by tumor hypoxia provides anonmutational explanation for its overexpression in human cancer. Proceedings
of the National Academy of Sciences 104: 13092–13097.53. Jankovic B, Aquino-Parsons C, Raleigh JA, Stanbridge EJ, Durand RE, et al.
(2006) Comparison between pimonidazole binding, oxygen electrode measure-
ments, and expression of endogenous hypoxia markers in cancer of the uterinecervix. Cytometry Part B: Clinical Cytometry 70B: 45–55.
54. Li X-F, O’Donoghue JA (2008) Hypoxia in microscopic tumors. Cancer Letters264: 172–180.
55. Kunz-Schughart LA, Freyer JP, Hofstaedter F, Ebner R (2004) The Use of 3-DCultures for High-Throughput Screening: The Multicellular Spheroid Model.
Journal of Biomolecular Screening 9: 273–285.
56. Taplin M-E, Balk SP (2004) Androgen receptor: A key molecule in theprogression of prostate cancer to hormone independence. Journal of Cellular
Biochemistry 91: 483–190.57. Heinlein CA, Chang C (2004) Androgen Receptor in Prostate Cancer.
Endocrine Reviews 25: 276–308.
58. Tindall D, Lonergan P (2011) Androgen receptor signaling in prostate cancerdevelopment and progression. Journal of Carcinogenesis 10: 20–20.
59. Syms AJ, Norris JS, Panko WB, Smith RG (1985) Mechanism of androgen-receptor augmentation. Analysis of receptor synthesis and degradation by the
density-shift technique. The Journal of Biological Chemistry 260: 455–461.60. Yeap BB, Krueger RG, Leedman PJ (1999) Differential Posttranscriptional
Regulation of Androgen Receptor Gene Expression by Androgen in Prostate
and Breast Cancer Cells. Endocrinology 140: 3282–3291.61. Locke JA, Guns ES, Lubik AA, Adomat HH, Hendy SC, et al. (2008) Androgen
Levels Increase by Intratumoral De novo Steroidogenesis during Progression ofCastration-Resistant Prostate Cancer. Cancer Res 68: 6407–6415.
62. Lubik AA, Gunter JH, Hendy SC, Locke JA, Adomat HH, et al. (2011) Insulin
Increases De Novo Steroidogenesis in Prostate Cancer Cells. Cancer Research71: 5754–5764.
63. Horning JL, Sahoo SK, Vijayaraghavalu S, Dimitrijevic S, Vasir JK, et al. (2008)3-D Tumor Model for In Vitro Evaluation of Anticancer Drugs. Molecular
Pharmaceutics 5: 849–862.64. Hakkinen KM, Harunaga JS, Doyle AD, Yamada KM (2010) Direct
Comparisons of the Morphology, Migration, Cell Adhesions, and Actin
Cytoskeleton of Fibroblasts in Four Different Three-dimensional ExtracellularMatrices. Tissue Eng Part A 17: 713–724.
65. Li S, Lao J, Chen BPC, Li Y-S, Zhao Y, et al. (2003) Genomic analysis ofsmooth muscle cells in 3-dimensional collagen matrix. The FASEB Journal 17:
97–99.
66. Wells RG (2008) The role of matrix stiffness in regulating cell behavior.Hepatology 47: 1394–1400.
67. Lin R-Z, Chang H-Y (2008) Recent advances in three-dimensional multicellularspheroid culture for biomedical research. Biotechnology Journal 3: 1172–1184.
68. Hirschhaeuser F, Menne H, Dittfeld C, West J, Mueller-Klieser W, et al. (2010)Multicellular tumor spheroids: An underestimated tool is catching up again.
Journal of Biotechnology 148: 3–15.
69. Cheng G, Tse J, Jain RK, Munn LL (2009) Micro-environmental mechanicalstress controls tumor spheroid size and morphology by suppressing proliferation
and inducing apoptosis in cancer cells. PLoS One 4: e4632.70. Sutherland R (1988) Cell and environment interactions in tumor microregions:
the multicell spheroid model. Science 240: 177–184.
71. Butterworth KT, McCarthy HO, Devlin A, Ming L, Robson T, et al. (2008)Hypoxia selects for androgen independent LNCaP cells with a more malignant
geno- and phenotype. International Journal of Cancer 123: 760–768.72. Rehfeldt F, Engler AJ, Eckhardt A, Ahmed F, Discher DE (2007) Cell responses
to the mechanochemical microenvironment–Implications for regenerative
medicine and drug delivery. Advanced Drug Delivery Reviews 59: 1329–1339.
73. Chou SC, Azuma Y, Varia MA, Raleigh JA (2004) Evidence that involucrin, amarker for differentiation, is oxygen regulated in human squamous cell
carcinomas. Br J Cancer 90: 728–735.
74. Tupper J, Greco O, Tozer GM, Dachs GU (2004) Analysis of the horseradishperoxidase//indole-3-acetic acid combination in a three-dimensional tumor
model. Cancer Gene Ther 11: 508–513.
75. Schafer ZT, Grassian AR, Song L, Jiang Z, Gerhart-Hines Z, et al. (2009)Antioxidant and oncogene rescue of metabolic defects caused by loss of matrix
attachment. Nature 461: 109–113.
76. Movsas B, Chapman JD, Hanlon AL, Horwitz EM, Pinover WH, et al. (2001)Hypoxia in human prostate carcinoma - An Eppendorf Po-2 study. American
Journal of Clinical Oncology-Cancer Clinical Trials 24: 458–461.
77. Parker C, Milosevic M, Toi A, Sweet J, Panzarella T, et al. (2004) Polarographicelectrode study of tumor oxygenation in clinically localized prostate cancer.
International Journal of Radiation Oncology*Biology*Physics 58: 750–757.
78. Vaupel P, Mayer A (2007) Hypoxia in cancer: significance and impact on
clinical outcome. Cancer and Metastasis Reviews 26: 225–239.
79. Anderson ARA, Weaver AM, Cummings PT, Quaranta V (2006) TumorMorphology and Phenotypic Evolution Driven by Selective Pressure from the
Microenvironment. Cell 127: 905–915.
80. Rorth P (2009) Collective Cell Migration. Annual Review of Cell andDevelopment 25: 407–429.
81. Friedl P, Gilmour D (2009) Collective cell migration in morphogenesis,
regeneration and cancer. Nat Rev Mol Cell Biol 10: 445–457.
82. Quaranta V, Rejniak KA, Gerlee P, Anderson ARA (2008) Invasion emerges
from cancer cell adaptation to competitive microenvironments: Quantitative
predictions from multiscale mathematical models. Seminars in Cancer Biology18: 338–348.
83. Kesler CT, Gioeli D, Conaway MR, Weber MJ, Paschal BM (2007) Subcellular
Localization Modulates Activation Function 1 Domain Phosphorylation in theAndrogen Receptor. Molecular Endocrinology 21: 2071–2084.
84. Zhang J, Xiang J-Q, Zhang Y-W, Chen Y-Y, Zhou X-Y, et al. (2007) CellAdhesion Regulates Expression of the Androgen Receptor and Coregulators in
Different Prostate Cancer Cells. International Journal of Molecular Sciences 8:
156–165.
85. Park S-Y, Kim Y-J, Gao AC, Mohler JL, Onate SA, et al. (2006) Hypoxia
Increases Androgen Receptor Activity in Prostate Cancer Cells. Cancer
Research 66: 5121–5129.
86. Mitani T, Yamaji R, Higashimura Y, Harada N, Nakano Y, et al. (2011)
Hypoxia enhances transcriptional activity of androgen receptor through
hypoxia-inducible factor-1a in a low androgen environment. Journal of SteroidBiochemistry and Molecular Biology 123: 58–64.
87. Lamb LE, Zarif JC, Miranti CK (2011) The Androgen Receptor Induces
Integrin a6b1 to Promote Prostate Tumor Cell Survival via NF-kB and Bcl-xLIndependently of PI3K Signaling. Cancer Research 71: 2739–2749.
88. Khandrika L, Lieberman R, Koul S, Kumar B, Maroni P, et al. (2009) Hypoxia-
associated p38 mitogen-activated protein kinase-mediated androgen receptoractivation and increased HIF-1[alpha] levels contribute to emergence of an
aggressive phenotype in prostate cancer. Oncogene 28: 1248–1260.
89. Sayeed A, Alam N, Trerotola M, Languino LR (2012) Insulin-like growth factor1 stimulation of androgen receptor activity requires b1A integrins. Journal of
Cellular Physiology 227: 751–758.
90. Ehrbar M, Rizzi SC, Hlushchuk R, Djonov V, Zisch AH, et al. (2007)
Enzymatic formation of modular cell-instructive fibrin analogs for tissue
engineering. Biomaterials 28: 3856–3866.
91. Quent VMC, Loessner D, Friis T, Reichert JC, Hutmacher DW (2010)
Discrepancies between metabolic activity and DNA content as tool to assess cell
proliferation in cancer research. Journal of Cellular and Molecular Medicine 14:1003–1013.
92. Sieh S, Lubik AA, Clements JA, Nelson CC, Hutmacher DW (2010) Interactions
between human osteoblasts and prostate cancer cells in a novel 3D in vitromodel. Organogenesis 6: 181–188.
Characterization of LNCaP Cells Grown in 3D
PLOS ONE | www.plosone.org 16 September 2012 | Volume 7 | Issue 9 | e40217